Essay

Genetic Diversity and Core Germplasm Research of 144 Munake Grape Resources Using 22 Pairs of SSR Markers

1
State Key Laboratory of Desert and Oasis Ecology, Key Laboratory of Ecological Safety and Sustainable Development in Arid Lands, Xinjiang Institute of Ecology and Geography, Chinese Academy of Sciences, Urumqi 830011, China
2
College of Life Sciences, Shihezi University, Shihezi 832003, China
3
Institute of Horticulture Crops, Xinjiang Academy of Agricultural Sciences, Urumqi 830091, China
4
Turpan Eremophytes Botanic Garden, Xinjiang Institute of Ecology and Geography, Chinese Academy of Sciences, Urumqi 830011, China
*
Authors to whom correspondence should be addressed.
Horticulturae 2023, 9(8), 917; https://doi.org/10.3390/horticulturae9080917
Submission received: 12 July 2023 / Revised: 9 August 2023 / Accepted: 9 August 2023 / Published: 11 August 2023
(This article belongs to the Section Viticulture)

Abstract

:
The Munake grape is a local variety of grape that is widely distributed in Xinjiang, China. This study aims to clarify the genetic structure of the Munake grape population, characterize genetic differentiation and gene flow among populations, gather germplasm, and establish the core germplasm collection. In total, 144 samples were collected from eight geographic populations. Twenty-two SSR markers were used to characterize the genetic diversity as well as the genetic structure of Munake grape germplasm and to establish the core germplasm collection. At each site, the average number of effective alleles (Ne) was 5.019. Overall, genetic diversity was high in the various geographic populations of Munake grapes. Polymorphic information content (PIC) ranged from 0.501 to 0.908, with an average of 0.728. Estimates of genetic differentiation and gene flow indicated that the Artux population had significant genetic differences from the other populations. Screening results indicated that a sampling proportion of 95% of the sample was required to achieve 100% allelic coverage, or a sampling proportion of 65% for 95% allelic coverage. This analysis was based on conventional genetic diversity indicators, with a core germplasm diversity index of 95% coverage. Characterization of the genetic diversity of germplasm from 144 Munake grapes not only provides valuable resources for future genetic mapping and functional genome research, but also facilitates the utilization of core germplasm and molecular breeding of Munake grapes.

1. Introduction

Germplasm collections aim to represent the total genetic variation of cultivated plants, their wild relatives, and unique plants in a local region. They play an important strategic role in the conservation of plant diversity. A core collection is a subset of the larger germplasm resources that maximally represents the genetic diversity of a particular species and its wild relatives with minimal redundancy. Core collections are useful tools for organizing and analyzing representative sets of genotypes from germplasm resources and can be defined according to multiple criteria, including assessment using explicit molecular markers. The core collection should not be considered a substitute for the greater germplasm collection from which it is derived, which encompasses the complete diversity of the cultivated plant and its wild relatives. Thus, a core collection should correspond to the set representing all the alleles in a species while guaranteeing minimal redundancy of alleles and high reproducibility of entries.
Both phenotypic and genotypic data can be used to establish the core set. Utilization of phenotypic traits is relatively simple and intuitive, but this approach has the disadvantage that it is affected by environmental factors, and thus phenotypic traits are not always stable. In contrast, the data obtained using molecular markers are more reliable and can better reflect the genetic differences of germplasm. Molecular markers were chosen as a development tool for the core collection of the germplasm. This approach ensures that the core collection reflects the genetic diversity of the complete collection without complications arising from incomplete provenance and environmental interactions while also making up for deficiencies in morphological identification.
Grapes (Vitis vinifera L.) are a very important and ancient cash crop. There are more than 16,000 grape varieties worldwide, of which more than 3000 have been included in China’s germplasm resource nursery. Grape cultivation is mainly distributed in tropical, subtropical, and temperate regions. About 90% of the world’s grapes are concentrated in the northern hemisphere. The Munake grape, a variety of table grape, is distributed widely only in Xinjiang, China. Within Xinjiang, Artux contains the largest planted area of Munake grapes. The unique natural environment there provides ideal conditions for the growth and development of Munake grapes. This variety is rich in germplasm resources, but due to the lack of systematic and standardized management of these germplasm resources, it has proven difficult to identify ideal hybrid combinations to breed optimal varieties. It has also been difficult to quickly identify the characteristics of new varieties after the introduction of exotic varieties. Furthermore, some germplasm names can be confused with each other, and thus the collected germplasm can be misidentified, which hinders the identification, development, evaluation, and utilization of Munake grape germplasm. Therefore, a focused identification germplasm strategy (FIGS) is urgently required. This would ensure the purity of the current variety as well as novel unique germplasm in the reproductive process, thus protecting both the complete Munake grape germplasm and its core collection and facilitating achievement of various breeding goals.
Several analyses of grape germplasm using various molecular markers have been reported. For example, D’Onofrio et al. studied 29 Vitis genotypes using inter-retrotransposon amplified polymorphism (IRAP), retrotransposon-microsatellite amplified polymorphism (REMAP), and sequence-specific amplified polymorphism (SSAP) techniques [1]. In addition, a core collection of 70 grapevine rootstocks, a grape variety not commonly used for breeding, was genotyped using the 18 k SNP genotyping array [2].
SSRs (simple sequence repeats) are molecular markers based on DNA length polymorphisms and have been effective tools for population genetics research [3] and the construction of primary genetic linkage maps. SSRs, also known as microsatellite sequences, are commonly used by researchers to study problems in genetics and breeding. SSRs are a class of tandem repeat sequences, with the repeat unit typically a few nucleotides in length (generally 1–6), although they can be up to tens of nucleotides long [4]. They can be widely distributed in the genomes of eukaryotic organisms. These sequences can differ between individuals, and site polymorphisms can emerge due to these differences. SSRs used as molecular markers need to be flanked by conserved sequences for which specific primers can be designed. High degrees of polymorphism, large amounts of information, easy PCR detection, and distributions throughout entire genomes are all advantages of SSR markers, which are widely used in genetic research and have become one of the most popular molecular marker methods [5]. There have been several studies of grape germplasm based on SSR markers. Goto-Yammoto et al. [6] characterized the relationships among wild grape varieties and genotyped them using eight SSR loci. Thirty SSR analyses were performed on 62 materials containing 38 native grape varieties to assess their genetic diversity and obtain a complete genome map [7]. Thus, SSR markers have proven to be effective and handy tools for analyzing the genetic structure and establishing a valid core germplasm for grapes.
Sixty-one grape varieties from China and 33 grape varieties from abroad were previously compared using nine SSR molecular marker pairs by Li et al., which showed that the Munake and Lvmunage varieties were the same [8]. The Munake cultivars belong to the Eastern cultivars group. The complete genome of the Munake variety was also sequenced, and more than 80,000 SSR markers were identified [9]. Forty-four SSR sites were randomly selected for PCR verification. This analysis indicated that SSR pairs could be used to effectively genotype Munake grape cultivars. However, the origin of the breed has yet to be characterized. Further, up till now, there have been no reasonable Munake germplasm data based on appropriate molecular labeling techniques, which could be utilized to not only screen out the core germplasm for collection and protection but also characterize changes in its genetic structure and genetic diversity. This would be of great significance for the protection, development, and utilization of the Munake variety.
In this study, genetic diversity across 144 accessions of Munake grape was analyzed using 22 SSR markers, which were selected based on the re-sequencing data of the whole genome of this cultivar. Analysis of these markers provided information on the genetic relationships among different geographic populations of germplasm resources as well as the genetic background. In order to reduce the genetic redundancy of Munake grape resources, we also identified a core set of Munake grape germplasm resources. This germplasm will provide excellent breeding materials as well as theoretical and technical support for accelerating the breeding process, creation of new germplasm, and future-oriented breeding goals of Munake grape germplasm in Xinjiang.

2. Materials and Methods

2.1. Plant Materials

A total of 144 cultivated Munake grape germplasm samples were collected from different localities within Xinjiang, with most of them originating from Artux in southern Xinjiang. During sample processing, at least 10 leaves were collected from each individual plant. The leaves were then dried in silica gel and ground in liquid nitrogen, and DNA was extracted for use as a template for polymerase chain reaction (PCR) amplification. Sampling sites for the 144 grape samples are detailed in Table 1 and Figure 1.

2.2. DNA Extraction and Genotyping

Total genomic DNA was extracted from young leaf tissues using the Cetyl Tri-methyl Ammonium Bromide (CTAB) method. The DNA was quantitatively analyzed using 1% agarose gel electrophoresis. DNA samples were genotyped using a group of 22 SSR markers (Table 2), of which 15 were universal primers and seven were primers specific to Munake grapes. Both forward and reverse primers were commercially synthesized. PCR amplification was performed in 25 μL reaction mixtures containing 0.5 μL (20 ng/μL) of template DNA, 12.5 μL (5 U/µL) of Premix Taq TM, 1 μL (10 µmol/L) of forward primer, 1 μL (10 µmol/L) of reverse primer, and 10 μL of ddH2O.
PCR reactions were performed in a thermocycler with a single denaturation step for 5 min at 93 °C, followed by 30 cycles of denaturation at 94 °C for 30 s, annealing for 30 s at temperatures based on specific Tm values for each primer set, and extension for 90 s at 65 °C, with a final extension for 5 min at 65 °C. PCR products were detected using 6-carboxyfluorescein (FAM) and an automatic fluorescence sequence analyzer. The amplified fragment sizes of different samples at each SSR locus were analyzed using Genemapper version 3.0 software.

2.3. Data Analysis

Measures of genetic diversity using SSR markers, including major allele frequency (MAF), gene diversity (GD), Shannon index (I), gene flow (Nm), and genetic distance of Nei [10], were calculated using POPGENE32 version 1.32 [11]. The average effective number of alleles (Ne) and frequency of alleles (Freq ≤ 5) for each grape group defined by geography and breeding were calculated using GenAlEx v6.5 [12]. The genetic correlation was analyzed using NTSYS-PC v2.10e software [13], and the analysis of this index was determined by estimating the similarity index of dice. Cluster analysis was performed using the unweighted pair group method with arithmetic mean (UPGMA) algorithm [14].
Inferences of the genetic structure of SSR loci data were carried out using STRUCTURE 2.3.4 [14]. The resulting output from STRUCTURE was visualized using STRUCTURE HARVESTER version 0.6, which sets the number of options (K) for the cluster from 1 to 10, executes STRUCTURE ten times, and detects the number of individual clusters using the Evanno method.

3. Results

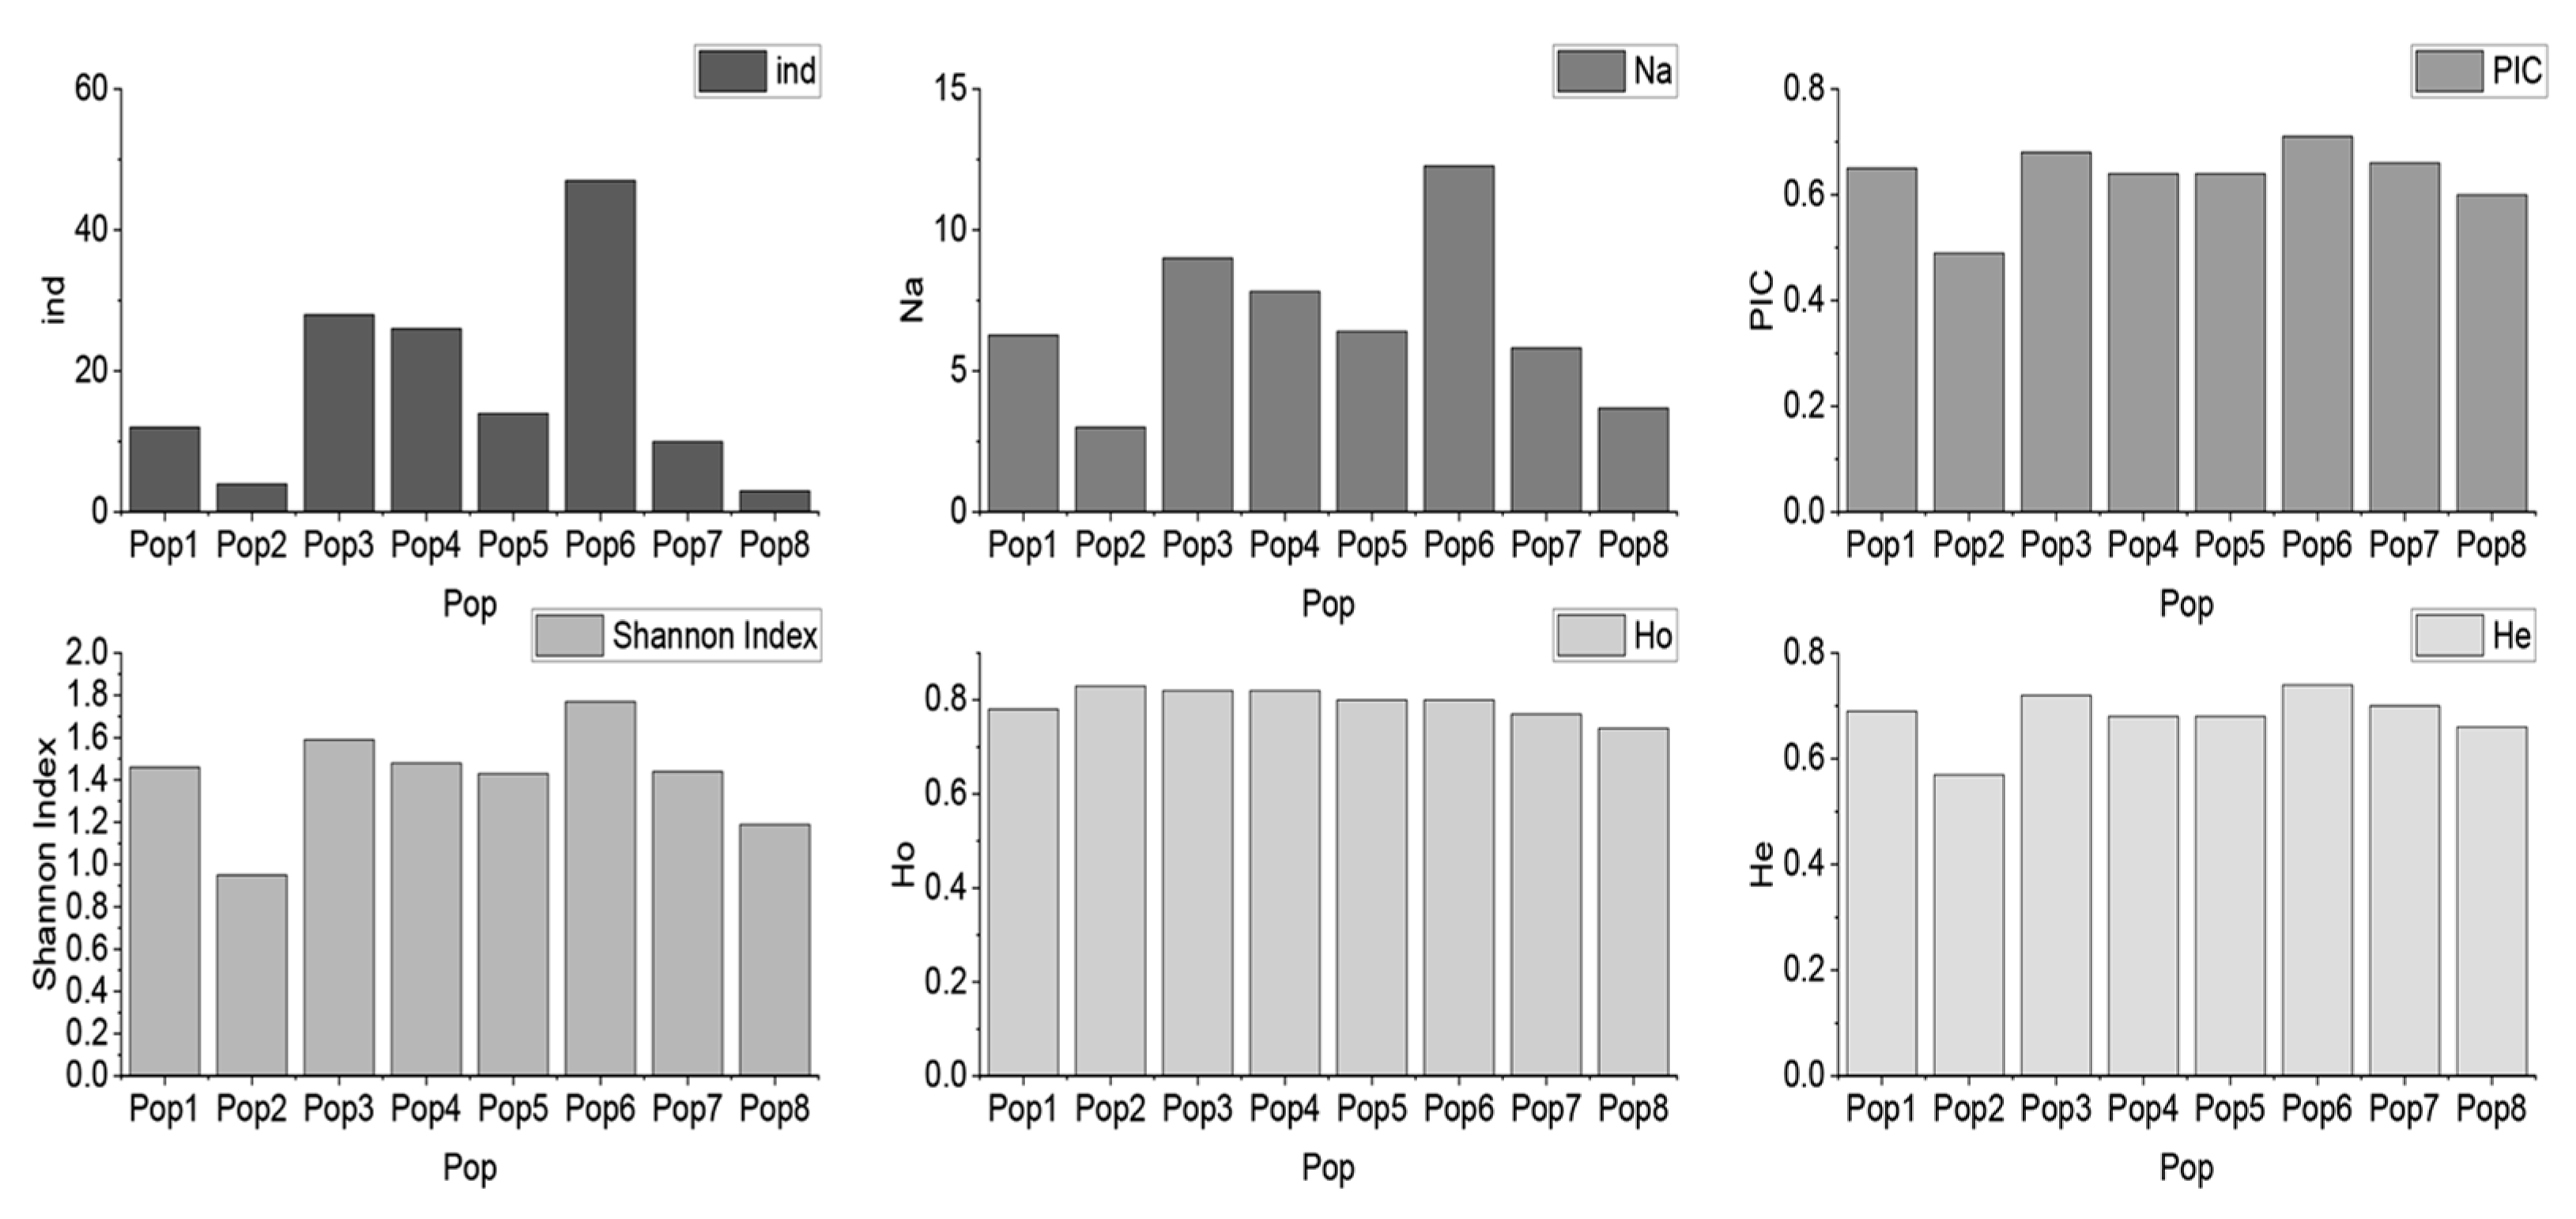
3.1. Genetic Diversity

The genetic variation among the 144 samples of Munake grape was estimated using 22 SSR loci. Across all samples, a total of 369 alleles were identified, of which 110 were validated. Ne ranged between 1.432 (Vchr16a) and 7.242 (T8), with a mean value of 3.773, indicating that there were loci with relatively high Ne values (VVIP31, T5, VVMD7). The Shannon information index (I values) ranged from 0.539 to 2.072, with a mean of 1.412. The expected heterozygosity (He) ranged from 0.273 (Vchr16a) to 0.842 (T8), with a mean of 0.680. The He was higher than 0.5 for all markers except Vchr16a (Table 2). Polymorphic information content (PIC) ranged from 0.501 to 0.908, with a mean of 0.728. SSR loci with a PIC value greater than 0.5 were classified as loci with high polymorphic information content. Among the 22 markers, nine (40.9%) were highly polymorphic, with PIC values greater than 0.75. Of the 22 pairs of SSR primers used, 15 were universal and 7 were specific to Munake grapes. The chromosomal positions of the Munake grape-specific primers are shown in Figure 2.

3.2. Genetic Differentiation and Gene Flow

The genetic differentiation among populations was estimated using fixation indices (FIS, FIT, and FST) for each locus. The coefficients of inbreeding (FIS) at the 22 SSR loci ranged between −0.751 and 0.665, and the overall fixation indexes (FIT) of the population ranged from −0.735 to 0.691. The fixation indexes (FST) were between 0.009 and 0.091. Estimates of gene flow (Nm) were between 2.511 and 26.724. The VVMD5 locus exhibited the highest degree of gene exchange (Nm > 5), with all other loci having Nm values greater than 1. Overall, the average size of gene flow between each site was 6.419 (Figure 3).
The genetic differentiation indexes (FST) among the eight geographical populations of Munake grape ranged between 0.009 and 0.078. Among these, the genetic differentiation between populations in Kashgar and Hotan was the lowest (FST = 0.015), while the genetic differentiation between populations in Artux and the town of Utuprague was the highest (FST = 0.078) (Figure 3). The coefficient of genetic differentiation between populations was inversely proportional to the gene flow. Hence, the gene flow among populations in Kashgar and Hotan was the largest, whereas the gene flow between populations in Artux and other regions was the smallest. Thus, there is strong evidence of significant genetic differentiation between the Artux population and other populations. However, this genetic differentiation is not very noticeable among most other populations.

3.3. Genetic Distance and Cluster Structure

Nei’s cluster analysis of the geographic populations of Munake grapes was performed using MEGA7 v2.0 software. The eight Munake grape populations were categorized into two groups with a genetic similarity coefficient of 0.14. One group was the population in Southern Xinjiang, and the second group comprised the other populations. The first group was divided into the Kashgar population and other populations in southern Xinjiang with a similarity coefficient of 0.05. PCoA based on the genetic distance matrix indicated that the contribution rates of SSR variation in the first, second, and third axes were 11.78%, 19.90%, and 26.56%, respectively. Using Bayesian clustering, similar genetic structures were observed in the eight populations of Munake grapes in Xinjiang. After analyzing the dataset, we found a high degree of overlap in the PCoA (Figure 4) scatter plot.

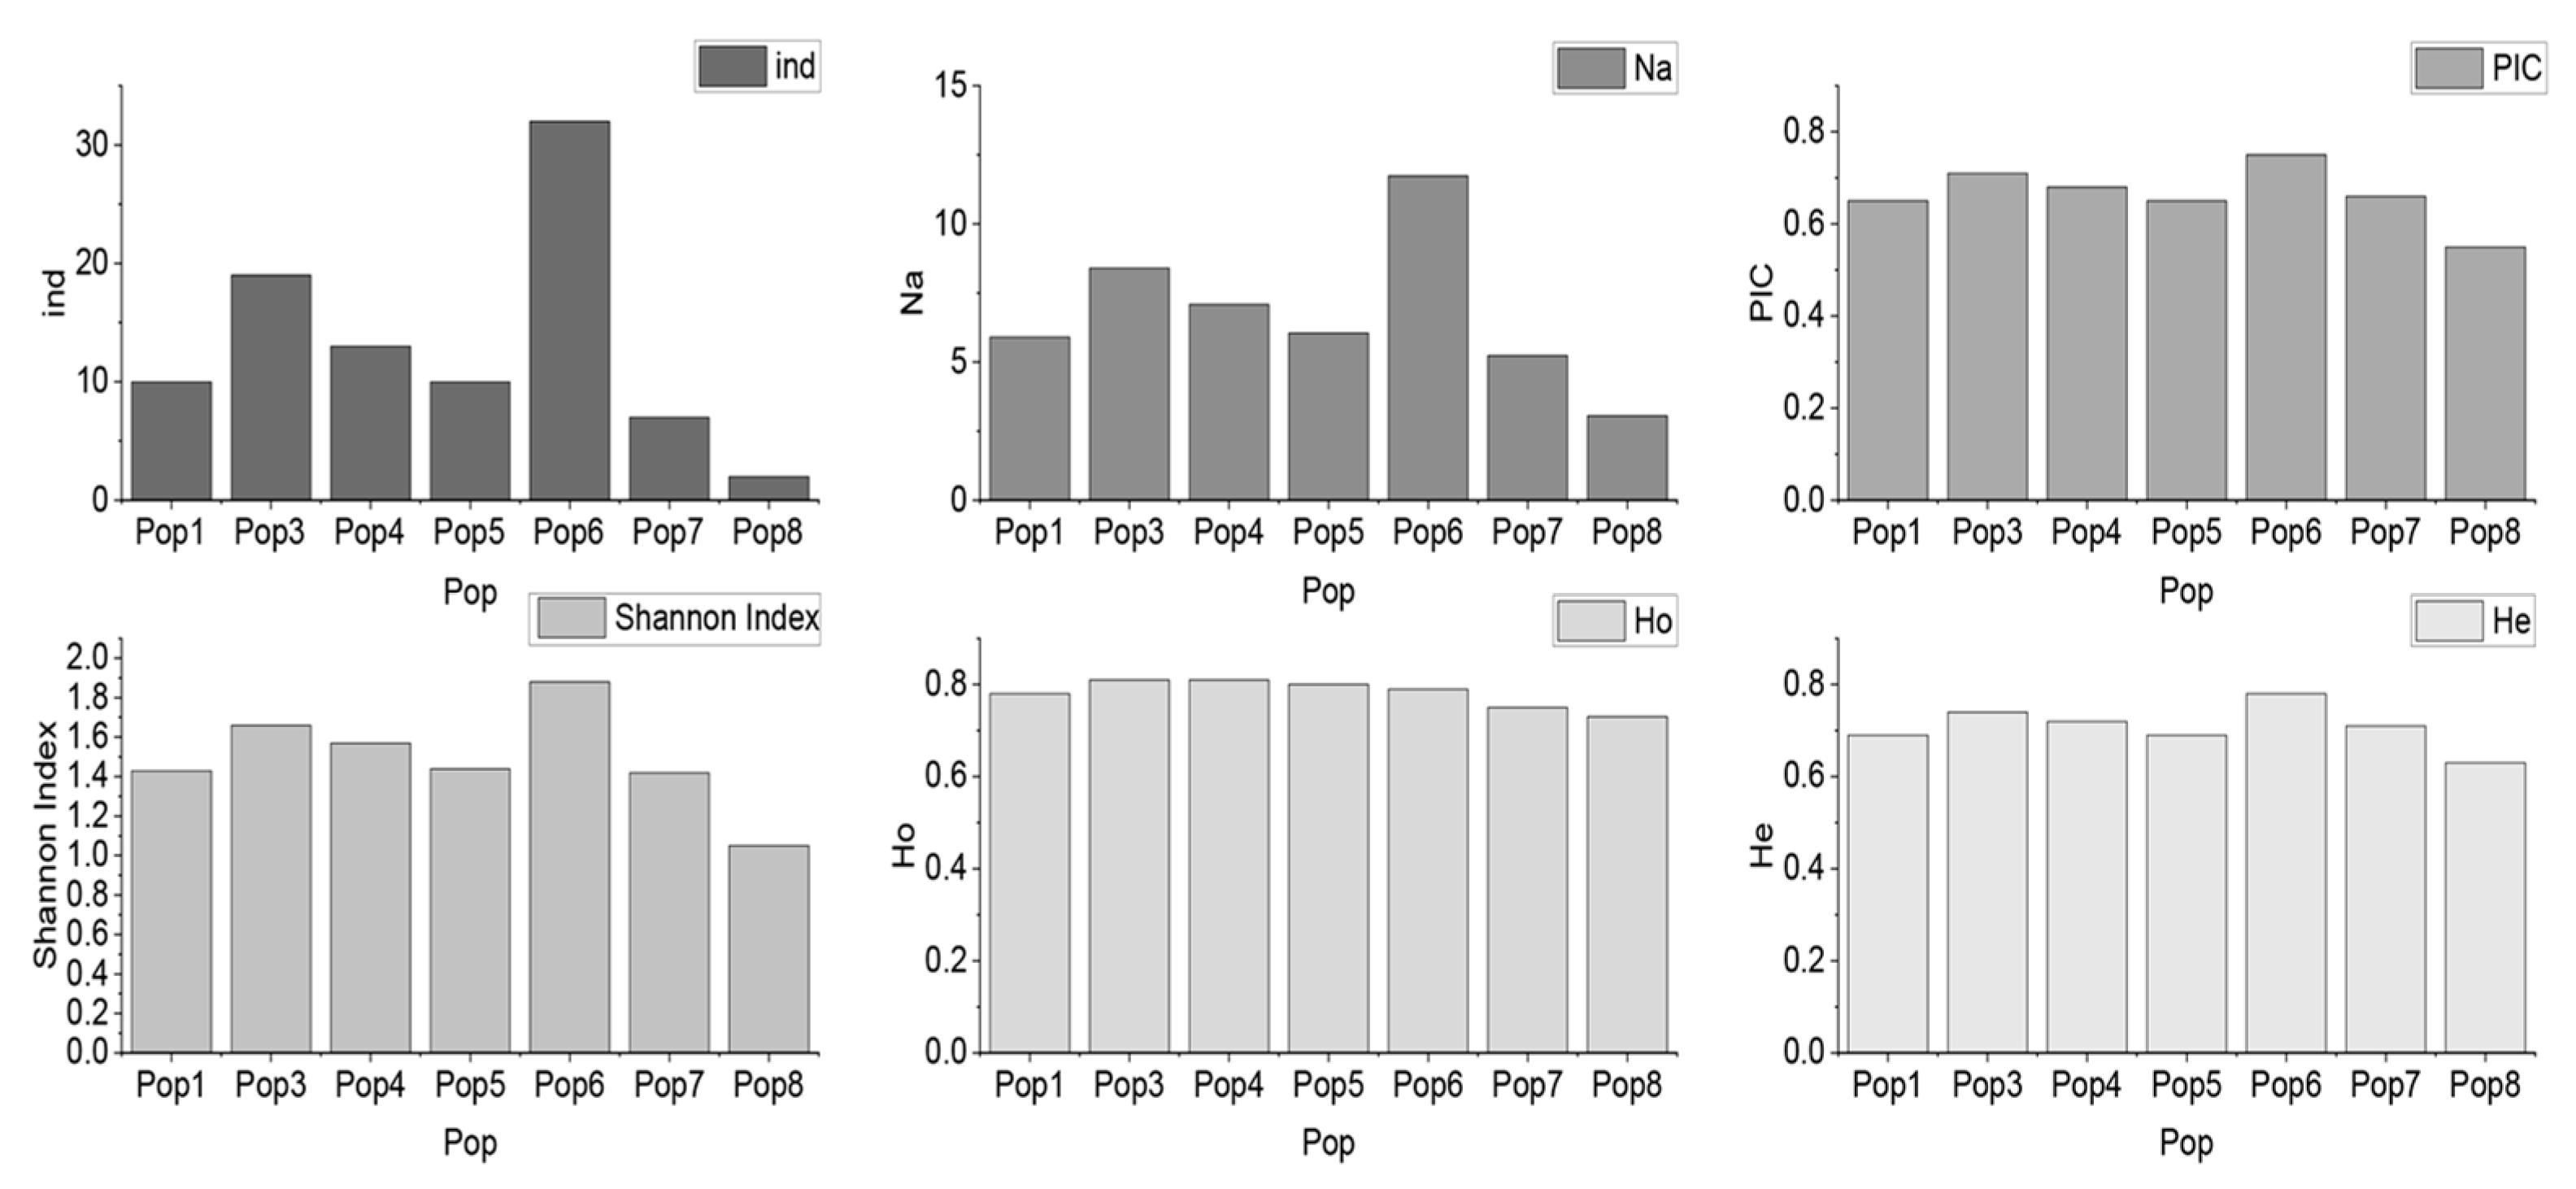
3.4. Construction of the Core Collection

A core germplasm collection represents the greatest range of genetic diversity in morphological characters, geographic distribution, genes, and genotypes of a particular cultivated species and its closely related wild relatives. It is of great academic and practical importance for facilitating germplasm exchange, utilization, and gene bank management. Core Hunter II can be used to construct core germplasm or micro-core germplasm by extracting a diverse and representative subset of germplasm resources with minimal redundancy from a larger set of germplasm resources. Based on genetic variation marker (SNP or SSR) data and weighted by a combination of multiple assessment measures, the material is screened for high diversity, representativeness, and allelic richness.
A core collection for Munake grapes was constructed using Core Hunter II v2.0 software, combining the weighted index modified Roger’s distance (0.7) and Shannon Diversity Index (0.3) for screening according to the total germplasm resource ratio of 0.1, 0.2, 0.3, 0.4, 0.5, 0.6, 0.7, 0.8, and 0.9 gradients. The screening materials were also evaluated for coverage (CV). These results are presented in Table 3.
A sampling percentage of 95% would be required to achieve 100% allele coverage (Figure 5). If 95% allele coverage is needed, a 65% sampling percentage would be required.
Genetic diversity refers to the range of genetic differences within a species, and genetic variation can occur both between species and within populations of the same species. The individuals in a population usually do not have identical genotypes; the population is made up of individuals with different genetic variants. By analyzing the genetic diversity of the population, we can understand the evolutionary processes that influenced the species (e.g., origin time, evolutionary mechanisms) and further understand its evolutionary potential. Therefore, the study of genetic diversity has always been an important issue in conservation biology.
The present analysis was based on conventional genetic diversity indicators: observed heterozygosity, expected heterozygosity, Shannon−Wiener index, and polymorphism information content (PIC) for all materials as well as core germplasm of different gradients. These results are presented in Table 4 and Figure 6, Table 5, and Figure 7.
Pop 1: Korla population. Pop 2: Artoush area populations. Pop 3: Kashgar population. Pop 4: Artux population. Pop 5: Ruoqiang region population. Pop 6: Hotan region population. Pop 7: Qiemo population. Pop 8: The town of Utuprague population.

3.5. Principal Component Analysis Evaluation

Principal component analysis (PCA) is a dimensionality reduction method that is used to analyze large datasets by transforming a large number of variables into a smaller number of variables, called principal components, thus making the dataset easier to interpret. In population genetics, PCA can be used to characterize the extent of genetic differences among multiple populations, with genetically similar populations clustering together. Here, the glPca module in adegenet was used for PCA and sample clustering.
The accuracy of germplasm screening was assessed using PCA of all germplasm materials and the screened core germplasm materials. In principle, similar clustering in the PCA plots of both all germplasm materials and the core germplasm materials would validate the screening of the core germplasm collection. As can be seen from the PCA plots, the distribution of the core germplasm samples is similar to the distribution of all germplasm materials. This suggests that the core germplasm has effectively retained the genetic structure of the original germplasm, thus further validating the representativeness of these materials.
Analysis of eight groups based on SSR genetic distances. Different colors represent different study populations. Pop 1: Korla population. Pop 2: Artoush area populations. Pop 3: Kashgar population. Pop 4: Artux population. Pop 5: Ruoqiang region population. Pop 6: Hotan region population. Pop 7: Qiemo population. Pop 8: The town of Utuprague population (Figure 8).
Although these eight populations are all from the same species, natural selection and interlocal gene flow have led to different degrees of genetic differentiation among the Munake grapes in these areas. Among them, populations seven and six show large overlap, as do populations three and six, indicating relatively high genetic similarity (Figure 9).

4. Discussion

Among the numerous types of DNA markers, SSR markers have many advantages. SSRs are highly polymorphic, display co-dominant genetic patterns, and are relatively simple for data processing [15]. In this project, we selected 22 SSR molecular markers commonly used in the genetic analysis of grapes for identification of germplasm resources of different varieties of Munake grapes [15,16,17,18,19,20,21,22].
The results obtained in this study are similar to those obtained in previous studies [23,24,25]. Zhong et al. [26] previously conducted an experimental study with only 12 SSR loci. They collected 57 samples of Munake grapes in Xinjiang, finding an average of 14 alleles at each locus, a slightly lower number than found in this work (Table 3). The discrepancy between these two results may lie in the different geographic locations from which samples were collected, the different sizes of the samples, and the heterogeneity of the samples on the one hand, or an abundance of low-frequency alleles in the larger dataset here on the other [27]. After analysis, we found a high level of genetic differentiation among Munake grape varieties, as there were a large number of alleles at each locus. This result may be due to the difference in classification amplitude during the classification of germplasm resources or the increase in the presence of low-frequency alleles in large sample sets [28]. Some grape varieties have a wide range, a phenomenon that may lead to an increase in the number of alleles [29]. The average number of effective alleles was 5.019, indicating a high degree of variability and a relatively uneven distribution of alleles in the population. The Shannon index of eight loci was significantly higher than two. This differs from the findings of Zhong et al. [26], who reported and used the same set of SSRs in their Munake grape cultivar study.
All grapevine cultivars are highly heterozygous, suggesting an origin from cross-pollination [30]. The reason for this phenomenon may be the result of human directional selection, which greatly increases the levels of homozygosity in harvested grapes. If mutation causes the primers to fail to bind to the target region, null alleles are produced [31]. The expected heterozygosity of expressed gene diversity was 0.680 on average. This is also higher than the Munake grape local variety (0.424) as reported by Zhong et al. [26]. The high proportion of heterozygotes at these sites indicates high variability in the samples [32].
PIC is an important tool in genetic studies that can indicate a population’s ability to segregate and aid in population identification and parentage testing. PIC values can directly reflect polymorphisms in markers in the investigated populations [33,34,35,36,37,38] and the ability of the SSR markers to differentiate between genotypes in the collected samples. Thus, PIC values effectively represent the genetic differences among the analyzed samples. Based on the PIC values estimated here, we conclude that the loci used are polymorphic [39,40,41,42]. The higher the value, the higher the recognition rate of SSR molecular markers [43,44]. The mean PIC value obtained in this study was higher than that (0.492) reported by Zhong et al. [9]. Therefore, the large number of alleles obtained from 22 SSR loci had a positive effect on PIC. A negative value of F indicates excess heterozygosity, while an F value greater than 0 indicates excess homozygosity. In a natural population, if hybridization is random, then a fixed index tends to zero. Our previous study found that grapes possess a strong inbreeding capacity and that the species is limited to some extent, such as by the size of the breeding scale. In general, we found more alleles, higher heterozygosity levels, and lower inbreeding numbers at each site, all of which point to greater genetic diversity [44,45,46].
In this study, the Core Hunter II software package was applied to construct a core set of 93 core accessions that is representative of our collection of Munake grape germplasm. When these samples were screened, heterozygosity estimates obtained from the 65% screening rate showed no significant differences from those of the screened germplasm. This indicates that the 65% screening rate can be used as a criterion for screening core germplasm. Increasing yields and improvement of commercial quality by enhancing resistance to pests and diseases are two important breeding objectives, and the construction of core germplasm resources for Munake grapes will be an important contribution to resource utilization, conservation of biodiversity, and the breeding of disease-resistant varieties. Therefore, the core germplasm resources in this study will be important for the further research and development of the Munake grape.

5. Conclusions

At present, analyses of the germplasm resources of the Munake grape have been quite rare. This study is a representative study on the genetic diversity and germplasm re-sources from 144 samples of Munake grapes from eight geographic populations in Xin-jiang. Moreover, this study was the first to report genetic differentiation, gene flow, and genetic distances of Munake grape germplasm using SSR molecular markers, resulting in the characterization of the structure of eight geographic populations in Xinjiang. Under-standing the origin and distribution of Munake grape germplasm is very useful. The molecular data in this study can provide an extensive and reliable data source for the construction of the Munake grape germplasm bank. On this basis, the selection and collection of the core germplasm of Munake grapes can offer valuable sources for formulating breeding strategies for maintaining genetic diversity.

Author Contributions

W.S., J.W. and X.W. (Xinyu Wu) conceived and designed the experiments. X.W. (Xiyong Wang), H.Z. and F.Z. provided technical guidance. S.L. performed the experiments. S.L. wrote the manuscript. All authors have read and agreed to the published version of the manuscript.

Funding

This work was supported by Wei Shi (China) through the West Light Foundation of the Chinese Academy of Sciences (2021-XBQNXZ-013) and Tian Shan Youth-Excellence Youth Project (No. 2018Q037) funds project, and Xin-yu Wu (China) through the basic scientific research funding project of autonomous region public welfare scientific research institutes (KY2021122), the central government guides local science and technology development special fund projects (2022), and the China Agriculture Research System of MOF and MARA.

Institutional Review Board Statement

Not applicable.

Informed Consent Statement

Not applicable.

Data Availability Statement

Data are contained within the article.

Acknowledgments

We thank the Horticultural Crops Institute of Xinjiang Academy of Agricultural Sciences and various regional botanical gardens for sampling support during the progress of this project.

Conflicts of Interest

The authors declare no conflict of interest.

References

  1. D’Onofrio, C.; de Lorenzis, G.; Giordani, T.; Natali, L.; Cavallini, A.; Scalabrelli, G. Retrotransposon-based molecular markers for grapevine species and cultivars identification. Tree Genet. Genomes 2010, 6, 451–466. [Google Scholar] [CrossRef]
  2. Bianchi, D.; Bran Cadoro, L.; de Lorenzis, G. Genetic Diversity and Population Structure in a Vitis spp. Core Collection Investigated by SNP Markers. Diversity 2020, 12, 103. [Google Scholar] [CrossRef] [Green Version]
  3. Li, M.F.; Zheng, X.Q. Research progress of methods of SSR primers development. Hereditas 2004, 26, 769–776. [Google Scholar] [PubMed]
  4. Boz, Y.; Bakir, M.; Çelikkol, B.P.; Kazan, K.; Yilmaz, F.; Çakir, B.; Aslantaş, Ş.; Söylemezoğlu, G.; Yaşasin, A.S.; Özer, C.; et al. Genetic characterization of grape (Vitis vinifera L.) germplasm from Southeast Anatolia by SSR markers. Vitis 2011, 50, 99–106. [Google Scholar]
  5. Zhang, Z.C.; Hou, X.L. Strategies for development of SSR molecular markers. Hereditas 2004, 26, 763–768. [Google Scholar]
  6. Goto-Yamamoto, N.; Azuma, A.; Mitani, N.; Kobayashi, S. SSR genotyping of wild grape species and grape cultivars of Vitis vinifera and V. vinifera × V. labrusca. J. Jpn. Soc. Hortic. Sci. 2013, 82, 125–130. [Google Scholar] [CrossRef] [Green Version]
  7. Villano, C.; Carputo, D.; Frusciante, L.; Santoro, X.; Aversano, R. Use of SSR and retrotransposon-based markers to interpret the population structure of native grapevines from Southern Italy. Mol. Biotechnol. 2014, 56, 1011–1020. [Google Scholar] [CrossRef]
  8. Li, B.; Jiang, J.; Fan, X.; Zhang, Y.; Sun, H.; Zhang, G.; Liu, C. Molecular characterization of Chinese grape landraces (Vitis L.) using microsatellite DNA markers. HortScience 2017, 52, 533–540. [Google Scholar] [CrossRef]
  9. Zhong, H.; Zhang, F.; Zhou, X.; Pan, M.; Xu, J.; Hao, J.; Han, S.; Mei, C.; Xian, H.; Wang, M.; et al. Genome-wide identification of sequence variations and SSR marker development in the Munake grape cultivar. Front. Ecol. Evol. 2021, 9, 664835. [Google Scholar] [CrossRef]
  10. Castelli, M.; Cattaneo, G.; Manzoni, L.; Vanneschi, L. A distance between populations for n-points crossover in genetic algorithms. Swarm Evol. Comput. 2018, 106, 283–292. [Google Scholar] [CrossRef] [Green Version]
  11. Yeh, F. Population genetic analysis of co-dominant and dominant markers and quantitative traits. Belg. J. Bot 1997, 129, 157. [Google Scholar]
  12. Peakall, R.; Smouse, P.E. GENALEX 6: Genetic analysis in Excel. Population genetic software for teaching and research. Mol. Ecol. 2006, 6, 288–295. [Google Scholar] [CrossRef]
  13. Rohlf, F.J. NTSYSpc Numerical Taxonomy and Multivariate Analysis System Version 2.0 User Guide; Exeter Software: Setauket, NY, USA, 1998. [Google Scholar]
  14. Zheng, Y.; Xu, S.; Liu, L.; Zhao, Y.; Liu, J. Genetic diversity and population structure of Chinese natural bermudagrass [Cynodon dactylon (L.) Pers.] germplasm based on SRAP markers. PLoS ONE 2017, 12, e0177508. [Google Scholar] [CrossRef] [PubMed] [Green Version]
  15. Thomas, M.R.; Cain, P.; Scott, N.S. DNA typing of grapevines: A universal methodology and database for describing cultivars and evaluating genetic relatedness. Plant Mol. Biol. 1994, 25, 939–949. [Google Scholar] [CrossRef]
  16. Vouillamoz, J.F.; Schneider, A.; Grando, M.S. Microsatellite analysis of alpine grape cultivars (Vitis vinifera L.): Alleged descendants of Pliny the Elder’s Raetica are genetically related. Genet. Resour. Crop Evol. 2007, 54, 1095–1104. [Google Scholar] [CrossRef] [Green Version]
  17. Cipriani, G.; Marrazzo, M.T.; Di Gaspero, G.; Pfeiffer, A.; Morgante, M.; Testolin, R. A set of microsatellite markers with long core repeat optimized for grape (Vitis spp.) genotyping. BMC Plant Biol. 2008, 8, 127. [Google Scholar] [CrossRef] [PubMed] [Green Version]
  18. Cipriani, G.; Spadotto, A.; Jurman, I.; Di Gaspero, G.; Crespan, M.; Meneghetti, S.; Frare, E.; Vignani, R.; Cresti, M.; Morgante, M.; et al. The SSR-based molecular profile of 1005 grapevine (Vitis vinifera L.) accessions uncovers new synonymy and parentages, and reveals a large admixture amongst varieties of different geographic origin. Theor. Appl. Genet. 2010, 121, 1569–1585. [Google Scholar] [CrossRef] [PubMed]
  19. Guo, D.L.; Zhang, J.Y.; Liu, C.H.; Zhang, G.H.; Li, M. Genetic relationships of Chinese grape accessions to European and American cultivars assessed by microsatellite markers. Biotechnol. Biotechnol. Equip. 2010, 24, 2054–2059. [Google Scholar] [CrossRef] [Green Version]
  20. Guo, D.L.; Zhang, Q.; Zhang, G.H. Characterization of grape cultivars from China using microsatellite markers. Czech J. Genet. Plant Breed 2013, 49, 164–170. [Google Scholar] [CrossRef] [Green Version]
  21. Emanuelli, F.; Lorenzi, S.; Grzeskowiak, L.; Catalano, V.; Stefanini, M.; Troggio, M.; Myles, S.; Martinez-Zapater, J.M.; Zyprian, E.; Moreira, F.M.; et al. Genetic diversity and population structure assessed by SSR and SNP markers in a large germplasm collection of grape. BMC Plant Biol. 2013, 14, 39. [Google Scholar] [CrossRef] [Green Version]
  22. Huerta-Acosta, K.G.; Riaz, S.; Franco-Mora, O.; Cruz-Castillo, J.G.; Walker, M.A. The genetic diversity of wild grapes in Mexico. Genet. Resour. Crop Evol. 2022, 69, 1329–1347. [Google Scholar] [CrossRef]
  23. Zheng, X.; Shi, J.; Yu, Y.; Shen, Y.; Tan, B.; Ye, X.; Li, J.; Feng, J. Exploration of Elite Stilbene Synthase alleles for resveratrol concentration in wild Chinese Vitis spp. and Vitis cultivars. Front. Plant Sci. 2017, 8, 487. [Google Scholar] [CrossRef] [PubMed] [Green Version]
  24. Laiadi, Z.; Bentchikou, M.M.; Bravo, G.; Cabello, F.; Martinez-Zapater, J.M. Molecular identification and genetic relationship of Algerian grapevine cultivars maintained at the germplasm collection of Skikda (Algeria). Vitis 2009, 48, 25–32. [Google Scholar]
  25. Štajner, N.; Tomić, L.; Ivanišević, D.; Korać, N.; Cvetković-Jovanović, T.; Beleski, K.; Angelova, E.; Maraš, V.; Javornik, B. Microsatellite inferred genetic diversity and structure of Western Balkan grapevines (Vitis vinifera L.). Tree Genet. Genomes 2014, 10, 127–140. [Google Scholar] [CrossRef]
  26. Fan, X.C.; Sun, H.S.; Zhang, Y.; Jiang, J.F.; Li, M.; Liu, C.H. Genetic diversity of Vitis davidii accessions revealed using microsatellite and sequence-related amplified polymorphism markers. HortScience 2018, 53, 283–287. [Google Scholar] [CrossRef] [Green Version]
  27. de Oliveira, G.L.; de Souza, A.P.; de Oliveira, F.A.; Zucchi, M.I.; de Souza, L.M.; Moura, M.F. Genetic structure and molecular diversity of Brazilian grapevine germplasm: Management and use in breeding programs. PLoS ONE 2020, 15, e0240665. [Google Scholar] [CrossRef]
  28. Jaillon, O.; Aury, J.M.; Noel, B.; Policriti, A.; Clepet, C.; Casagrande, A.; Choisne, N.; Aubourg, S.; Vitulo, N.; Jubin, C.; et al. The grapevine genome sequence suggests ancestral hexaploidization in major angiosperm phyla. Nature 2007, 449, 463–467. [Google Scholar]
  29. Cunha, J.; Ibáñez, J.; Teixeira-Santos, M.; Brazão, J.; Fevereiro, P.; Martínez-Zapater, J.M.; Eiras-Dias, J.E. Genetic Relationships among Portuguese Cultivated and Wild Vitis vinifera L. Germplasm. Front. Plant Sci. 2020, 11, 137–142. [Google Scholar] [CrossRef] [Green Version]
  30. Cretazzo, E.; Moreno Sanz, P.; Lorenzi, S.; Benítez, M.L.; Velasco, L.; Emanuelli, F. Genetic characterization by SSR markers of a comprehensive wine grape collection conserved at Rancho de la Merced (Andalusia, Spain). Plants 2022, 11, 1088. [Google Scholar] [CrossRef] [PubMed]
  31. Sefc, K.M.; Lopes, M.S.; Lefort, F.; Botta, R.; Roubelakis-Angelakis, K.A.; Ibáñez, J.; Pejić, I.; Wagner, H.W.; Glössl, J.; Steinkellner, H. Microsatellite variability in grapevine cultivars from different European regions and evaluation of assignment testing to assess the geographic origin of cultivars. Theor. Appl. Genet. 2000, 100, 498–505. [Google Scholar] [CrossRef]
  32. Dallakyan, M.; Esoyan, S.; Gasparyan, B.; Smith, A.; Hovhannisyan, N. Genetic diversity and traditional uses of aboriginal grape (Vitis vinifera L.) varieties from the main viticultural regions of Armenia. Genet. Resour. Crop Evol. 2020, 67, 999–1024. [Google Scholar] [CrossRef]
  33. Botstein, D.; White, R.L.; Skolnick, M.; Davis, R.W. Construction of a genetic linkage map in man using restriction fragment length polymorphisms. Am. J. Hum. Genet. 1980, 32, 314–331. [Google Scholar] [PubMed]
  34. Fanelli, V.; Roseti, V.; Savoia, M.A.; Miazzi, M.M.; Venerito, P.; Savino, V.N.; Pirolo, C.; La Notte, P.; Falbo, M.; Petrillo, F.; et al. New insight into the identity of Italian grapevine varieties: The case study of Calabrian germplasm. Agronomy 2021, 11, 1538. [Google Scholar] [CrossRef]
  35. Zhang, Y.; Feng, L.; Fan, X.; Jiang, J.; Zheng, X.; Sun, H.; Liu, C. Genome-wide assessment of population structure, linkage disequilibrium and resistant QTLs in Chinese wild grapevine. Sci. Hortic. 2017, 215, 59–64. [Google Scholar] [CrossRef]
  36. El-Esawi, M.A.; Abd El-Zaher, M.; Salwa, B.; Reda, S. Isozyme analysis of genetic variability and population structure of Lactuca L. germplasm. Biochem. Syst. Ecol. 2016, 70, 73–79. [Google Scholar] [CrossRef]
  37. El-Esawi, M.; El-Esawi, A.; Glascoe, D.; Engle, T.; Ritz, J.; Link, M. Ahmad. Cellular metabolites modulate in vivo signaling of Arabidopsis cryptochrome-1. Plant Signal Behav. 2015, 10, e1063758. [Google Scholar] [CrossRef] [Green Version]
  38. Wei, S.; Zhang, Q.; Tang, S.; Liao, W. Genetic and ecophysiological evidence that hybridization facilitated lineage diversification in yellow Camellia (Theaceae) species: A case study of natural hybridization between C. micrantha and C. flavida. BMC Plant Biol. 2023, 23, 154. [Google Scholar] [CrossRef]
  39. Magris, G.; Di Gaspero, G.; Marroni, F.; Zenoni, S.; Tornielli, G.B.; Celii, M.; De Paoli, E.; Pezzotti, M.; Conte, F.; Paci, P.; et al. Genetic epigenetic and genomic effects on variation of gene expression among grape varieties. Plant J. 2019, 99, 895–909. [Google Scholar] [CrossRef]
  40. Buhner-Zaharieva, T.; Moussaoui, S.; Lorente, M.; Andreu, J.; Nunez, R.; Ortiz, J.M.; Gogorcena, Y. Preservation and Molecular Characterization of Ancient Varieties in Spanish Grapevine Germplasm Collections. Am. J. Enol. Vitic. 2010, 3, 328–335. [Google Scholar] [CrossRef]
  41. Mercati, F.; De Lorenzis, G.; Brancadoro, L.; Lupini, A.; Abenavoli, M.R.; Barbagallo, M.G.; Di Lorenzo, R.; Scienza, A.; Sunseri, F. High-throughput 18K SNP array to assess genetic variability of the main grapevine cultivars from Sicily. Tree Genet. Genomes 2016, 12, 59. [Google Scholar] [CrossRef] [Green Version]
  42. Zhou, J.; Fan, X.; Dong, Y.; Zhang, Z.; Ren, F.; Hu, G.; Li, Z. Complete nucleotide sequence of a new variant of grapevine fanleaf virus from northeastern China. Arch. Virol. 2017, 162, 577–579. [Google Scholar] [CrossRef] [PubMed]
  43. Zou, C.; Karn, A.; Reisch, B.; Nguyen, A.; Sun, Y.; Bao, Y.; Campbell, M.S.; Church, D.; Williams, S.; Xu, X.; et al. Haplotyping the Vitis collinear core genome with rhAmp Seq improves marker transferability in a diverse genus. Nat. Commun. 2020, 11, 413. [Google Scholar] [CrossRef] [PubMed] [Green Version]
  44. Song, X.; Ge, T.; Li, Y.; Hou, X. Genome-wide identification of SSR and SNP markers from the non-heading Chinese cabbage for comparative genomic analyses. BMC Genom. 2015, 16, 328. [Google Scholar] [CrossRef] [PubMed] [Green Version]
  45. Subbaiyan, G.K.; Waters, D.L.E.; Katiyar, S.K.; Sadananda, A.R.; Vaddadi, S.; Henry, R.J. Genome-wide DNA polymorphisms in elite indica rice inbreds discovered by whole-genome sequencing. Plant Biotechnol. J. 2012, 10, 623–634. [Google Scholar] [CrossRef] [PubMed]
  46. Wang, Z.; Wang, Y.; Cao, X.; Wu, D.; Hui, M.; Han, X.; Yao, F.; Li, Y.; Li, H.; Wang, H. Screening and Validation of SSR Molecular Markers for Identification of Downy Mildew Resistance in Intraspecific Hybrid F1 Progeny (V. vinifera). Horticulturae 2022, 8, 706. [Google Scholar] [CrossRef]
Figure 1. Plot of sampled ArcGIS sites for the eight populations (144 grape samples).
Horticulturae 09 00917 g001
Figure 2. Chromosome positions of seven pairs of primers specific for Munake grapes.
Horticulturae 09 00917 g002
Figure 3. Genetic parameters of the 22 SSR loci obtained from 144 Munake grape accessions. Primer 1: Scu06. Primer 2: VVIP31. Primer 3: VVMD7. Primer 4: VVMD27. Primer 5: Vchr8a. Primer 6: VVMD32. Primer 7: VVS2. Primer 8: Vchr16a. Primer 9: VVMD5. Primer 10: VMC4F3-1. Primer 11: VrZAG67. Primer 12: Scu15w. Primer 13: VCHR13a. Primer 14: Vchr6a. Primer 15: VMC5G8. Primer 16: T1. Primer 17: T3. Primer 18: T4. Primer 19: T5. Primer 20: T6. Primer 21: T7. Primer 22: T8. The Y-axis indicates the genetic diversity value for each SSR site, and the numbers on the bar graph represent the standard error.
Horticulturae 09 00917 g003
Figure 4. Genetic distance analysis among eight populations of Munake grapes (PCoA). 1: Korla population. Pop 2: Artoush area populations. Pop 3: Kashgar population. Pop 4: Artux population. Pop 5: Ruoqiang region population. Pop 6: Hotan region population. Pop 7: Qiemo population. Pop 8: The town of Utuprague population.
Horticulturae 09 00917 g004
Figure 5. Proportional gradient coverage of germplasm resources.
Horticulturae 09 00917 g005
Figure 6. Diversity index of all individuals. Notes: Pop: group number; ind: number of individuals; Na: number of alleles; PIC: polymorphism information content; Ho: observed heterozygosity; He: expected heterozygosity.
Horticulturae 09 00917 g006
Figure 7. Core germplasm diversity index with 95% coverage. Notes: Pop: group number; ind: number of individuals; Na: number of alleles; PIC: polymorphism information content; Ho: observed heterozygosity; He: expected heterozygosity.
Horticulturae 09 00917 g007
Figure 8. Graph of PCA analysis of all samples.
Horticulturae 09 00917 g008
Figure 9. PCA analysis of core germplasm samples with 95% coverage.
Horticulturae 09 00917 g009
Table 1. Latitude and longitude information of 144 Munake grape samples.
PopNumberLatitudeLongitude
1106–11786.098741.6871
227–3076.156639.6706
75.793339.6632
378–10576.123739.5622
76.029639.4867
41–2680.126140.9392
80.063340.8863
5128–14188.131439.0237
631–7779.864437.0841
79.677037.1756
79.656437.1431
7118–12785.567438.3319
85.538834.3438
8142–14482.159044.9062
Table 2. 22 Primer sequences used for the SSR primers for Munake grapes.
NamePrimer Sequences (F) (5′-3′)Primer Sequences (R) (5′-3′)
Vchr16aTTCATGTGTGACACCCCTTTAATGTCCATGCTTCAAAATACC
Scu06CCTAATGCCAGGAAGGTTGCCCCTAGTCTCTCTACCTATCCATG
VVMD5CTAGAGCTACGCCAATCCAATATACCAAAAATCATATTCCTAAA
VVMD27TACCAGATCTGAATACATCCGTAAGTACGGGTATAGAGCAAACGGTGT
VVMD32GGAAAGATGGGATGACTCGCTATGATTTTTTAGGGGGGTGAGG
VVS2CAGCCCGTAAATGTATCCATCAAATTCAAAATTCTAATTCAACTGG
Vchr8aACCCACTGCCACTCTCTCATAAATCTCCGGGATCCTTTTG
VVMD7AGAGTTGCGGAGAACAGGATCGAACCTTCACACGCTTGAT
VVIP31TATCCAAGAGACAAATTCCCACTTCTCTTGTTTCCTGCAAATGG
Vchr13aTGGCAGAGCAAATGAATCAATTGGATGGATTGGAATGACC
Vchr6aAATGTTGAGCTTTGGGCTTGCCAATTCTTCCATACCTCAAAA
VMC4F3-1AAAGCACTATGGTGGGTGTAAATAACCAATACATGCATCAAGGA
VRZAG67ACCTGGCCCGACTCCTCTTGTATGCTCCTGCCGGCGATAACCAAGCTATG
SCU15WGCCTATGTGCCAGACCAAAAACTTGGAAGTAGCCAGCCCAACCTTC
VMC5G8CATGCACATCTTGTTTCACTCTCATCATTGCTTCCAAAAGTCTC
T1GTGTGCCTACATTTTTCATTCGTAACAATATGGCACAACAATGTCA
T3TCAAAAAGAAATAATATTAGATGCGGAATTCCAAAATCCCAACTTTCTC
T4CTAATATCGCGATTCACAAATCAAAAATTGATCAAAACTCATGAAAATG
T5CCAGTGCTACAAAAACTCTTGCTGTTGATTTGGAAGCTGAAAATTG
T6GCCTTTATCTAGAAGCCCTCACTCAACATAAGAATAGGTAGCATCG
T7CTTTCTCGAAATTTCCGATTTGAGAAAACCCTTTGCAGCAGTAATATGG
T8CCCCAAAATGTATCCCAATTTTATTTGGAGACAATGAATGGATAGG
Table 3. Statistics of the proportional gradient coverage of germplasm resources. Note: sample intensity: sampling proportion; sample: number of samples; CV: coverage.
Sample Intensity0.10.150.20.250.30.350.40.450.50.550.60.650.70.750.80.850.90.95
Sample142128364350576472798693100108115122129136
CV0.590.670.720.780.810.830.870.880.920.930.940.950.950.960.970.980.991
Table 4. Diversity index of all individuals.
PopindNaPICShannon IndexHoHe
Pop1126.270.651.460.780.69
Pop243.000.490.950.830.57
Pop3289.000.681.590.820.72
Pop4267.820.641.480.820.68
Pop5146.410.641.430.800.68
Pop64712.270.711.770.800.74
Pop7105.820.661.440.770.70
Pop833.680.601.190.740.66
Total14418.140.681.760.800.73
Table 5. Core germplasm diversity index with 95% coverage. Notes: Pop: group number; ind: number of individuals; Na: number of lleleas; PIC: polymorphism information content; Ho: observed heterozygosity; He: expected heterozygosity.
PopindNaPICShannon IndexHoHe
Pop1105.910.651.430.780.69
Pop3198.410.711.660.810.74
Pop4137.090.681.570.810.72
Pop5106.050.651.440.800.69
Pop63211.730.751.880.790.78
Pop775.230.661.420.750.71
Pop823.050.551.050.730.63
Total9317.270.741.920.790.76
Disclaimer/Publisher’s Note: The statements, opinions and data contained in all publications are solely those of the individual author(s) and contributor(s) and not of MDPI and/or the editor(s). MDPI and/or the editor(s) disclaim responsibility for any injury to people or property resulting from any ideas, methods, instructions or products referred to in the content.

