Article

Comparative Transcriptome Analysis Reveals Differential Gene Expression Pattern Associated with Heat Tolerance in Pepper (Capsicum annuum L.)

1
Shanghai Key Laboratory of Protected Horticultural Technology, Horticulture Research Institute, Shanghai Academy of Agricultural Sciences, Shanghai 201403, China
2
Vegetable Research Institute, Hangzhou Academy of Agricultural Sciences, Hangzhou 310024, China
3
College of Agronomy, Gansu Agricultural University, Lanzhou 730070, China
*
Author to whom correspondence should be addressed.
These authors contributed equally to this work.
Horticulturae 2023, 9(7), 801; https://doi.org/10.3390/horticulturae9070801
Submission received: 31 May 2023 / Revised: 9 July 2023 / Accepted: 12 July 2023 / Published: 13 July 2023
(This article belongs to the Special Issue Genetic Resources and Fruit Development Biology of Solanaceae)

Abstract

:
Pepper (Capsicum annuum L.) represents a highly significant agricultural commodity worldwide. Heat stress (HS) poses a severe threat to pepper productivity and quality. However, our understanding of the molecular alterations triggered by HS remains insufficient. This study focused on characterizing P19055 and P17087 as heat-tolerant and heat-sensitive pepper lines, respectively. Through RNA sequencing, we quantified transcript abundance in pepper fruit to investigate the impact of HS on gene expression. A total of 41,793 differentially expressed genes (DEGs) was identified, encompassing 33,703 known genes and 8090 novel genes. Additionally, we obtained 89,821 expressed transcripts, including 52,726 known transcripts and 37,095 new transcripts. By comparing gene expression levels between P17087 and P19055 fruit, we pinpointed 2324 genes exhibiting differential expression across three time points (0.5 h, 2 h, 6 h). Leveraging the weighted correlation network analysis (WGCNA) approach, we constructed a co-expression network of DEGs in P19055 and P17087 based on transcriptomic data acquired at these time points. Notably, nineteen modules displayed significant correlations with the time points following HS during the fruiting stage in both genotypes. Functional enrichment analysis revealed that the DEGs were primarily associated with metabolic and cellular processes in response to stress, particularly photosynthesis at the 2 h and 6 h time points. Moreover, we identified and categorized 26 families of transcription factors, including ERF (19), WRKY (12), MYB (15), NAC (7), bHLH (7), MIKC (7), GRAS (6), and 40 others, which may potentially regulate the expression of key genes in response to HS. Our findings contribute to a comprehensive understanding of the molecular mechanisms governing HS during the fruiting stage of pepper cultivation.

1. Introduction

Pepper (Capsicum annuum L.) originates from the tropical regions of Central and South America. While it thrives in temperate climates, it is susceptible to high temperatures, with an optimal growth and development range of 18 to 30 °C [1]. Exposure to temperatures exceeding 32 °C leads to various HS symptoms, including pollen abortion, reduced flower and fruit production, and diminished pepper yield. These adverse effects, exacerbated by summer temperatures and global warming, pose a significant threat to pepper crops, affecting both yield and quality [2]. Consequently, plant scientists have increasingly focused on investigating the impact of elevated temperatures on pepper plants and uncovering the underlying molecular mechanisms that enable them to tolerate high temperatures. For example, Tang et al. [3] conducted a transcriptome analysis of pepper plants at the seedling stage, subjecting them to a temperature of 40 °C and comparing them to control plants. They observed a higher number of differentially expressed genes (DEGs) in the root tissue compared to the leaf tissue. The study identified five heat-shock transcription factors (HSFs) that respond to HS and concluded that HSFs play critical roles in regulating the expression of heat-responsive genes [4]. In a related study, Wang et al. [5] performed a transcriptome analysis of pepper seedlings and discovered 38 heat-shock proteins (HSPs), 17 HSFs, 38 NAC (NAM, ATAF1/2, and CUC2), and 35 WRKY proteins that exhibited responsiveness to HS or recovery. Furthermore, Guo et al. [6] found that Ca-Hsp70-1, a member of the cytosolic Hsp70 subgroup, potentially participates in the heat shock defense response through a signal transduction pathway involving Ca2+, H2O2, and putrescine.
Apart from pepper, HS in plants has been extensively studied. HS can affect the fluidity of the plasma membrane, leading to the activation of calcium (Ca2+) channels [7]. This, in turn, triggers an influx of Ca2+ ions and the activation of the Ca2+ signaling pathway. HS also destabilizes proteins and increases the production of reactive oxygen species (ROS), resulting in protein misfolding and metabolic disturbances. These modifications influence the expression of heat-sensitive genes, including HSPs and HSFs [8]. HSPs and HSFs are key players in plant HS [9]. HSPs directly regulate protein folding/unfolding, formation of multi-protein complexes, protein transportation, cell cycle regulation, cell signaling, and stress protection, particularly during HS [10].
Thermal signal perception and transduction are essential for plant stress resistance. They involve multiple signal transduction pathways, such as calcium-dependent protein kinases (CDPKs), mitogen-activated protein kinases (MAPKs), signal molecules (e.g., reactive oxygen species (ROS)), and plant hormones, which transmit extracellular stimuli to induce intracellular responses [11]. The perception and transduction of thermal signals actively modulate gene expression and protein function in response to various stresses, ultimately enabling plants to adapt to environmental challenges [12,13]. For instance, a study demonstrated that SlMAPK3 tomato mutants, generated using CRISPR/Cas9 technology, exhibited superior heat tolerance compared to wild-type plants. These mutants displayed reduced plant dehydration, improved membrane integrity, lower levels of reactive oxygen species (ROS), enhanced activities of antioxidant enzymes, and increased transcriptional levels [14].
The 47 kD MBP-phosphorylated protein SlMPK1, induced by heat, negatively affects the heat tolerance of tomato plants. This effect is mediated through the regulation of antioxidant protection and redox metabolism. SlSPRH1, a protein rich in serine and proline, serves as a target for phosphorylation by SlMPK1. Overexpression of SlSPRH1 reduces the heat tolerance and antioxidant capacity of plants, which is associated with the phosphorylation of SlSPRH1. The SlMPK1-SlSPRH1 modules act as inhibitors of the high-temperature signal during the heat response and collaborate with the antioxidant stress system [14]. These findings indicate that HS is accompanied by oxidative stress. Additionally, the critical regulator of brassinoid response (B.R.), BZR1, influences the response of tomato plants to HS through ROS signaling dependent on RBOH1 and the regulation of FER2 and FER3 [15].
Furthermore, transcription factors (TFs) play a crucial role in mediating the transduction of stress signals and the expression of stress-responsive genes in plants. In addition to HSFs, various other families of TFs, including Dehydration-Responsive Element-Binding Protein (DREB2A), NAC TF (ANAC078), and Respiratory Burst Oxidase Homolog D (RBOHD), which is a ROS-generating enzyme located in the plasma membrane, contribute to the regulation of gene expression in response to HS [16]. HS-sensitive TFs such as DREB2A, HsfA7s, and HsfBs are directly regulated by HsfA1 [17]. DREB2A, a member of the EREB/APETALA2 TF family, plays a critical role in modulating responses to drought and HS through the presence of ethylene-responsive elements [18]. This putative protein regulates the expression of stress-responsive genes by binding to the dehydration-responsive element (DRE) sequence [19]. Overexpression of DREB2ACA (dehydration responsive element binding 2A C.A.), as identified in microarray analysis, leads to the up-regulation of heat and dehydration-inducible genes [20]. Further investigation of DREB TFs could enhance our understanding of the interplay between heat and drought stress reactions.
Moreover, the ability of plants to withstand HS in their natural environment is of utmost importance. Previous studies have extensively examined the effects of high temperature on pepper seedlings at physiological and biochemical levels. However, the response of pepper plants to HS and its regulatory mechanisms during the fruiting stage have not been clearly elucidated. This study focuses on investigating HS and its regulatory mechanisms during the fruiting stage for several reasons. Firstly, the fruiting stage coincides with the period of high temperatures in the Shanghai region where our study was conducted. By studying the impact of high temperatures on pepper fruits under real environmental conditions, we aim to gain a better understanding of the effects of HS on fruit quality and yield. Secondly, the fruiting stage is a critical phase in the plant’s life cycle, and HS during this period can significantly affect fruit quality and yield. Understanding the plant’s response to HS at this stage is crucial for developing strategies to mitigate the negative impacts on fruit production. Through the study of HS during the fruiting stage, we can obtain comprehensive insights into the mechanisms and adaptive responses of fruit development, maturation, and overall plant productivity under high-temperature conditions.
Therefore, in this study, we conducted a transcriptome analysis on two pepper lines, specifically the heat-tolerant variety P19055 (referred to as “T”) and the heat-sensitive variety P17087 (referred to as “S”). Our aim was to gain a deeper understanding of the molecular mechanisms underlying HS in pepper during the fruiting stage and analyze the genes responsive to HS.

2. Materials and Methods

2.1. Plant Materials and Experimental Treatments

We selected eight pepper inbred lines obtained from the Horticultural Institute of Shanghai Academy of Agricultural Sciences. The lines P17087 and P19055 exhibited significant performance variations among different lines. Under high-temperature stress, the fruits of the P17087 line displayed wrinkling, while the fruits of the P19055 line remained unaffected. Our results indicated that the P17087 variety showed a more severe HS response, as evidenced by the significant increase in relative conductivity, malondialdehyde (MDA), proline (Pro), and antioxidant enzyme levels (e.g., SOD, POD, CAT). Conversely, the P19055 variety demonstrated a lesser impact under the same high-temperature conditions (Table S1).
These lines were subsequently replanted in pots within a greenhouse maintained at temperatures ranging from 15 °C to 20 °C during the day and 22 °C to 32 °C at night. A light intensity of 20,000 lux was provided to simulate natural light conditions for pepper plants and ensure sufficient photosynthetic activity. During the fruiting stage, the plants were subjected to a growth chamber and exposed to a temperature of 45 °C at three different time points: 0.5 h, 2 h, and 6 h. The plants in the greenhouse served as the control point (0 h). Pepper fruits were randomly collected from different plants at each time point, immediately frozen in liquid nitrogen, and stored at −80 °C for subsequent RNA extraction and transcriptome sequencing.

2.2. RNA Extraction, Library Construction, and RNA Sequencing

Total RNA was extracted from the pepper fruits of each specimen using QIAzol Lysis Reagent (Qiagen, Hilden, Germany) following the manufacturer’s instructions. RNA quantity was measured using a Nanodrop 2000 (Nanodrop Technologies, Wilmington, DE, USA), and RNA quality was assessed using a 5300 Bioanalyzer (Agilent, Santa Clara, CA, USA). For RNA-seq transcriptome library preparation, 1 μg of RNA was used with the Illumina® Stranded mRNA Prep (Illumina, San Diego, CA, USA) kit. Messenger RNA was isolated using the Poly(A) selection method with oligo(dT) beads, followed by fragmentation using a fragmentation buffer. The synthesized double-stranded cDNA was prepared using the SuperScript double-stranded cDNA synthesis kit (Invitrogen, Carlsbad, CA, USA) and random hexamer primers (Illumina, CA, USA). The resulting complementary DNA underwent end-repair, phosphorylation, and the addition of an “A” base, following Illumina’s library construction protocol. Fragments of cDNA, each with a length of 300 bp, were selected through size selection of libraries on 2% Low Range Ultra Agarose, followed by PCR amplification using Phusion DNA polymerase (New England Biolabs, Ipswich, MA, USA) for 15 PCR cycles. The paired-end RNA-seq sequencing library was quantified using Qubit 4.0 and sequenced using the NovaSeq 6000 (Illumina, CA, USA) sequencer with a read length of 2 × 150 bp.

2.3. Quality Control and Read Mapping

The paired end reads in the raw state underwent trimming and quality control procedures by using the fastp software v0.20.0 tool with default parameters [21]. Subsequently, the clean reads were aligned to the reference genome (C. annuum. L Zunla_1, v1.0; https://www.ncbi.nlm.nih.gov/genome/?term=Capsicum%20annuum, accessed on 25 October 2022) using HISAT2 v2.2.1 [22] software in orientation mode. The reference-based approach was employed to assemble the mapped reads of each sample using String Tie [23]. The names of newly identified genes or transcripts began with “gene”.

2.4. Functional Enrichment Analysis

The fragments per kilobase per million (FPKM) approach was used to calculate transcript expression levels in two samples to find differential expression genes (DEGs). Gene abundances were quantified using RSEM [24]. DESeq2 or DEGSeq were used for DEGs [25,26]. DEGs with |log2fold change| ≥ 1 and FDR ≤ 0.05(DESeq2) were considered to be significantly DEGs. At 0 h, the time point, the gene expression level was regarded as a control. At 0.5 h, 2 h, and 6 h time points, the gene expression level was compared with the control at 0 h. If there was a difference, it was used for DEGs identification. If there was no difference in gene expression compared to the control at 0 h, then DEG identification was not conducted.
Furthermore, a functional-enrichment analysis was conducted utilizing Gene Ontology (GO) and Kyoto Encyclopedia of Genes and Genomes (KEGG) to determine the significant enrichment of DEGs in GO terms and metabolic pathways. The analysis used a Bonferroni correction with a significance threshold of ≤0.05 relative to the entire transcriptome as a background. Goatools [27] and KOBAS [28] analyzed GO functional enrichment and the KEGG pathway.
The TFs were identified using iTAK v18.12 (Plant Transcription Factor and Protein Kinase Identifier and Classifier, http://itak.feilab.net/cgi-bin/itak/index.cgi (accessed on 25 September 2022), Fei Bioinformatics Lab, Ithaca, NY, USA). This was accomplished by predicting all DEGs using the PlnTFDB and PlantTFDB databases [29]. The process mentioned above was conducted on 30 September 2022.

2.5. Construction of WGCNA

Weighted gene co-expression network analysis (WGCNA) was performed using the R package WGCNA v 1.70-3 [30]. Soft thresholds provided by the software were used for subsequent analysis. The dynamic pruning method was used to identify co-expression patterns and construct a gene clustering tree based on the correlation between gene expression levels. The minimum number of genes in each module was set to 30, and modules with similar expression patterns were merged based on a module feature value similarity threshold of 0.75. The gene co-expression network output by WGCNA was processed using Cytoscape_3.7.2 [31] to identify core genes.

2.6. Quantitative Real-Time PCR

Primer pairs for quantitative real-time PCR (qRT-PCR) were designed using Primer-Blast software (NCBI, Bethesda, MD, USA) and synthesized by Sangon Biotech (Shanghai, China). The β-actin gene of the pepper plant served as a reference gene for normalizing the expression data. The primer pairs used are listed in Table S2. qRT-PCR was performed following the guidelines of 2 × Hieff UNICON® Universal Blue qPCR SYBR Green Master Mix (YEASEN, Shanghai, China), and the data were analyzed using the Quant Studio 5 real-time PCR system (Thermo-Fisher Scientific, Waltham, MA, USA). The 2−ΔΔCT method was employed to calculate relative mRNA expression. The study included three biological replicates and three technical replicates.

3. Results

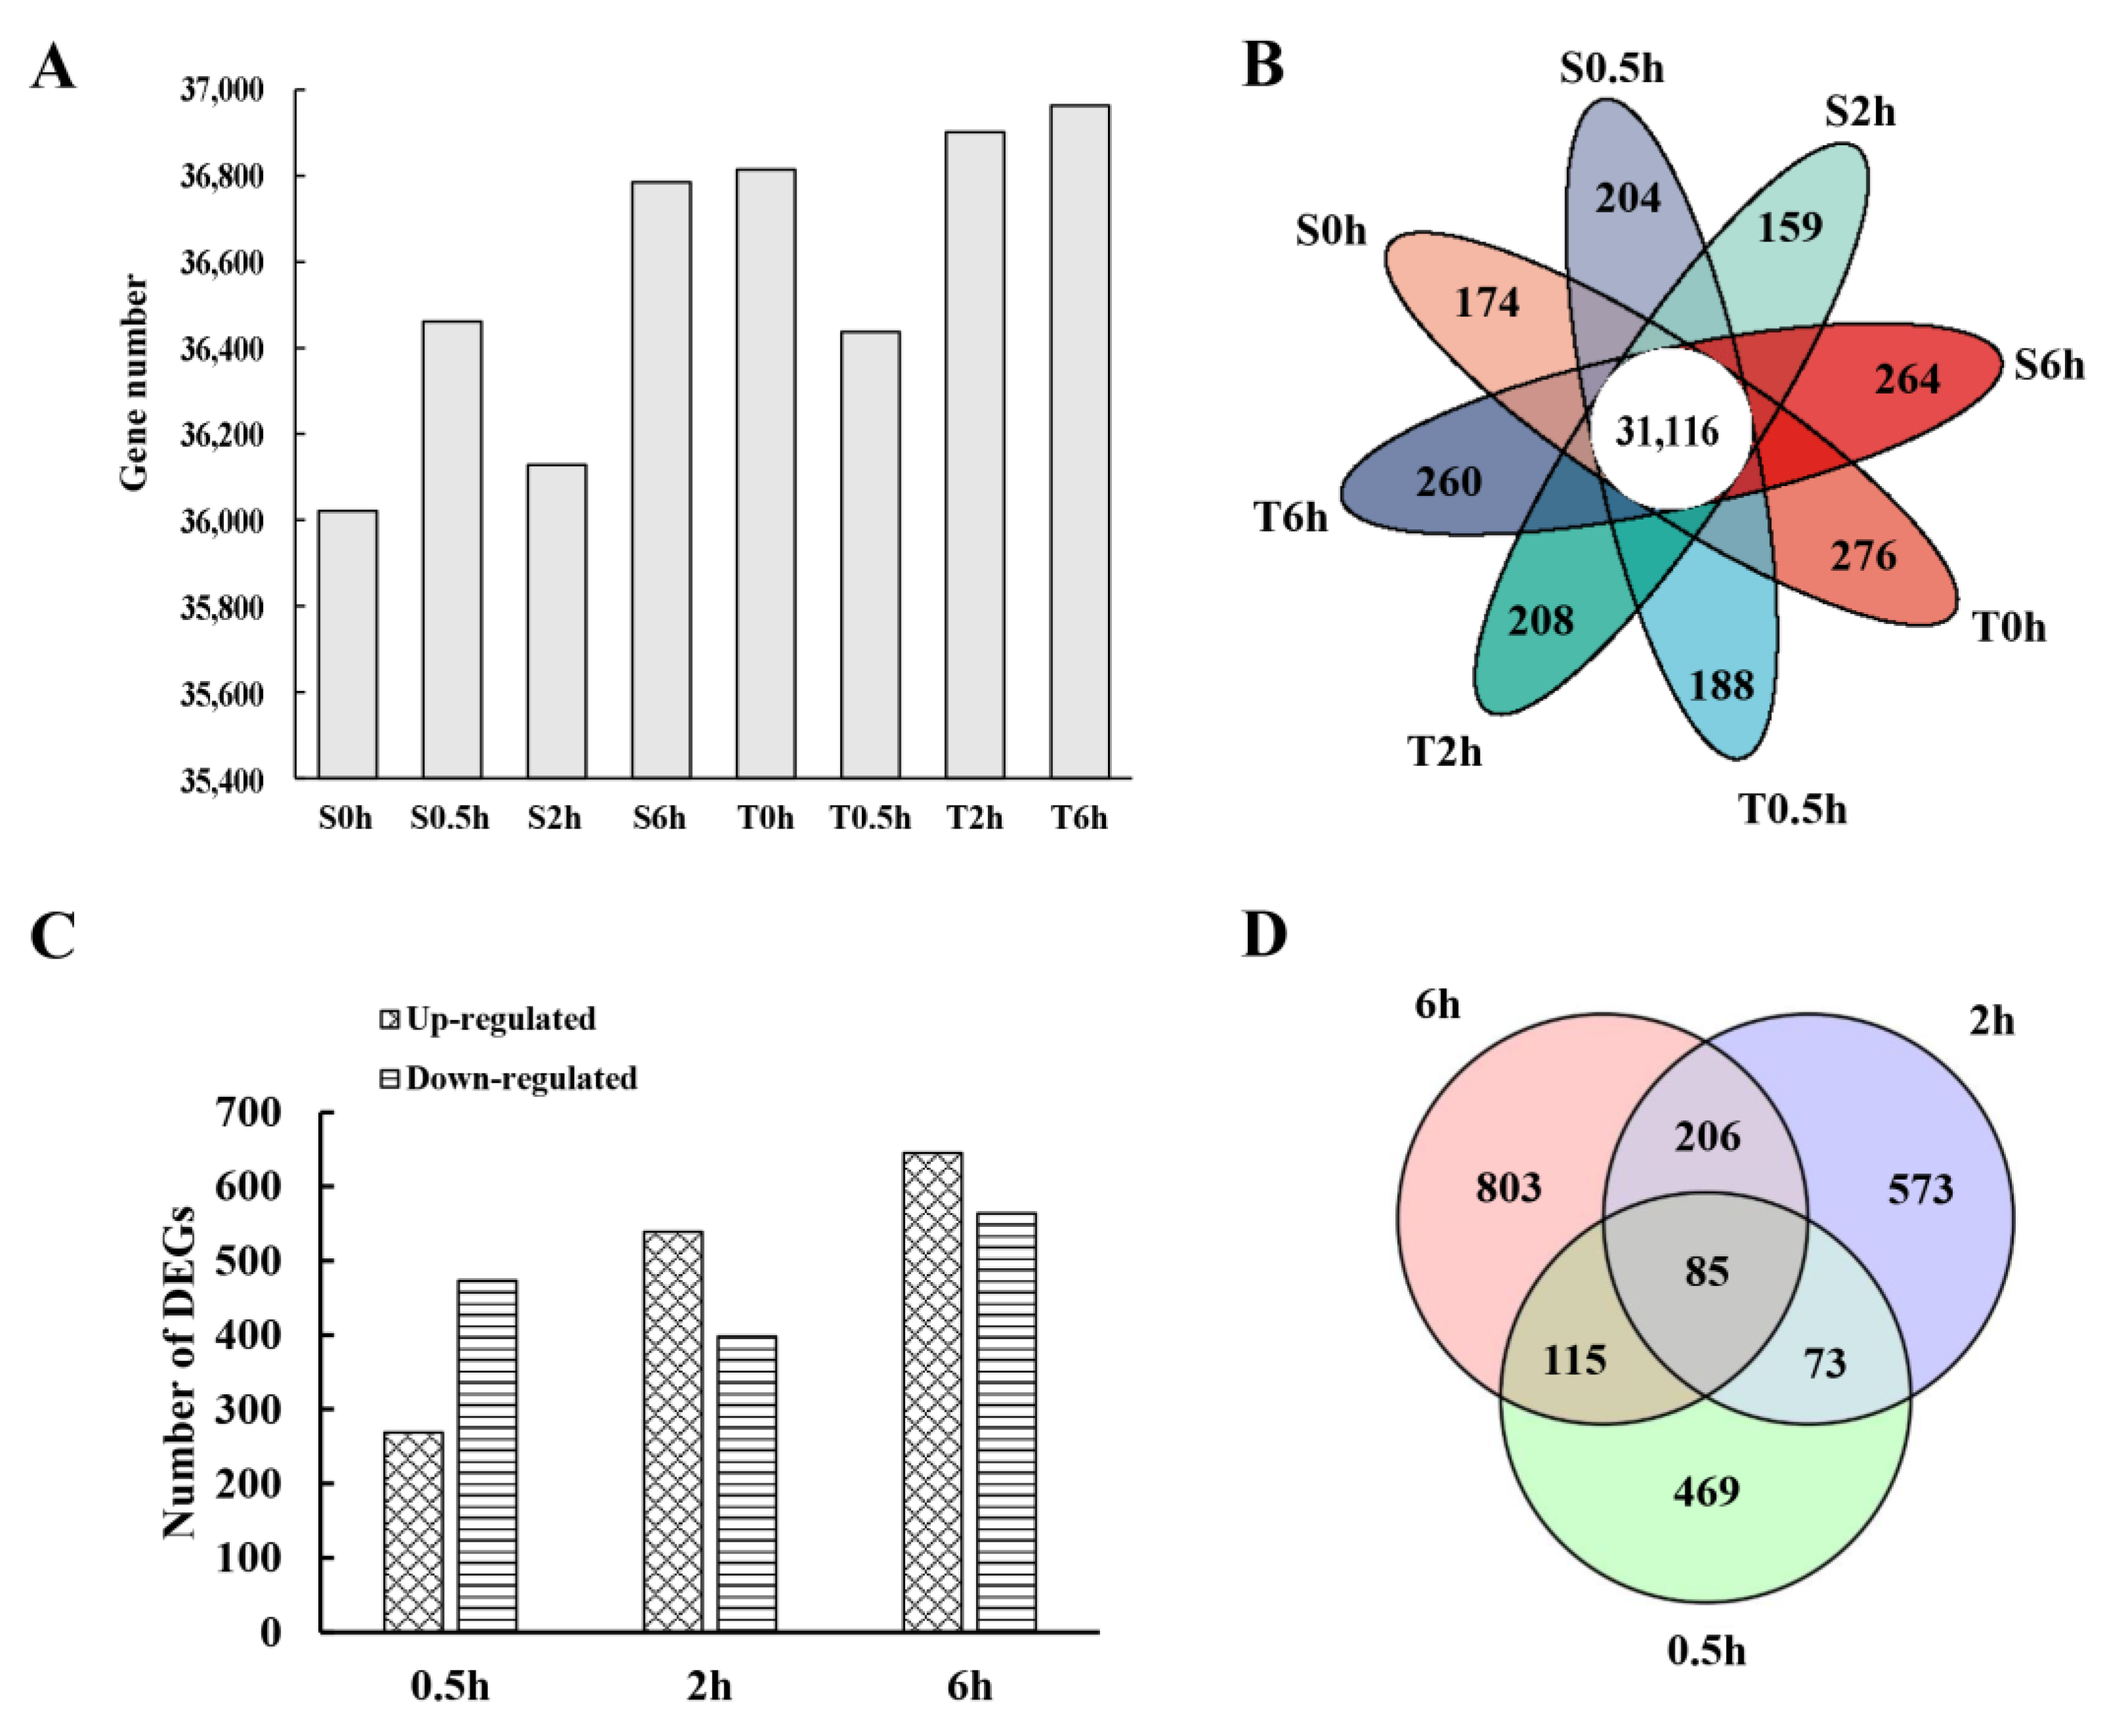
3.1. RNA Sequencing and DEGs Identification

The transcriptome sequencing yielded 166.94 G of raw data, and after filtering 162.63 G, valid reads were obtained in the 24 libraries (Table S3). On average, the effective data acquired from each sample exceeded 6.19 G, representing 97.42% of the original data (Table S3). Each library’s Q30 base percentage exceeded 92.80% (Table S3). The findings demonstrated that the sequencing quality was dependable, and the data obtained were appropriate for subsequent analyses.
Moreover, based on the RNA-seq experiment, 41,793 expressed genes were detected, including 33,703 known genes and 8090 novel genes, and 89,821 expressed transcripts were obtained, including 52,726 known transcripts and 37,095 new transcripts. The comparison analysis showed that 39,494 Uni-genes (94.56% of the total) among 41,793 Uni-genes were successfully compared in Genebank. The matching degree was the highest among the six public database annotations; 36,848 Uni-genes were successfully compared in the COG database (88.31% of the total Uni-genes). We found that 29,095 Uni-genes were successfully compared in the SwissProt database, accounting for 69.73% of the total. A total of 24,868 Uni-genes was compared in the Pfam database, accounting for 59.6% of the total Uni-genes. Using Blast2GO v2.5, we found that 22,362 Uni-genes (53.59% of the total Uni-genes) were successfully compared with the known proteins in the GO database. In total, 15,245 Uni-genes (36.54% of the total Uni-genes) were successfully compared with the KEGG database, which had a low matching rate.
Principle component analysis showed significant differences among samples but a high correlation within replicates (Figure S1). It showed that the experimental results were reliable. The number of genes ranged from 36,021 to 36,964 across all eight samples, and 31,116 genes were detected in all samples (Figure 1A,B). The differential gene expression levels were analyzed between the T and S at three time points at fruit development; 2324 genes exhibited differential expression across these three time points (0.5 h, 2 h, 6 h) (Table S4), 742 (269 up-regulated and 473 down-regulated), 937 (539 up-regulated and 398 down-regulated), and 1209 (645 upregulated and 564 down-regulated) DEGs were obtained from 0.5 h, 2 h, and 6 h for the S, respectively (Figure 1C). In total, 85 DEGs were common in all three time treatments (Figure 1D).

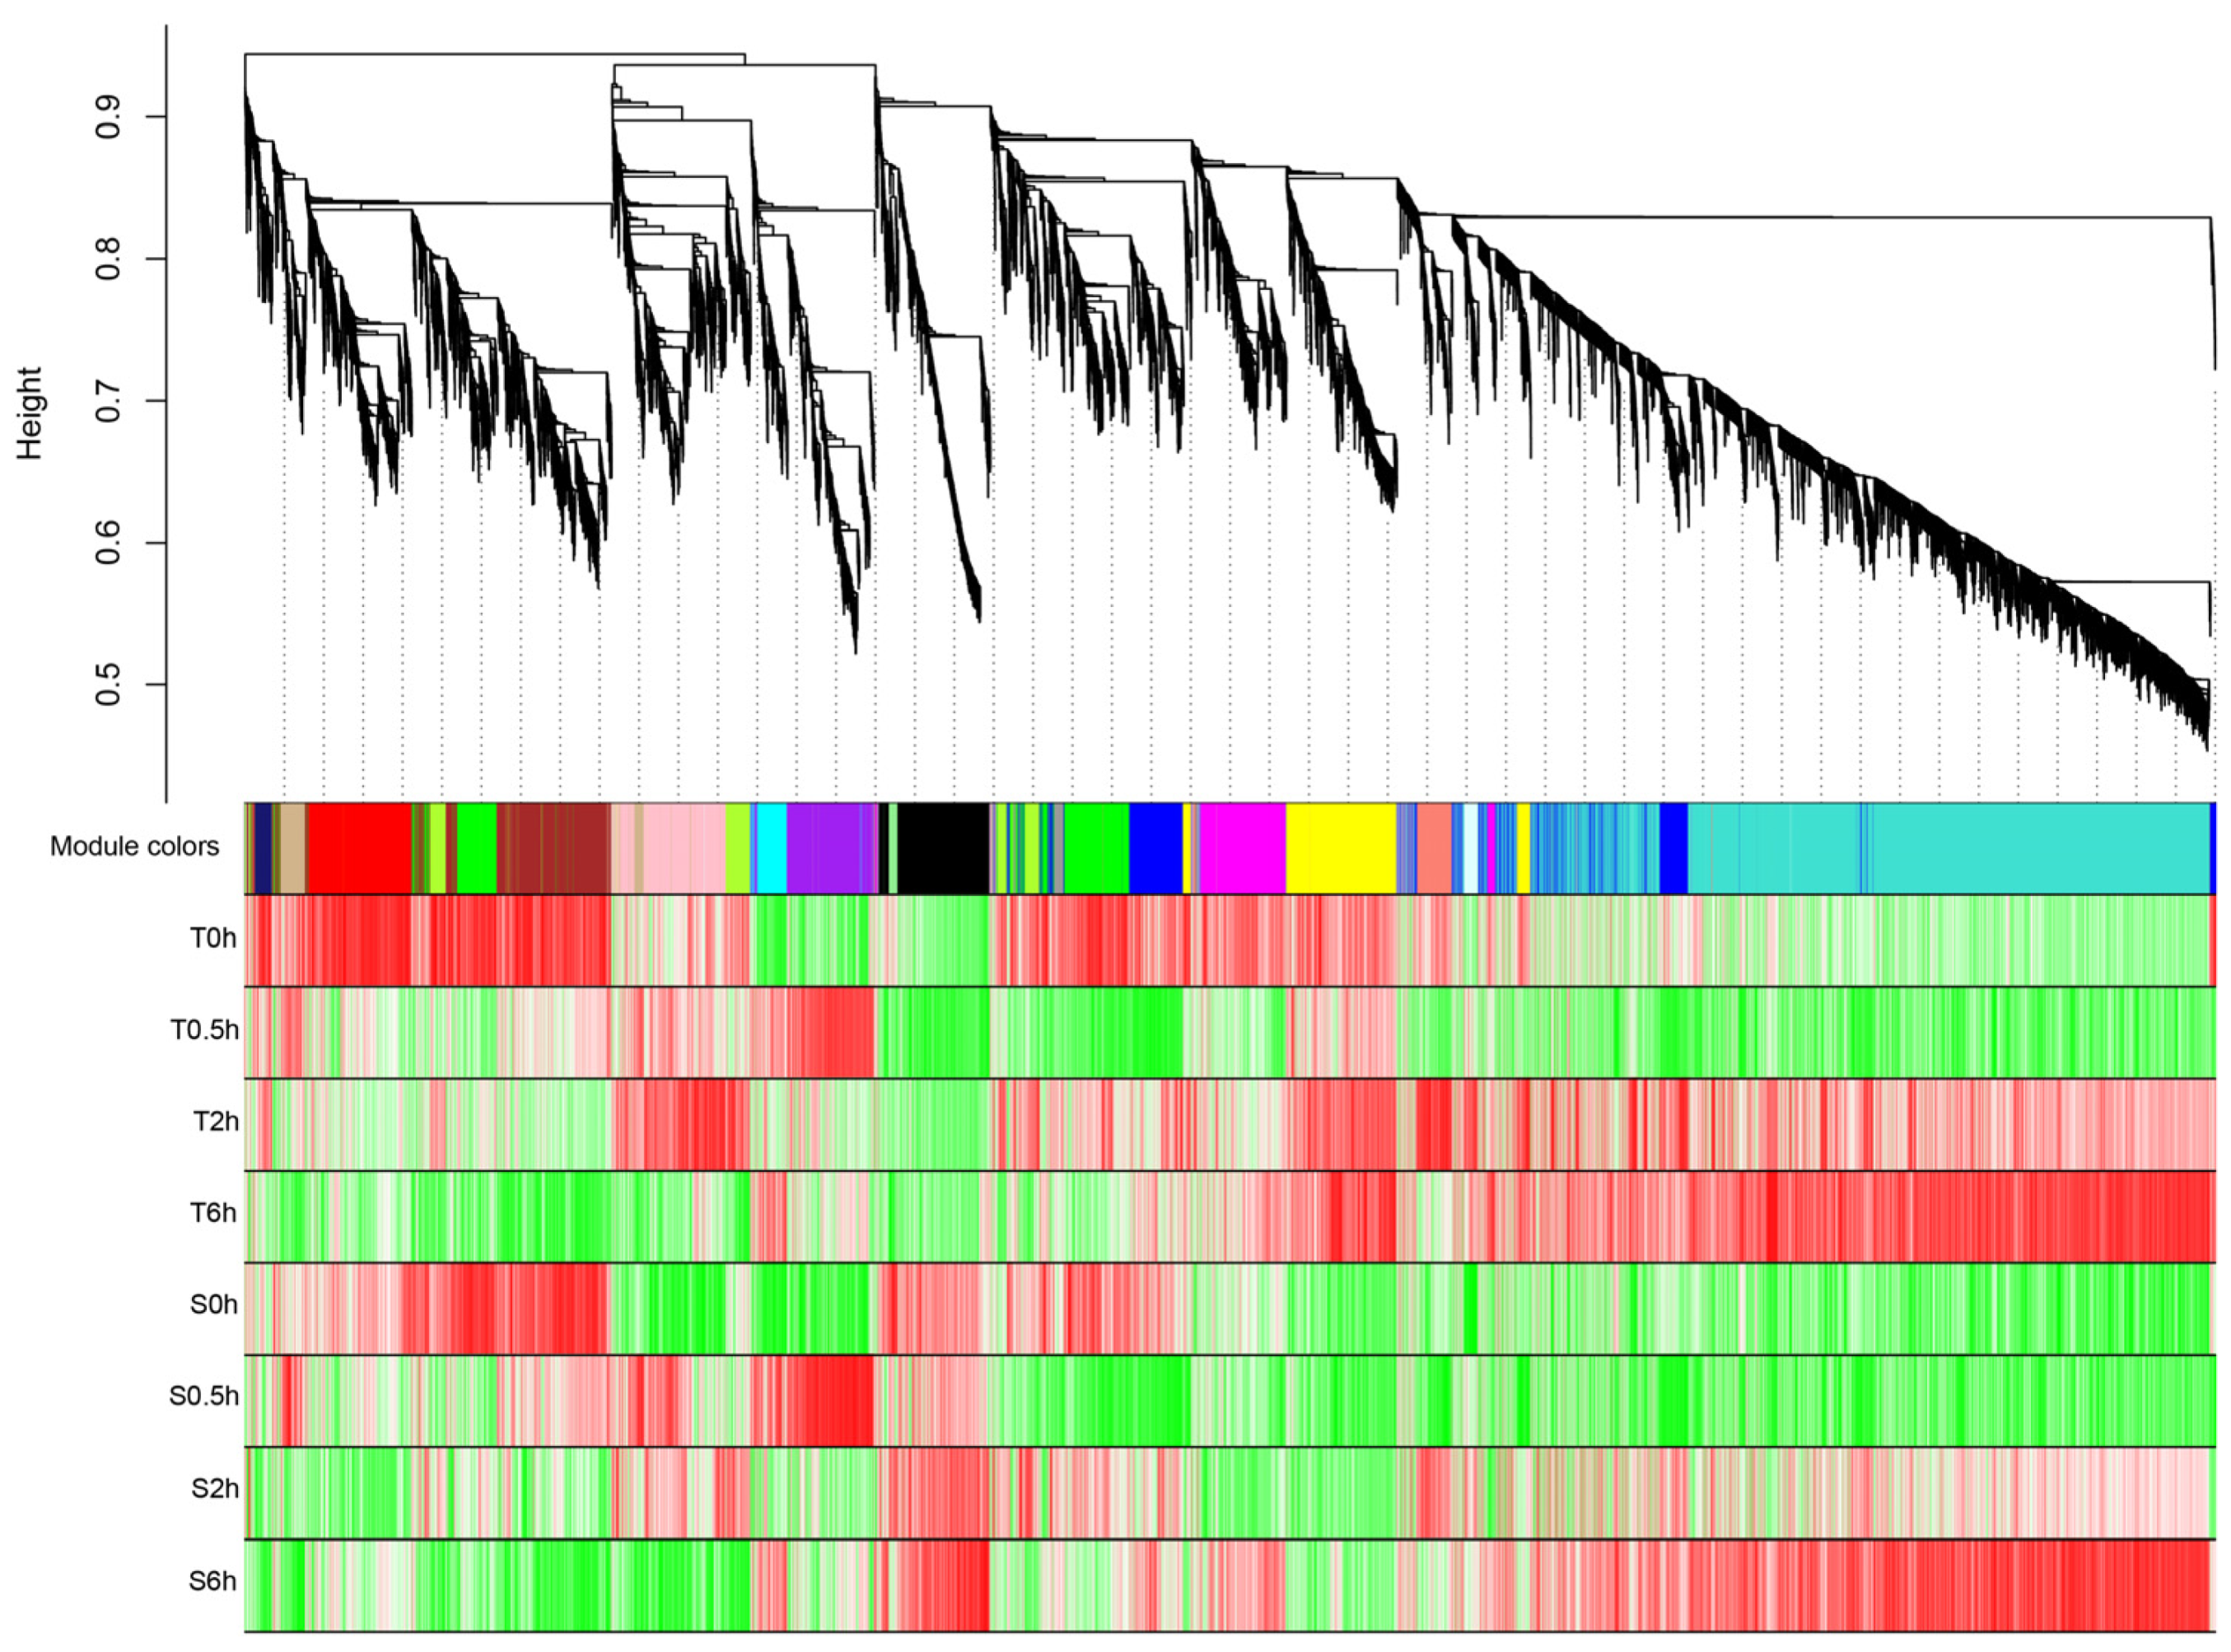
3.2. Key Genes Screening for Heat Tolerance Based on WGCNA Analysis

The present study employed weighted correlation network analysis (WGCNA) to gain deeper insights into the gene expression patterns of two elite pepper lines under different treatments and to identify the characteristic genes associated with heat tolerance. Following filtration, 42,793 genes were selected for the WGCNA. The co-expression network construction was predicated on the gene expression data obtained from all samples. The module comprised a group of genes that exhibited a high degree of interconnectivity, with a consensus that the genes within the cluster displayed a strong correlation. Nineteen modules were identified for different colors (Figure S2), with red indicating a more significant correlation between the module and phenotype and blue indicating a negligible correlation between the module and phenotype. Among the blue–green modules, 4943 genes clustered the most, followed by the blue, brown, green, yellow, red, black, pink, and magenta modules. The clustering genes were 1233, 1114, 1034, 1034, 799, 788, 761, and 739, respectively.
In Figure 2, the upper part of the picture is the gene hierarchical clustering tree, the middle part is the module to which the gene belongs, and the lower part represents a heatmap of the correlation between genes and traits in the module. Two pepper materials selected in this study had different responses to high-temperature stress, with T being a heat-resistant pepper variety and S being a heat-sensitive one. Therefore, based on the analysis of Figure 2 and Figure S2, the correlation between the black module and phenotype aligned with the gene expression patterns of the two lines in response to high-temperature stress.
Therefore, further analysis was conducted on the black module to screen out relevant genes. The expression level was low in the T treatment but high in the S treatment, suggesting that it may be an essential gene for high-temperature stress in pepper fruits; moreover, in the final screening, we identified 30 core genes that may involve responses to high-temperature stress (Table S5).

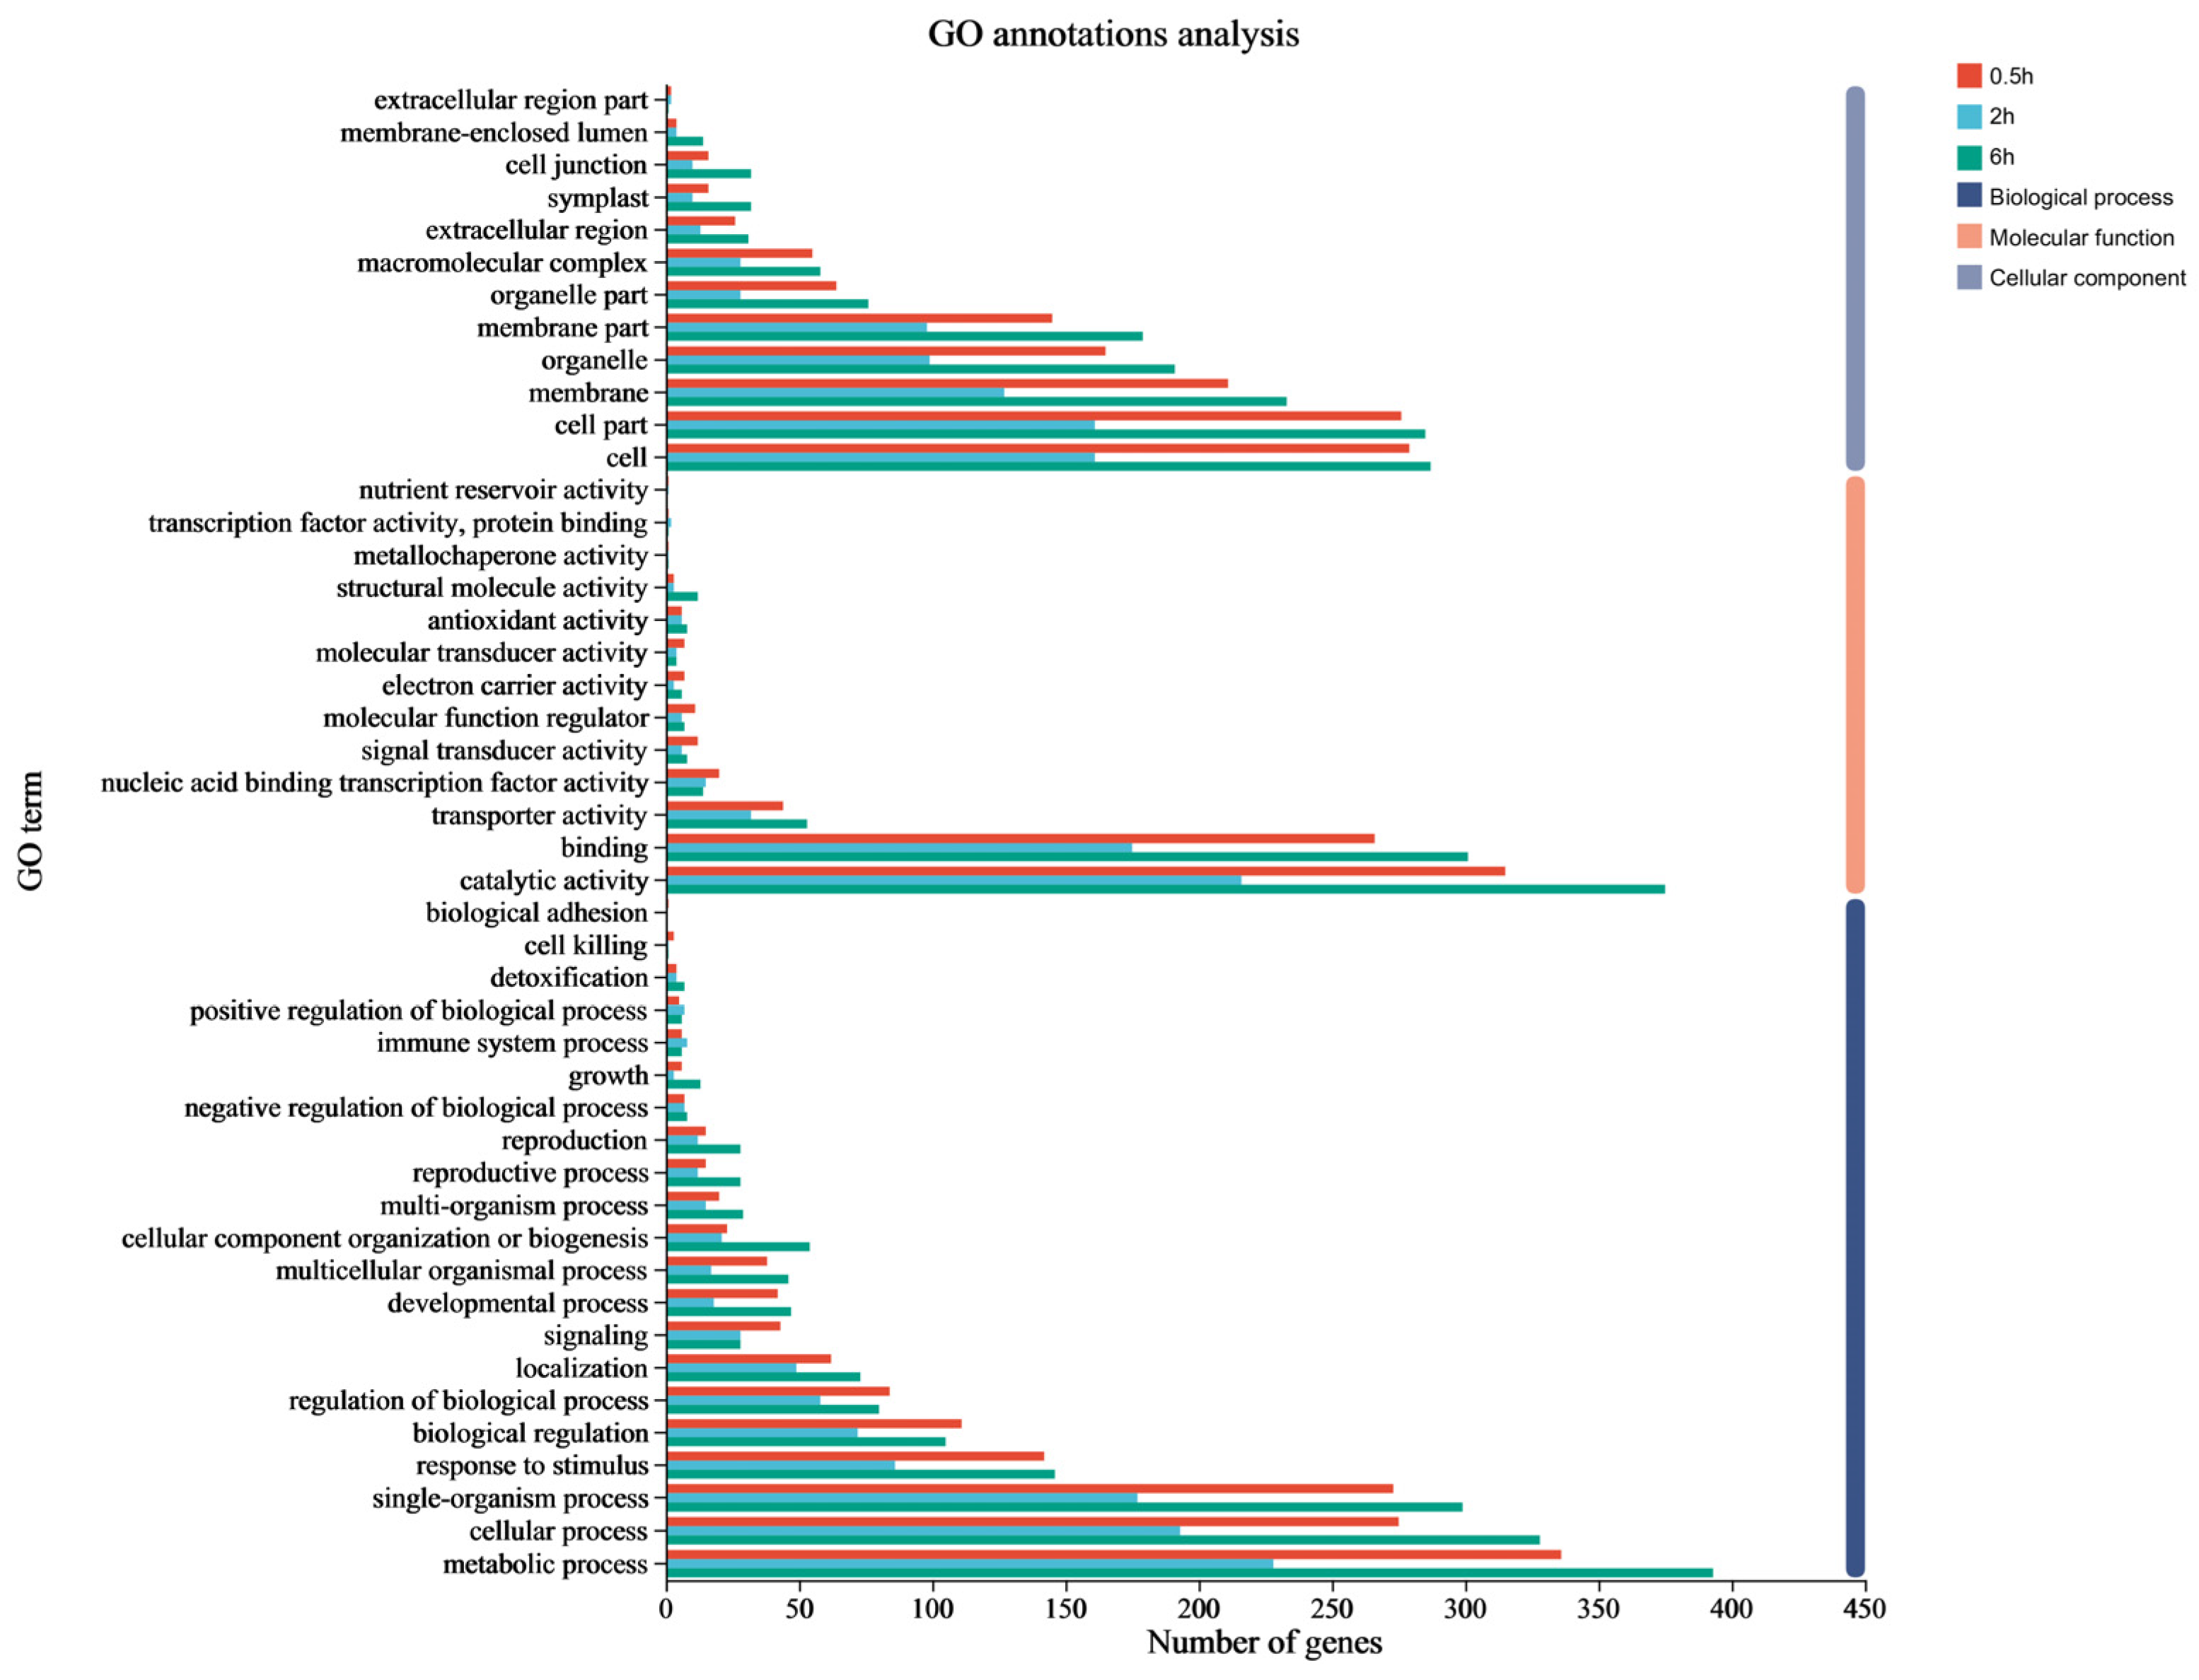
3.3. Functional Annotation by GO

A total of 2324 DEGs was categorized into three major categories: “biological process (BP)”, “cellular component (CC)”, and “molecular function (MF)”. Based on GO assignments, these three categories constituted 46 functional groupings (Figure 3). The main functional divisions within the BP category were the “metabolic process”, “cellular process”, “single-organism process”, “response to stimulus”, and “biological regulation”. The top six significant gene ontology terms differed in the different time points with the same GO process. For instance, the glucuronate metabolic process, cellular glucuronidation, flavonoid glucuronidation, and uranic acid metabolic process were significantly enriched in the 0.5 h and 2 h time points, while the flavonoid biosynthetic process was enhanced considerably in the 2 h and 6 h time points (Table S6).
In the “CC” category, “cell’, “cell part’, “membrane”, “organelle”, and “membrane part” were the dominant functional types in three time points. The top six significant GO terms during three time points are shown in Table S7. Specifically, only three GO terms were enriched at 0.5 h. Among them, protein histidine kinase complex, plant-type cell wall, and photosystem II terms were significantly enriched in the 2 h and 6 h time points.
The dominant functional types observed during three time points in the “MF” category were catalytic activity, binding, transporter activity, and nucleic acid binding transcription factor activity. The terms “monooxygenase activity”, “oxidoreductase activity, acting on paired donors, with incorporation or reduction of molecular oxygen”, “tetrapyrrole binding”, and “quercetin 7-O-glucosyltransferase activity” exhibited significant enrichment in both the 0.5 h and 2 h intervals (Table S8).
Interestingly, the glucosamine-containing compound catabolic/metabolic process (GO:1901071, GO:1901072) term in the “BP” category and quercetin 3/7-O-glucosyltransferase activity (GO:0080043, GO:0080044) terms in the “MF” category were both involved in glucose. Hence, there may exist a correlation between the glucose process and the heat resistance of pepper.

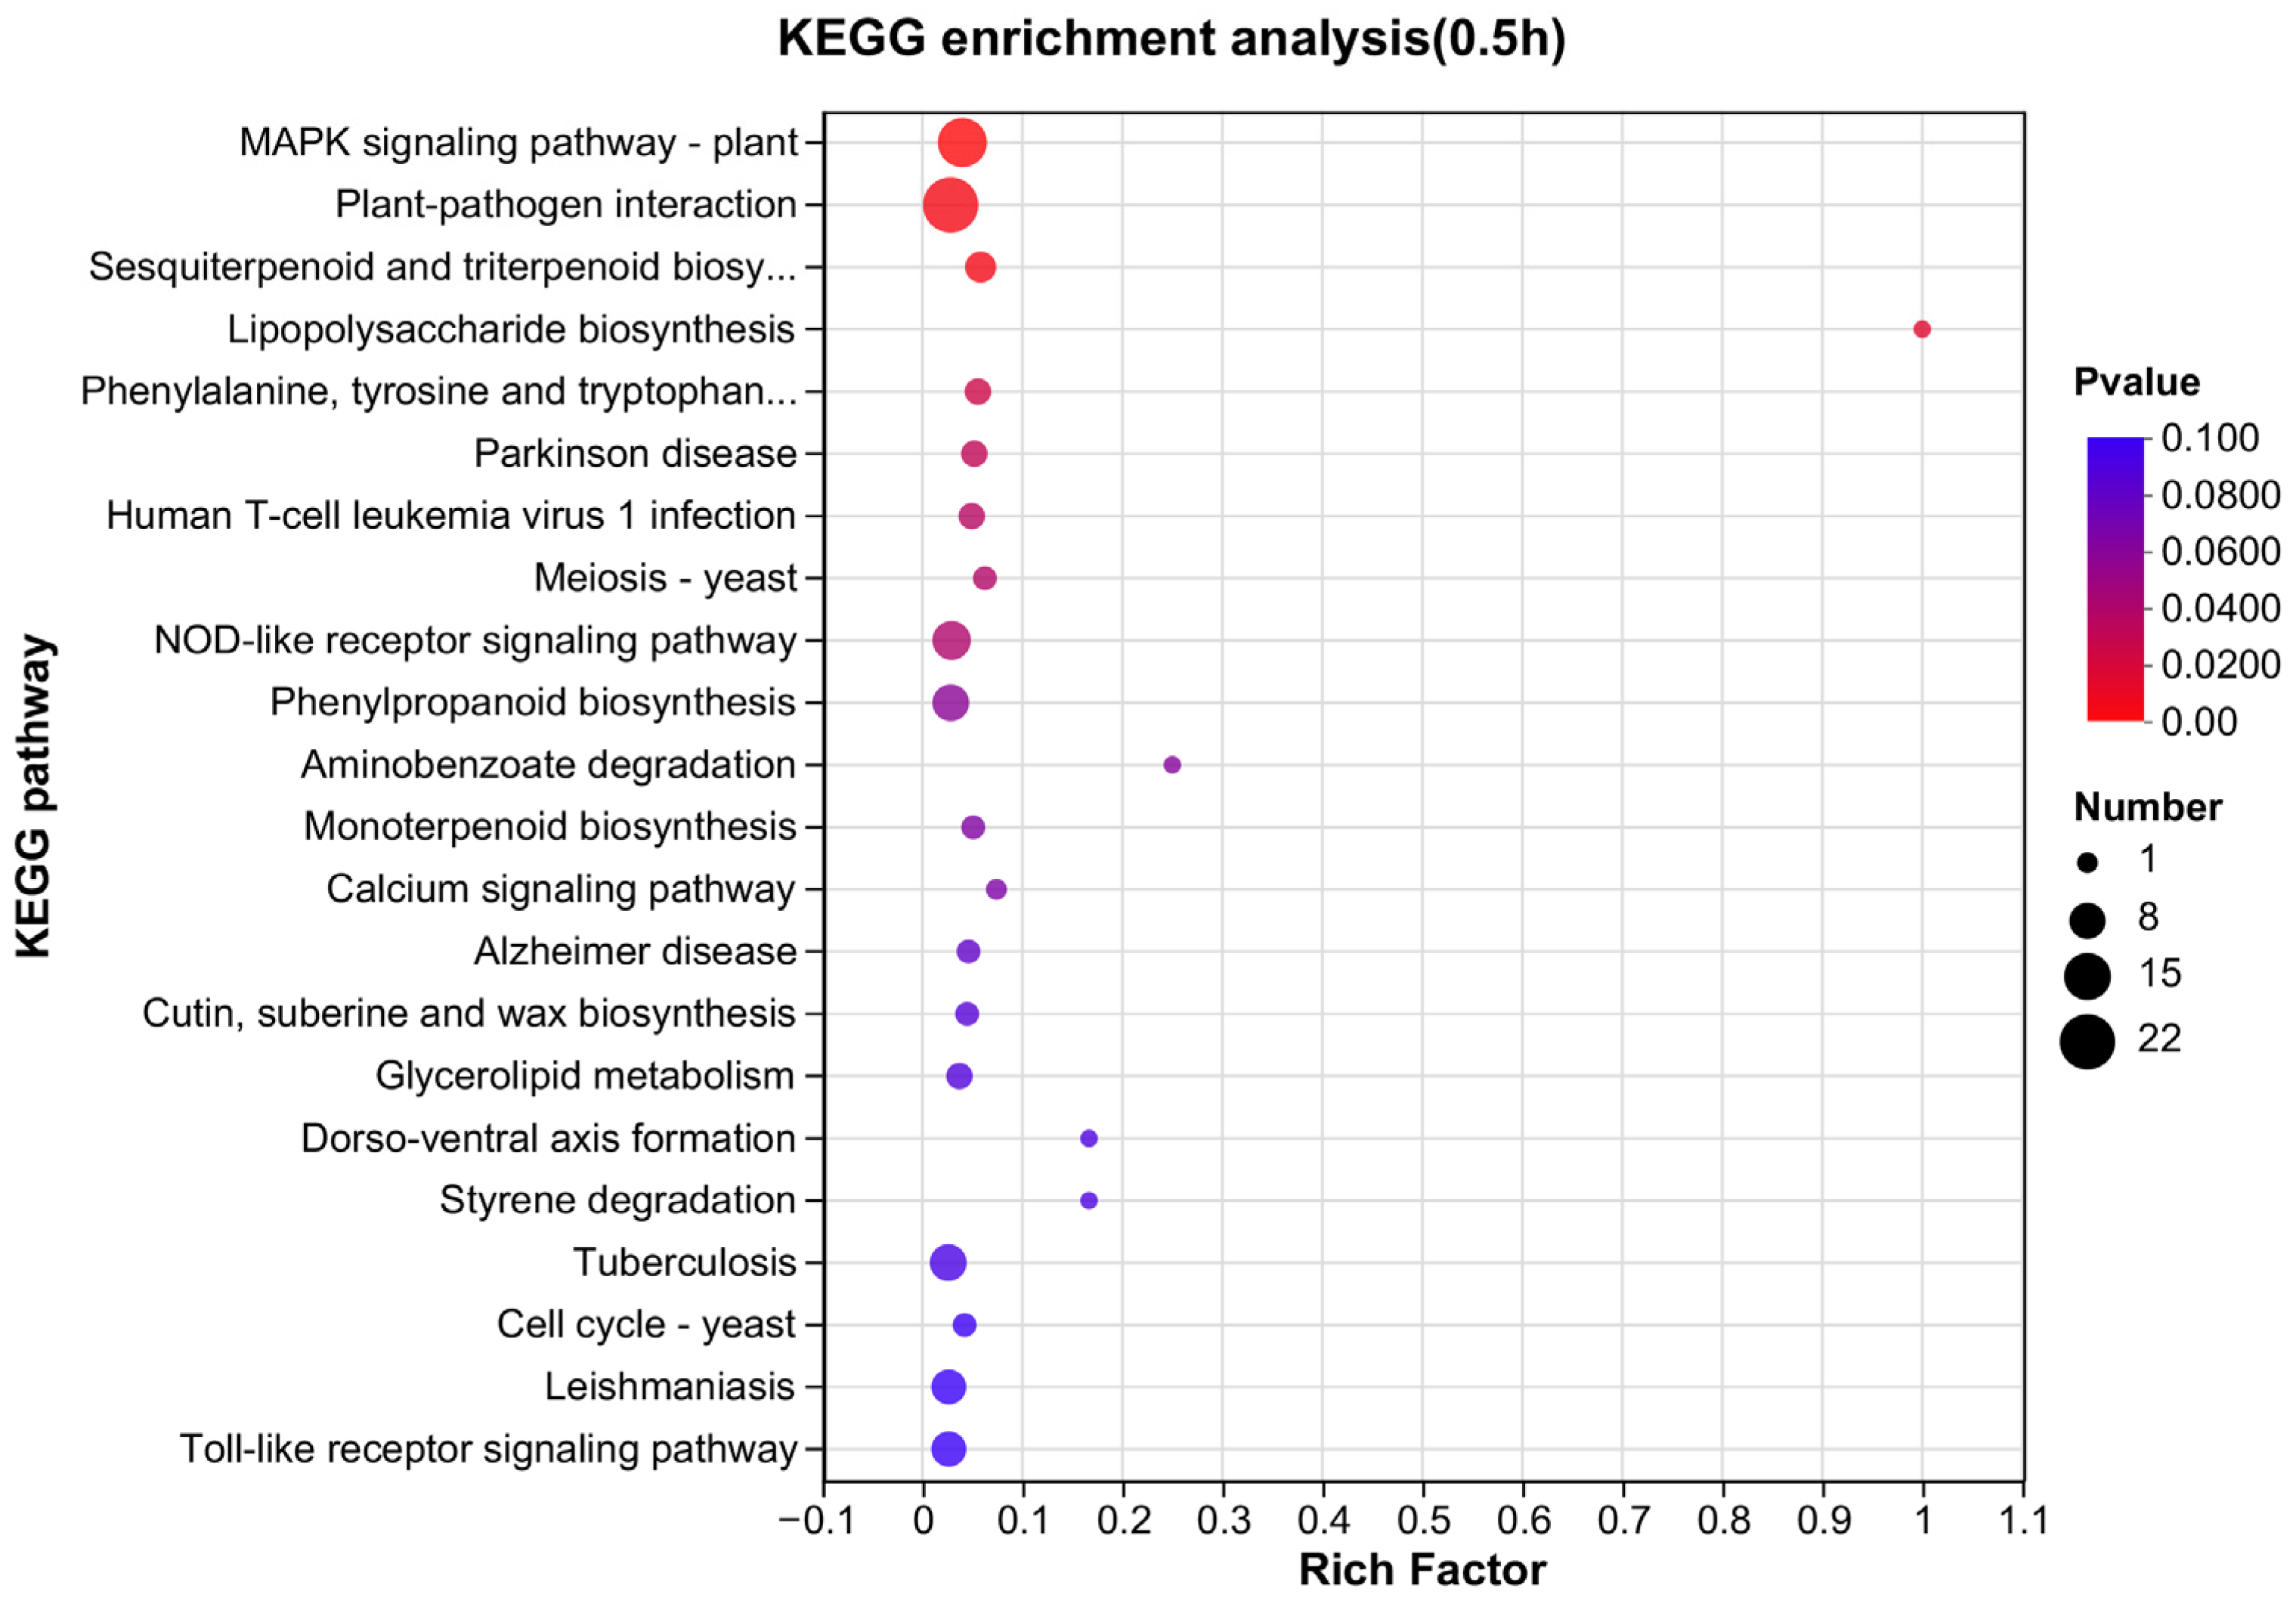
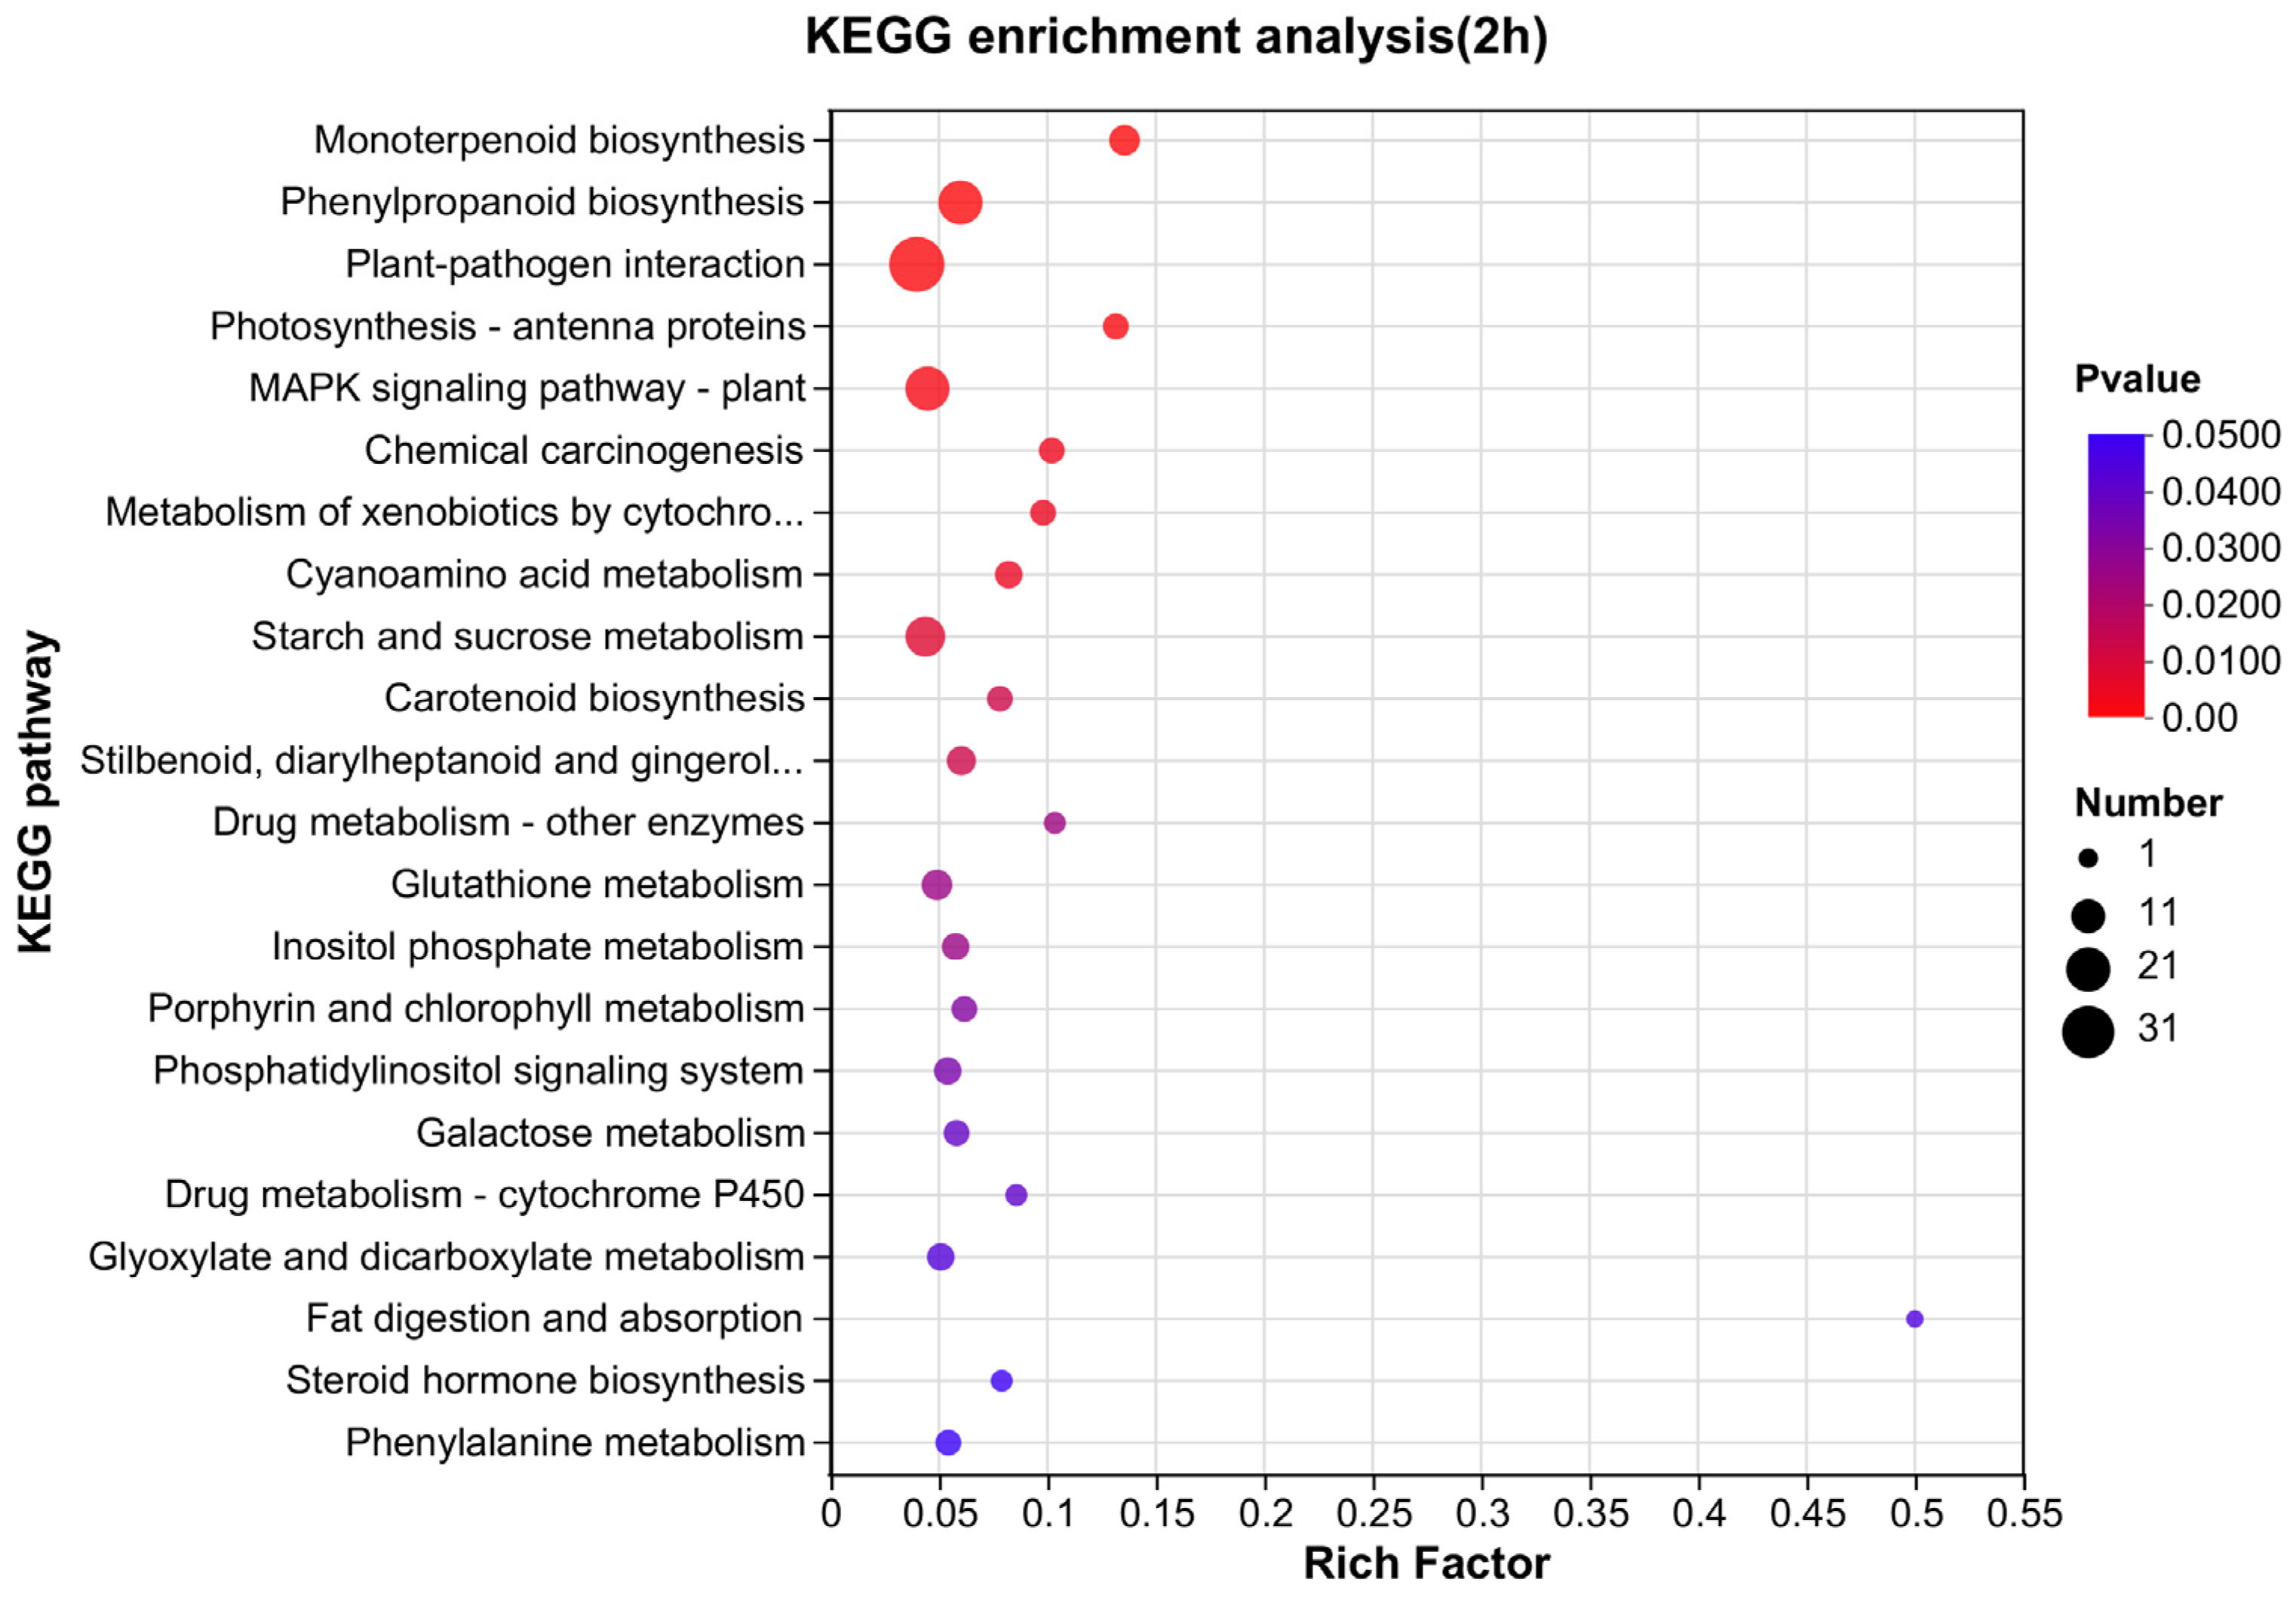
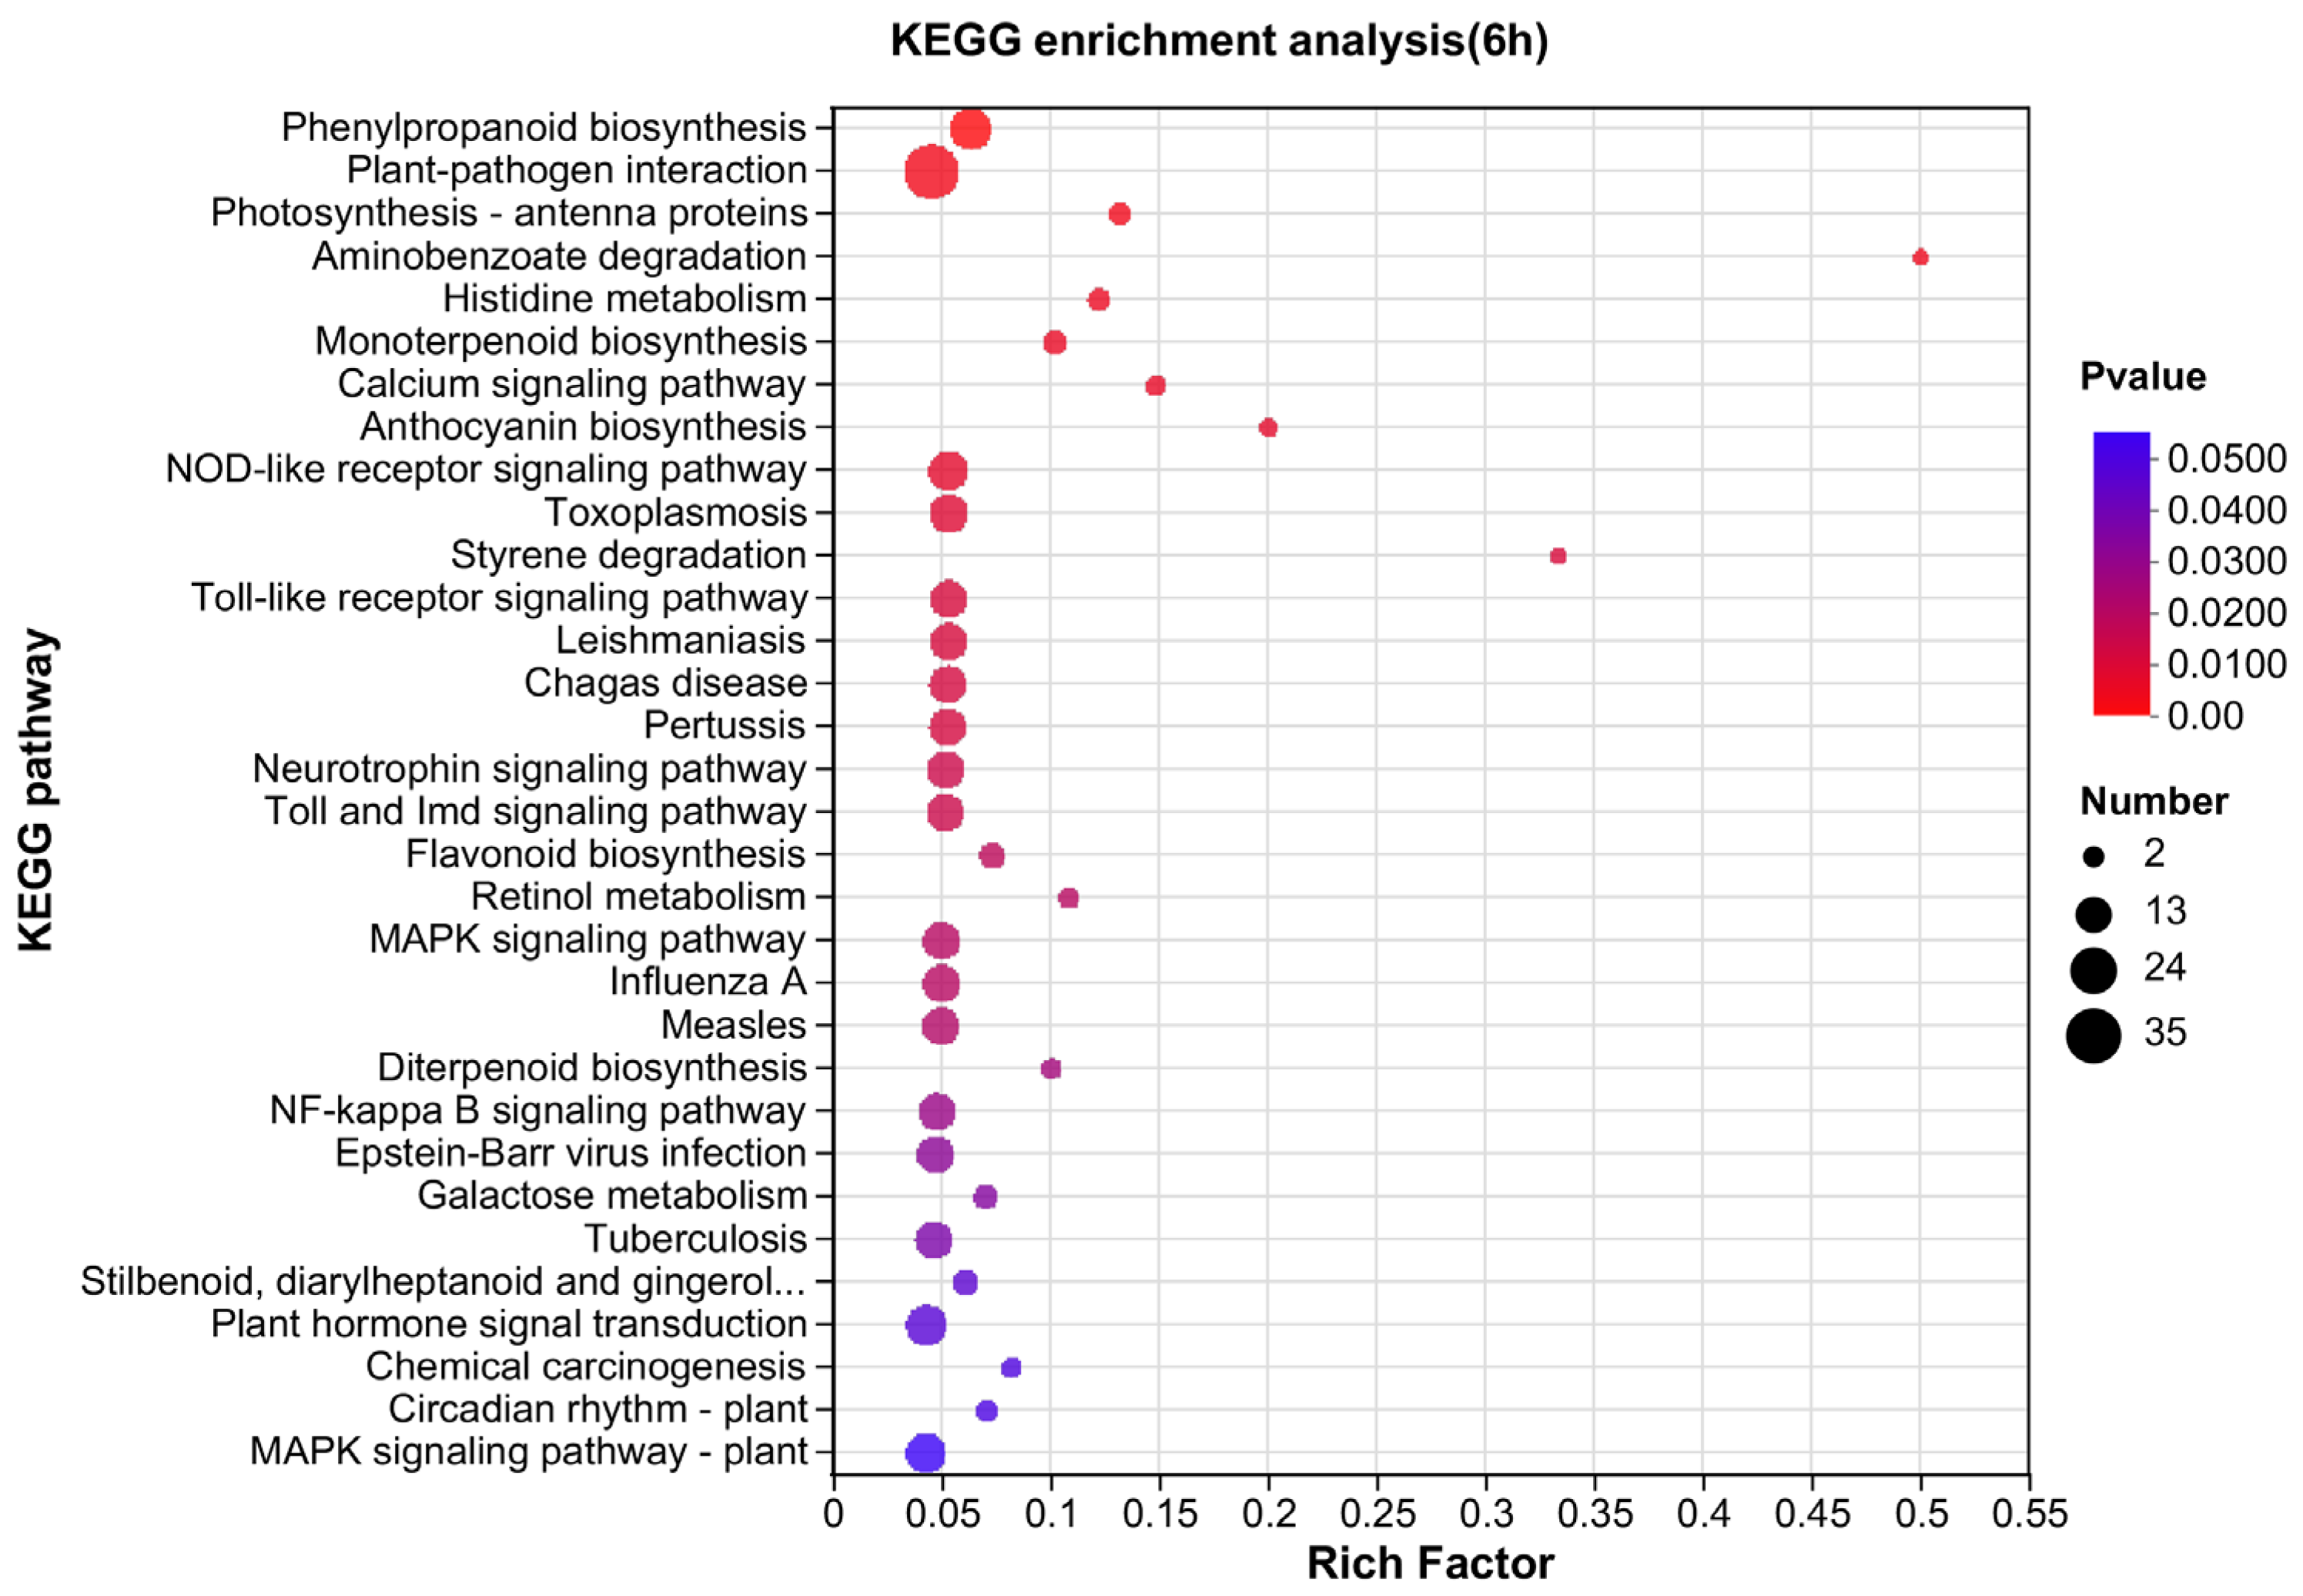
3.4. Pathway Mapping by KEGG

The KEGG database was utilized to conduct functional annotation and pathway enrichment analysis of DEGs. DEGs exhibited enrichment in 153, 143, and 168 pathways across three time points. Among these pathways, 3, 22, and 31 (Figure 4, Figure 5 and Figure 6; Table S9) were significantly enriched in the 0.5 h, 2 h, and 6 h time treatments, respectively. Plant–pathogen interactions were significantly enhanced in the 0.5 h and 2 h time treatments. “Galactose metabolism”, “Monoterpenoid biosynthesis”, “Phenylpropanoid biosynthesis”, “Photosynthesis—antenna proteins”, “Starch and sucrose metabolism”, and “Stilbenoid, diarylheptanoid, and gingerol biosynthesis” were significantly enriched in the 2 h and 6 h time treatments. It is worth mentioning that the “MAPK signaling pathway” was significantly enriched in all of the three treatments, which may be related to the heat resistance of pepper.

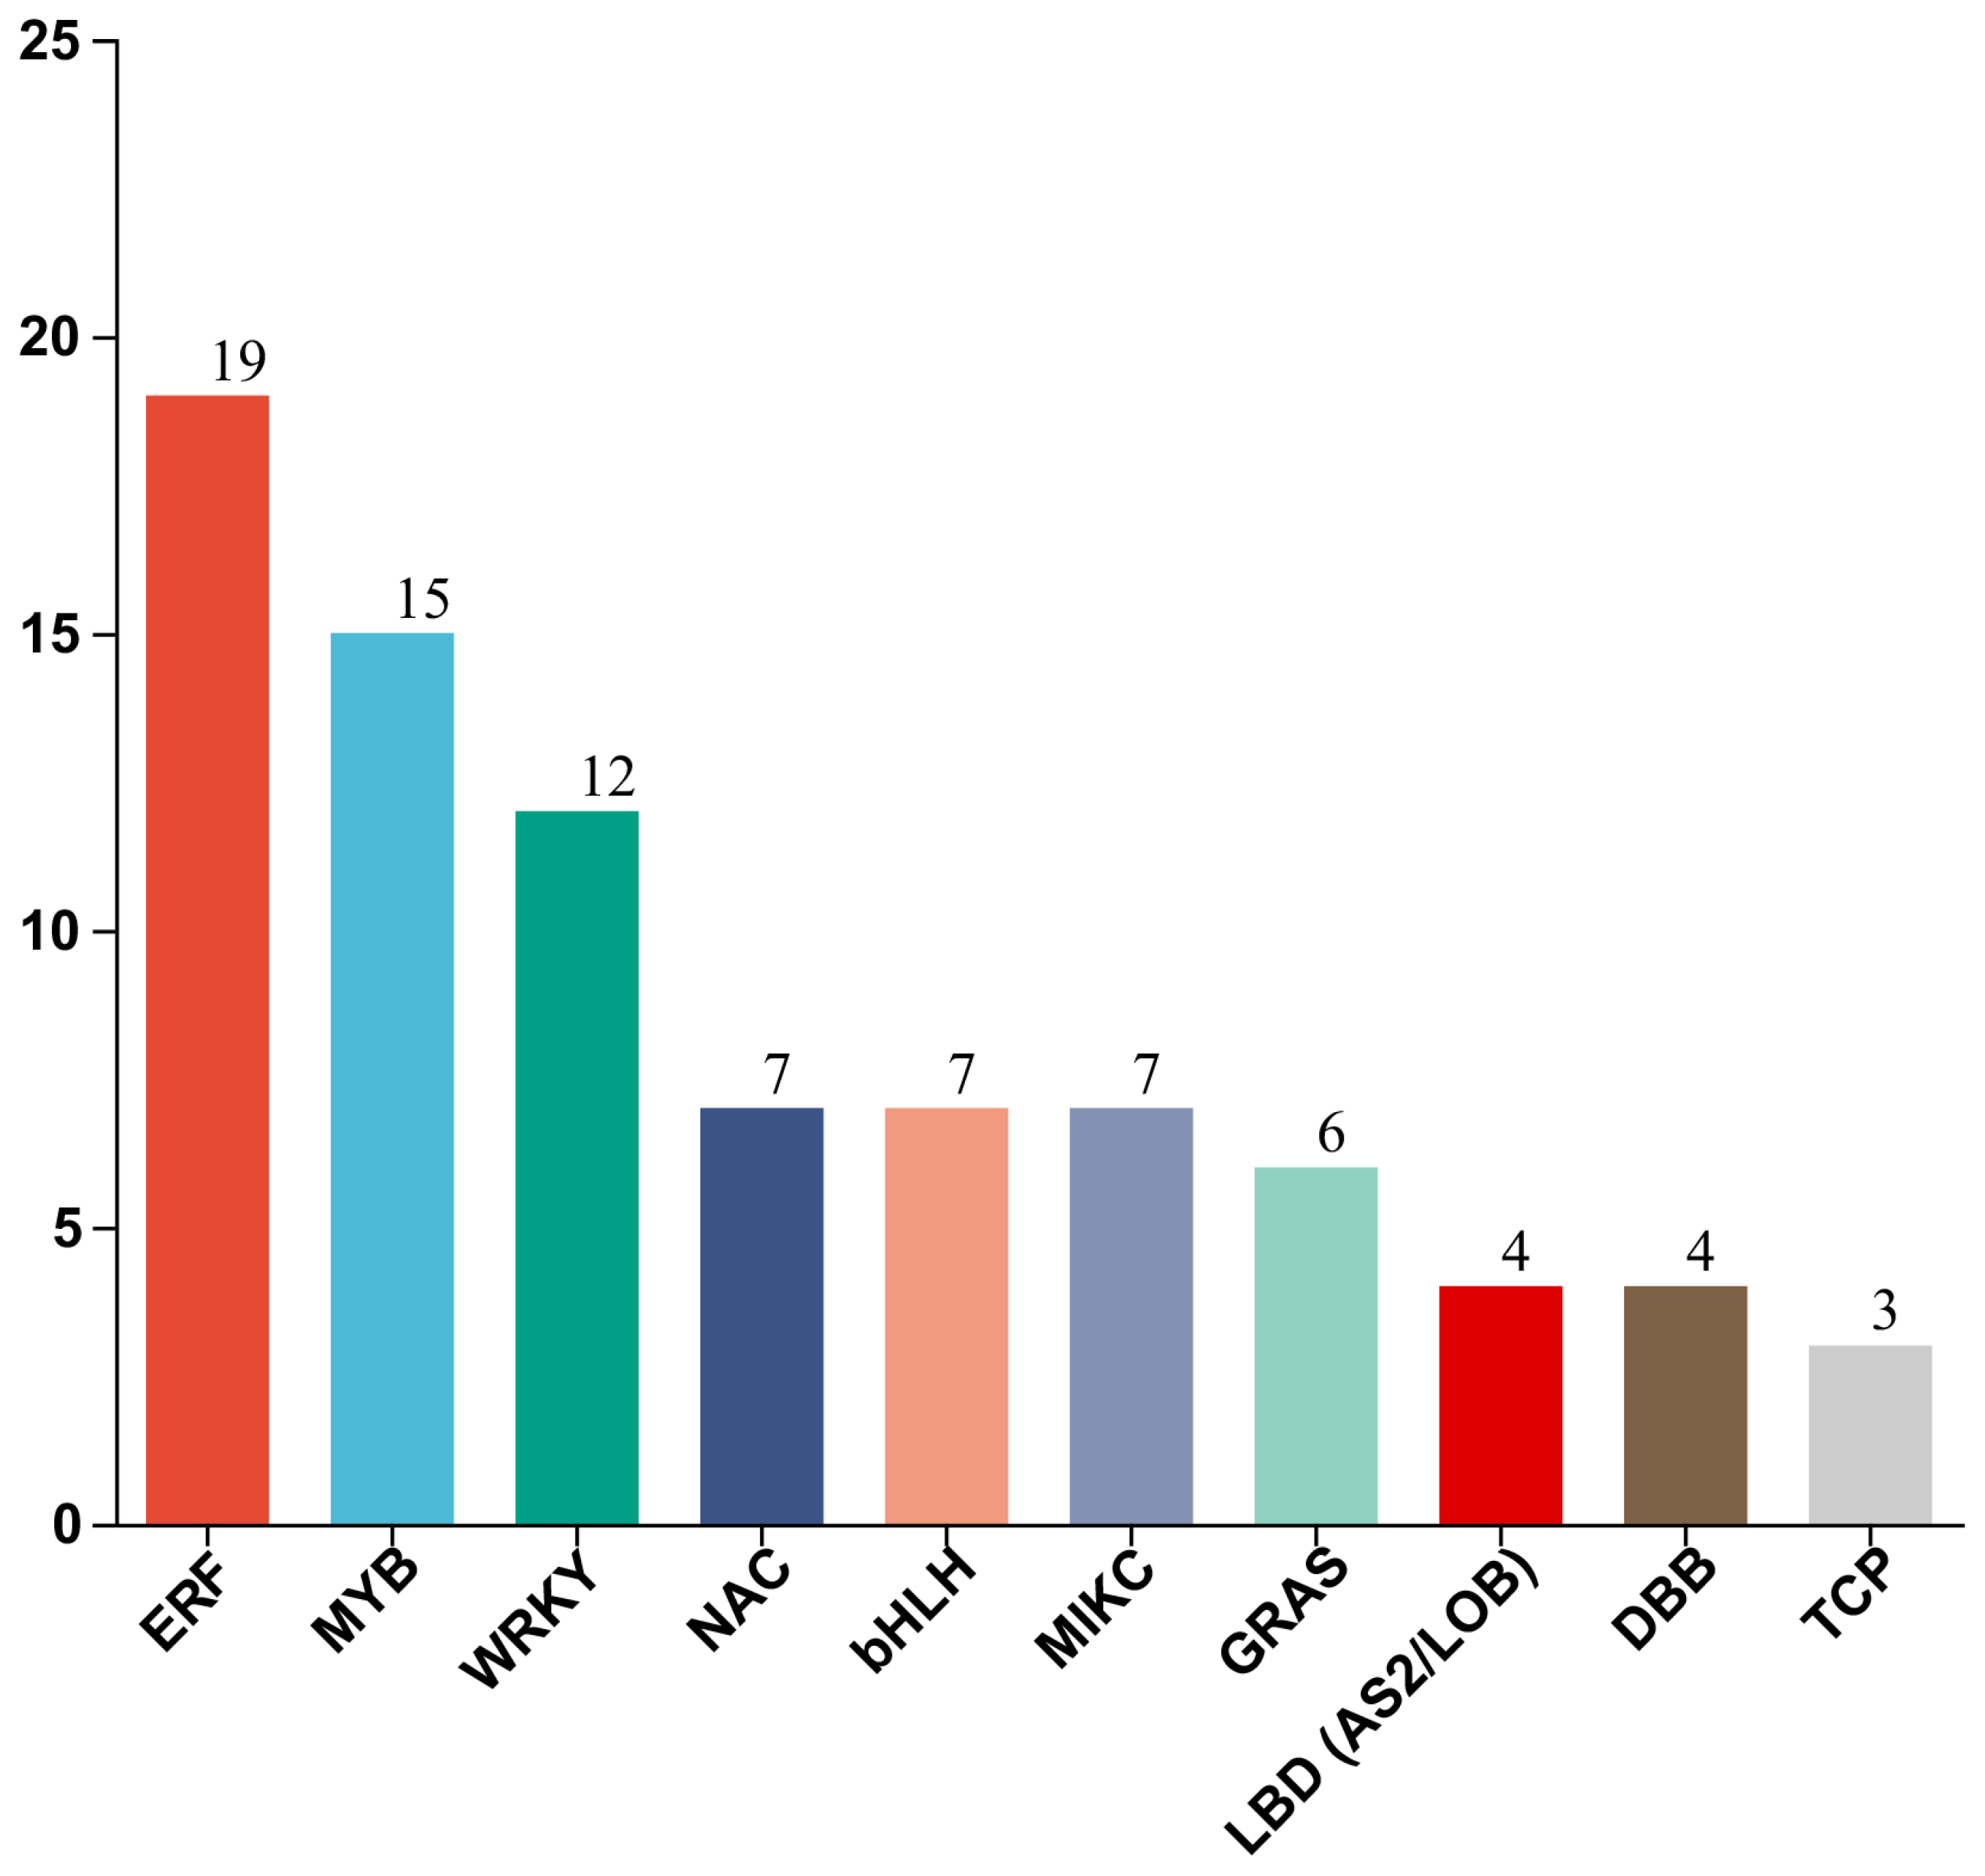
3.5. Identification of Differentially Expressed TFs

The TFs of the DEGs were examined at three time points (0.5 h, 2 h, and 6 h) in both the S and T lines of pepper. The identification of TFs was carried out by predicting all DEGs. In total, 113 TFs were identified, with 29 being upregulated and 84 being downregulated. Among these, 6 upregulated and 23 downregulated TFs were identified during the 0.5 h treatment, 35 upregulated and 15 downregulated TFs were identified during the 2 h treatment, and 25 upregulated and 20 downregulated TFs were identified during the 6 h treatment in T (Table S10). These TFs were classified into 26 families, including ERF (19), WRKY (12), MYB (15), NAC (7), bHLH (7), MIKC (7), GRAS (6), and 40 other TFs, as shown in Figure 7.
ERF is one of the most abundant TF family, from which 6 TFs were found downregulated at 0.5 h and 2 h treatment points. Eleven ERF TFs were upregulated in line T at 6 h, while only 1 ERF TF was downregulated in line T. This indicated that the ERF TF family is down-regulated in the early stage and then up-regulated later during the high-temperature stress of pepper fruits. It illustrated the significant correlation between the ERF TF family and the heat tolerance of pepper fruits.
Furthermore, a few identical TFs was discovered during three treatments. TF LBD (AS2/LOB) was found upregulated during the 0.5 h, 2 h, and 6 h time periods. The TFLOC107840187 was downregulated at 2 h, while the rest were upregulated. The upregulation of LBD (AS2/LOB) TFs may be related to the heat tolerance of pepper fruits.
In addition, HSF (heat stress TF A-4c-like) (LOC107878458), a TF directly related to HS, was identified in the 6 h time period and upregulated in the heat-resisting pepper line T. This TF needs to be further evaluated in future studies. The results of this study unveiled an intricate network of TFs that play a role in the development of heat tolerance in pepper plants.

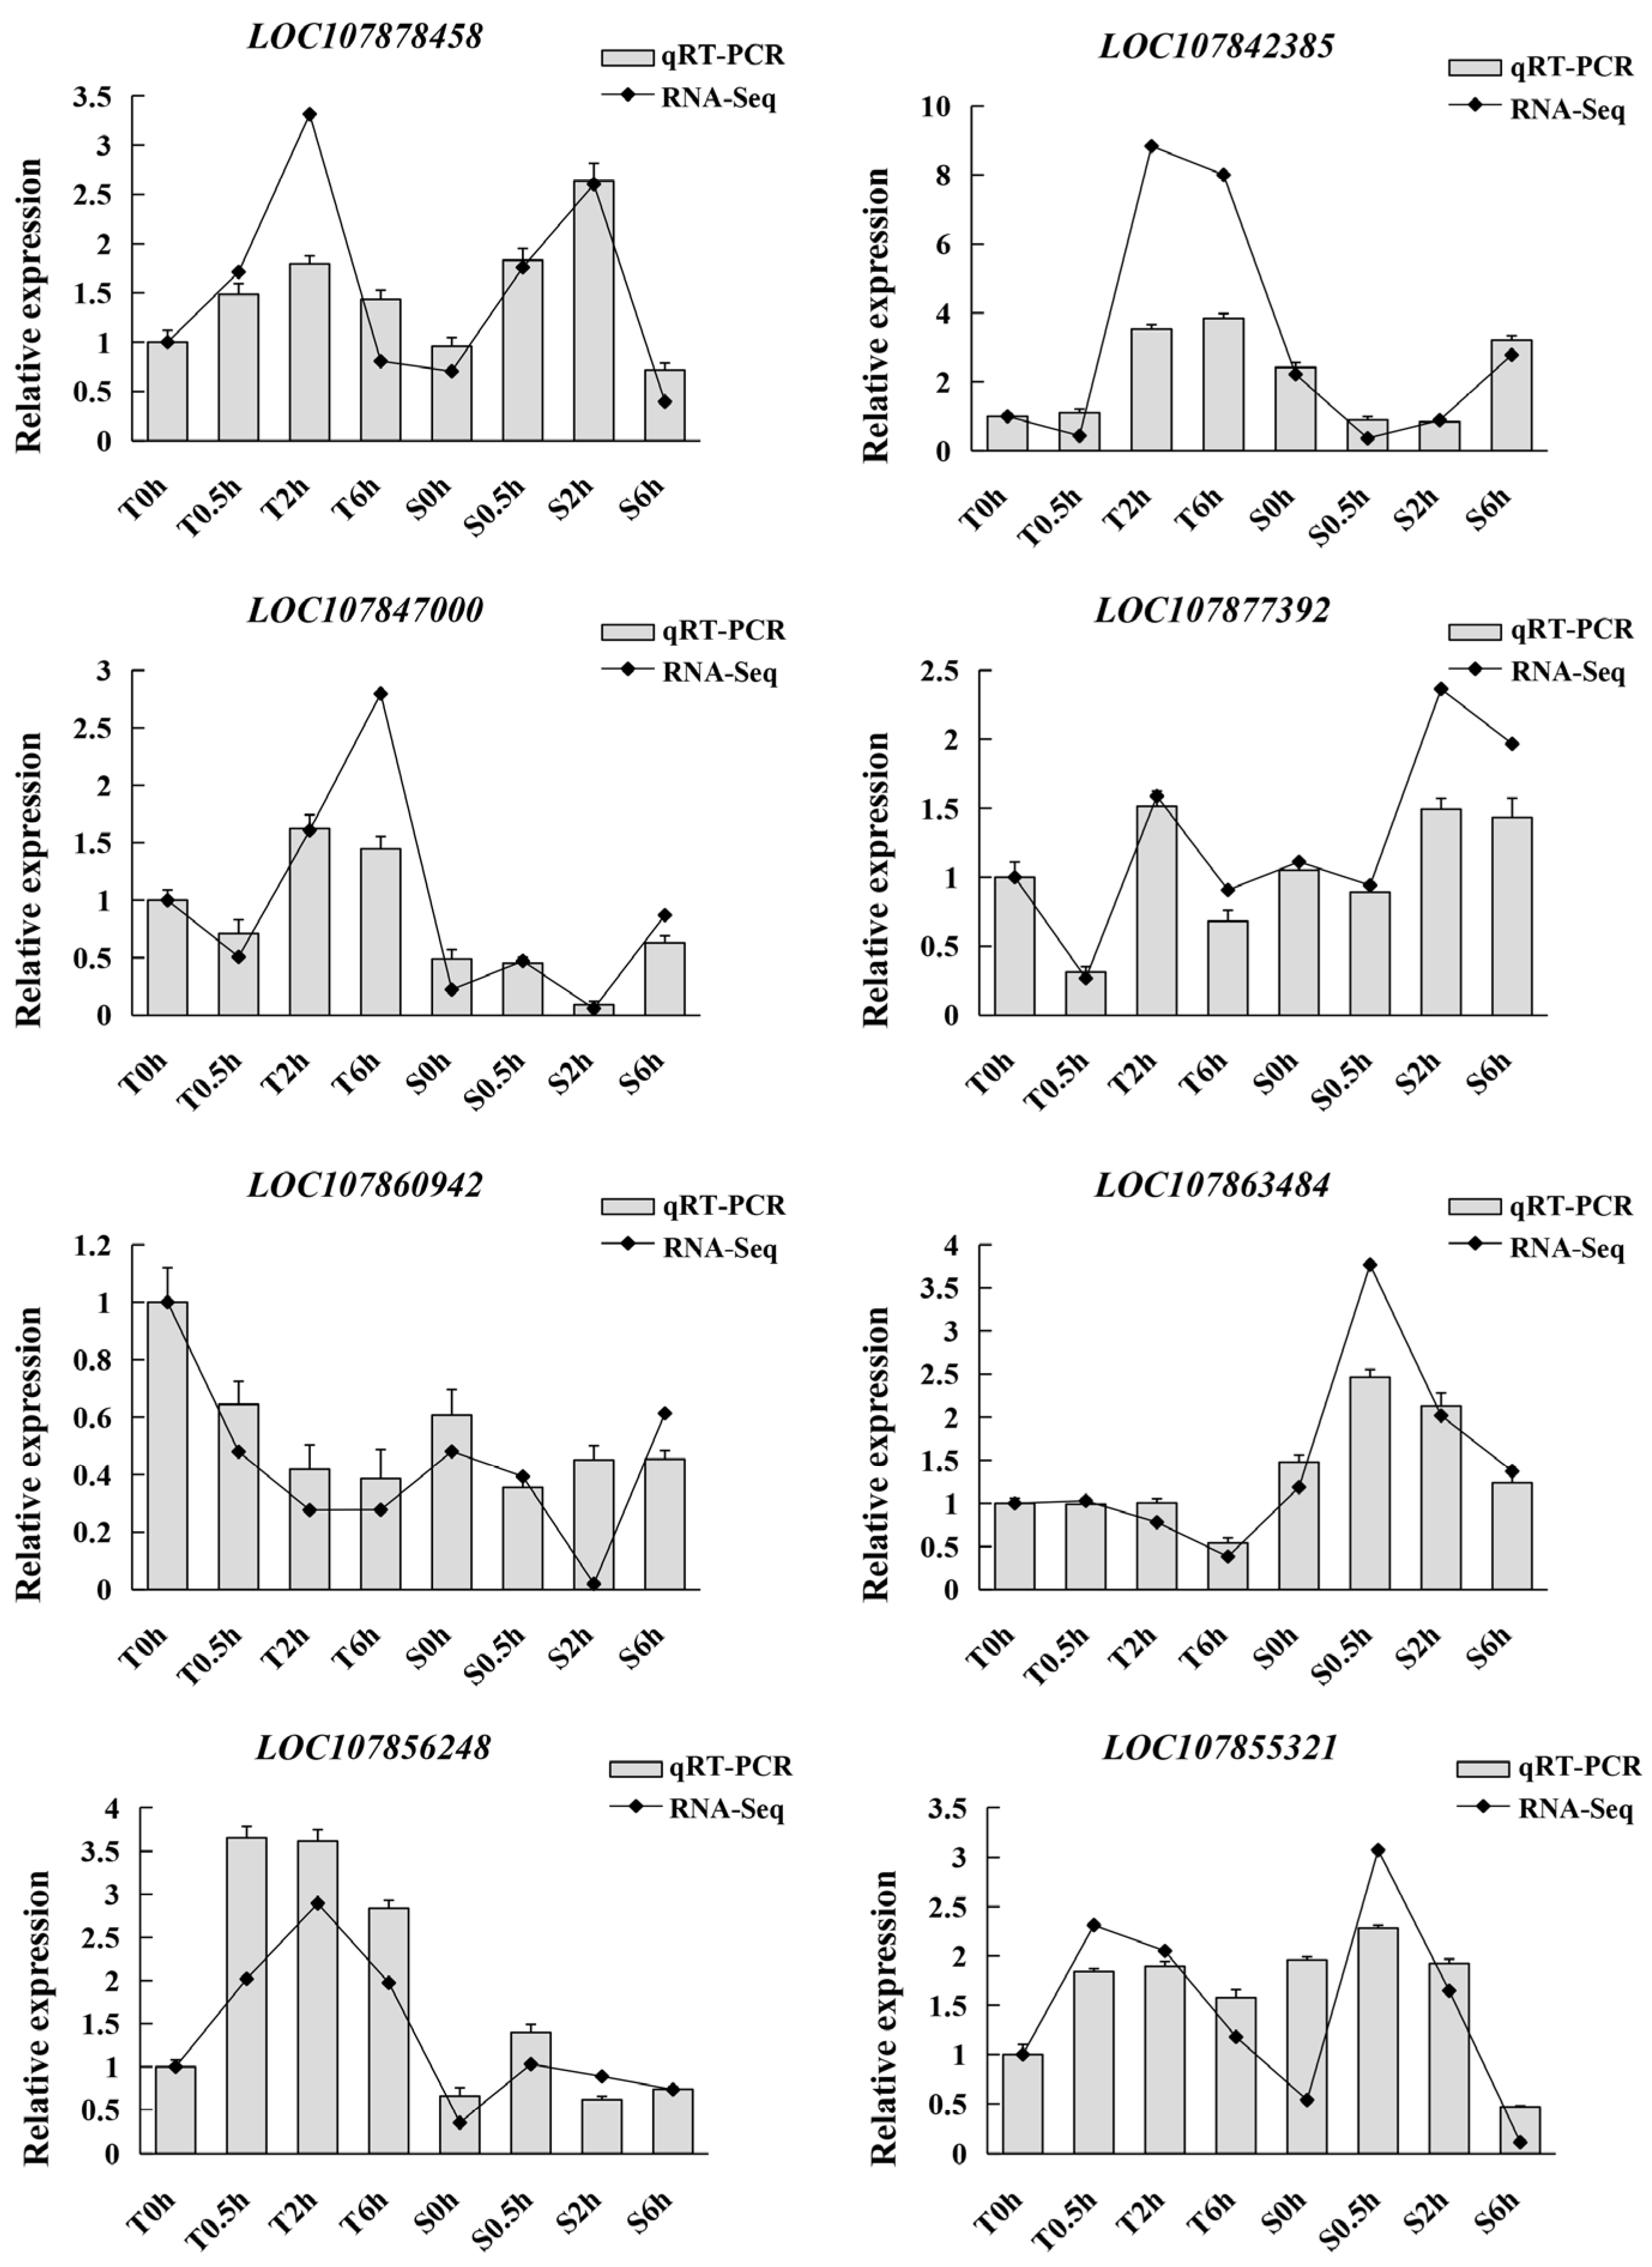
3.6. Validation of RNA-Seq Data by qRT-PCR

To ascertain the accuracy of the RNA-seq data, we utilized qRT-PCR to assess the transcriptional levels of eight DEGs that were selected. These eight DEGs include one HSF (LOC107878458), two HSPs (LOC107842385, LOC107847000), three bZIPs (LOC107877392, LOC107860942), and three WRKYs (LOC107863484, LOC107856248, LOC107855321). The DEGs were chosen to encompass various expression levels and patterns. All DEGs were found to be implicated in the reaction to thermal stress. The observed expression patterns of the eight DEGs were consistent between the RNA-Seq analysis and qRT-PCR results (Figure 8). The findings suggest that the RNA-Seq results were reliable.

4. Discussion

High temperature is a critical climatological component affecting plant growth and development, resulting in losses in agricultural production [32]. Heat stress perturbs plant antioxidant responses, heat shock responses, water homeostasis, and secondary metabolism. Additionally, it affects genes associated with photosynthesis, carbohydrate metabolism, and protein synthesis [33]. Pepper plants exhibit thermophilic characteristics but are sensitive to high temperatures, wherein temperatures exceeding 32 °C adversely affect pollination and yield. Despite extensive research on the physiological and molecular aspects of heat stress in pepper seedlings, the molecular response of pepper during the fruiting stage to heat stress remains poorly understood [3,4,5]. Numerous studies have demonstrated that the heat tolerance of plants is contingent upon the genetic makeup of distinct species, exhibiting genetic variations in their response to high temperature stress [34]. Profiling differentially expressed genes from the transcriptomes of heat-tolerant materials subjected to high-temperature stress represents an efficacious approach for identifying candidate genes associated with heat tolerance.
To enhance our comprehension of pepper’s response to heat stress, elucidating its underlying molecular mechanisms is imperative. In this investigation, we conducted RNA-seq analysis at three time points (0.5 h, 2 h, and 6 h) to ascertain the heat-induced transcriptomic changes in two pepper genotypes during the fruiting stage, thereby gaining molecular insights into the heat stress response. Our analysis identified 2324 significantly differentially expressed genes, as depicted in Table S4. The findings indicate that heat stress induces alterations in the expression of genes implicated in diverse processes encompassing photosynthesis, stress response, carbohydrate metabolism, and protein folding [35]. To validate the accuracy of the transcriptomic sequencing outcomes, we randomly selected eight genes exhibiting substantial expression level disparities for RT-qPCR analysis encompassing Hsp genes, Hsf genes, WRKY genes, and bZIP transcription factors. The analysis demonstrated that the expression trends of these eight DEGs under heat stress concurred with the transcriptomic results, thereby further corroborating the dependability of the transcriptomic data.
The amalgamation of RNA sequencing and weighted correlation network analysis (WGCNA) has emerged as a significant and cost-effective methodology for discerning pivotal genes and their interactions pertaining to stress-related functionalities. Since its introduction by Langfelder and Horvath in 2008, WGCNA has been instrumental in identifying numerous crucial genes associated with plant phenotypic traits and responses to biological or abiotic stressors [30]. For instance, Kuang et al. investigated banana fruit, employing WGCNA to construct a transcriptional regulatory network governing ethylene-mediated fruit ripening. This approach led to the identification of 25 key transcription factors that regulate downstream ripening-related genes, thus contributing to the fruit ripening process [36]. Similarly, Greenham et al. analyzed the transcriptomic changes in Brassicaceae crops during the initial response to drought stress, utilizing WGCNA to uncover six core genes associated with drought stress resistance, including Cell Response Regulator 3 (CRR3), Plastid-Specific Ribosomal Protein 6 (PSRP6), and PIN-FORMED 3 (PIN3) [37]. In our study, following the discrete analysis of the samples, we conducted WGCNA analysis to construct a gene co-expression module and calculate the correlation between the module and phenotype. To the best of our knowledge, no cluster analysis of these heat stress genes has been performed in pepper, specifically in the context of investigating key heat stress genes across different genotypes. Therefore, we integrated RNA sequencing data from two genotypes with the studied heat stress genes, enabling the identification of key gene sets and critical metabolic response pathways. Moreover, in the hierarchical clustering analysis of these gene modules, we observed both negative and positive correlations with the phenotype, unveiling an intricate network of connections between genes and phenotype.
GO and KEGG enrichment analyses were conducted on the 2324 DEGs from the two genotypes, unveiling intriguing findings. The GO analysis categorized the DEGs into three primary domains: “biological process (BP)”, “cellular component (CC)”, and “molecular function (MF)”. These domains encompassed 46 functional groupings. KEGG pathway analysis annotated and enriched the DEGs in diverse pathways, with 153, 143, and 168 pathways enriched at the three time points, respectively.
Further examination led to the classification of the DEGs into four main categories. The first category pertained to “redox regulation”. The GO analysis demonstrated enrichment of DEGs in heat response and other fundamental biological processes. In the “CC” category, the prevailing functional types at all three time points were “cell”, “cell part”, “membrane”, “organelle”, and “membrane part”. Notably, the term “protein histidine kinase complex” exhibited significant enrichment at 2 h and 6 h. In the “MF” category, the dominant functional types at all three time points were catalytic activity, binding activity, and terms related to monooxygenase activity and oxidoreductase activity. In the KEGG analysis, the “MAPK signaling pathway” displayed significant enrichment in all three treatments. During adverse conditions such as high-temperature stress, cellular redox balance undergoes disruption, leading to elevated levels of reactive oxygen species (ROS), degradation of polyunsaturated fatty acids, and the production of malondialdehyde, resulting in further detriment to plant tissues and cells. Wang et al. discovered that the glutathione metabolism pathway plays a pivotal role in the response of heat-tolerant pepper seedlings to high-temperature stress, indicating that the expression of related genes and the accumulation of metabolites constitute significant factors contributing to the superior heat tolerance of pepper varieties [38]. Protein kinases play vital roles in diverse biological processes such as plant senescence and biotic and abiotic stress responses. High-temperature stress leads to a notable enrichment of differentially expressed genes (DEGs) associated with protein kinases, indicating disruption in protein metabolism within pepper fruits. The transcription factor MYB21 is activated under high-temperature stress, subsequently activating heat shock protein genes bip3 and hsp70b through the involvement of the transcription factor BZIP10, which further triggers the hsp90.1 promoter [39]. Research has evidenced that heat shock proteins (HSPs) produced by plants in response to high temperatures enhance heat tolerance by safeguarding cellular proteins against damage and facilitating the repair of injured proteins. This protective function of HSPs plays a pivotal role in maintaining cellular homeostasis and fortifying the ability to withstand unfavorable environmental conditions [40].
The second category pertains to photosynthesis. The term “photosystem II” in the “CC” category exhibited significant enrichment at 2 h and 6 h. In the KEGG analysis, the pathway “Photosynthesis—antenna proteins” displayed significant enrichment at 2 h and 6 h, highlighting the impact of high-temperature stress on the photosystem and altered gene expression. Photosynthesis, the metabolic response in plants most susceptible to temperature fluctuations, is primarily affected by high-temperature stress in the light-dependent reactions occurring within chloroplasts, including photosystem I (PSI) and photosystem II (PSII), as well as carbon assimilation in the stroma [41]. Furthermore, the term “tetrapyrrole binding” in the “MF” category demonstrated significant enrichment in the DEGs. Tetrapyrrole pigments are the most abundant and widely distributed pigments in nature and are essential components in chlorophyll synthesis. This finding further suggests the impact of high-temperature stress on plant photosynthesis. Upon comparing the two genotypes, the majority of genes in P19055 was promptly upregulated following high-temperature stress, implying that the heat-tolerant P19055 variety can regulate the expression of photosynthesis-related genes to mitigate physiological damage and photosynthesis inhibition caused by high-temperature stress, as opposed to P17087.
The third category pertains to carbohydrate metabolism. GO analysis unveiled the enrichment of terms associated with the degradation/metabolism of glucose-related compounds (GO:1901071, GO:1901072) and the activity of glucosyltransferases (GO:0080043, GO:0080044) in the heat tolerance of peppers. In KEGG analysis, pathways such as “galactose metabolism” and “starch and sucrose metabolism” exhibited significant enrichment. These findings suggest that the expression of these genes is upregulated following heat stress, potentially activating these pathways in peppers to cope with heat stress. However, distinctive metabolic pathways include starch and sucrose metabolism, as well as secondary metabolite biosynthesis. Starch and sucrose metabolism pathways represent downstream processes within carbohydrate metabolism. When photosynthesis is disrupted, starch and sucrose serve as carbon sources and act as osmoprotectants and compatible solutes, alleviating the adverse effects of stress [42]. The observed variations in metabolic pathways among candidate genes reflect the disparity in the response to heat stress between the two genotypes. Starch and sucrose metabolism, along with secondary metabolite biosynthesis, may significantly influence the heat stress sensitivity of P17087.
The fourth category potentially relates to capsaicin synthesis. GO analysis revealed a significant enhancement of the “flavonoid biosynthetic process” in the “BP” category at 2 h and 6 h. In the “MF” category, the terms “monooxygenase activity” and “quercetin 7-O-glucosyltransferase activity” were significantly enriched at 0.5 h and 2 h. KEGG pathway analysis demonstrated significant enrichment of the “monoterpenoid biosynthesis”, “phenylpropanoid biosynthesis”, and “flavonoid, stilbenoid, and lignin biosynthesis” pathways at 2 h and 6 h. The synthesis of capsaicin is known to be a complex process involving the coordinated action of multiple genes and gene families. The main biosynthetic pathways encompass phenylalanine and branched fatty acid pathways. The phenylalanine pathway gives rise to vanillinamine from phenylalanine, while the branched fatty acid pathway yields 8-methyl-6-nonenoyl-CoA from valine [43]. Capsaicin is synthesized through the condensation of vanillinamine and branched fatty acids. These findings align with the significant enrichment observed in the aforementioned pathways through our KEGG analysis. It is worth noting that among the candidate genes from the two genotypes, numerous proteins with unknown functions were identified, which should not be disregarded. Out of the 16 genes associated with capsaicin biosynthesis, 8 were upregulated, and 8 were downregulated (Table S11). Six of them were annotated as cytochrome P450-like proteins, which constitute a diverse set of enzymes within the cytochrome P450 superfamily that catalyze the oxidation of organic substances. Among these, p-coumarate 3-hydroxylase (C3H) is involved in the capsaicin biosynthetic pathway and represents a member of the cytochrome P450 family. Other genes were annotated as premnaspirodiene oxygenase-like, alkane hydroxylase MAH1-like, flavonoid 3′-monooxygenase-like, etc., which may be linked to capsaicin changes in peppers under high-temperature stress. Consequently, further research is warranted, as these genes may play pivotal roles in coping with heat stress. In field production, the pungency of pepper fruits intensifies under sustained high-temperature conditions. This phenomenon underscores the potential impact of high-temperature stress on capsaicin content, corroborated by the findings of Liu et al. [35], which highlight the substantial influence of heat stress on capsaicin content. It is important to emphasize that these results differ from those of studies focusing on pepper seedlings as the research subjects.
Transcription factors represent a protein class capable of binding to specific sequences within the promoter regions of eukaryotic genes, thus exerting control over transcription. Growing evidence underscores the pivotal role of transcription factors in plant responses to high-temperature stress, with numerous factors directly or indirectly involved in stress regulation [44]. Notably, in tomatoes, overexpression of the heat stress transcription factor HsfA1 enhances heat tolerance [45]. Within the S and T series of peppers, transcription factors (TFs) from the DEGs were examined at three time intervals: 0.5 h, 2 h, and 6 h. By predicting all DEGs, we identified a total of 113 transcription factors, encompassing 29 upregulated and 84 downregulated factors. These transcription factors were classified into 26 families, including ERF (19), WRKY (12), MYB (15), NAC (7), bHLH (7), MIKC (7), and GRAS (6), alongside 40 other transcription factors, as depicted in Figure 7. Notably, variations in the expression regulation of transcription factors were observed among distinct heat-tolerant materials under high-temperature stress. Studies have demonstrated that overexpression of AtWRKY25 in Arabidopsis leads to heightened expression of HSFA2, HAFB1, HSFB2A, and HSP100, consequently significantly enhancing heat tolerance in transgenic plants [46]. Furthermore, research has elucidated the direct regulatory role of transcription factors such as CaMYB31, CaMYB48, and CaMYB108 in modulating the expression of structural genes in the capsaicin biosynthesis pathway in peppers [47].
Transcriptomic sequencing analysis of pepper fruits subjected to high-temperature stress unveiled candidate genes and transcription factors associated with the plant’s oxidative–reduction system, photosynthetic system, heat shock proteins, secondary metabolism, and more. This rich dataset of genetic resources not only facilitates the development of heat-tolerant pepper varieties but also establishes a solid foundation for comprehensive investigations into the intricate molecular mechanisms underlying the impact of high temperatures on pepper plants.

5. Conclusions

The present study involved a transcriptome analysis of pepper fruits under high-temperature stress comparing two inbred lines, namely, P19055 and P17087. RNA-Seq analysis identified 2324 genes across three time points (0.5 h, 2 h, 6 h). According to the WGCNA analysis, 30 core genes may be involved in responding to heat tolerance. The functional enrichment analysis revealed that the DEGs were predominantly linked to metabolic and cellular processes in response to HS, as well as to photosynthesis under conditions of HS. Furthermore, 26 TF families were identified and classified. The findings of our study contribute to an enhanced comprehension of the molecular pathways regulating HS at different time points in two elite pepper cultivars at the fruiting stage. Taken together, our work provides a comprehensive understanding of the molecular mechanism of pepper in response to HS at the fruiting stage.

Supplementary Materials

The following supporting information can be downloaded at: https://www.mdpi.com/article/10.3390/horticulturae9070801/s1, Figure S1: Principle component analysis of eight samples; Figure S2: Correlation analysis between the WGCNA module and phenotype at three time points in P19055 and P17087 at the fruiting stage; Table S1: The indexes of relative conductivity, malondialdehyde, proline, and antioxidant enzyme levels in P17087 and P19055 under high-temperature conditions; Table S2: Primers for qRT-PCR used in the present study; Table S3: Statistical analysis of the RNA-Seq reads quality in 24 libraries; Table S4: DEGs in T vs. C fruits during three times points; Table S5: The expression levels of 30 core genes that may be involved in responding to high-temperature stress; Table S6: The top six significant GO terms in “biological process” during three times points; Table S7: The top six important GO terms in “cellular component” during three times points; Table S8: The top six significant GO terms in “molecular function” during three times points; Table S9: The pathways of the DEGs at three times points based on KEGG metabolic pathways; Table S10: The transcription factors from the DEGs in three times points; Table S11: Genes possibly related to capsaicin synthesis under heat stress.

Author Contributions

Conceptualization, Y.S., Z.Z., K.L. and X.Y.; methodology, Y.S., Y.Z. and Z.N.; investigation, Y.Z. and L.Z.; resources, L.Z.; data curation, Z.N. and Y.S.; writing—original draft preparation, Y.S., Z.Z. and K.L.; writing—review and editing, A.M.F., Y.S. and X.Y.; supervision, X.Y.; funding acquisition, Y.S. All authors have read and agreed to the published version of the manuscript.

Funding

This research was funded by the Shanghai Agriculture Applied Technology Development Program, China (Grant No. T20220121).

Data Availability Statement

Not applicable.

Conflicts of Interest

The authors declare no conflict of interest.

References

  1. Olatunji, T.L.; Afolayan, A.J. The suitability of chilli pepper (Capsicum annuum L.) for alleviating human micronutrient dietary deficiencies: A review. Food Sci. Nutr. 2018, 6, 2239–2251. [Google Scholar] [CrossRef] [PubMed] [Green Version]
  2. Lee, S.G.; Kim, S.K.; Lee, H.J.; Lee, H.S.; Lee, J.H. Impact of moderate and extreme climate change scenarios on growth, morphological features, photosynthesis, and fruit production of hot pepper. Ecol. Evol. 2018, 8, 197–206. [Google Scholar] [CrossRef] [Green Version]
  3. Tang, B.; Li, X.; Zhang, X.; Yin, Q.; Xie, L.; Zou, X.; Liu, F.; Dai, X. Transcriptome data reveal gene clusters and key genes in pepper response to heat shock. Front. Plant Sci. 2022, 13, 946475. [Google Scholar] [CrossRef] [PubMed]
  4. Sun, B.M.; Zhou, X.; Chen, C.M.; Chen, C.J.; Chen, K.H.; Chen, M.X.; Zhu, Z.S. Coexpression network analysis reveals an MYB transcriptional activator involved in capsaicinoid biosynthesis in hot peppers. Hortic. Res. 2020, 7, 162. [Google Scholar] [CrossRef] [PubMed]
  5. Wang, F.; Yin, Y.; Yu, C.; Li, N.; Shen, S.; Liu, Y.; Gao, S.; Jiao, C.; Yao, M. Transcriptomics analysis of heat stress-induced genes in pepper (Capsicum annuum L.) seedlings. Horticulturae 2021, 7, 339. [Google Scholar] [CrossRef]
  6. Guo, M.; Zhai, Y.F.; Lu, J.P.; Chai, L.; Chai, W.G.; Gong, Z.H.; Lu, M.H. Characterization of CaHsp70-1, a pepper heat-shock protein gene in response to heat stress and some regulation exogenous substances in Capsicum annuum L. Int. J. Mol. Sci. 2014, 15, 19741–19759. [Google Scholar] [CrossRef] [Green Version]
  7. Saidi, Y.; Finka, A.; Muriset, M.; Bromberg, Z.; Weiss, Y.G.; Maathuis, F.J.; Goloubinoff, P. The heat shock response in moss plants is regulated by specific calcium-permeable channels in the plasma membrane. Plant Cell 2009, 21, 2829–2843. [Google Scholar] [CrossRef] [Green Version]
  8. Haider, S.; Iqbal, J.; Naseer, S.; Yaseen, T.; Shaukat, M.; Bibi, H.; Ahmad, Y.; Daud, H.; Abbasi, N.L.; Mahmood, T. Molecular mechanisms of plant tolerance to heat stress: Current landscape and future perspectives. Plant Cell Rep. 2021, 40, 2247–2271. [Google Scholar] [CrossRef]
  9. Nadeem, M.; Li, J.; Wang, M.; Shah, L.; Lu, S.; Wang, X.; Ma, C. Unraveling field crops sensitivity to heat stress: Mechanisms, approaches, and prospects. Agronomy 2018, 8, 128. [Google Scholar] [CrossRef] [Green Version]
  10. Wang, F.; Zang, X.; Kabir, M.R.; Liu, K.; Liu, Z.; Ni, Z.; Yao, Y.; Hu, Z.; Sun, Q.; Peng, H. A wheat lipid transfer protein 3 could enhance Arabidopsis’s basal thermotolerance and oxidative stress resistance. Gene 2014, 550, 18–26. [Google Scholar] [CrossRef]
  11. Kong, F.; Wang, J.; Cheng, L.; Liu, S.; Wu, J.; Peng, Z.; Lu, G. Genome-wide analysis of the mitogen-activated protein kinase gene family in Solanum lycopersicum. Gene 2012, 499, 108–120. [Google Scholar] [CrossRef] [PubMed]
  12. Sangwan, V.; Örvar, B.L.; Beyerly, J.; Hirt, H.; Dhindsa, R.S. Opposite changes in membrane fluidity mimic cold and heat stress activation of distinct plant MAP kinase pathways. Plant J. 2002, 31, 629–638. [Google Scholar] [CrossRef] [Green Version]
  13. Xu, J.; Zhang, S. Mitogen-activated protein kinase cascades in signalling plant growth and development. Trends Plant Sci. 2015, 20, 56–64. [Google Scholar] [CrossRef]
  14. Ding, H.; He, J.; Wu, Y.; Wu, X.; Ge, C.; Wang, Y.; Zhong, S.; Peiter, E.; Liang, J.; Xu, W. The tomato mitogen-activated protein kinase SlMPK1 is a negative regulator of the high-temperature stress response. Plant Physiol. 2018, 177, 633–651. [Google Scholar] [CrossRef] [PubMed] [Green Version]
  15. Yin, Y.; Qin, K.; Song, X.; Zhang, Q.; Zhou, Y.; Xia, X.; Yu, J. BZR1 transcription factor regulates heat stress tolerance through FERONIA Receptor-Like Kinase-Mediated reactive oxygen species signalling in tomato. Plant Cell Physiol. 2018, 59, 2239–2254. [Google Scholar] [PubMed]
  16. Liu, H.C.; Charng, Y. Common and distinct functions of Arabidopsis class A1 and A2 heat shock factors in diverse abiotic stress responses and development. J. Plant Physiol. 2013, 163, 276–290. [Google Scholar] [CrossRef] [PubMed] [Green Version]
  17. Guo, M.; Liu, H.J.; Ma, X.; Zhen, H.G.; Lu, M.H. The plant heat stress transcription factors (HSFs): Structure, regulation, and function in response to abiotic stresses. Front. Plant Sci. 2016, 7, 114. [Google Scholar] [CrossRef] [Green Version]
  18. Sakuma, Y.; Maruyama, K.; Qin, F.; Osakabe, Y.; Shinozaki, K.; Yamaguchi-Shinozaki, K. Dual function of an Arabidopsis transcription factor DREB2A in water-stress-responsive and heat-stress-responsive gene expression. Proc. Natl. Acad. Sci. USA 2006, 103, 18822–18827. [Google Scholar] [CrossRef]
  19. Konzen, E.R.; Recchia, G.H.; Cassieri, F.; Caldas, D.G.G.; Berny Mier, Y.; Teran, J.C.; Gepts, P.; Tsai, S.M. DREB genes from common bean (Phaseolus vulgaris) show broad to specific abiotic stress responses and distinct levels of nucleotide diversity. Int. J. Genom. 2019, 2019, 9520642. [Google Scholar] [CrossRef] [Green Version]
  20. Sato, H.; Mizoi, J.; Tanaka, H.; Maruyama, K.; Qin, F.; Osakabe, Y.; Morimoto, K.; Ohori, T.; Kusakabe, K.; Nagata, M.; et al. Arabidopsis DPB3-1, a DREB2A interactor, specifically enhances heat stress-induced gene expression by forming a heat stress-specific transcriptional complex with NF-Y subunits. Plant Cell 2014, 26, 4954–4973. [Google Scholar] [CrossRef] [Green Version]
  21. Chen, S.; Zhou, Y.; Chen, Y.; Gu, J. fastp: An ultra-fast all-in-one FASTQ preprocessor. Bioinformatics 2018, 34, 884–890. [Google Scholar] [CrossRef] [PubMed]
  22. Kim, D.; Langmead, B.; Salzberg, S.L. HISAT: A fast spliced aligner with low memory requirements. Nat. Methods 2015, 12, 357–360. [Google Scholar] [CrossRef] [PubMed] [Green Version]
  23. Pertea, M.; Pertea, G.M.; Antonescu, C.M.; Chang, T.C.; Mendell, J.T.; Salzberg, S.L. StringTie enables improved transcriptome reconstruction from RNA-seq reads. Nat. Biotechnol. 2015, 33, 290–295. [Google Scholar] [CrossRef] [PubMed] [Green Version]
  24. Li, B.; Dewey, C.N. RSEM: Accurate transcript quantification from RNA-Seq data with or without a reference genome. BMC Bioinform. 2011, 12, 323. [Google Scholar] [CrossRef] [PubMed] [Green Version]
  25. Love, M.I.; Huber, W.; Anders, S. Moderated estimation of fold change and dispersion for RNA-seq data with DESeq2. Genome Biol. 2014, 15, 550. [Google Scholar] [CrossRef] [Green Version]
  26. Wang, L.; Feng, Z.; Wang, X.; Wang, X.; Zhang, X. DEGseq: An R package for identifying differentially expressed genes from RNA-seq data. Bioinformatics 2009, 26, 136–138. [Google Scholar] [CrossRef] [Green Version]
  27. Klopfenstein, D.V.; Zhang, L.; Pedersen, B.S.; Ramírez, F.; Warwick Vesztrocy, A.; Naldi, A.; Mungall, C.J.; Yunes, J.M.; Botvinnik, O.; Weigel, M.; et al. GOATOOLS: A Python library for Gene Ontology analyses. Sci. Rep. 2018, 18, 10872. [Google Scholar] [CrossRef] [Green Version]
  28. Xie, C.; Mao, X.; Huang, J.; Ding, Y.; Wu, J.; Dong, S.; Kong, L.; Gao, G.; Li, C.-Y.; Wei, L. KOBAS 2.0: A web server for annotation and identification of enriched pathways and diseases. Nucleic Acids Res. 2011, 39, 316–322. [Google Scholar] [CrossRef] [Green Version]
  29. Yi, Z.; Chen, J.; Sun, H.; Rosli, H.G.; Pombo, M.A.; Zhang, P.; Banf, M.; Dai, X.; Martin, G.B.; Giovannoni, J.J.; et al. iTAK: A program for genome-wide prediction and classification of plant transcription factors, transcriptional regulators, and protein kinases. Mol. Plant 2016, 9, 1667–1670. [Google Scholar]
  30. Langfelder, P.; Horvath, S. WGCNA: An R package for weighted correlation network analysis. BMC Bioinform. 2008, 9, 559. [Google Scholar] [CrossRef] [Green Version]
  31. Shannon, P.; Markiel, A.; Ozier, O.; Baliga, N.S.; Wang, J.T.; Ramage, D.; Amin, N.; Schwikowski, B.; Ideker, T. Cytoscape: A software environment for integrated models of biomolecular interaction networks. Genome Res. 2003, 13, 2498–2504. [Google Scholar] [CrossRef] [PubMed]
  32. Chaudhry, S.; Sidhu, G.P.S. Climate change regulated abiotic stress mechanisms in plants: A comprehensive review. Plant Cell Rep. 2022, 41, 1–31. [Google Scholar] [CrossRef] [PubMed]
  33. Wang, Q.; Chen, J.; He, N.; Guo, F. Metabolic reprogramming in chloroplasts under heat stress in plants. Int. J. Mol. Sci. 2018, 19, 849. [Google Scholar] [CrossRef] [PubMed] [Green Version]
  34. Shi, J.; Yan, B.; Lou, X.; Ma, H.; Ruan, S. Comparative transcriptome analysis reveals the transcriptional alterations in heat-resistant and heat-sensitive sweet maize (Zea mays L.) varieties under heat stress. BMC Plant Biol. 2017, 17, 26. [Google Scholar] [CrossRef] [PubMed] [Green Version]
  35. Liu, C.; Luo, S.; Zhao, Y.; Miao, Y.; Wang, Q.; Ye, L.; Gao, L.; Ahammed, G.J.; Cheng, Y. Multiomics analyses reveal high temperature-induced molecular regulation of ascorbic acid and capsaicin biosynthesis in pepper fruits. Environ. Exp. Bot. 2022, 201, 104941. [Google Scholar] [CrossRef]
  36. Kuang, J.; Wu, C.; Guo, Y.; Walther, D.; Shan, W.; Chen, J.; Chen, L.; Lu, W. Deciphering transcriptional regulators of banana fruit ripening by regulatory network analysis. Plant Biotechnol. J. 2021, 19, 477–489. [Google Scholar] [CrossRef]
  37. Greenham, K.; Guadagno, C.R.; Gehan, M.A.; Mockler, T.C.; Weinig, C.; Ewers, B.E.; McClung, C.R. Temporal network analysis identifies early physiological and transcriptomic indicators of mild drought in Brassica rapa. eLife 2017, 6, e29655. [Google Scholar] [CrossRef]
  38. Wang, J.; Lv, J.; Liu, Z.; Liu, Y.; Song, J.; Ma, Y.; Ou, L.; Zhang, X.; Liang, C.; Wang, F.; et al. Integration of transcriptomics and metabolomics for pepper (Capsicum annuum L.) in response to heat stress. Int. J. Mol. Sci. 2019, 20, 5042. [Google Scholar] [CrossRef] [Green Version]
  39. Kumar, D.; Chattopadhyay, S. Glutathione modulates the expression of heat shock proteins via the transcription factors BZIP10 and MYB21 in Arabidopsis. J. Exp. Bot. 2018, 69, 3729–3743. [Google Scholar] [CrossRef] [Green Version]
  40. Latijnhouwers, M.; Xu, X.M.; Møller, S.G. Arabidopsis stromal 70-kDa heat shock proteins are essential for chloroplast development. Planta 2010, 232, 567–578. [Google Scholar] [CrossRef]
  41. Zhao, J.; Lu, Z.; Wang, L.; Jin, B. Plant responses to heat stress: Physiology, transcription, noncoding RNAs, and epigenetics. Int. J. Mol. Sci. 2020, 22, 117. [Google Scholar] [CrossRef] [PubMed]
  42. Thompson, M.; Gamage, D.; Hirotsu, N.; Martin, A.; Seneweera, S. Effects of elevated carbon dioxide on photosynthesis and carbon partitioning: A perspective on root sugar sensing and hormonal crosstalk. Front. Physiol. 2017, 8, 578. [Google Scholar] [CrossRef] [PubMed] [Green Version]
  43. Arce-Rodriguez, M.L.; Ochoa-Alejo, N. Biochemistry and molecular biology of capsaicinoid biosynthesis: Recent advances and perspectives. Plant Cell Rep. 2019, 38, 1017–1030. [Google Scholar] [CrossRef] [PubMed]
  44. Cheng, Z.; Luan, Y.; Meng, J.; Sun, J.; Tao, J.; Zhao, D. WRKY transcription factor response to high-temperature stress. Plants 2021, 10, 2211. [Google Scholar] [CrossRef] [PubMed]
  45. Mishra, S.K.; Tripp, J.; Winkelhaus, S.; Tschiersch, B.; Theres, K.; Nover, L.; Scharf, K.D. In the complex family of heat stress transcription factors, HsfA1 has a unique role as master regulator of thermotolerance in tomato. Genes Dev. 2002, 16, 1555–1567. [Google Scholar] [CrossRef] [PubMed] [Green Version]
  46. Li, S.; Fu, Q.; Huang, W.; Yu, D. Functional analysis of an Arabidopsis transcription factor WRKY25 in heat stress. Plant Cell Rep. 2009, 28, 683–693. [Google Scholar] [CrossRef]
  47. Arce-Rodriguez, M.L.; Ochoa-Alejoa, N. An R2R3-MYB transcription factor regulates capsaicinoid biosynthesis. Plant Physiol. 2017, 174, 1359–1370. [Google Scholar] [CrossRef] [Green Version]
Figure 1. The profile of DEGs in P17087 and P19055 after heat treatment at 45 °C for 0.5 h, 2 h, and 6 h, respectively, at the fruiting stage. (A) Histogram of Uni-genes and DEGs. (B) Venn diagram of Uni-genes and DEGs; T stands for a heat-resistant pepper variety and S a heat-sensitive one. (C) Histogram of Uni-genes. (D) Venn diagram of Uni-genes. A high number of up-regulated DEGs was detected in P17087 at 6 h.
Horticulturae 09 00801 g001
Figure 2. Clustering analysis of WGCNA gene and phenotype. Gene dendrogram obtained by clustering the dissimilarity based on consensus topological overlap with the corresponding module colors indicated by the color row. Each colored row represents a color-coded module containing highly connected genes.
Horticulturae 09 00801 g002
Figure 3. GO enrichment analysis results for the DEGs at three time points in P19055 and P17087 at the fruiting stage.
Horticulturae 09 00801 g003
Figure 4. Scatterplot of KEGG pathway enrichment results for the DEGs at the 0.5 h time point in P19055 and P17087 at the fruiting stage.
Horticulturae 09 00801 g004
Figure 5. Scatterplot of KEGG pathway enrichment results for the DEGs at the 2 h time point in P19055 and P17087 at the fruiting stage.
Horticulturae 09 00801 g005
Figure 6. Scatterplot of KEGG pathway enrichment results for the DEGs at the 6 h time point in P19055 and P17087 at the fruiting stage.
Horticulturae 09 00801 g006
Figure 7. Top ten TFs identified from the DEGs at three time points.
Horticulturae 09 00801 g007
Figure 8. Expression levels of eight DEGs in the pepper lines T and S during the 0 h, 0.5 h, 2 h, and 6 h time periods by qRT-PCR and the RNA-seq results. The expression levels of the eight DEGs showed similar trends in both RNA-Seq analysis and qRT-PCR results. Error bars indicate the standard deviations.
Horticulturae 09 00801 g008
Disclaimer/Publisher’s Note: The statements, opinions and data contained in all publications are solely those of the individual author(s) and contributor(s) and not of MDPI and/or the editor(s). MDPI and/or the editor(s) disclaim responsibility for any injury to people or property resulting from any ideas, methods, instructions or products referred to in the content.

