Article

Improving Production Yield and Nutritional Quality of Coastal Glehnia Using Developed Hydroponic Nutrient Solution in Controlled Environment Agriculture

1
Division of Animal, Horticultural and Food Sciences, Chungbuk National University, Cheongju 28644, Republic of Korea
2
Brain Korea 21 Center for Bio-Health Industry, Chungbuk National University, Cheongju 28644, Republic of Korea
*
Author to whom correspondence should be addressed.
Horticulturae 2023, 9(7), 776; https://doi.org/10.3390/horticulturae9070776
Submission received: 23 May 2023 / Revised: 3 July 2023 / Accepted: 4 July 2023 / Published: 7 July 2023

Abstract

:
This study was conducted to develop a nutrient solution for coastal glehnia, evaluate the performance of the newly developed nutrient solution, and determine an adequate electrical conductivity (EC) level for growth and bioactive compounds production in controlled environment agriculture (CEA). Coastal glehnia plants cultivated in Hoagland nutrient solution with EC 1, 2, 3, 4, and 5 dS·m−1 for 20 weeks had the same ratio of cations and anions in terms of macro essential elements. Based on the ratio, a new nutrient solution for coastal glehnia was developed. Subsequently, seedlings with two main leaves were grown in Hoagland nutrient solution (H1 and H2; EC 1 and 2 dS·m−1) or a newly developed nutrient solution (N1–5; EC 1–5 dS·m−1) for 23 weeks (about 6 months), and the leaves were harvested every 5 weeks. The N1 treatment resulted in significantly higher accumulated and average shoot fresh and dry weights than in the H1 and H2 treatments. In addition, the total phenolic content and antioxidant capacity per shoot were the highest under the N1 treatment. Individual bioactive compounds, such as xanthotoxin, bergapten, and imperatorin, levels per shoot with the N1 treatment were significantly higher than those with the H1 and H2 treatments. These results demonstrate that the newly developed nutrient solution of EC 1 dS·m−1 increases the biomass and bioactive compound levels of coastal glehnia and is suitable for cultivating coastal glehnia in CEA, such as vertical farms and greenhouses.

1. Introduction

Halophytes grow naturally in salt-rich coastal areas with strong winds and sunlight. Salt marshes, including coastal areas and sand dunes, are rough environments for common plants, such as glycophytes, to survive in owing to water and nutrient (mineral) deficiencies, the sodium toxicity of soil, and unstable soil surfaces [1,2]. However, halophytes exhibit a high survival rate in these environments, which is related to their high bioactive compounds content [3]. Specific bioactive compounds in halophytes have been used for pharmaceutical purposes for a long time, and recently, they have been evaluated as bioresources for plant-derived natural compounds [1].
Coastal glehnia (Glehnia littoralis F. Schmidt ex Miq.) is a single species in Glehnia and a perennial herb belonging to the Apiaceae. It is distributed along the coastal areas of eastern Russia, eastern China, Japan, and the Republic of Korea [4]. The roots and rhizomes of coastal glehnia are used in folk medicine to treat perspiration, pyrexia, stroke, bronchitis, and rheumatism [3,4]. In addition, several studies have confirmed that the leaves of coastal glehnia contain pharmacological components. Ishikawa et al. (2001), Hiraoka et al. (2002), Um et al. (2010), and Kim et al. (2022) found that the fruits, roots, and leaves of coastal glehnia contain furocoumarin derivatives, such as psoralen, xanthotoxin, bergapten, imperatorin, coumarin glucoside, and polyacetylene compounds [5,6,7,8]. These substances are reported to show high antitumor, antihuman immunodeficiency virus, and anti-inflammatory effects. Gu et al. (2017) reported that the leaves of coastal glehnia have higher total polyphenol and flavonoid levels than those present in the seeds and roots [9].
Coastal glehnia leaves can be harvested in a limited cultivation area during a short period from late spring to summer, and similar to other medicinal plants, cultivation conditions are undiscovered. This restricts the strategic and systematic cultivation of coastal glehnia and mass production of its natural plant-derived compounds. Controlled environment agriculture (CEA), such as vertical farms and greenhouses, can be a solution for the mass production of high-quality coastal glehnia. The application of CEA can control the temperature, humidity, light, water, and nutrient supply to provide and maintain an optimal growing environment for crops, resulting in an improved product yield and consistent production throughout the year [10]. The main difference between CEA and conventional agriculture is that plants are grown in a soilless cultivation system (hydroponics). Essential inorganic nutrients required for plant growth and development are supplied to plants in the form of ionic liquid fertilizers, so that they can be easily absorbed via their roots [11].
The proper composition of macro- and microelements and the concentration of the nutrient solution can improve the growth and quality of plants. Choi et al. (2005) developed a nutrient solution for leafy vegetables belonging to the Cruciferae family (pak choi, kale, and leaf mustard) and examined the suitability of the developed nutrient solutions [12]. The relative growth rate and vitamin C content increased when plants were grown in the developed nutrient solution compared to cultivation in the general nutrient solution. Nguyen et al. (2021) confirmed that red perilla, a medicinal plant cultivated in the developed nutrient solution, showed higher growth characteristics, anthocyanin content, and antioxidant content than plants cultivated in the greenhouse nutrient solution treatment [13].
This study was conducted to develop a nutrient solution for coastal glehnia based on the mineral elements ratio. In this study, our results also suggest the best electrical conductivity (EC) level of the newly developed nutrient solutions to produce coastal glehnia with high biomass and bioactive compounds in CEA hydroponic systems.

2. Materials and Methods

2.1. Plant Materials and Growing Conditions

After breaking seed dormancy using the method described by Yeom et al. (2021), the seeds were placed in a seed germination pouch (CYG seed germination pouch, Mega International, Roseville, MN, USA) and germinated in a growth chamber at 20 °C for 4 weeks [14]. Seedlings with two main leaves were transplanted in deep-flow technique hydroponic systems (29.5 × 20.2 × 22.5 cm, L × W × H) and cultivated in an environment-controlled room with the following conditions: air temperature 20 ± 3 °C, relative humidity 60 ± 5%, carbon dioxide 500 ± 60 μmol·mol−1, white LED light, 300 μmol·m−2·s−1 photosynthetic photon flux density for 12 h light period.

2.2. Development of Nutrient Solution (Study 1)

To develop a nutrient solution for coastal glehnia based on the mineral absorption ratio of coastal glehnia, the plants were cultivated in Hoagland (control) nutrient solution with EC 1, 2, 3, 4, and 5 dS·m−1 (EC 1, 2, 3, 4, and 5, pH 5.8 ± 0.2) for 20 weeks (5 months) after transplanting. Harvested coastal glehnia shoots were lyophilized using a freeze dryer (Alpha 1–4 LSC plus; Martin Christ Co., Osterode, Germany) for 72 h and finely ground by a mill (Tube Mill control; IKA, Wilmington, NC, USA) and 1 g of coastal glehnia shoot powder was weighed for mineral elements analysis. Five samples per treatment were used to analyze mineral elements (P, K, S, Ca, Mg, Cu, Fe, Zn, and Mn), except for N, and were pretreated following the methods described by Havlin and Soltanpour (1980) [15]. Each shoot powder sample was placed in a Teflon beaker filled with 70% nitric acid, and the temperature was gradually increased to 125 °C in a heating block (OD-98-002P; ODlab, Seoul, Republic of Korea) for plant tissue digestion. Then, H2O2 was added, and the sample was digested again at 200 °C. After digestion, the samples were cooled for 24 h, and distilled water was filled to a total volume of 75 g and filtered using quantitative filter paper (Quantitative ashless; Hyundai Micro, Seoul, Republic of Korea). The mineral elements content was measured using an ICP-OES spectrophotometer (Optima 7300 DV; Perkin Elmer, Waltham, MA, USA). For N analysis, 2 mg of coastal glehnia shoot powder was weighed for each treatment and measured using an organic elemental analyzer (vario MICRO cube, Elementar, Langenselbold, Hesse, Germany).
The analyzed mineral elements were classified as cations (Ca, Mg, and K) and anions (N, P, and S) to calculate the mineral elements ratio, which was converted into an ion equivalent ratio according to the set concentration of each compound [16].

2.3. EC Determination of the Newly Developed Nutrient Solution (Study 2)

To select the favorable EC level of the developed nutrient solution, coastal glehnia was grown at different EC levels in the developed and control nutrient solutions. The pH of all nutrient solutions was maintained at 5.8 ± 0.2. The EC treatment levels were EC 1 and 2 dS·m−1 for the control (H1 and H2), and EC 1, 2, 3, 4, and 5 dS·m−1 (N1, N2, N3, N4, and N5) for the developed nutrient solution for 23 weeks after transplanting. Nutrient solutions were replaced every 2 weeks, and the pH was calibrated three times a week with a pH meter (Multi 3430; WTW, Weilheim, Germany).

2.4. Growth Characteristics

In both Study 1 and 2, a total of four consecutive harvests were performed during the cultivation time. With every consecutive harvest, the fresh and dry weights of shoots and roots, number of leaves, leaf length, leaf width, crown diameter, and leaf area were measured as growth parameters. Fresh shoots and roots of coastal glehnia were weighed on an electronic scale and freeze-dried for 72 h to measure the dry weight. The leaf area was measured using a leaf area meter (LI-2050A; Li-Cor, Lincoln, NE, USA).
The initial harvest in both Studies 1 and 2 was performed 8 weeks after transplanting. In Study 1, using the control nutrient solution, three consecutive harvests were performed every 4 weeks after the initial harvest for a total of 20 weeks. In the other treatment, coastal glehnia was harvested 20 weeks after transplanting to compare the yield between the continuous and single harvests. In Study 2, three consecutive harvests were performed every 5 weeks after the initial harvest for a total of 23 weeks.
All harvests, except for the undeveloped leaves of the inner crown part, were performed based on a petiole length of more than 5 cm and less than 14 cm of the commercially available average coastal glehnia petiole.

2.5. Total Phenolic Content and Antioxidant Capacity

The dried powder of the coastal glehnia sample was mixed with 4 mL of 80% acetone and extracted using an ultrasonic sonicator (SK5210HP, Zhejiang Nade Scientific Instrument Co., Ltd., Hangzhou, China) for 15 min. The extracted solution was stored for 12 h in darkness in a refrigerator at 4 °C and −20 °C for the total phenolic content and antioxidant capacity, respectively. After centrifuging at 3000× g for 2 min, the supernatant of the extracted solution was obtained for the analysis of the total phenolic content and antioxidant capacity.
The total phenolic content was measured using the Folin–Ciocalteu colorimetric method [17] and the subsequent procedures have been described by Son and Oh (2013) [18]. The total phenolic content was expressed as mg of gallic acid equivalent (GAE) per gram of shoot leaves (mg·g−1) and GAE per whole shoot leaves (mg·shoot−1).
The antioxidant capacity was analyzed using the method described by Miller and Rice-Evans (1996) [19] with slight modifications from Park et al. (2016). The 5 mM of PBS (phosphate buffer saline) was mixed with ABTS [aminobenzotriazole; 2, 2′-azino-bis (3-ethyl benzothiazoline 6-sulfonic acid) diammonium salt] (Sigma-Aldrich, St. Louis, MO, USA) and the mixture was adjusted to 0.7 ± 0.5 at 730 nm. The 1 mL of mixture and 0.1 mL of extracted solution was mixed in a cuvette. Then, after 1 min of reaction, the absorbance was measured. The antioxidant capacity was expressed as mM Trolox equivalent antioxidant capacity (TEAC) per gram of shoot leaves (mM·g−1) and TEAC of whole shoot leaves (mM·shoot−1).

2.6. Individual Bioactive Compounds

The dried powder (approximately 0.2 g) was mixed with 4 mL of CH2Cl2 and sonicated using an ultrasonic sonicator for 60 min at 20 °C. The extracts were centrifuged at 20,000× g for 3 min, and the supernatant was concentrated using a nitrogen evaporator (N-EVAP 111, Oraganomation, Berlin, MA, USA) in a water bath at 50 °C, and then 1 mL of 100% methanol was added. Finally, it was filtered through a 0.45 μm syringe filter (SPU4513-1; Woongki, Seoul, Republic of Korea).
High-performance liquid chromatography was used to separate and quantify individual bioactive compounds such as xanthotoxin, bergapten, and imperatorin (Sigma-Aldrich, St. Louis, MO, USA) from the leaves and roots of coastal glehnia grown in the control and newly developed nutrient solutions. A high-performance liquid chromatography system (YL9100; Young Lin Instrument Co., Ltd., Anyang, Republic of Korea) was used to perform the analysis. A LiChroCART column (LiChrospher, Merck, Darmstadt, Germany) with a LiChrospher 100 RP-18 precolumn of dimensions 150 mm × 3.2 mm I.D (5 μm) was used, and the column temperature was maintained at 40 °C. The UV detector (YL9120; Young Lin Instrument Co., Ltd., Anyang, Republic of Korea) was set at 250 nm. Acetonitrile 100% and third distilled water were used as solvents A and B, respectively. The following gradient was used: 0–3 min, solvent A:B = 40–50:60–50; 3–5 min, solvent A:B = 50–55:50–45; 5–10 min, solvent A:B = 55–60:45–40; 10–15 min, solvent A:B=60:40; 15–20 min, solvent A:B=60–40:40–60. The injection volume was 10 μL, and the flow rate was 1.0 mL·min−1.

2.7. Statistical Analysis

In these experiments, we used a randomized complete block design with 3 and 4 blocks for Studies 1 and 2, respectively. An identical deep-flow technique hydroponic system, with six plants, was used for each treatment in each block. For Study 1, 11 replicates were used to measure the growth characteristics of the control nutrient solution treatment, and mineral elements analysis was performed using 5 replicates. For Study 2, seven replicates per treatment were used to measure the growth characteristics, five and four replicates were used to measure the phenolic antioxidant capacity and individual compounds, respectively. The tables and graphs were statistically evaluated using one-way analysis of variance (ANOVA), and the means were compared using Duncan’s multiple range test with the Statistical Analysis System, version 9.4 (SAS Institute, Cary, NC, USA) program. A two-way ANOVA was performed to determine the effects of the number of harvests, EC levels, and their interactions.

3. Results

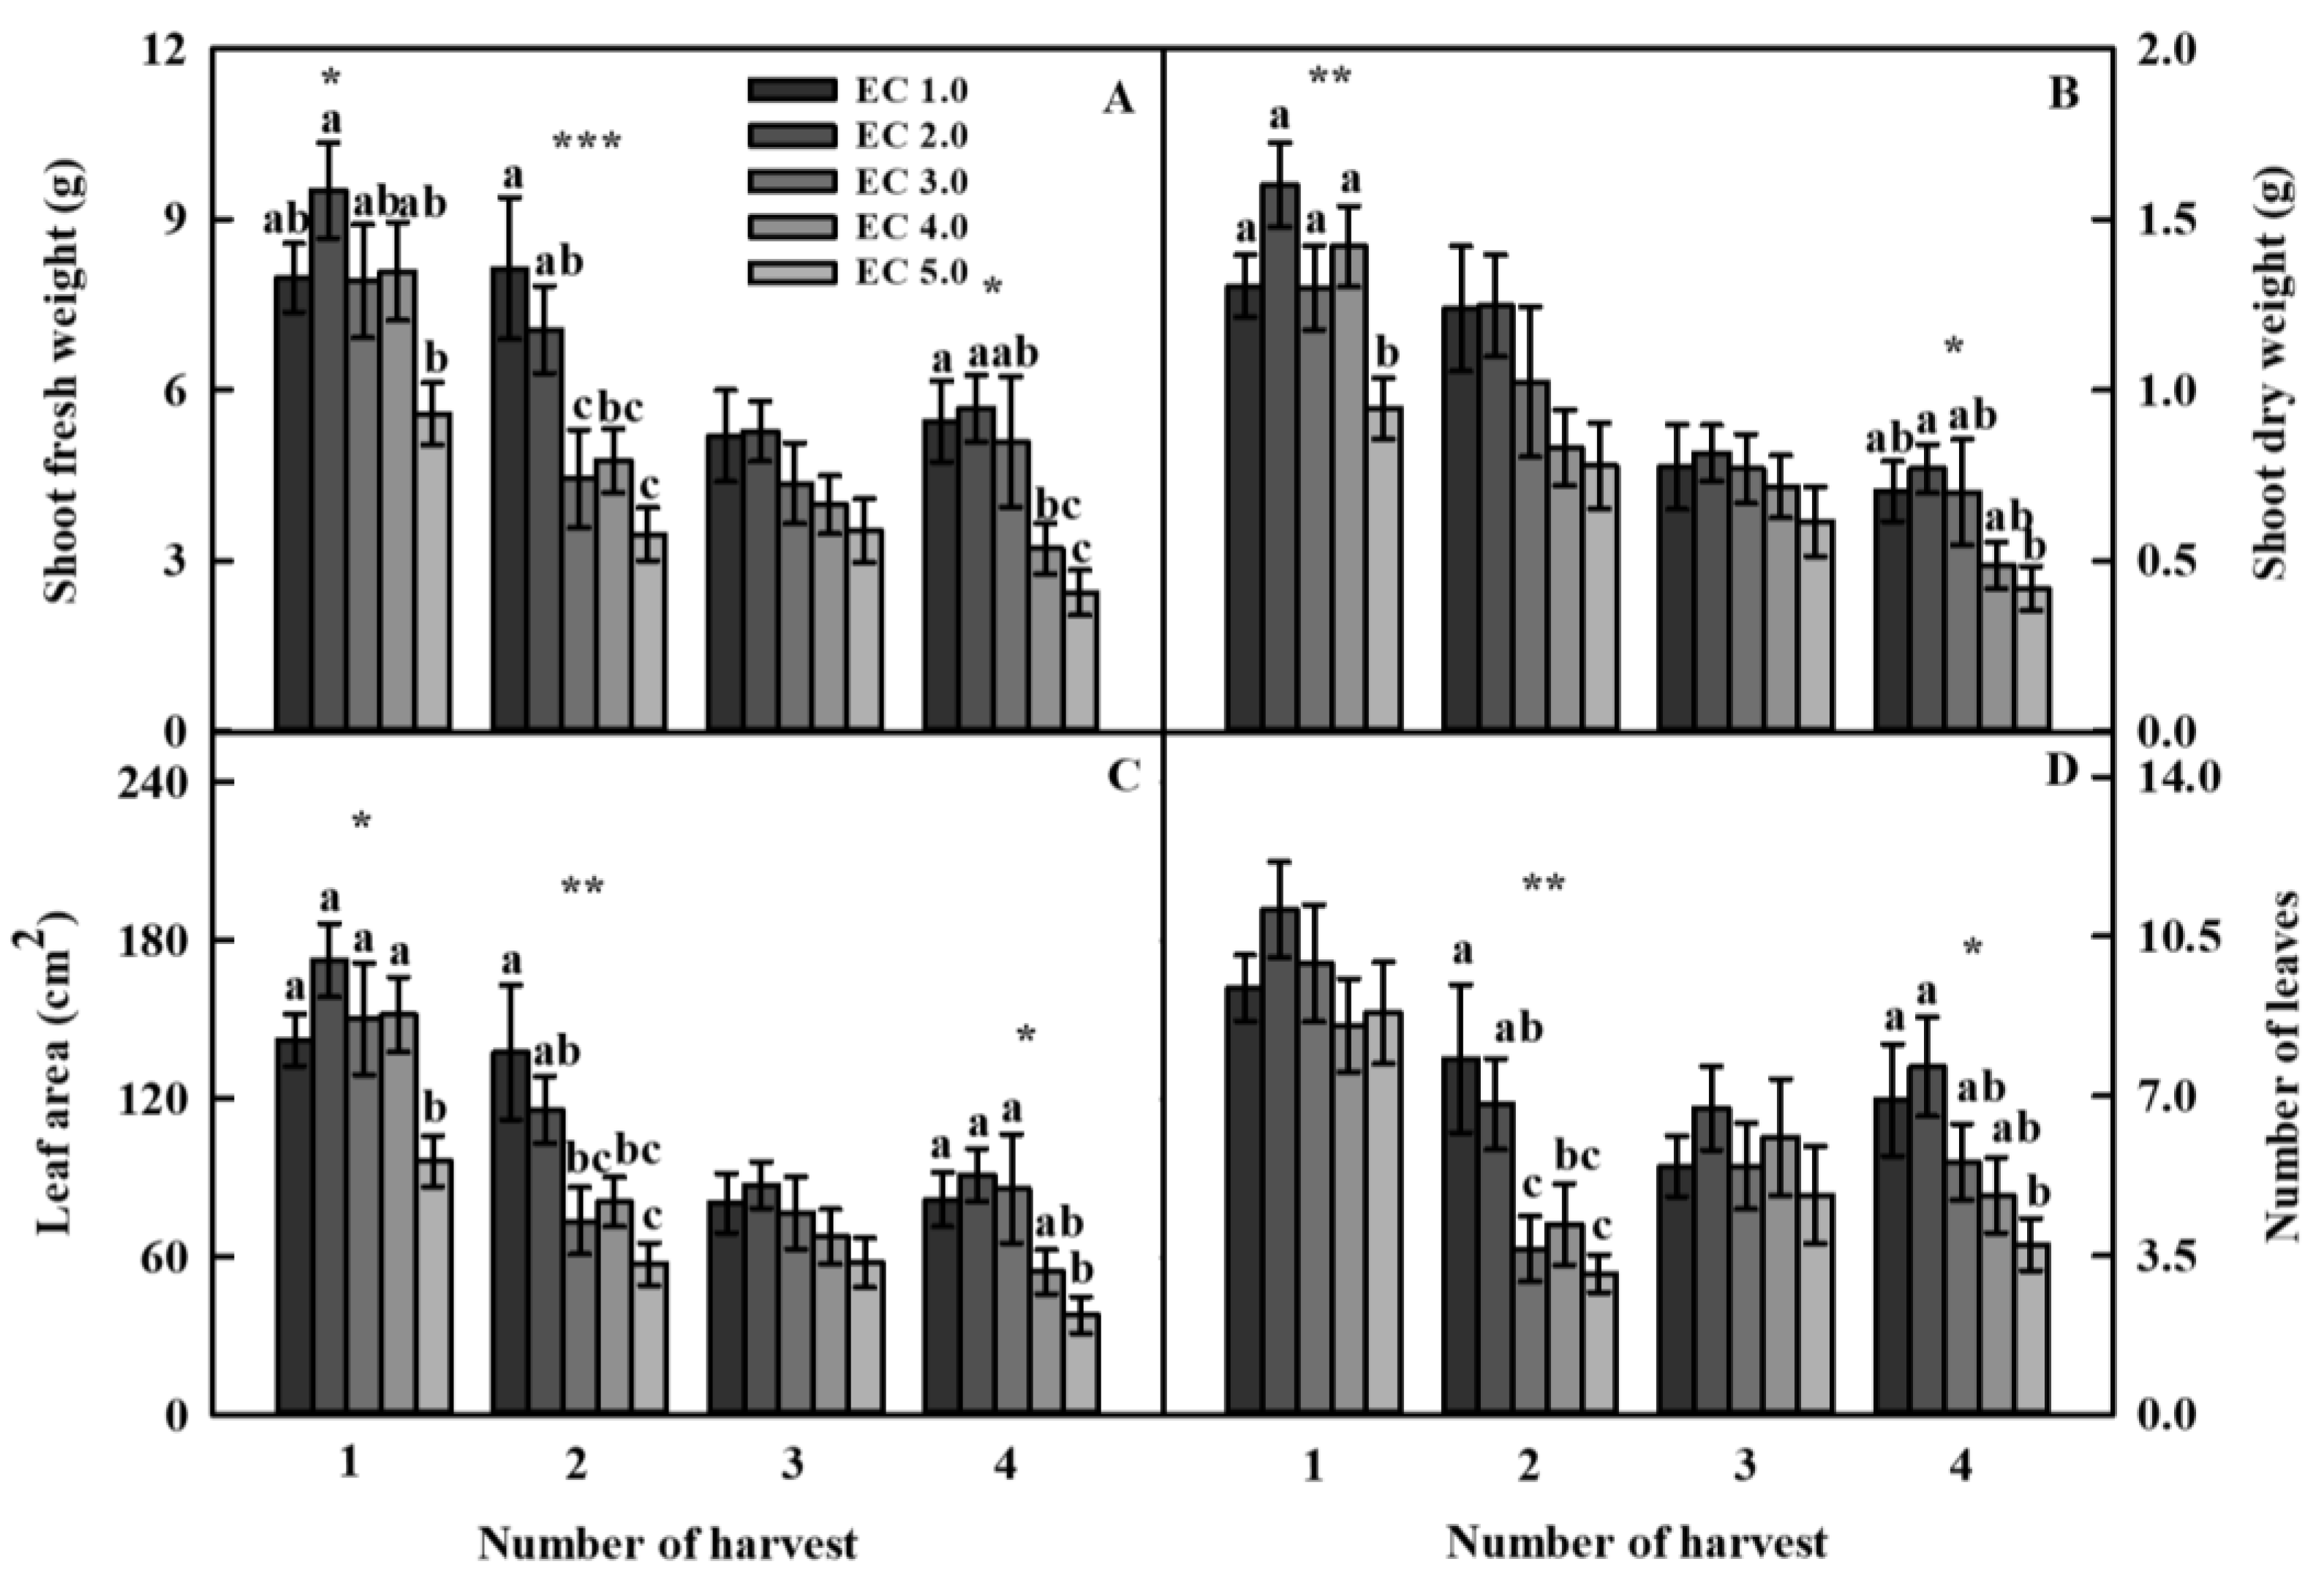
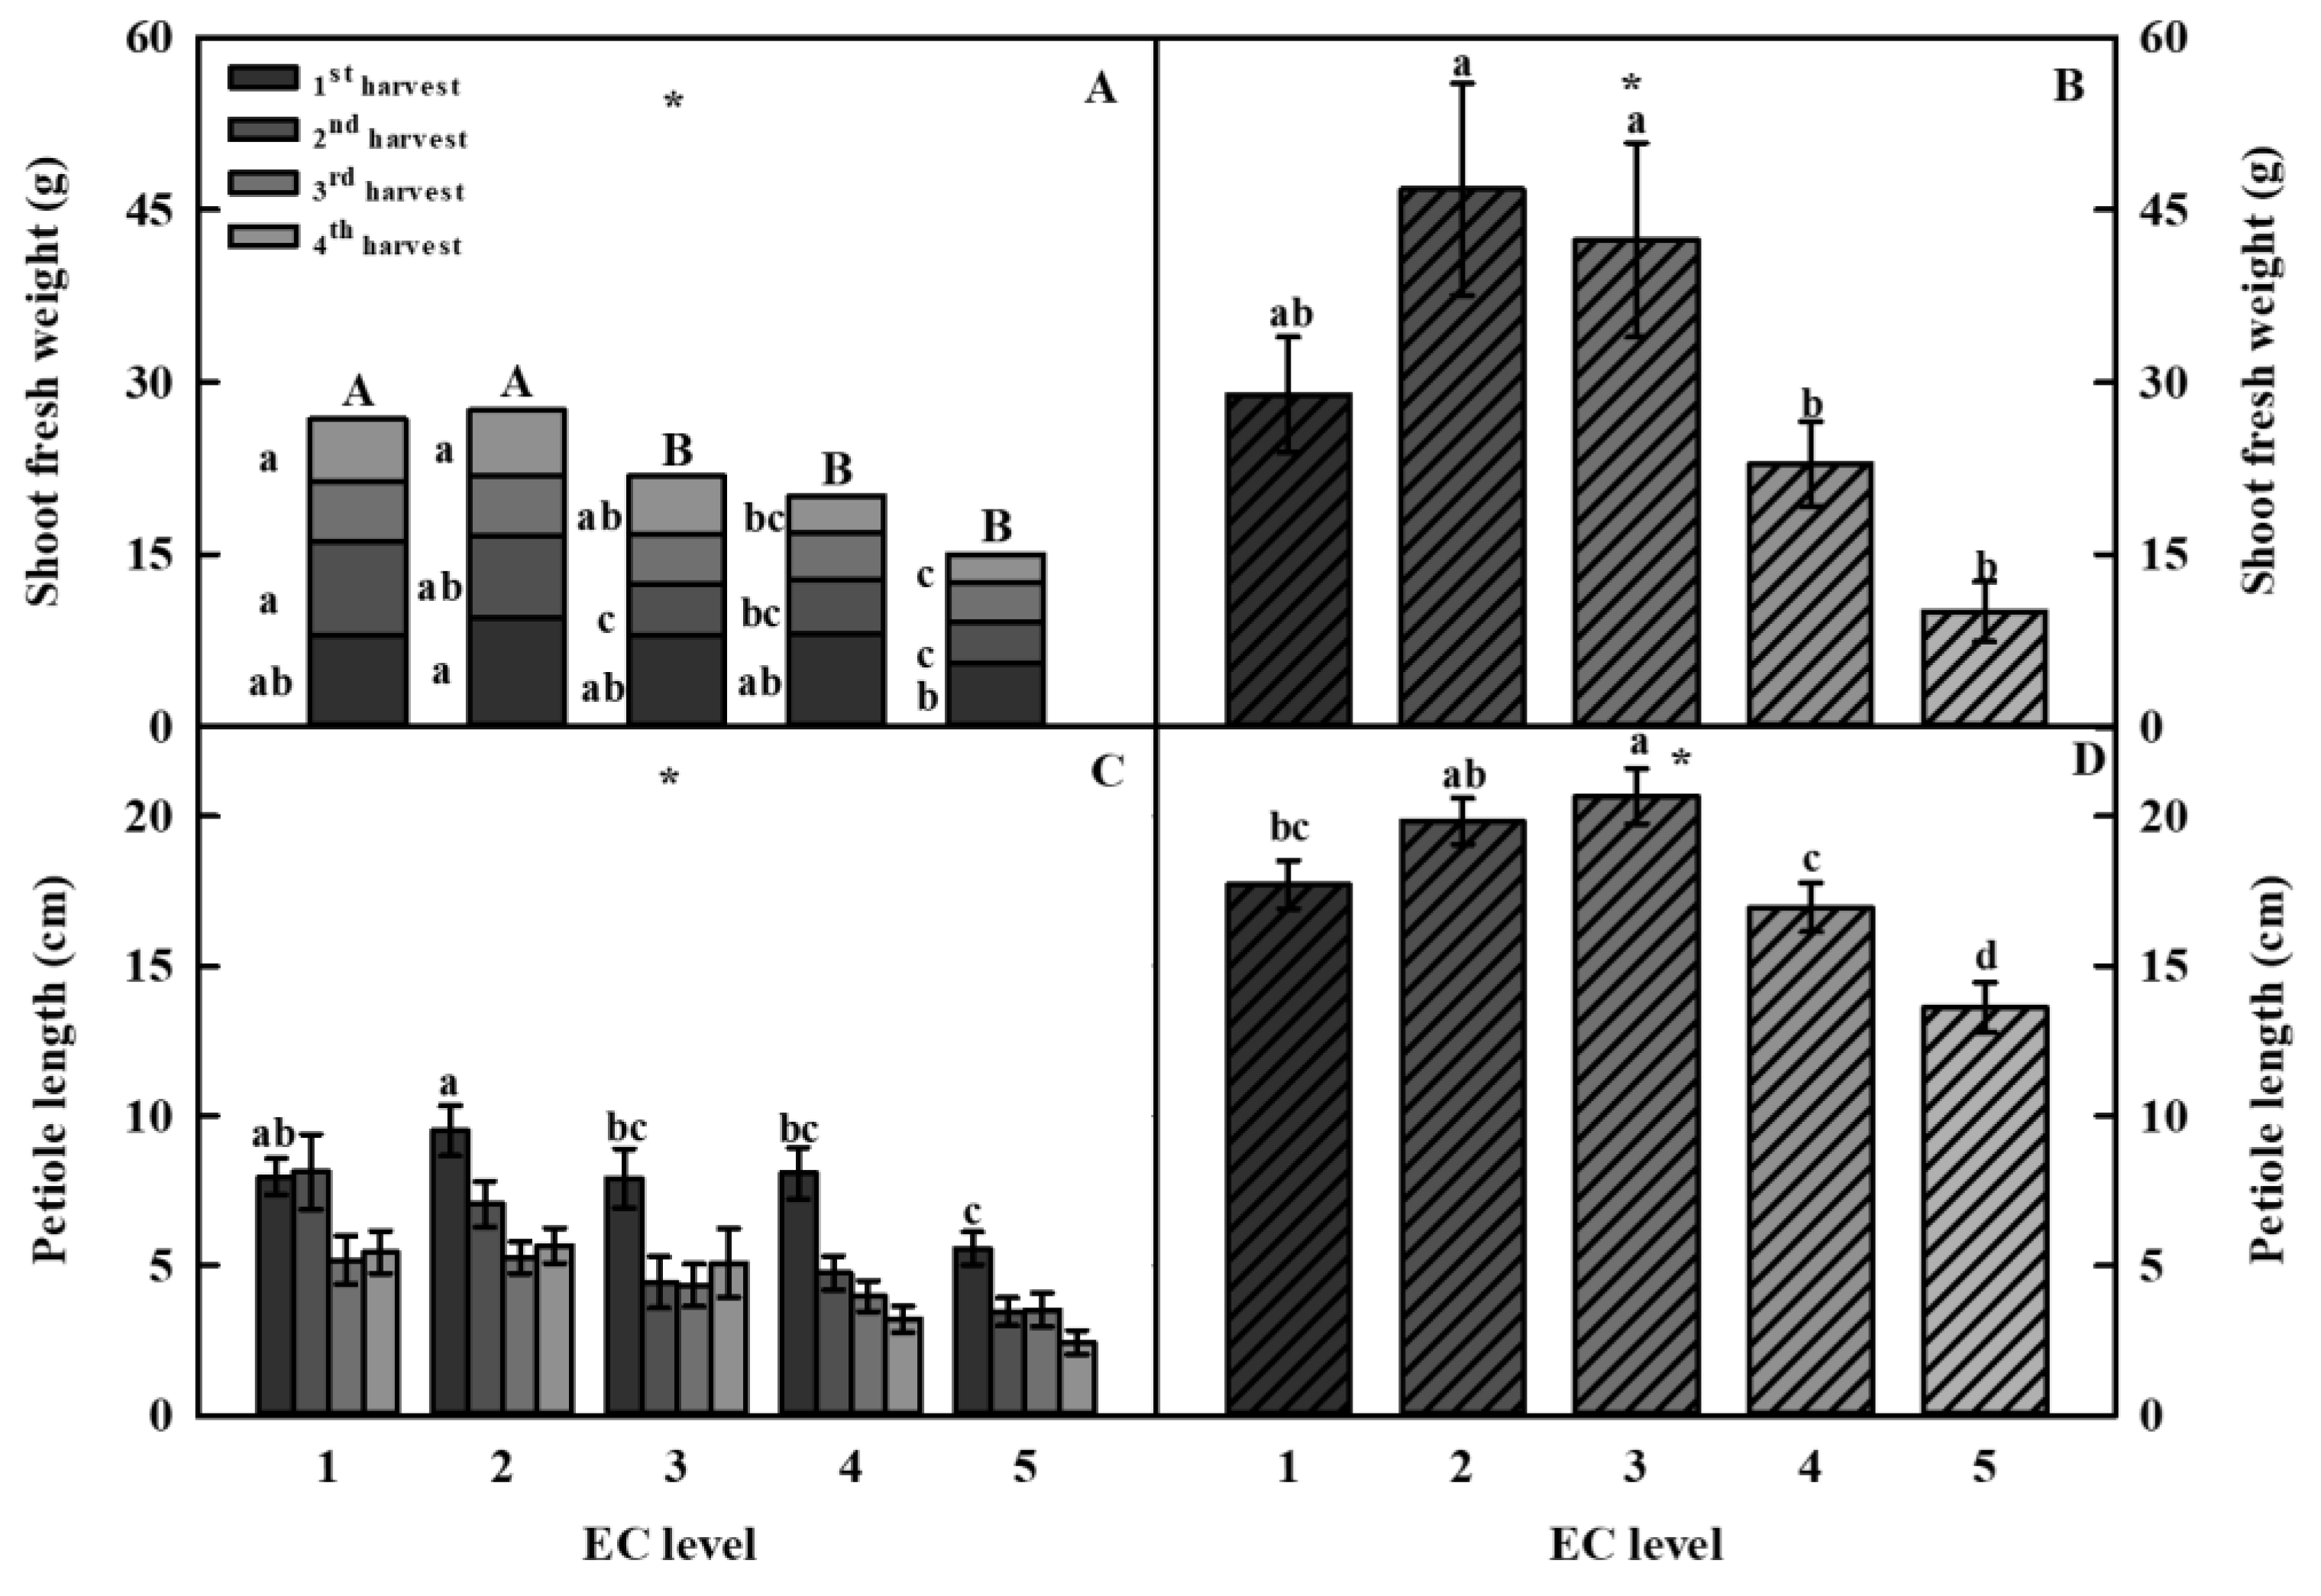
3.1. Growth Characteristics in Hoagland Nutrient Solution

In Study 1, coastal glehnia was cultivated in Hoagland nutrient solution with five different EC levels to evaluate their growth characteristics. The four harvests and five different EC levels of the nutrient solution showed noticeable differences in growth (shoot fresh and dry weights, leaf area, and the number of leaves). However, the interaction of both treatments did not affect the growth (Table 1). During the 20 weeks of cultivation, the average shoot fresh weight of the second harvest decreased by 28.7% compared to that of the first harvest (Figure 1A). In addition, the changes in the shoot dry weight, leaf area, and number of leaves according to the harvest time showed a pattern similar to that of the shoot fresh weight (Figure 1B–D).
Among the treatments, EC 1 and 2 induced the highest growth during the four consecutive harvests, and the growth decreased with the increasing EC (Figure 1). The shoot fresh weight of EC 1 and 2 was higher than that of EC 5 during the most harvests. The effect of EC on the shoot dry weight, leaf area, and number of leaves was similar.
To investigate the production yield and marketable size of coastal glehnia according to harvest and EC levels, four harvests over 20 weeks and a single harvest at 20 weeks were compared (Figure 2). The accumulated production yield after the four harvests was significantly higher at EC 1 and 2 than at EC 3, 4, and 5 (Figure 2A). The single harvest at 20 weeks with EC 2 and 3 resulted in a higher shoot fresh weight than that of the four harvests (Figure 2B).
The average petiole length related to the marketable size was 5.3 cm for the four harvests and 17.8 cm for the single harvest 20 weeks after transplanting, which was 3.4 times longer than that of the four harvests (Figure 2C,D).

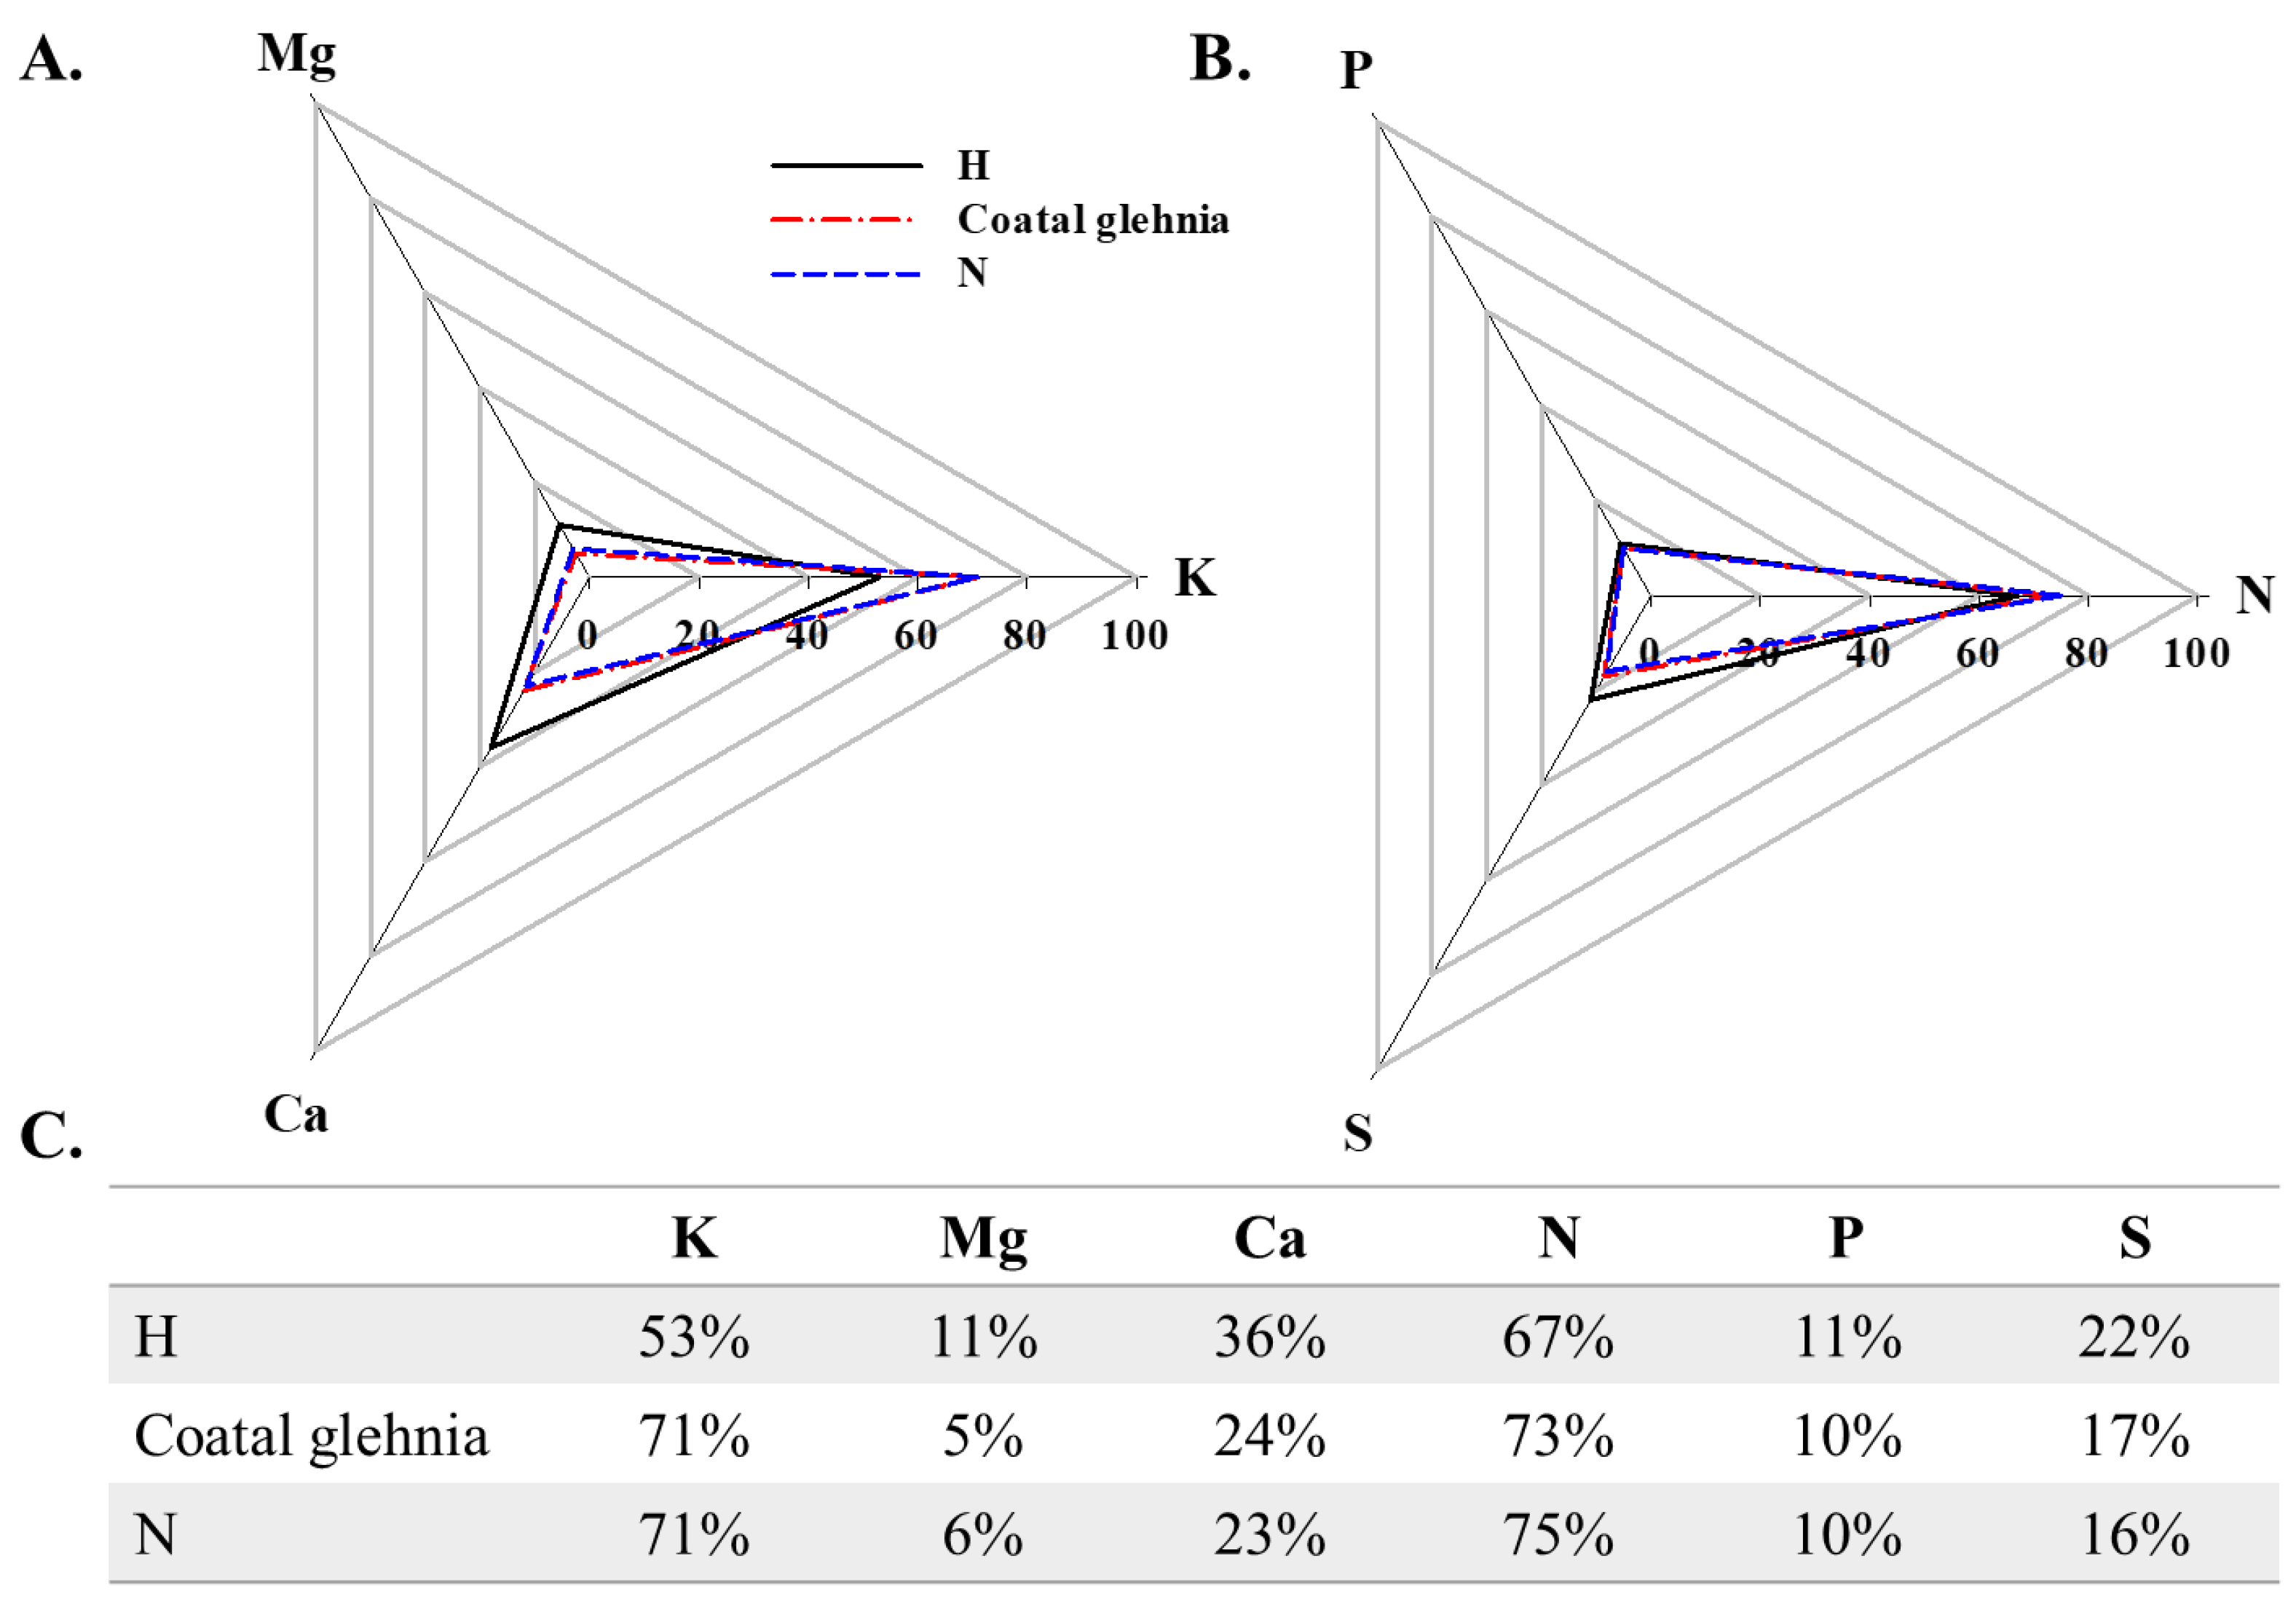
3.2. Mineral Elements Content in Hoagland Nutrient Solution

Coastal glehnia cultivated in Hoagland nutrient solution with five levels of EC showed the same ratio of cations and anions (Figure S1). Based on this ratio, we developed a nutrient solution for coastal glehnia, which is similar to that used for the coastal glehnia shoots (Figure 3). The Hoagland (control) and newly developed nutrient solutions showed different nutrient ratios (Figure 3 and Table 2). In the newly developed nutrient solution, the cation nutrient ratio was 18% higher for K, 5% and 13% lower for Mg and Ca, respectively, and the anion nutrient ratio was 8% higher for N and 6% lower for S than in the control nutrient solution. Quantitative comparison of the cation and anion macroelements of EC 1 showed that the newly developed solution had higher N (+9 mg·L−1) and K (+78 mg·L−1), and lower Ca (−17 mg·L−1), Mg (−6 mg·L−1), and S (−8 mg·L−1) than the control solution (Table 2).

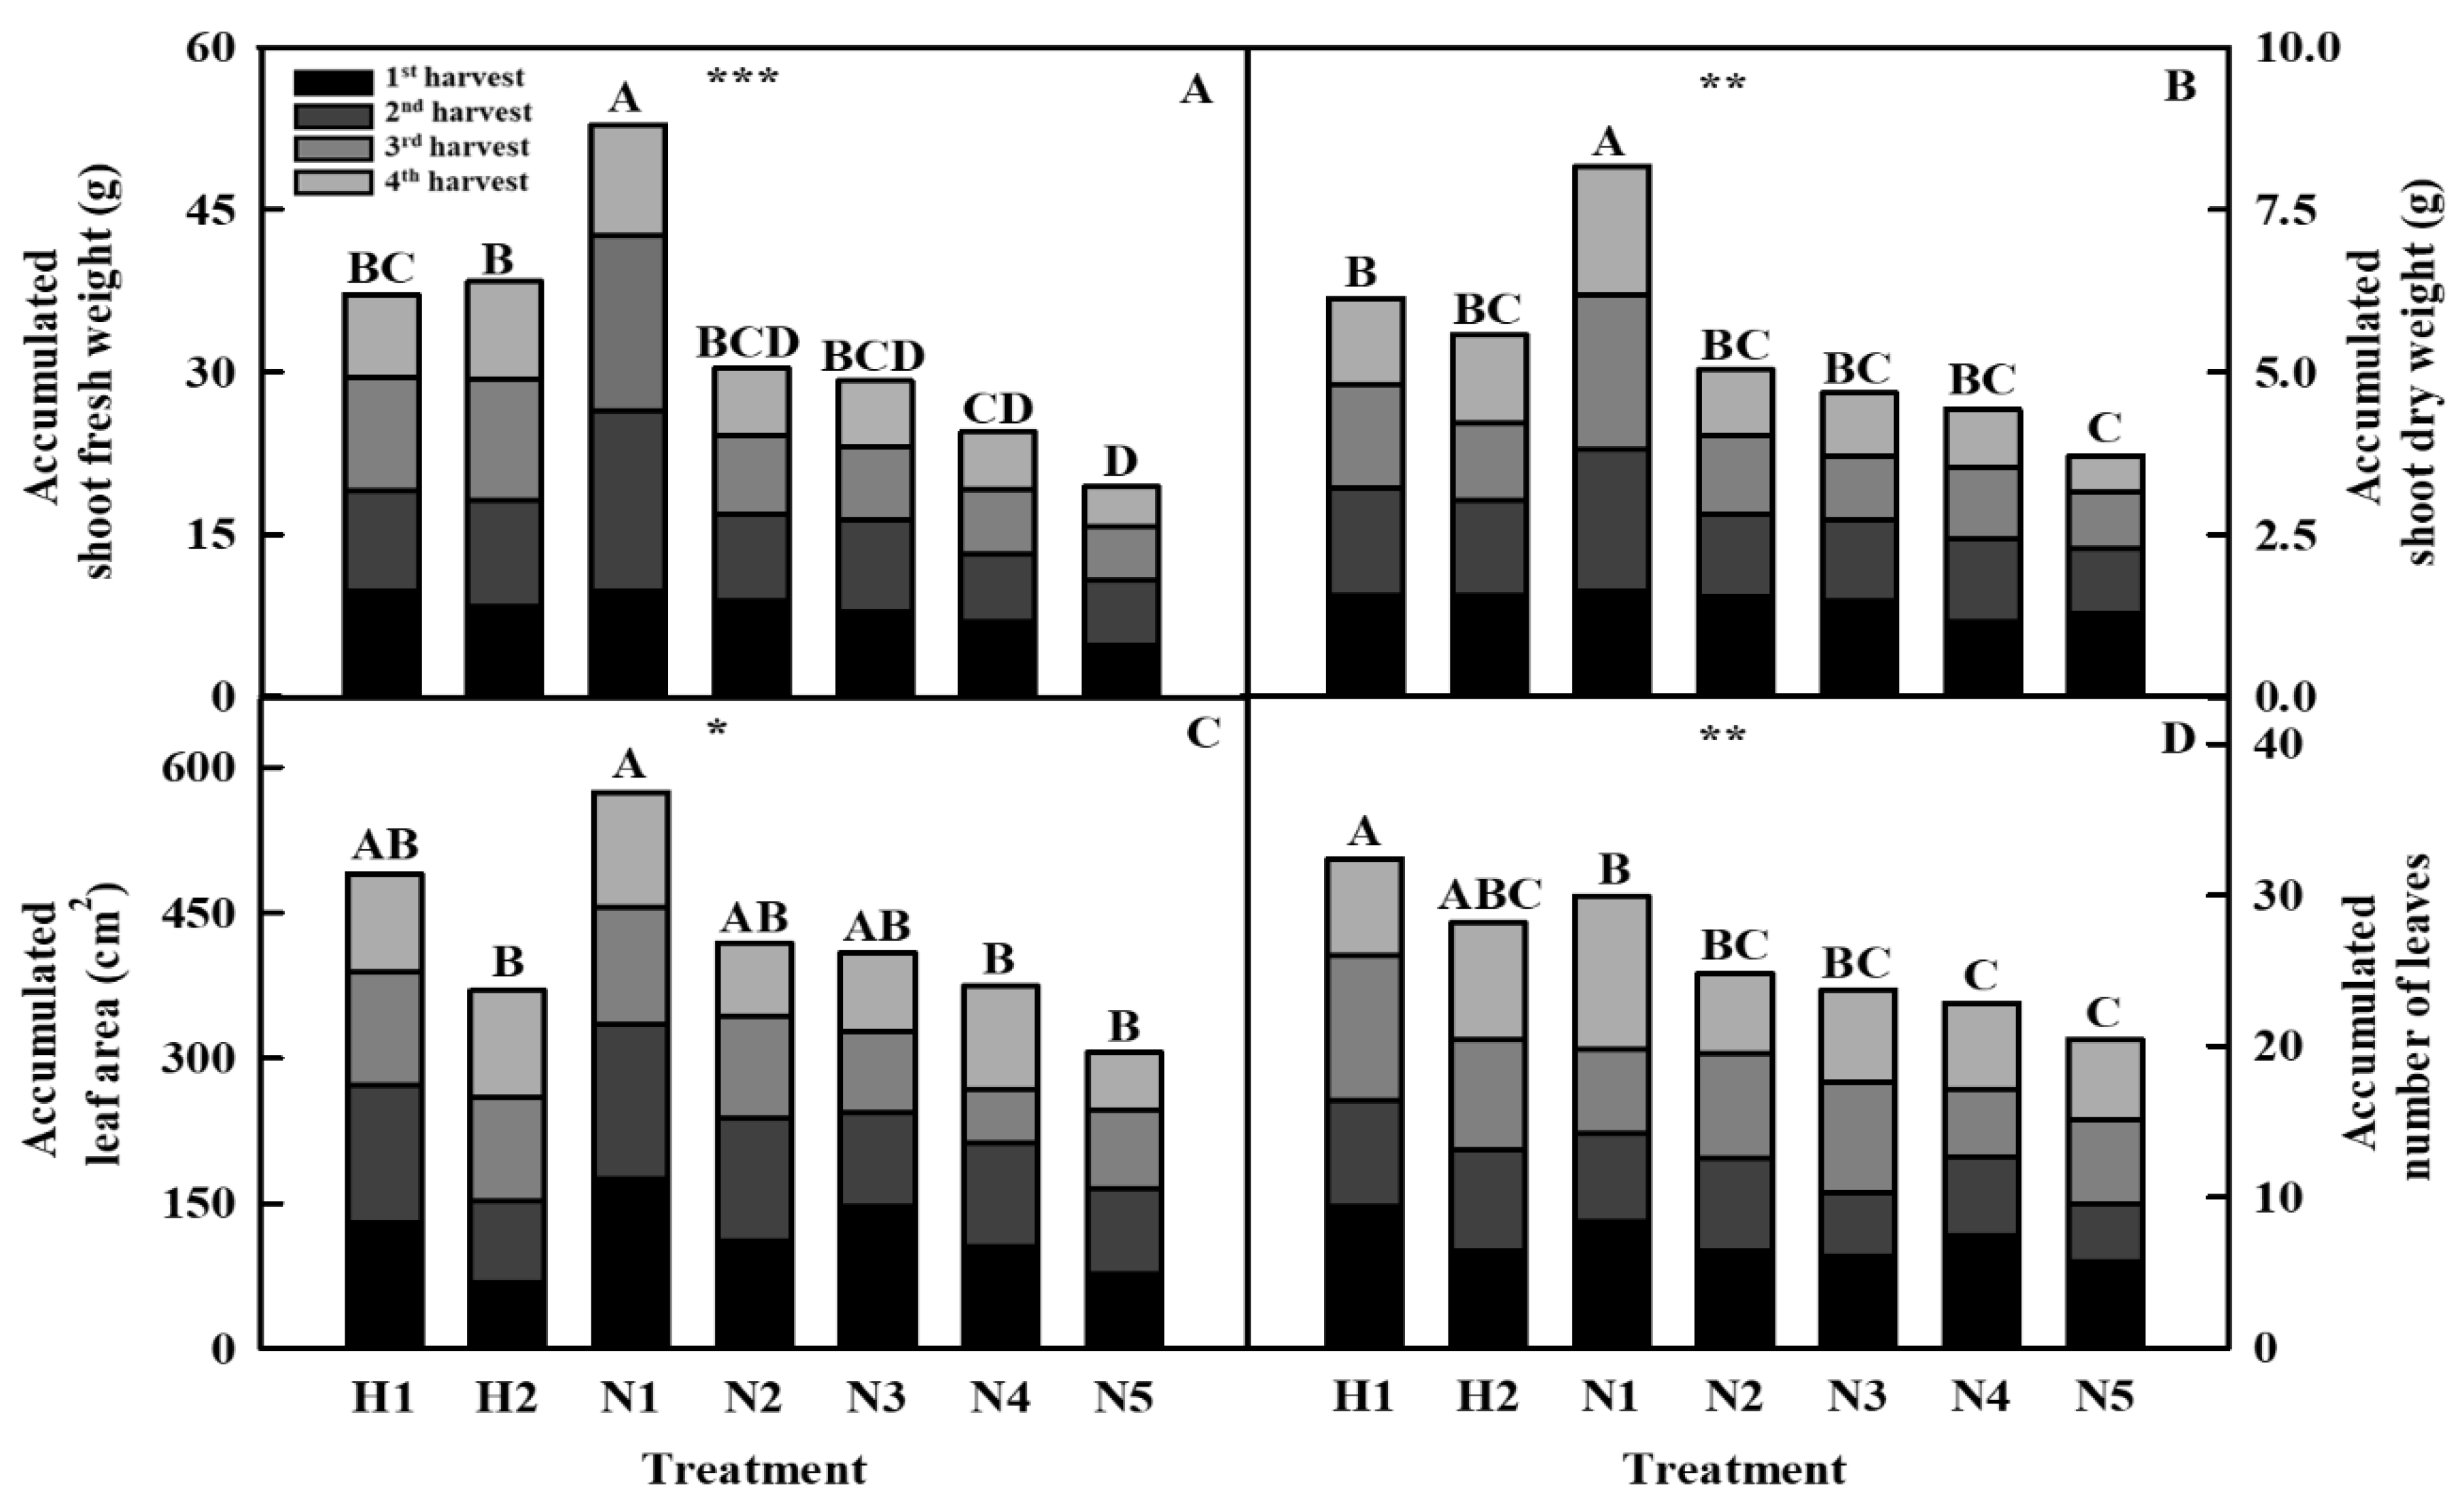
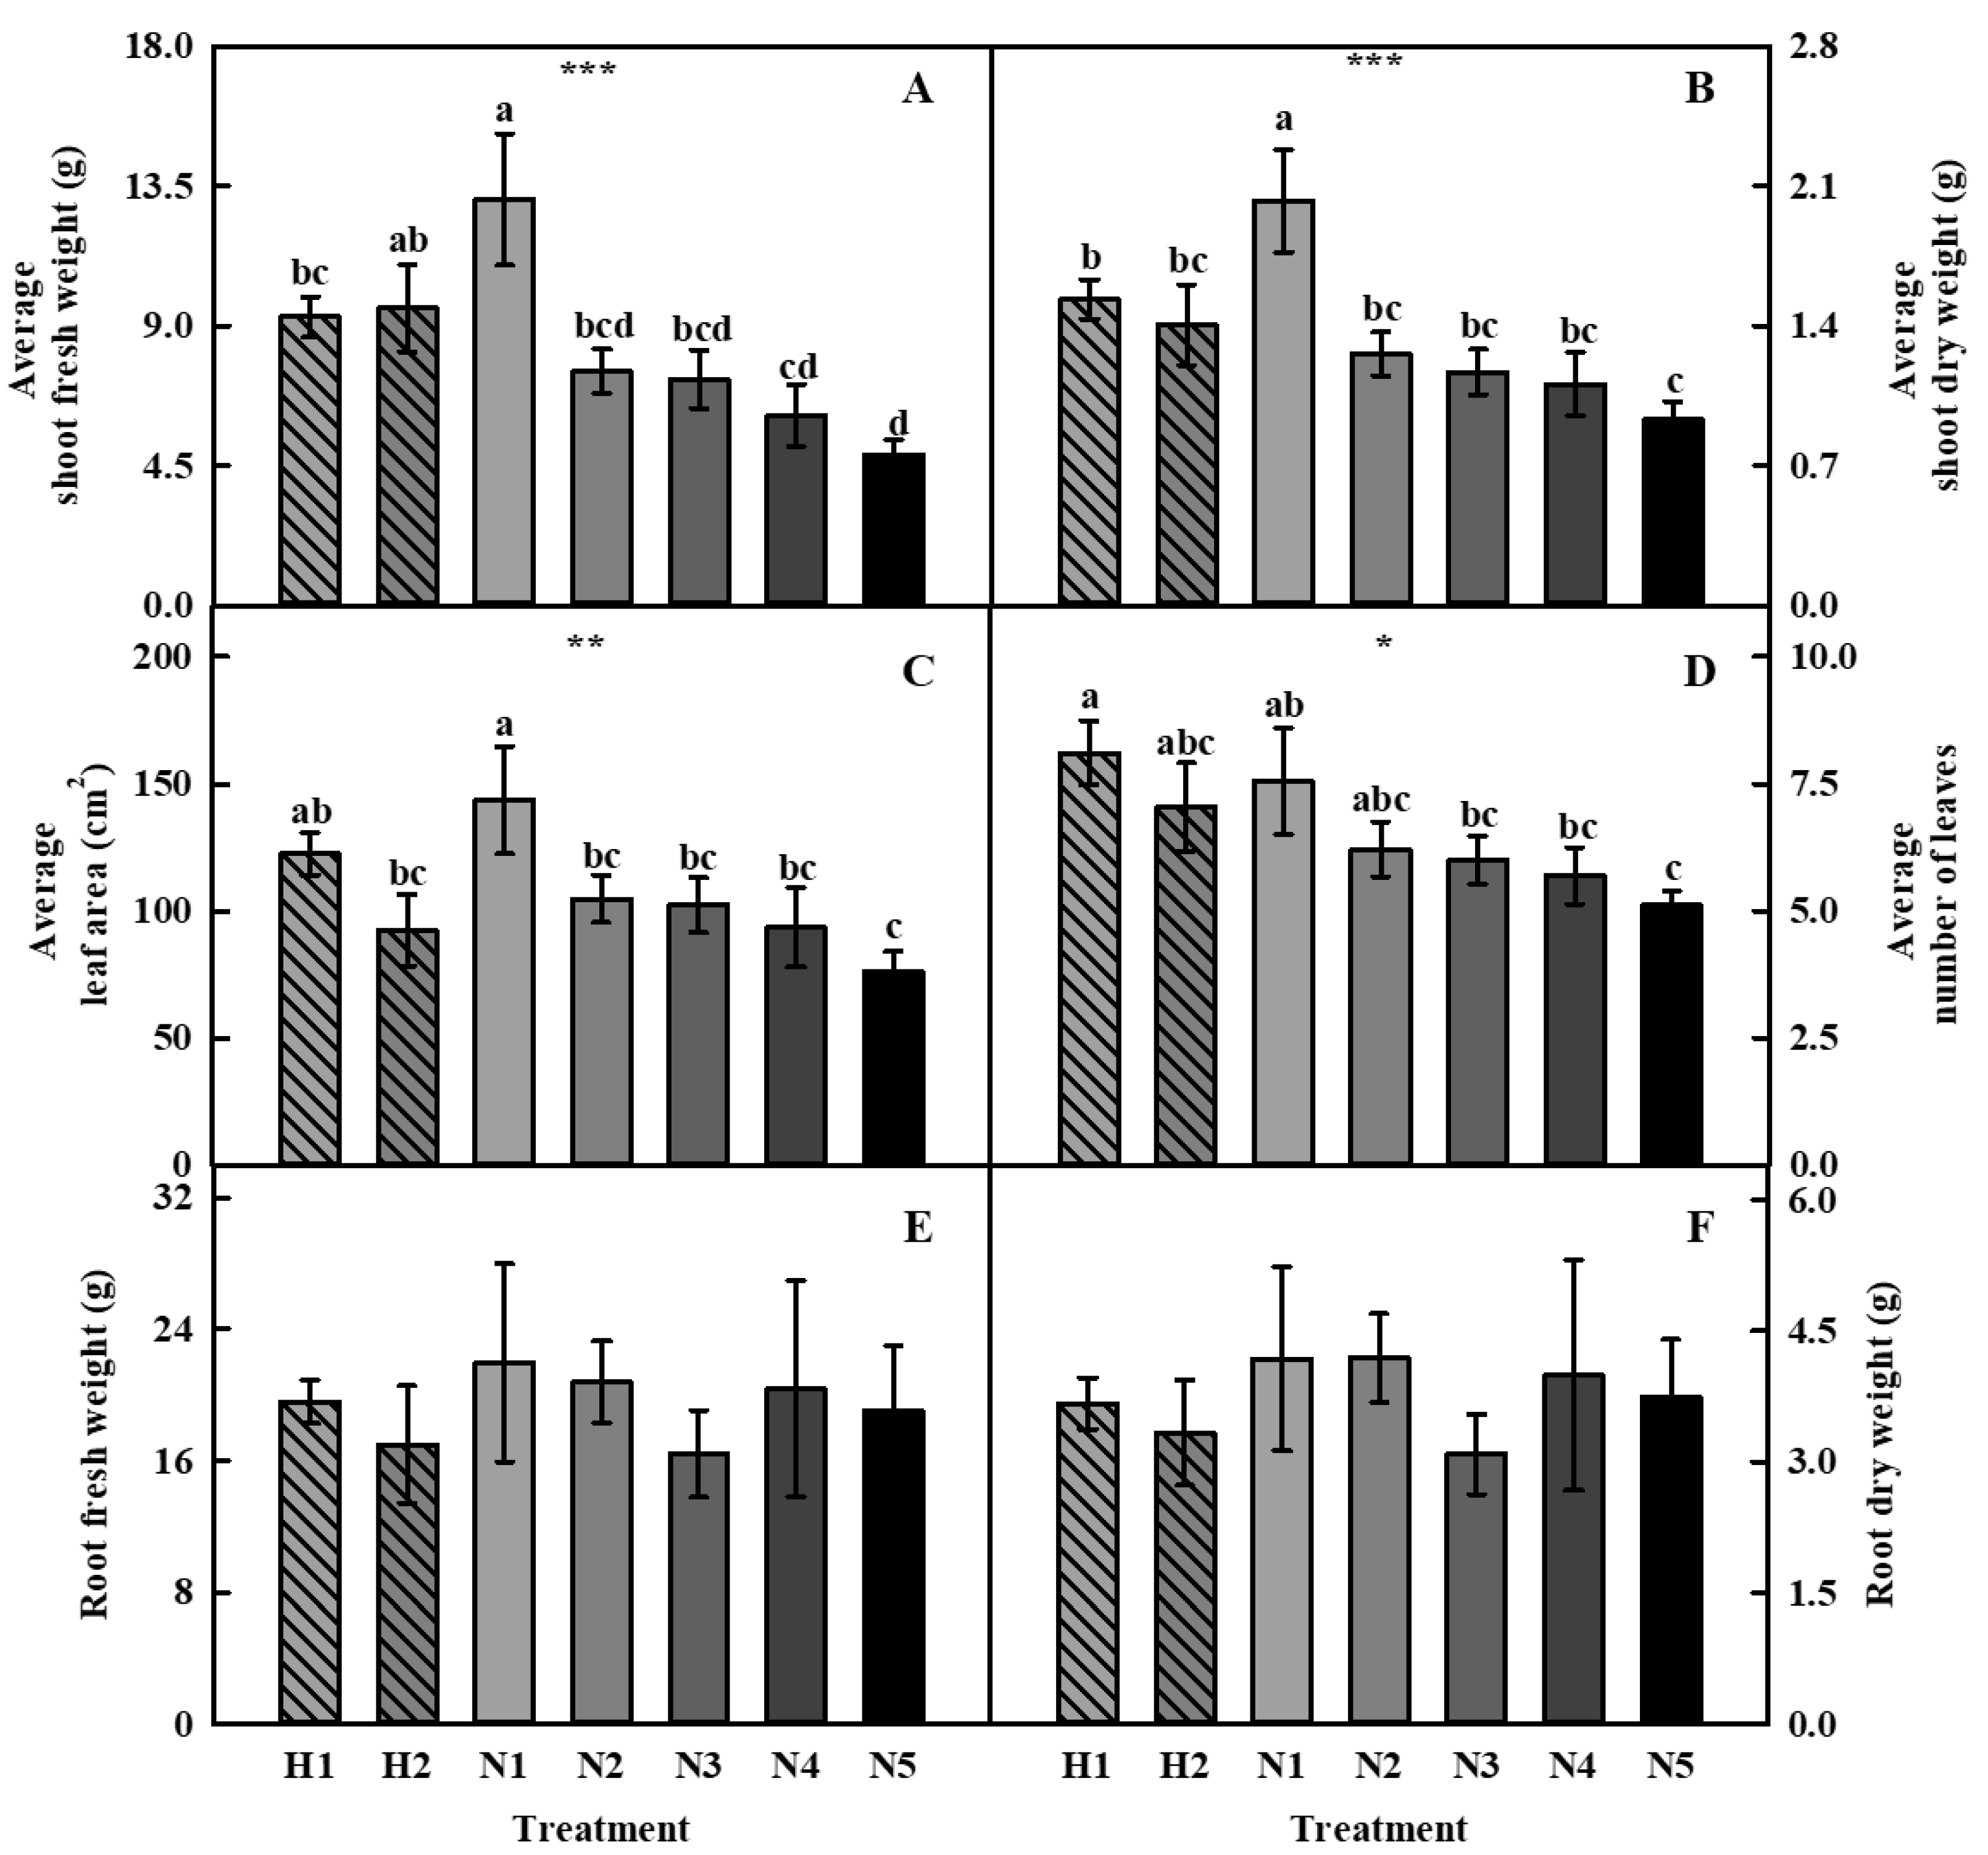
3.3. Growth Characteristics in Newly Developed Nutrient Solution

In Study 2, the growth characteristics, fresh weights of the shoots and roots, leaf area, and number of leaves of coastal glehnia grown in the control (Hoagland) (H1 and H2) and newly developed (N1, N2, N3, N4, and N5) nutrient solutions were investigated during four consecutive harvests. There were no significant differences between the number of harvests in H1, H2, N1, and N2 with respect to the growth characteristics (Table 3).
N1 had the highest accumulated shoot fresh and dry weights among the treatments (Figure 4A,B). In addition, plants grown in N1 had the highest accumulated leaf area, which was significantly higher than that of plants grown in the H2, N4, and N5 treatments (Figure 4C). The accumulated number of leaves in H1 was significantly higher and there was no difference among H2, N1, N2, and N3 (Figure 4D).
The average shoot fresh and dry weights was significantly higher in N1 than in the other treatments, and the weights tended to decrease as the EC concentration of the newly developed nutrient solution increased (Figure 5A,B). The average leaf area of plants grown in N1 was not significantly different from that of plants grown in H1 but was significantly higher than that of plants grown in H2, N2, N3, N4, and N5 (Figure 5C). The average number of leaves tended to decrease as the EC increased (Figure 5D). There was no significant difference in the root fresh and dry weights in terms of the type of nutrient solution or EC concentration (Figure 5E,F).

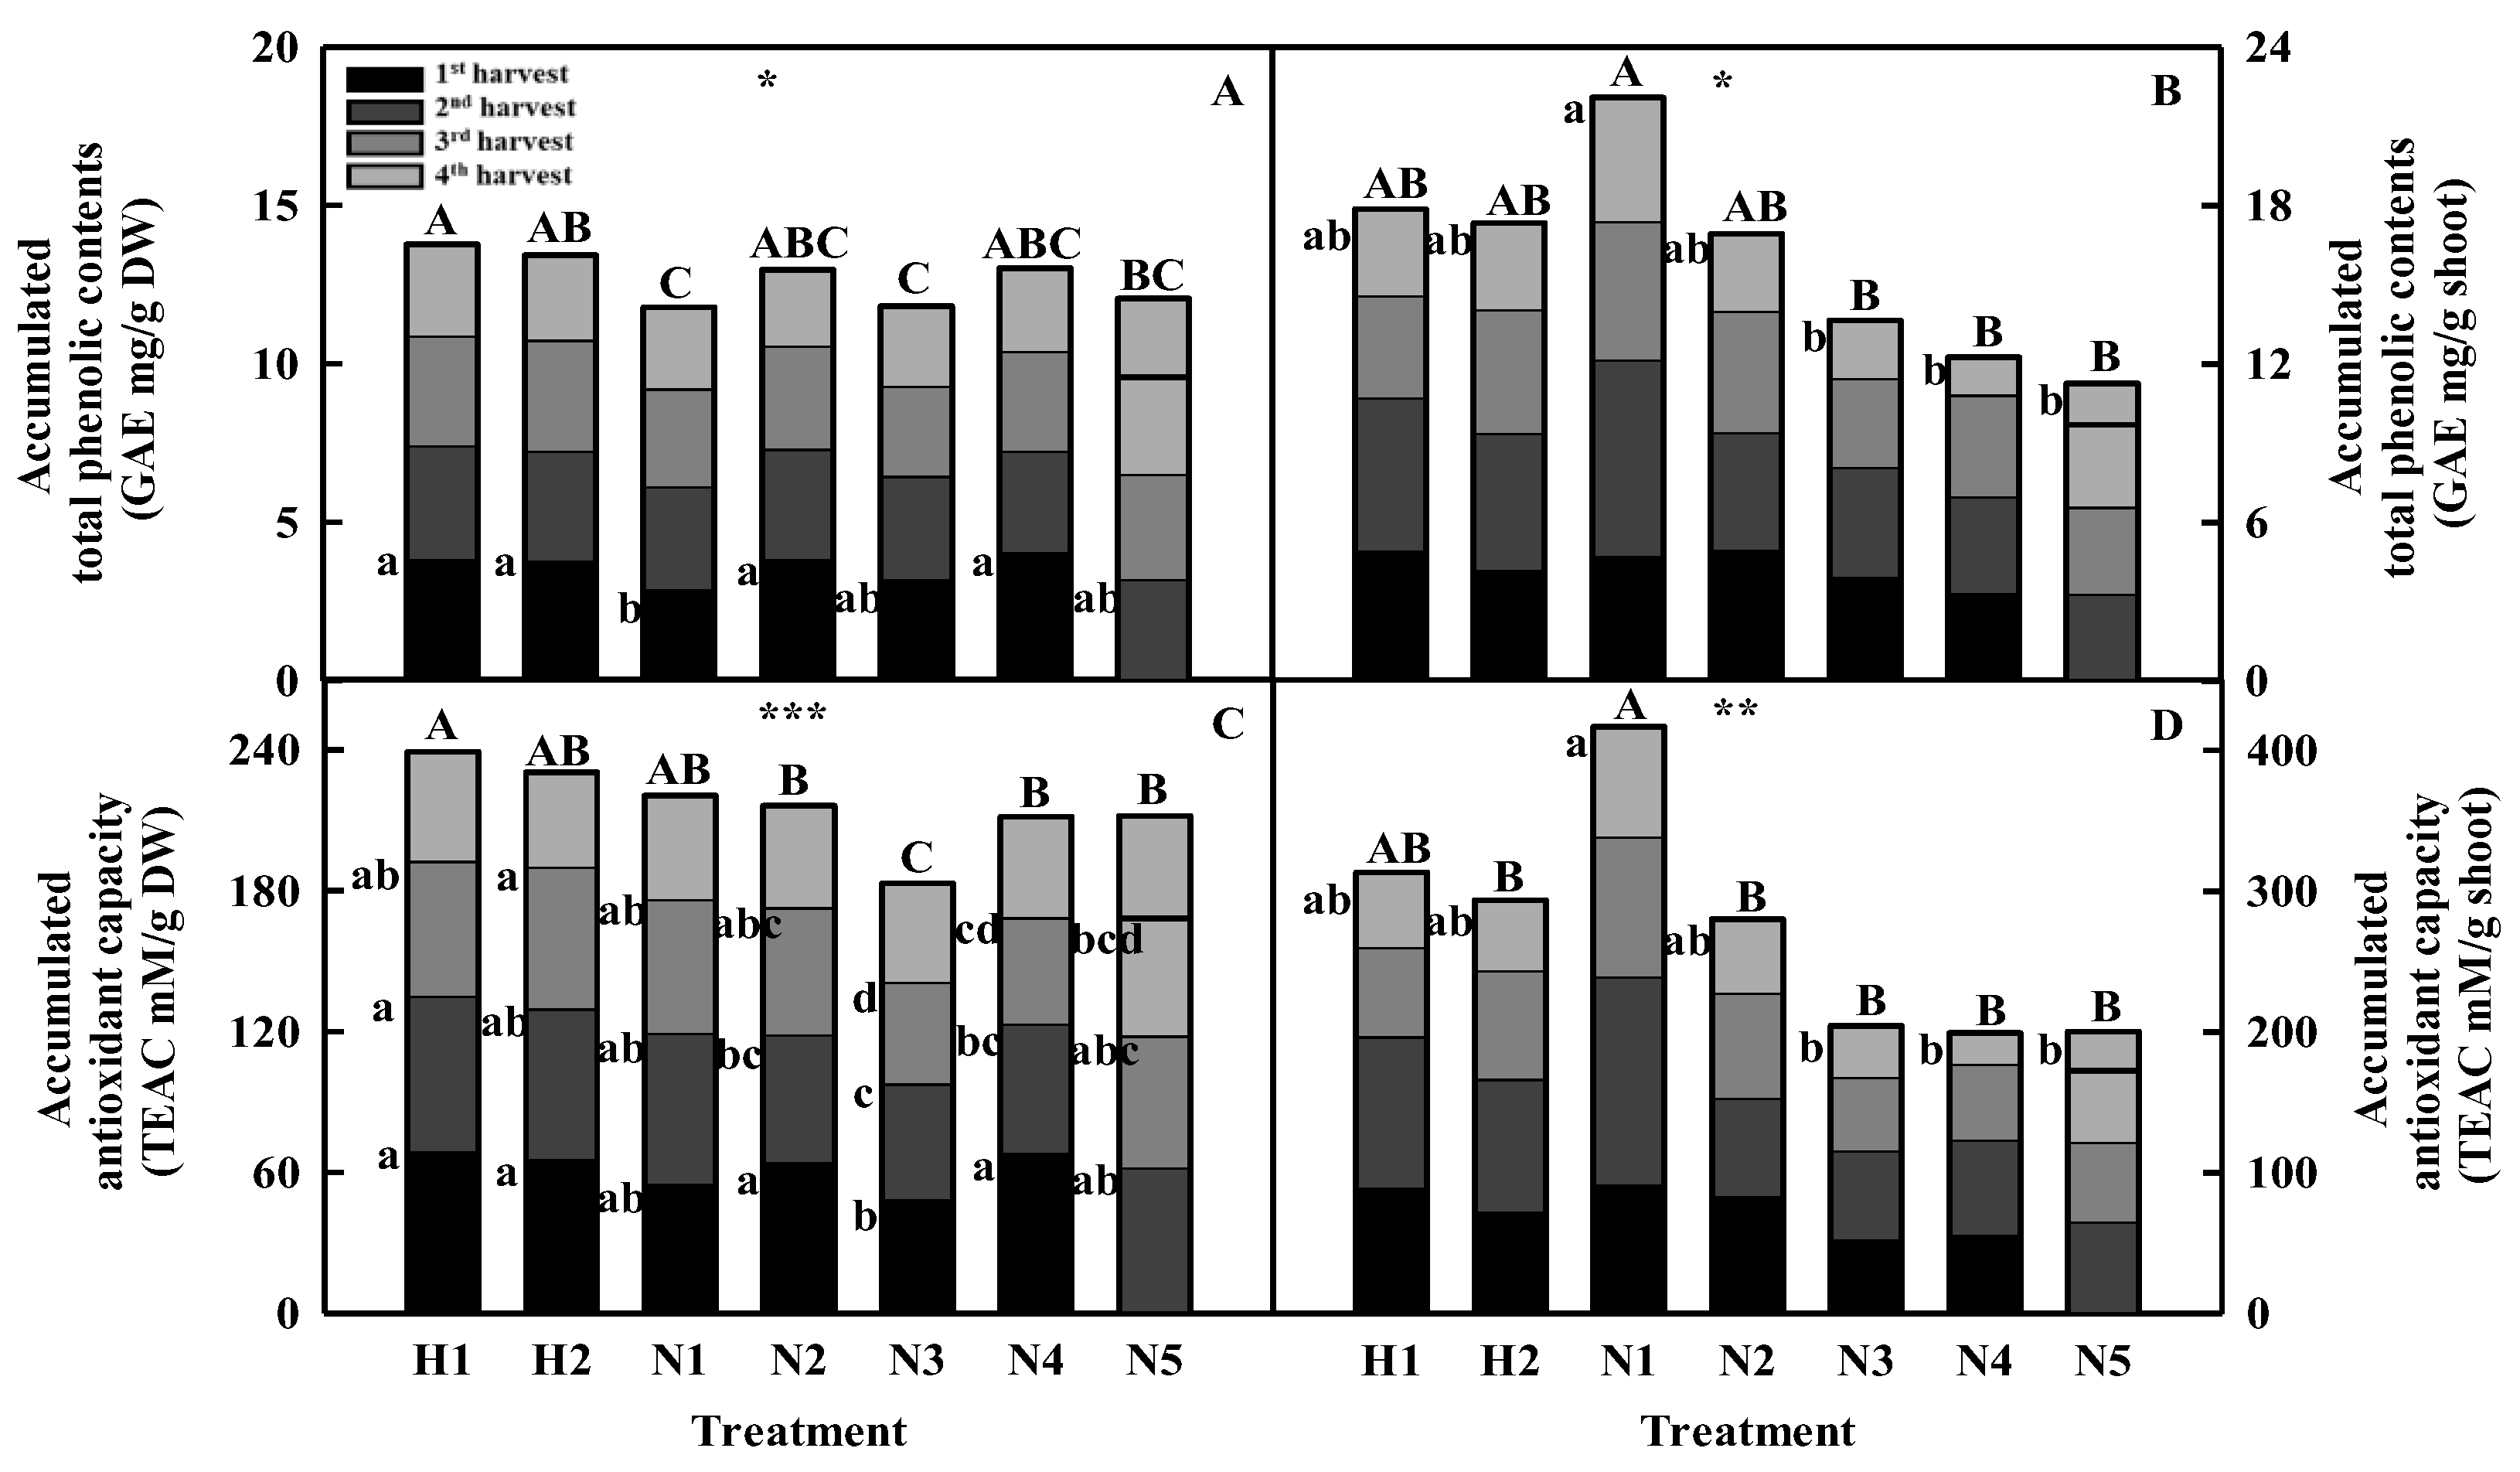
3.4. Total Phenolic Content and Antioxidant Capacity in Newly Developed Nutrient Solution

The EC levels of the nutrient solutions and different types of nutrient solutions affected the total phenolic content and antioxidant capacity of coastal glehnia leaves (Figure 6 and Table 4). The accumulated total phenolic content per gram after the four harvests showed a slightly lower tendency in the newly developed nutrient solution than in the control solution (Figure 6A). There was no significant difference in the accumulated total phenolic content per shoot between the H1, H2, N1, and N2 treatments; however, N1 showed the highest value, which was significantly higher than that of N3, N4, and N5 (Figure 6B). In addition, the antioxidant capacity per gram in plants grown in the newly developed nutrient solution was lower than in plants grown in the control solution, but there was no significant difference among H1, H2, and N1 (Figure 6C). There was no significant difference in the accumulated antioxidant capacity per shoot between N1 and H1, but that of N1 was significantly higher than that of H2, N2, N3, N4, and N5 (Figure 6D). As the EC level of the newly developed nutrient solution increased, there was no significant difference between the total phenol content and antioxidant capacity per gram (except for N3), whereas the accumulated content of the shoots decreased.

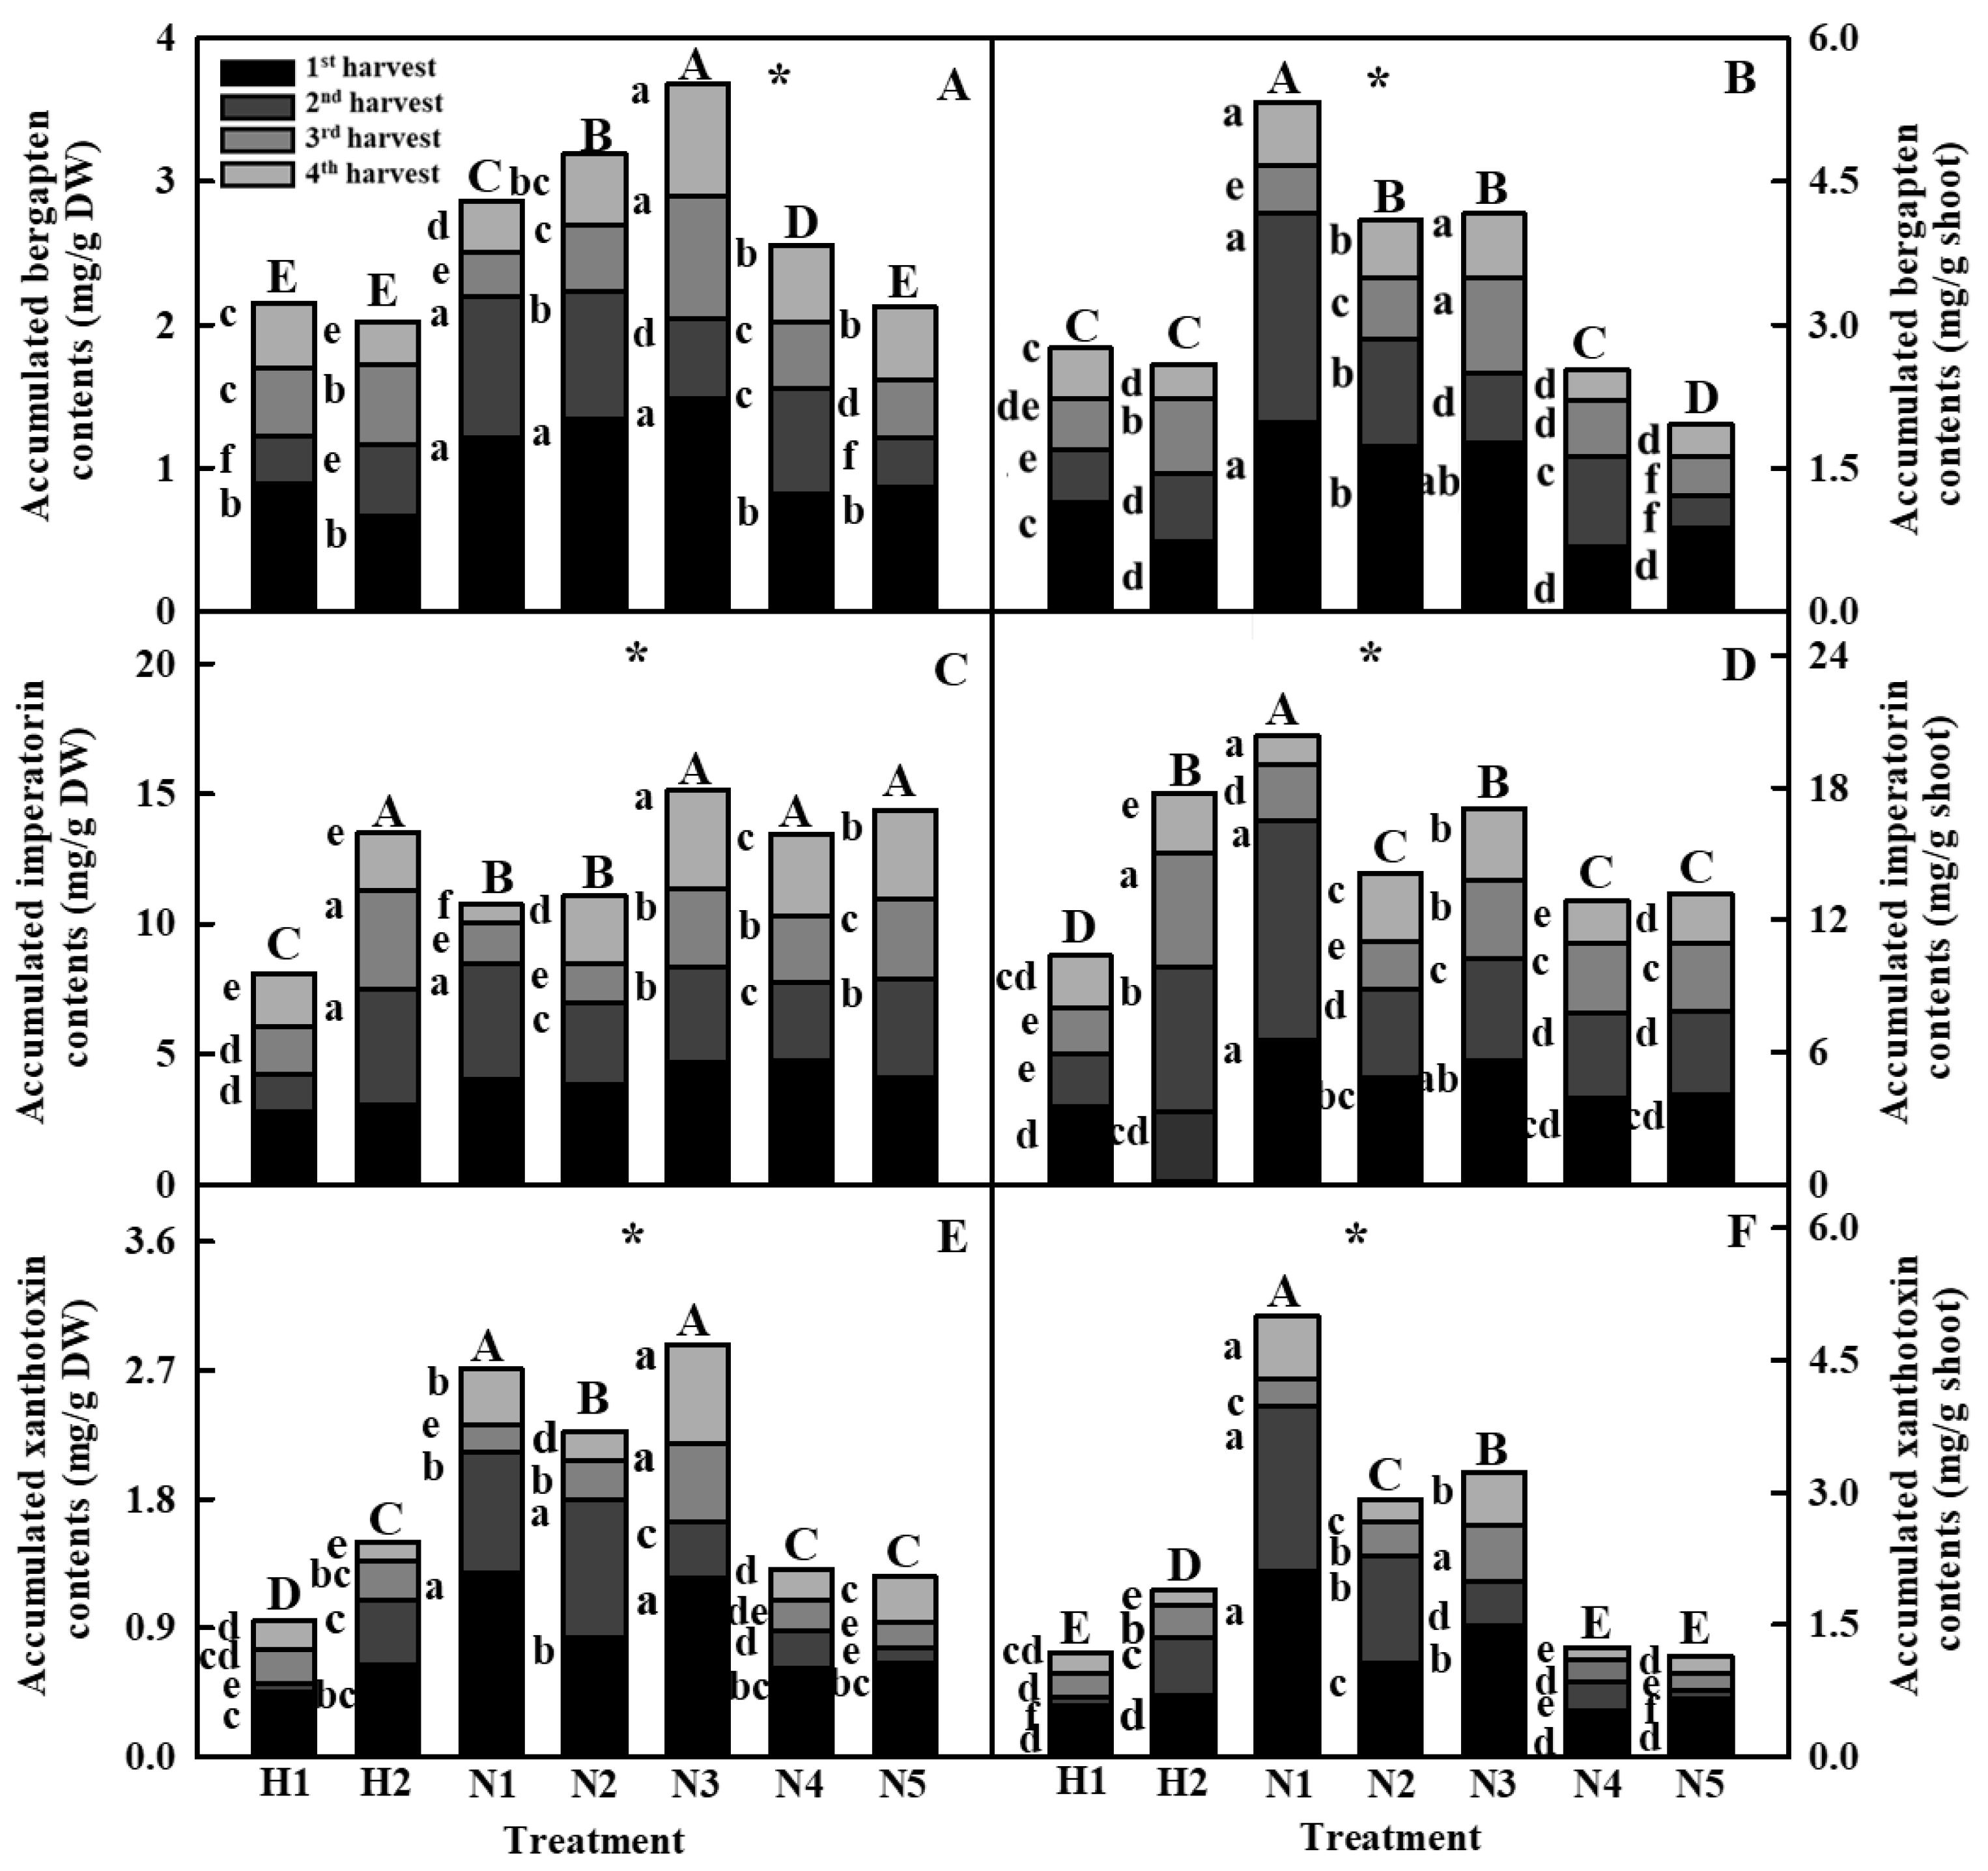
3.5. Individual Bioactive Compounds in Newly Developed Nutrient Solution

The developed nutrient solution treatments improved the xanthotoxin, bergapten, and imperatorin content in coastal glehnia leaves (Figure 7). After the four harvests, the accumulated bergapten and xanthotoxin content per gram of coastal glehnia shoots was significantly higher in the N1, N2, and N3 treatments than in the H1, H2, N4, and N5 treatments (Figure 7A,E). The imperatorin content per gram in H2, N3, N4, and N5 was significantly higher than in H1, N1, and N2 (Figure 7C). Plants grown in H1 showed a significantly low value for the three individual compounds. The accumulated levels of bergapten, imperatorin, and xanthotoxin per shoot in N1 were 4.2 times, 1.9 times, and 2 times higher than those in H1, respectively, and were significantly higher than the other treatments (Figure 7B,D,F). Generally, as the harvest progressed, the content per shoot of each compound decreased.

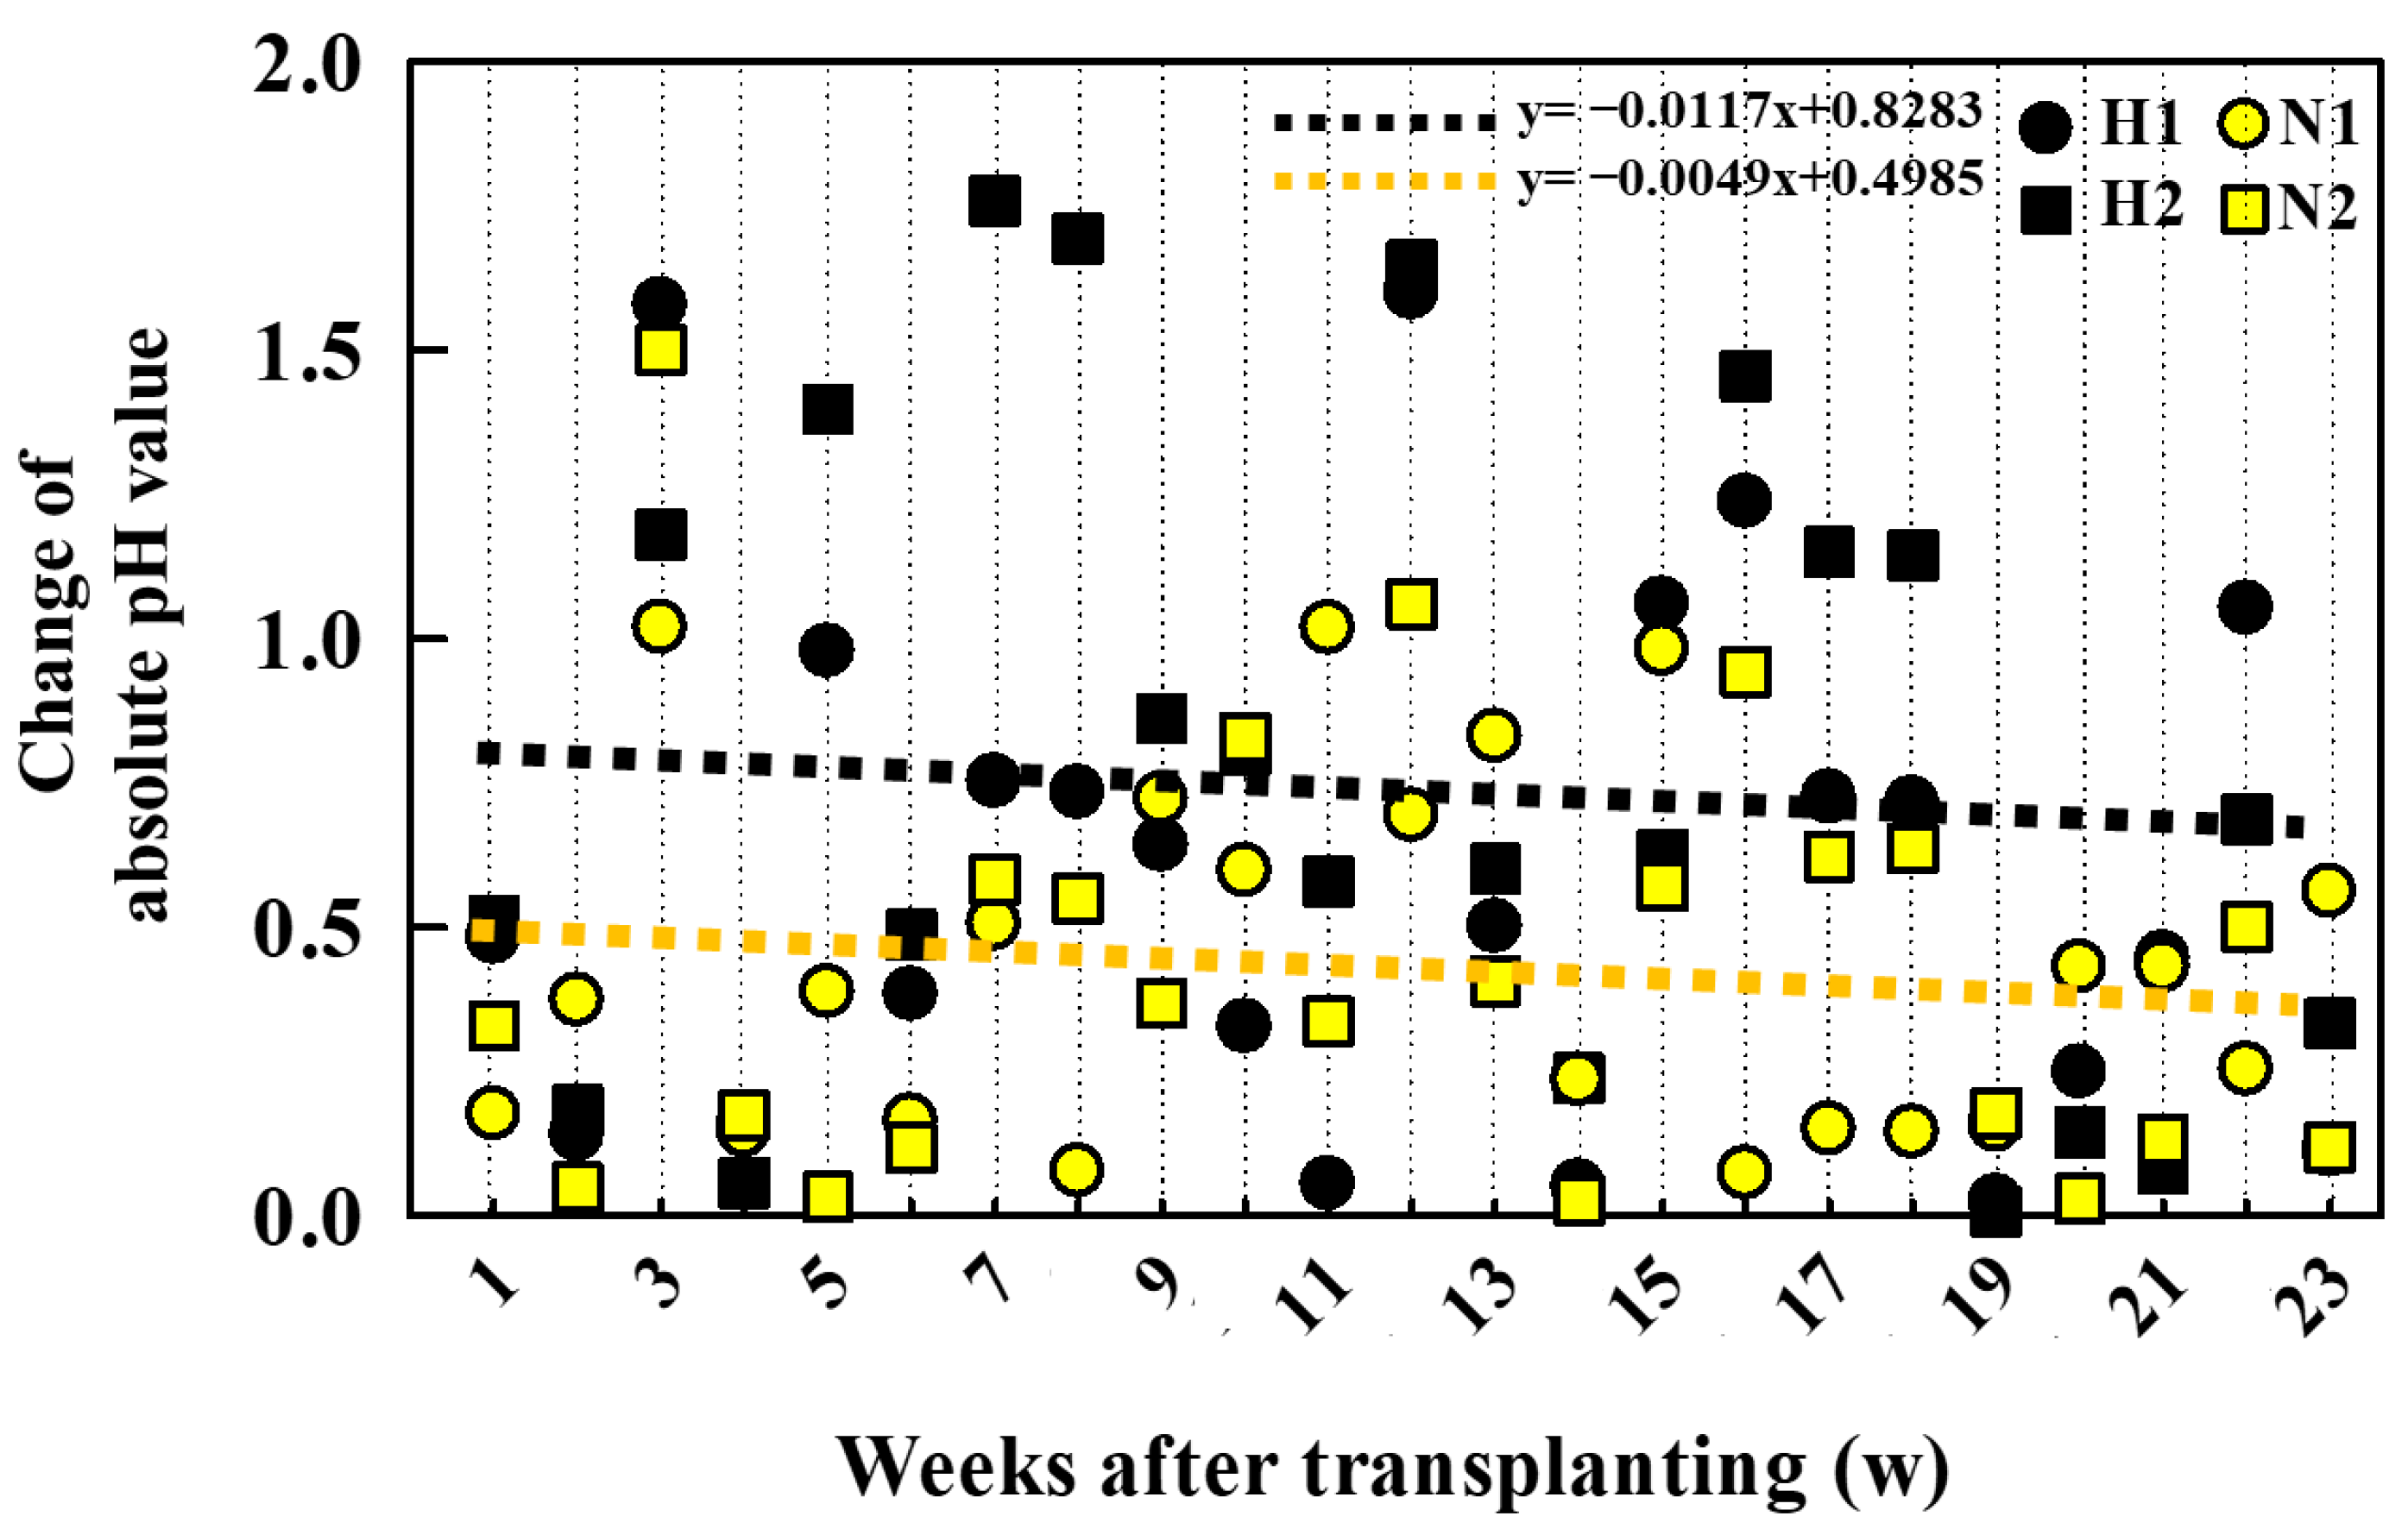
3.6. pH Changes in Newly Developed Nutrient Solution

The newly developed and control nutrient solutions showed continuous changes in the pH during the entire cultivation period, despite periodic nutrient solution replacement (Figure 8). The average absolute pH value of the control nutrient solution treatments (H1 and H2) showed 1.6 times higher pH changes than in the N1 and N2 treatments. The average absolute pH changes in N1 and N2 were 0.4.

4. Discussion

The composition and concentration of the nutrient solution affects the growth and quality of plants cultivated in CEA; therefore, it is essential to establish a suitable nutrient solution for plant growth. Inadequate nutrient solution composition causes specific nutrient deficiencies. In addition, according to ‘Liebig’s Law of the Minimum’, plant growth is limited by the scarcest components, and the excessive nutrient content lowers the water potential of the plant and increases the osmotic potential, leading to the inhibition of the moisture and nutrient absorption of the root [20,21]. Therefore, it is important to supply adequate nutrient composition and concentration to the root zone of each crop because of the different absorption patterns of the nutrient solutions for each plant species.

4.1. Development of the Nutrient Solution for Coastal Glehnia

To confirm the growth characteristics throughout the harvest period and the mineral elements content in coastal glehnia, nutrient solutions with five different EC levels were applied for 20 weeks. Hoagland nutrient solution (used as the control) is a universal nutrient solution for leafy vegetables. At all EC levels, there were no symptoms of physiological disorder in coastal glehnia, and the leaves were continuously developed even after four consecutive harvests every 4 weeks. However, consecutive harvests resulted in a decrease in the production yield of coastal glehnia; therefore, a 4-week harvest interval was not sufficient to develop new leaves in coastal glehnia. The production yield was higher with the harvest at 20 weeks after transplanting than with the continuous harvest every 4 weeks. However, most of the leaves harvested at 20 weeks were larger than the marketable size, which was approximately 5–10 cm (Figure 2C,D).
The increase in the EC levels tended to decrease the coastal glehnia growth, but no physiological disorders were observed in plants grown in the N5 treatment, which was owing to the halophyte characteristics of coastal glehnia. High EC levels activate salt stress-tolerance mechanisms in coastal glehnia. Water is absorbed through increased intracellular osmotic pressure, maintaining turgor and osmotic balance, and promoting the synthesis of osmoprotectants (such as amino acids, proline, polyols, trehalose) [1]. The carbon source for growth is mainly used in this mechanism, which ultimately results in growth inhibition.
Each plant species requires a different ion content for growth. Steiner (1980) suggested that even with an inadequate ion ratio in the nutrient solution, the plants absorb the desired nutrients by using the energy from the assimilation products of roots [16]. In the present study, the nutrient ratios of coastal glehnia differed from those grown in Hoagland solution (Figure 3 and Figure S1). If the preferred ion ratios are not suitable or insufficient, plants use energy to absorb the necessary ions through active absorption rather than passive absorption [22]. This reduces the efficiency of the energy use generated by photosynthesis during the growth process. Therefore, providing ions for the desired absorption is an essential and efficient method for promoting plant growth.

4.2. Growth and Bioactive Compounds in Newly Developed Nutrient Solution

Unlike in Study 1, the production yield of coastal glehnia was maintained for four continuous harvests every 5 weeks in Study 2. Therefore, a 5-week harvest is the minimum period for the reproduction of coastal glehnia leaves (shoot fresh weight) for each harvest (Table 3). However, more than four harvests caused plant senescence and reduced the production yield (data not shown). Appropriate harvest intervals for perennial herbs improve light interception and enhance air movement to widen plant density. In addition, after harvest, the physical stress-resistance mechanism is activated to recover the cut area [23]. The N1 treatment showed the highest accumulation and average values of shoot fresh and dry weights for the four harvests.
The newly developed nutrient solution contained the preferred nutrient absorption ratios for coastal glehnia, and nutrient uptake occurred mainly through passive absorption, leading to energy saving for roots and, subsequently, improvement in overall plant growth and development.
Coastal glehnia is distributed in coastal sand dunes with low salinity compared to salinity in mudflats, brackish water, and reclaimed land, and does not require salinity for growth. Therefore, coastal glehnia is considered to be a facultative halophyte. Depending on the salinity requirements of the plant life cycle, halophytes can be divided into obligatory and facultative halophytes. Facultative halophytes can survive salinity but prefer nonsaline freshwater conditions. Duarte et al. (2014) showed that the facultative halophytes Puccinellia maritima and Thellungiella halophila can survive in high-salinity environments and grow best under nonsaline conditions [24]. In this respect, even though the newly developed nutrient solution possessed the preferred nutrient absorption ratio for the studied plant, a high EC level can induce salt and osmotic stress responses, limiting nutrient and water absorption from the root and activating the mechanisms for toxic ion release and isolation [1,25]. This resulted in a decrease in the growth and development of coastal glehnia. The root fresh and dry weights of coastal glehnia did not differ among the EC levels of the nutrient solution (Figure 5E,F). At high EC levels, nutrient imbalance occurs owing to excessive absorption of specific nutrients [26], and even at high EC levels, root growth is not inhibited to ensure absorption to recover deficient nutrients. Sun et al. (2020) reported that fine root development was induced to obtain nutrients when the absorption of specific nutrients was not possible [27].
Bioactive compounds (phytochemicals) or secondary metabolites in plants have functional roles, such as antioxidant, antitumor, and anti-inflammatory properties, and are beneficial to human health. In addition, secondary metabolites are related to defense mechanisms against environmental stress and disease resistance, and primary metabolites are directly used as precursors for plant growth [28]. Healthy plants actively synthesize and decompose primary and secondary metabolites. Environmental and physical stresses have been applied as elicitors to improve plant secondary metabolites. However, wild plants, such as coastal glehnia, naturally have high environmental resistance. Therefore, carbon distribution is used more extensively for secondary metabolism in wild plants than in vegetable crops, which is related to their high pharmacological efficacy [29].
Phenolic compounds, which are the main class of bioactive compounds, are natural antioxidants in plants. Generally, vegetable cultivars have an inverse relationship between growth and bioactive compounds, known as the dilution effect [30]. However, the total phenolic content and antioxidant capacity of coastal glehnia increased with plant growth, which was the opposite of the dilution effect. In particular, plants grown in N1 showed that the best growth result had the highest total phenolic content and antioxidant capacity per shoot. Crepidiastrum denticulatum, a wild plant, also had high values of bioactive compounds with the best shoot growth without a dilution effect [20]. Therefore, it is a unique characteristic of bioactive compound accumulation in wild plants, and the increased biomass of wild plants is important for producing health-promoting bioactive compounds, which is different from that of vegetable crops.
Coastal glehnia contains furocoumarin compounds, such as bergapten, xanthotoxin, psoralen, and imperatorin, which are beneficial for reducing rheumatoid and inflammatory diseases and have been reported to inhibit HIV activity [31]. The roots and rhizomes of coastal glehnia have been used for medicinal purposes. In our results, the shoots had approximately 21 times higher bergapten, xanthotoxin, and imperatorin levels than the roots (Figure 7 and Figure S2), consistent with the results reported by Gu et al. (2017) [9]. Kim et al. (2020) reported that 1-year-old ginseng sprouts had a higher saponin content than the roots [32]. As a perennial herb, the root of coastal glehnia develops gradually by accumulating carbon assimilates from the shoot. In field cultivation, the root has to grow for at least five years to have pharmaceutical efficacy. Therefore, the coastal glehnia shoots with a high level of bioactive compounds produced by hydroponic cultivation may accelerate the production of commercially valuable roots.
The N1 treatment resulted in a higher accumulation of individual compounds content such as bergapten, xanthotoxin, and imperatorin in coastal glehnia leaves than in the control nutrient solution treatment. Coastal glehnia grown in N1 induced the highest biomass and had the highest individual compounds per shoot, which was similar to the results for the total phenolic content and antioxidant capacity. Lee et al. (2020) reported that the best growth of Ophiorrhiza pumila at optimal nutrient solution concentrations showed a high accumulation of pharmacological components (camptothecin) [33]. The synthesis of secondary metabolites is induced as the production of primary metabolites becomes active under suitable conditions for growth.
In hydroponic culture, the pH is a particularly important factor because it affects not only plant nutrient and water absorption, but also the enzyme activity of root cells and the pH of the apoplast [34]. In general, the proper pH level of a nutrient solution is 5.5 to 6.5 [35]. An excessive decrease or increase in the pH limits the absorption of water and nutrients by the roots. In particular, a low pH causes high H+ injury to the roots and generates ROS to induce oxidative stress and electrolyte leakage. In addition, it also reduces hydraulic conductance and lowers the activation of auxin and cytokinin, which limits phosphorus solubility and restricts rooting and root elongation [36,37,38,39,40]. Coastal glehnia prefers the uptake of cations, and the pH decreases sharply during cultivation. However, the newly developed nutrient solution notably reduced the rate of pH change compared to that of the control solution (Figure 8). Bugbee (2004) suggested that the components and their ratios in the nutrient solution change owing to plant nutrient absorption, resulting in an imbalance of inorganic ions in the nutrient solution and subsequently changing the pH [41]. Newly developed nutrient solutions established based on the cation and anion ratios of coastal glehnia can maintain the ion balance in the nutrient solution and the low pH change rate compared to the control nutrient solution. If the nutrient solution was not replaced during the cultivation period, there was a greater difference in the pH stability between the newly developed and the control nutrient solutions, which led to a difference in growth.
The absorption pattern of total minerals or individual essential minerals is typically changed by the plant growth stage. Thus, changes in the EC levels of a nutrient solution according to the growth stage affect plant growth and development [20,22]. The EC level did not change during the whole cultivation period in this study. Further study for the EC control of the newly developed nutrient solution according to the growth stage is needed to further improve the growth and quality of hydroponically cultivated coastal glehnia.

5. Conclusions

In this study, a nutrient solution was developed for the mass production of coastal glehnia in the CEA. A new nutrient solution for coastal glehnia was developed based on the ratio of cations and anions of the macro essential elements of coastal glehnia shoots. The newly developed nutrient solution with EC 1 dS·m−1 was appropriate for the production of coastal glehnia, and also effective in increasing the bioactive compounds level. Our results demonstrate that the plant production and quality can be improved by selecting an appropriate nutrient solution and concentration to establish plant cultivation conditions for CEA.

Supplementary Materials

The following supporting information can be downloaded at: https://www.mdpi.com/article/10.3390/horticulturae9070776/s1, Figure S1: mutual ratio of cation and anion compositions of coastal glehnia grown in Hoagland nutrient solution with five different EC levels (n = 5); Figure S2: accumulated individual bioactive compounds of coastal glehnia per mg (A) of root and whole root (B) with four consecutive harvests in plants grown in Hoagland and newly developed nutrient solutions with various EC levels for 23 weeks after transplanting. Different letters in the figures indicate significant differences. *, indicates significance at p < 0.05 (n = 4). Figure S3: coastal glehnia grown in Hoagland (H1) and newly developed nutrient solutions (N1) with EC 1.0 dS·m−1; Figure S4: HPLC chromatogram of coastal glehnia grown in newly developed nutrient solutions.

Author Contributions

Conceptualization, methodology, formal analysis, investigation, visualization, resources, data curation, writing—original draft preparation, review, and editing, M.-S.Y.; conceptualization, writing—review and editing, supervision, project administration, M.-M.O. All authors have read and agreed to the published version of the manuscript.

Funding

This research was funded by the “Cooperative Research Program for Agriculture Science & Technology Development (Project No. PJ01385201)” Rural Development Administration, Korea.

Data Availability Statement

All the data is available in the paper.

Conflicts of Interest

The authors declare no conflict of interest.

References

  1. Kim, E.K. Halophytes of Korea, 1st ed.; Econature: Seoul, Republic of Korea, 2013; pp. 188–190. [Google Scholar]
  2. Mishra, A.; Tanna, B. Halophytes: Potential resources for salt stress tolerance genes and promoters. Front. Plant Sci. 2017, 8, 829. [Google Scholar] [CrossRef] [PubMed]
  3. Um, Y.R. Isolation and Structure Determination of Bioactive Constituents from the Salt Marsh Plant Glehnia littoralis. Master’s Thesis, Korea Maritime and Ocean University, Busan, Republic of Korea, 2008. [Google Scholar]
  4. Kong, C.S.; Um, Y.R.; Lee, J.I.; Kim, Y.A.; Yea, S.S.; Seo, Y. Constituents isolated from Glehnia littoralis suppress proliferations of human cancer cells and MMP expression in HT1080 cells. Food Chem. 2010, 120, 385–394. [Google Scholar] [CrossRef]
  5. Ishikawa, T.; Sega, Y.; Kitajima, J. Water-soluble constituents of Glehnia littoralis fruit. Chem. Pharm. Bull. 2001, 49, 584–588. [Google Scholar] [CrossRef] [Green Version]
  6. Hiraoka, N.; Chang, J.I.; Bohm, L.R.; Bohm, B.A. Furanocoumarin and polyacetylenic compound composition of wild Glehnia littoralis in North America. Biochem. Syst. Ecol. 2002, 30, 321–325. [Google Scholar] [CrossRef]
  7. Um, Y.R.; Lee, J.I.; Lee, J.L.; Kim, H.J.; Yea, S.S.; Seo, Y.W. Chemical constituents of the halophyte Glehnia littoralis. J. Korean Chem. Soc. 2010, 54, 701–706. [Google Scholar] [CrossRef] [Green Version]
  8. Kim, C.J.; Ji, H.J.; Choi, S.K.; Yu, C.Y.; Lee, J.G. Antioxidant activity and non-targeted metabolic profiling of solvent fractions of Glehnia littoralis Shoots. Korean J. Med. Crop Sci. 2022, 30, 124–133. [Google Scholar] [CrossRef]
  9. Gu, Y.R.; Kim, S.W.; Son, Y.W.; Hong, J.H. Antioxidant activities of solvent extracts from different Glehnia Radix parts and their inhibitory effect against nitric oxide production in Raw 264.7 cell. Korean J. Food Preserv. 2017, 24, 116–124. [Google Scholar] [CrossRef]
  10. Kozai, T. 2018 Smart Plant Factory: The Next Generation Indoor Vertical Farms, 1st ed.; Springer: Berlin/Heidelberg, Germany, 2018. [Google Scholar]
  11. Kozai, T.; Niu, G.; Takagaki, M. Plant Factory: An Indoor Vertical Farming System for Efficient Quality Food Production, 1st ed.; Academic Press: Cambridge, MA, USA, 2019. [Google Scholar]
  12. Choi, K.Y.; Yang, E.Y.; Park, D.K.; Kim, Y.C.; Seo, T.C.; Yun, H.K.; Seo, H.D. Development of nutrient solution for hydroponics of Cruciferae leaf vegetables based on nutrient-water absorption rate and the cation ratio. J. Bio-Environ. Control 2005, 14, 289–297. [Google Scholar]
  13. Nguyen, T.K.L.; Yeom, M.S.; Oh, M.M. Effect of a newly-developed nutrient solution and electrical conductivity on growth and bioactive compounds in Perilla frutescens var. crispa. Agronomy 2021, 11, 932. [Google Scholar] [CrossRef]
  14. Yeom, M.S.; Nguyen, T.K.L.; Cho, J.S.; Oh, M.M. Improving germination rate of coastal glehnia by cold stratification and pericarp removal. Agronomy 2021, 11, 944. [Google Scholar] [CrossRef]
  15. Havlin, J.L.; Soltanpour, P.N. A nitric acid plant tissue digest method for use with inductively coupled plasma spectrometry. Commun. Soil Sci. Plant Anal. 1980, 11, 969–980. [Google Scholar] [CrossRef]
  16. Steiner, A.A. The selective capacity of plants for ions and its importance for the composition and treatment of the nutrient solution. Acta Hortic. 1980, 98, 87–98. [Google Scholar] [CrossRef]
  17. Ainsworth, E.A.; Gillespie, K.M. Estimation of total phenolic content and other oxidation substrates in plant tissues using Folin–Ciocalteu reagent. Nat. Protoc. 2007, 2, 875–877. [Google Scholar] [CrossRef]
  18. Son, K.H.; Oh, M.M. Leaf shape, growth, and antioxidant phenolic compounds of two lettuce cultivars grown under various combinations of blue and red light-emitting diodes. HortScience 2013, 48, 988–995. [Google Scholar] [CrossRef]
  19. Miller, N.J.; Rice-Evans, C.A. Spectrophotometric determination of antioxidant activity. Redox Rep. 1996, 2, 161–171. [Google Scholar] [CrossRef]
  20. Park, S.Y.; Oh, S.B.; Kim, S.M.; Cho, Y.Y.; Oh, M.M. Evaluating the effects of a newly developed nutrient solution on growth, antioxidants, and chicoric acid contents in Crepidiastrum denticulatum. Hortic. Environ. Biotechnol. 2016, 57, 478–486. [Google Scholar] [CrossRef]
  21. Ågren, G.I.; Wetterstedt, J.Å.M.; Billberger, M.F.K. Nutrient limitation on terrestrial plant growth–modeling the interaction between nitrogen and phosphorus. New Phytol. 2012, 194, 953–960. [Google Scholar] [CrossRef] [PubMed]
  22. Ko, S.M.; Lee, J.H.; Oh, M.M. Development of nutrient solution for in vitro propagation of ‘M9′ apple rootstock plantlets. Hortic. Sci. Technol. 2018, 36, 202–214. [Google Scholar] [CrossRef]
  23. Pal, P.K.; Mahajan, M.; Prasad, R.; Pathania, V.; Singh, B.; Ahuja, P.S. Harvesting regimes to optimize yield and quality in annual and perennial Stevia rebaudiana under sub-temperate conditions. Ind. Crops Prod. 2015, 65, 556–564. [Google Scholar] [CrossRef]
  24. Duarte, B.; Sleimi, N.; Caçador, I. Biophysical and biochemical constraints imposed by salt stress: Learning from halophytes. Front. Plant Sci. 2014, 5, 746. [Google Scholar] [CrossRef] [Green Version]
  25. Wu, M.; Kubota, C. Effects of high electrical conductivity of nutrient solution and its application timing on lycopene, chlorophyll and sugar concentrations of hydroponic tomatoes during ripening. Sci. Hortic. 2008, 116, 122–129. [Google Scholar] [CrossRef]
  26. Bugbee, B. Determining the potential productivity of food crops in controlled environments. Adv. Space Res. 1992, 12, 85–95. [Google Scholar] [CrossRef] [PubMed]
  27. Sun, X.; Chen, F.; Yuan, L.; Mi, G. The physiological mechanism underlying root elongation in response to nitrogen deficiency in crop plants. Planta 2020, 251, 84. [Google Scholar] [CrossRef]
  28. Moon, W.; Yu, D.J. Physiology of Cultivated Plants; Know Press: Seoul, Republic of Korea, 2015. [Google Scholar]
  29. Aye, M.M.; Aung, H.T.; Sein, M.M.; Armijos, C. A review on the phytochemistry, medicinal properties and pharmacological activities of 15 selected Myanmar medicinal plants. Molecules 2019, 24, 293. [Google Scholar] [CrossRef] [PubMed] [Green Version]
  30. Jarrell, W.M.; Beverly, R.B. The dilution effect in plant nutrition studies. Adv. Agron. 1981, 34, 197–224. [Google Scholar] [CrossRef]
  31. Xu, Z.; Chen, Q.; Zhang, Y.; Liang, C. Coumarin-based derivatives with potential anti-HIV activity. Fitoterapia 2021, 150, 104863. [Google Scholar] [CrossRef]
  32. Kim, Y.J.; Nguyen, T.K.L.; Oh, M.M. Growth and ginsenosides content of ginseng sprouts according to LED-based light quality changes. Agronomy 2020, 10, 12. [Google Scholar] [CrossRef]
  33. Lee, J.Y.; Hiyama, M.; Hikosaka, S.; Goto, E. Effects of concentration and temperature of nutrient solution on growth and camptothecin accumulation of Ophiorrhiza pumila. Plants 2020, 9, 793. [Google Scholar] [CrossRef]
  34. Yamazaki, K. Management of pH in nutrient solution in hydroponics. Agric. Hortic. 1982, 57, 327–331. [Google Scholar]
  35. Alexopoulos, A.A.; Marandos, E.; Assimakopoulou, A.; Vidalis, N.; Petropoulos, S.A.; Karapanos, I.C. Effect of nutrient solution pH on the growth, yield and quality of Taraxacum officinale and Reichardia picroides in a floating hydroponic system. Agronomy 2021, 11, 1118. [Google Scholar] [CrossRef]
  36. Alam, S.M.; Naqvi, S.S.M.; Ansari, R. Impact of soil pH on nutrient uptake by crop plants. In Handbook of Plant and Crop Stress, 4th ed.; Pessarakli, M., Ed.; Marcel Dekker Inc.: New York, NY, USA, 1999; pp. 51–60. [Google Scholar]
  37. Lee, H.J.; Yang, E.Y.; Park, K.S.; Lee, Y.B.; Bae, J.H.; Jeon, K.S. Effect of EC and pH of nutrient solution on the growth and quality of single-stemmed rose in cutted rose production factory. J. Bio-Environ. Control 2004, 13, 258–265. [Google Scholar]
  38. Long, A.; Zhang, J.; Yang, L.T.; Ye, X.; Lai, N.W.; Tan, L.L.; Lin, D.; Chen, L.S. Effects of low pH on photosynthesis, related physiological parameters, and nutrient profiles of citrus. Front. Plant Sci. 2017, 8, 185. [Google Scholar] [CrossRef] [PubMed] [Green Version]
  39. Putra, P.A.; Yuliando, H. Soilless culture system to support water use efficiency and product quality: A review. Agric. Agricul. Sci. Procedia 2015, 3, 283–288. [Google Scholar] [CrossRef] [Green Version]
  40. Rouphael, Y.; Petropoulos, S.A.; Cardarelli, M.; Colla, G. Salinity as eustressor for enhancing quality of vegetables. Sci. Hortic. 2018, 234, 361–369. [Google Scholar] [CrossRef]
  41. Bugbee, B. Nutrient management in recirculating hydroponic culture. In Proceedings of the South Pacific Soilless Culture Conference-SPSCC, Palmerston North, New Zealand, 10–13 February 2004; Volume 648, pp. 99–112. [Google Scholar] [CrossRef] [Green Version]
Figure 1. Shoot fresh weight (A), shoot dry weight (B), leaf area (C), and number of leaves (D) of coastal glehnia grown in Hoagland nutrient solution with five different EC levels for 20 weeks after transplanting and with four consecutive harvests. Different letters in the figures indicate significant differences. *, **, and *** indicate significance at p < 0.05, 0.01, and 0.001, respectively (n = 11).
Horticulturae 09 00776 g001
Figure 2. Shoot fresh weight and petiole length of coastal glehnia grown in Hoagland nutrient solution with five different EC levels for 20 weeks and with four consecutive harvests (A,C) and a single harvest (B,D) at 20 weeks after transplanting. Different letters in the figures indicate significant differences. *, indicates significance at p < 0.05 (n = 11).
Horticulturae 09 00776 g002
Figure 3. Mutual ratios of cation (A) and anion (B) macronutrient compositions (C) of Hoagland nutrient solution (H), coastal glehnia, and newly developed nutrient solution for coastal glehnia (N).
Horticulturae 09 00776 g003
Figure 4. Accumulated shoot fresh weight (A), shoot dry weight (B), leaf area (C), and number of leaves (D) of coastal glehnia grown in Hoagland nutrient solution with various EC levels and newly developed nutrient solution for 23 weeks after transplanting and with four consecutive harvests. Different letters in the figures indicate significant differences. *, **, and *** indicate significance at p < 0.05, 0.01, and 0.001, respectively (n = 7).
Horticulturae 09 00776 g004
Figure 5. Average shoot fresh weight (A), shoot dry weight (B), leaf area (C), number of leaves (D), root fresh weight (E), and root dry weight (F) of coastal glehnia grown in Hoagland nutrient solution with various EC levels and newly developed nutrient solution for 23 weeks after transplanting and with four consecutive harvests. Different letters in the figures indicate significant differences. *, **, and *** indicate significance at p < 0.05, 0.01, and 0.001, respectively (n = 28).
Horticulturae 09 00776 g005
Figure 6. Accumulated total phenolic content (A,B) and antioxidant capacity (C,D) of coastal glehnia in plants grown in Hoagland nutrient solution with various EC levels and newly developed nutrient solution for 23 weeks after transplanting and with four consecutive harvests. Different letters in the figures indicate significant differences. *, **, and *** indicate significance at p < 0.05, 0.01, and 0.001, respectively (n = 5).
Horticulturae 09 00776 g006
Figure 7. Accumulated individual bioactive compounds, bergapten (A,B), imperatorin (C,D), and xanthotoxin (E,F) in coastal glehnia per mg of dry weight and whole shoot in plants grown in Hoagland and newly developed nutrient solutions with various EC levels for 23 weeks after transplanting and with four consecutive harvests. Different letters in the figures indicate significant differences. *, indicates significance at p < 0.05 (n = 4).
Horticulturae 09 00776 g007
Figure 8. Change in absolute pH value of Hoagland (H1 and H2; black dot line) and newly developed (N1 and N2; yellow dot line) nutrient solutions during 23 weeks after transplanting (n = 4).
Horticulturae 09 00776 g008
Table 1. Two-way ANOVA results of shoot fresh weight, shoot dry weight, leaf area, and number of leaves of coastal glehnia grown in Hoagland nutrient solution with five different EC levels for 20 weeks and with four consecutive harvests.
Shoot
Fresh Weight
Shoot
Dry Weight
Leaf AreaNumber
of Leaves
Number of harvests (A)*** z*********
EC levels (B)************
A × BNSNSNSNS
z Significant at p < 0.001. NS indicates no significant difference (n = 11).
Table 2. Macronutrient composition of Hoagland nutrient solution (H) and newly developed nutrient solution for coastal glehnia (N).
TreatmentEC
(dS·m−1)
NPKCaMgS
mg·L−1
H1.010516117802432
N11414195631824
Table 3. Two-way ANOVA results of shoot fresh weight, shoot dry weight, shoot area, and number of leaves of coastal glehnia grown in Hoagland nutrient solution (H1 and H2) and newly developed nutrient solution (N1 and N2) for 23 weeks with four consecutive harvests.
Shoot
Fresh Weight
Shoot
Dry Weight
Leaf AreaNumber
of Leaves
Number of harvests (A)NSNSNSNS
Nutrient solution (B)NS* z*NS
A × BNSNSNSNS
z Significant at p < 0.05. NS indicates no significant difference (n = 7).
Table 4. Two-way ANOVA results of total phenolic content (TP) per gram and shoot and antioxidant capacity (AOS) per gram and shoot of coastal glehnia grown in Hoagland nutrient solution (H1 and H2) and newly developed nutrient solution (N1 and N2) for 23 weeks with four consecutive harvests.
TP
per Gram
TP
per Shoot
AOS
per Gram
AOS
per Shoot
Number of harvests (A)*** z* y****
EC levels (B)NSNSNSNS
A × BNSNSNSNS
y, z Significant at p < 0.0, and 0.001. NS indicates no significant difference (n = 5).
Disclaimer/Publisher’s Note: The statements, opinions and data contained in all publications are solely those of the individual author(s) and contributor(s) and not of MDPI and/or the editor(s). MDPI and/or the editor(s) disclaim responsibility for any injury to people or property resulting from any ideas, methods, instructions or products referred to in the content.

