
Impact of Agricultural Land Use on Nematode Diversity and Soil Quality in Dalmada, South Africa

Abstract
:1. Introduction
2. Materials and Methods
2.1. Soil Sampling
2.2. Nematode Identification
2.3. Soil Properties Analysis
2.4. Statistical Analysis
- (1)
- Frequency of Occurrence (FO%) = (Number of samples containing a genus/number of total samples) × 100;
- (2)
- Relative Abundance (RA) = Total number of individuals of a particular genus per g soil and root sample in all samples/number of samples, including those with zero counts for that genus;
- (3)
- Population Density (PD) = Mean number of individuals of a particular genus/number of positive samples;
- (4)
- Absolute frequency (AF) = Number of samples containing a genus/Total Number of samples collected × 100;
- (5)
- Absolute Density (AD%) = Density of the genus/Total No: of samples collected × 100l;
- (6)
- Relative Frequency (RF%) = Frequency of the species/Total frequency of all the species × 100.
2.5. Data Visualization
3. Results
3.1. Analysis of the Nematode Communities
3.2. Indices of the Nematode Communities
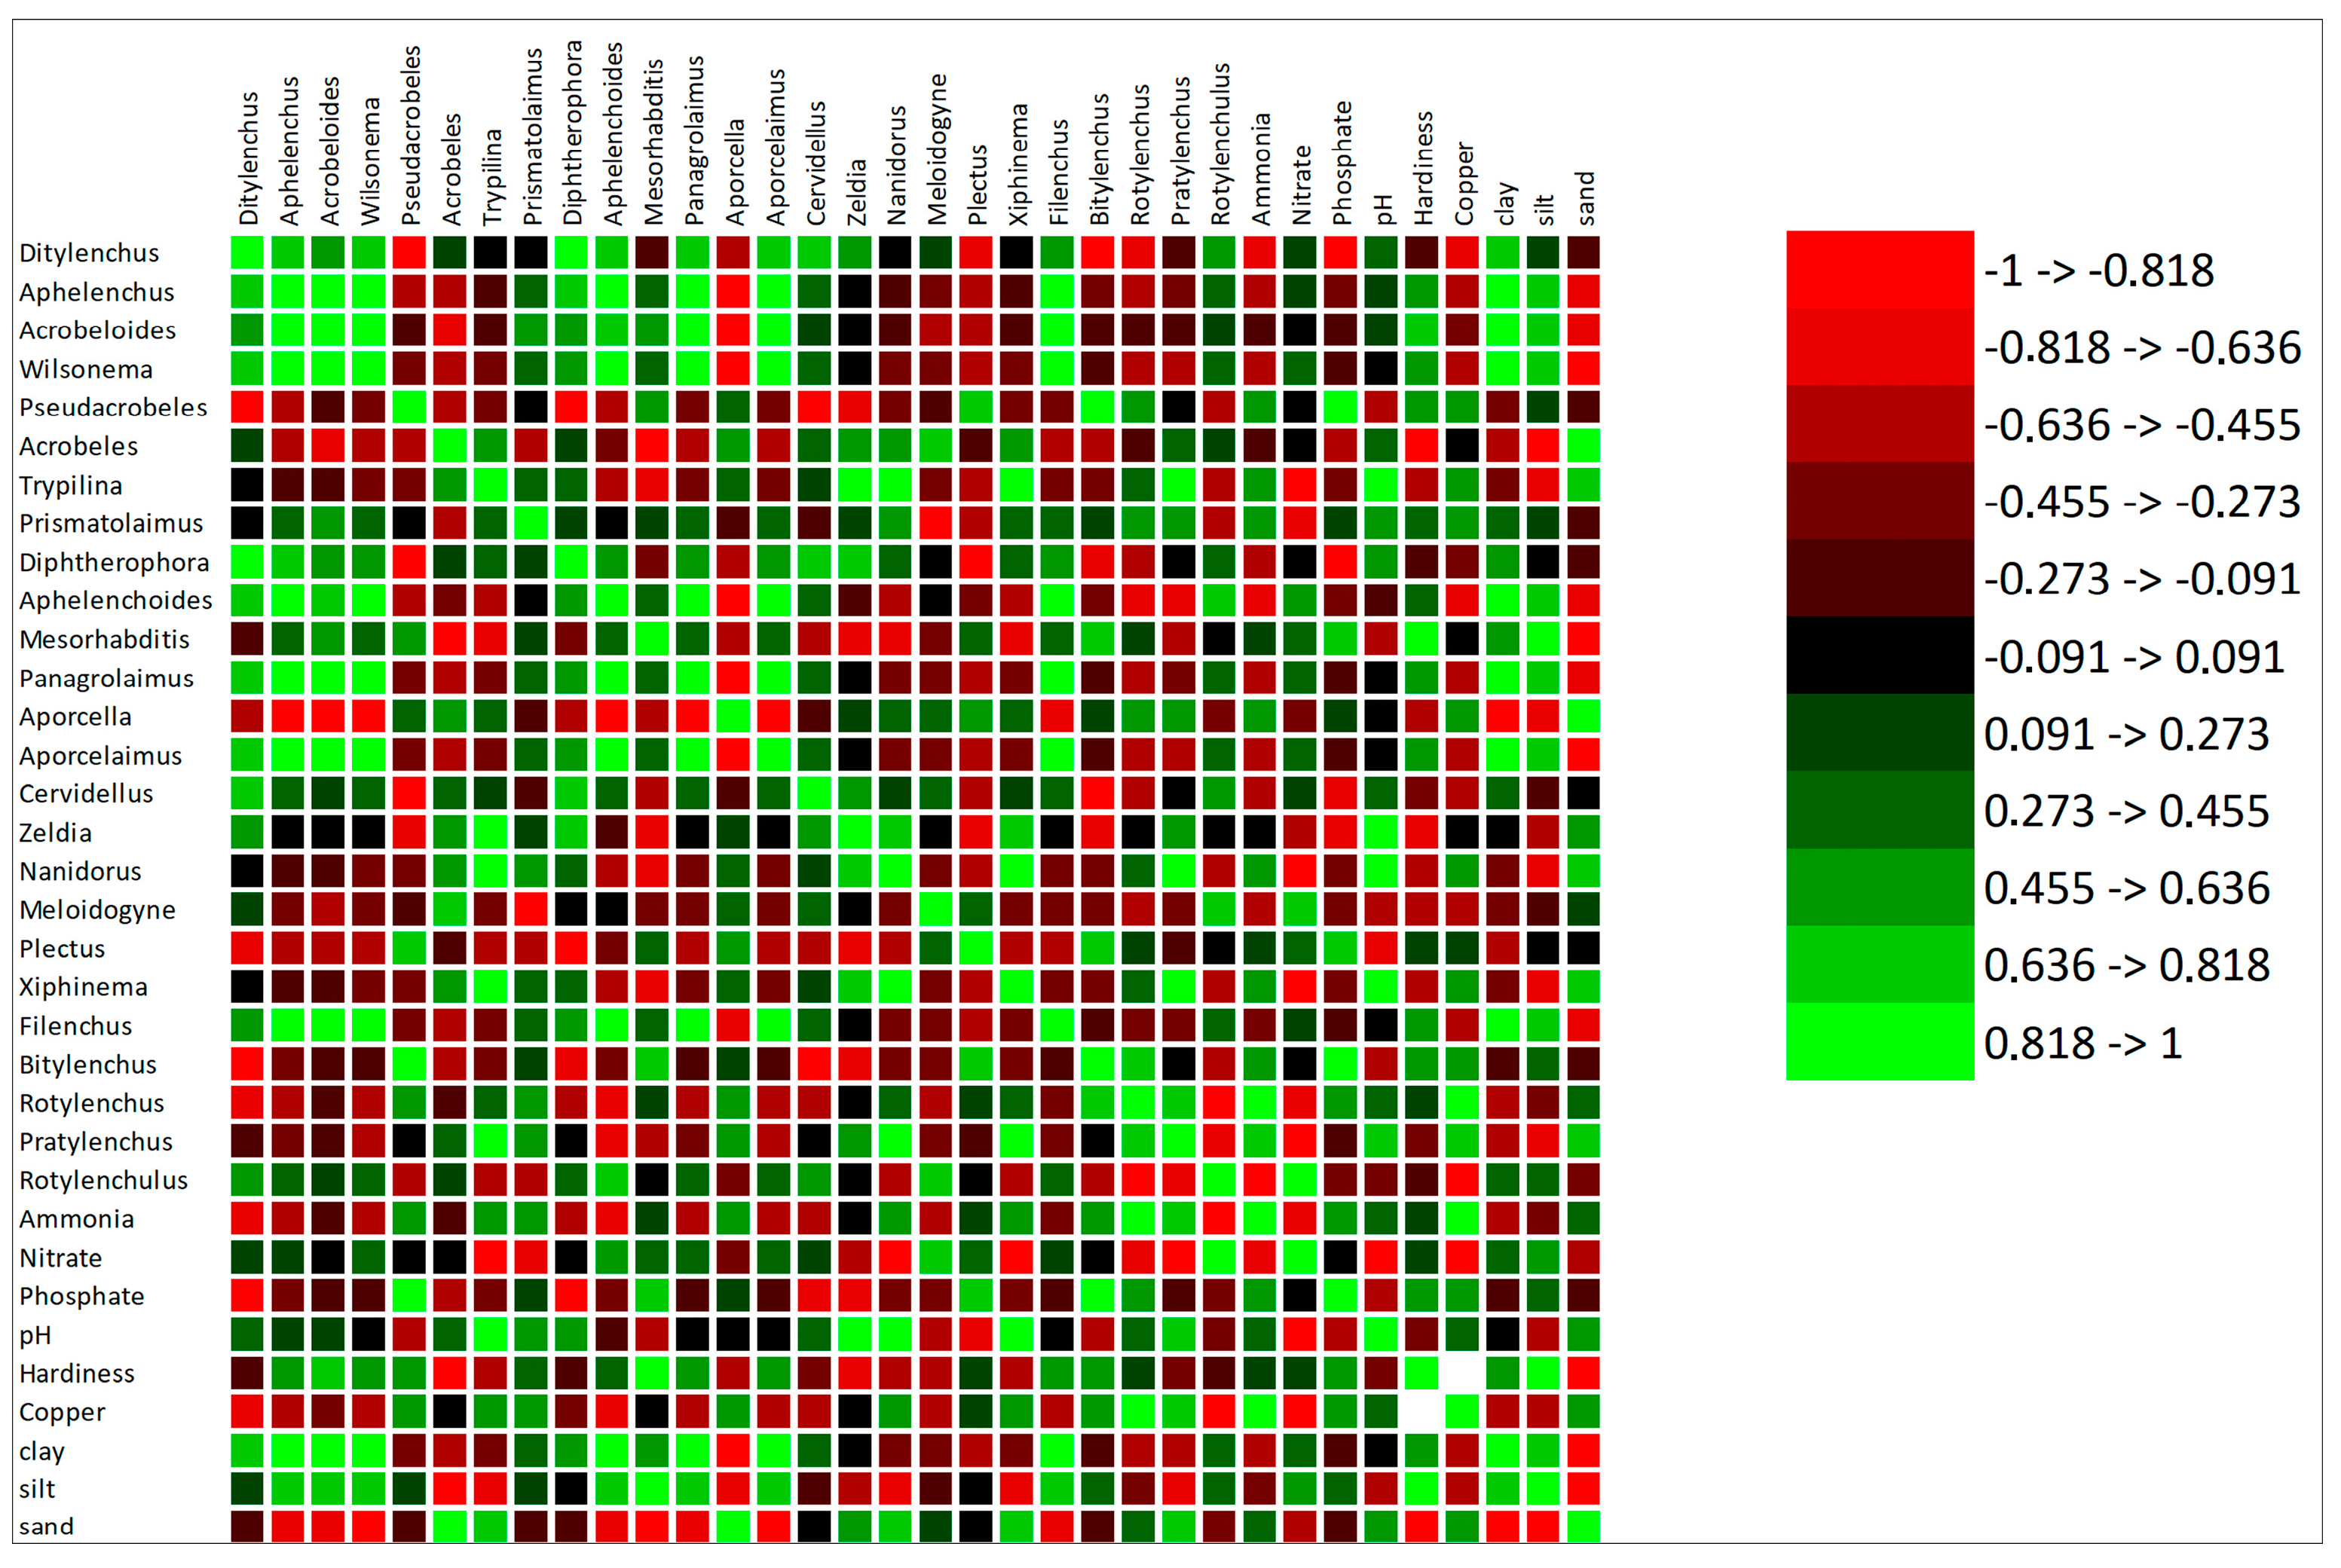
3.3. Correlation of the Selected Soil Parameter with Nematodes
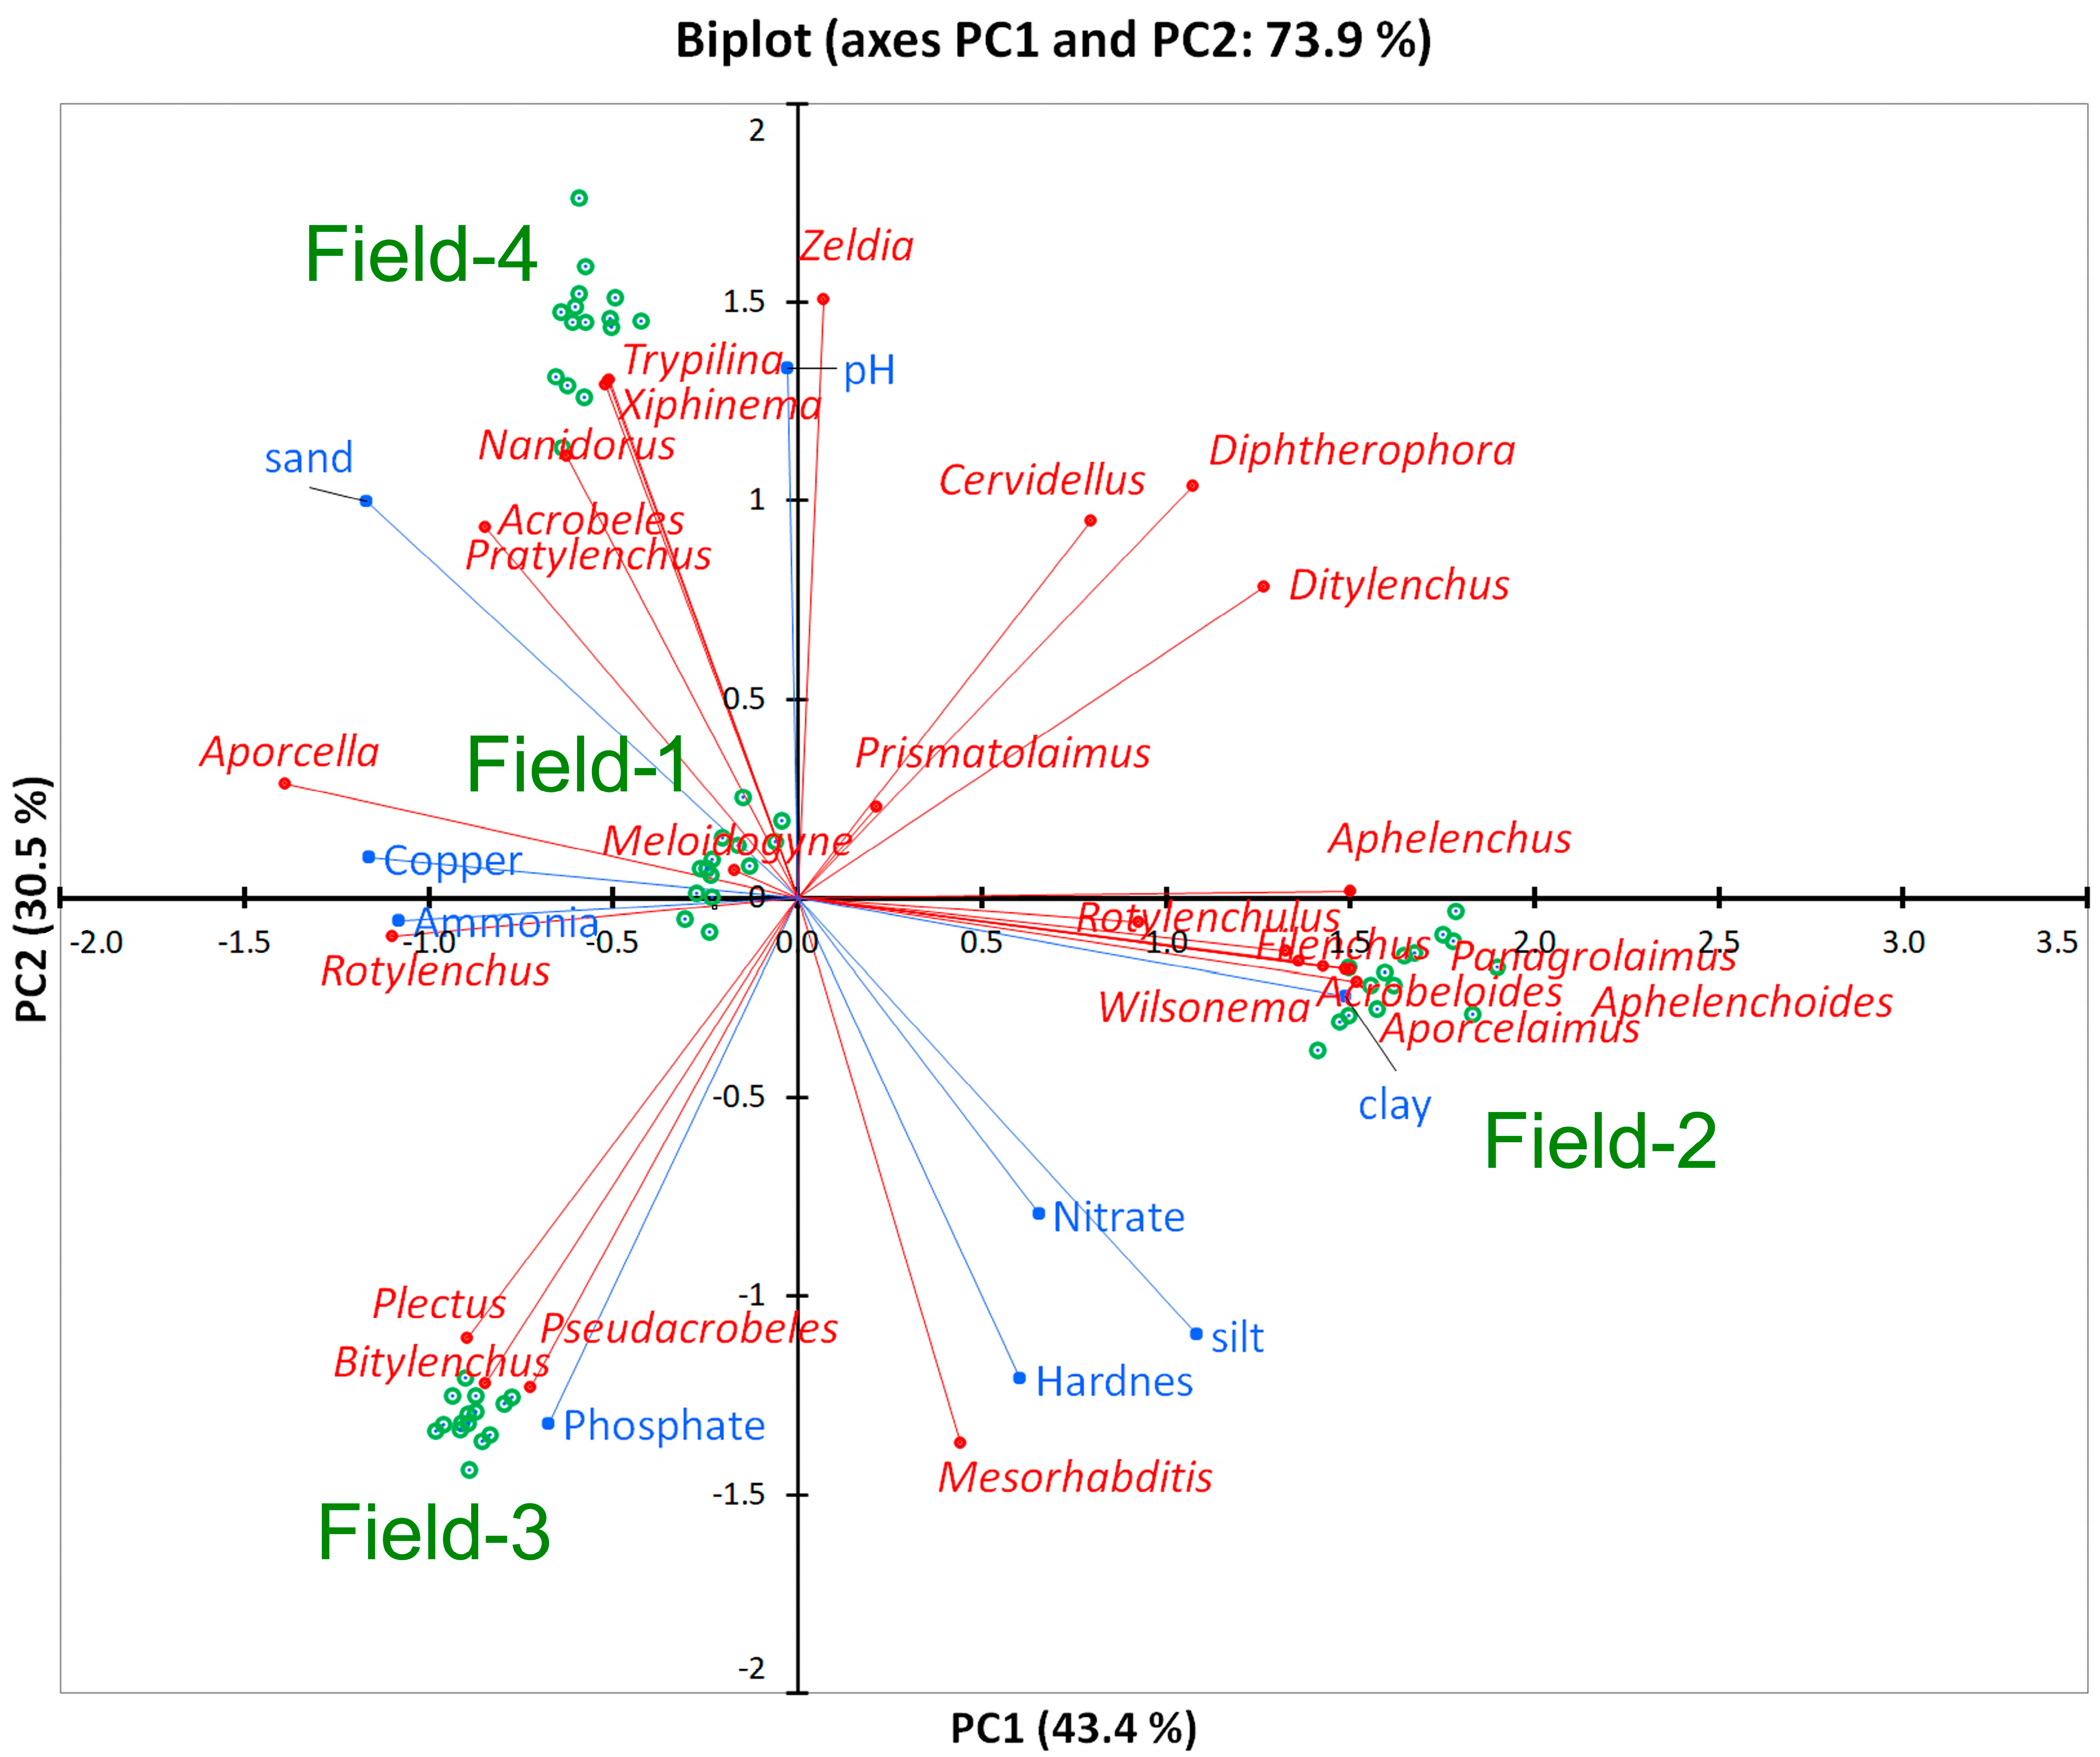
3.4. Relationship of Soil Parameters and Nematodes
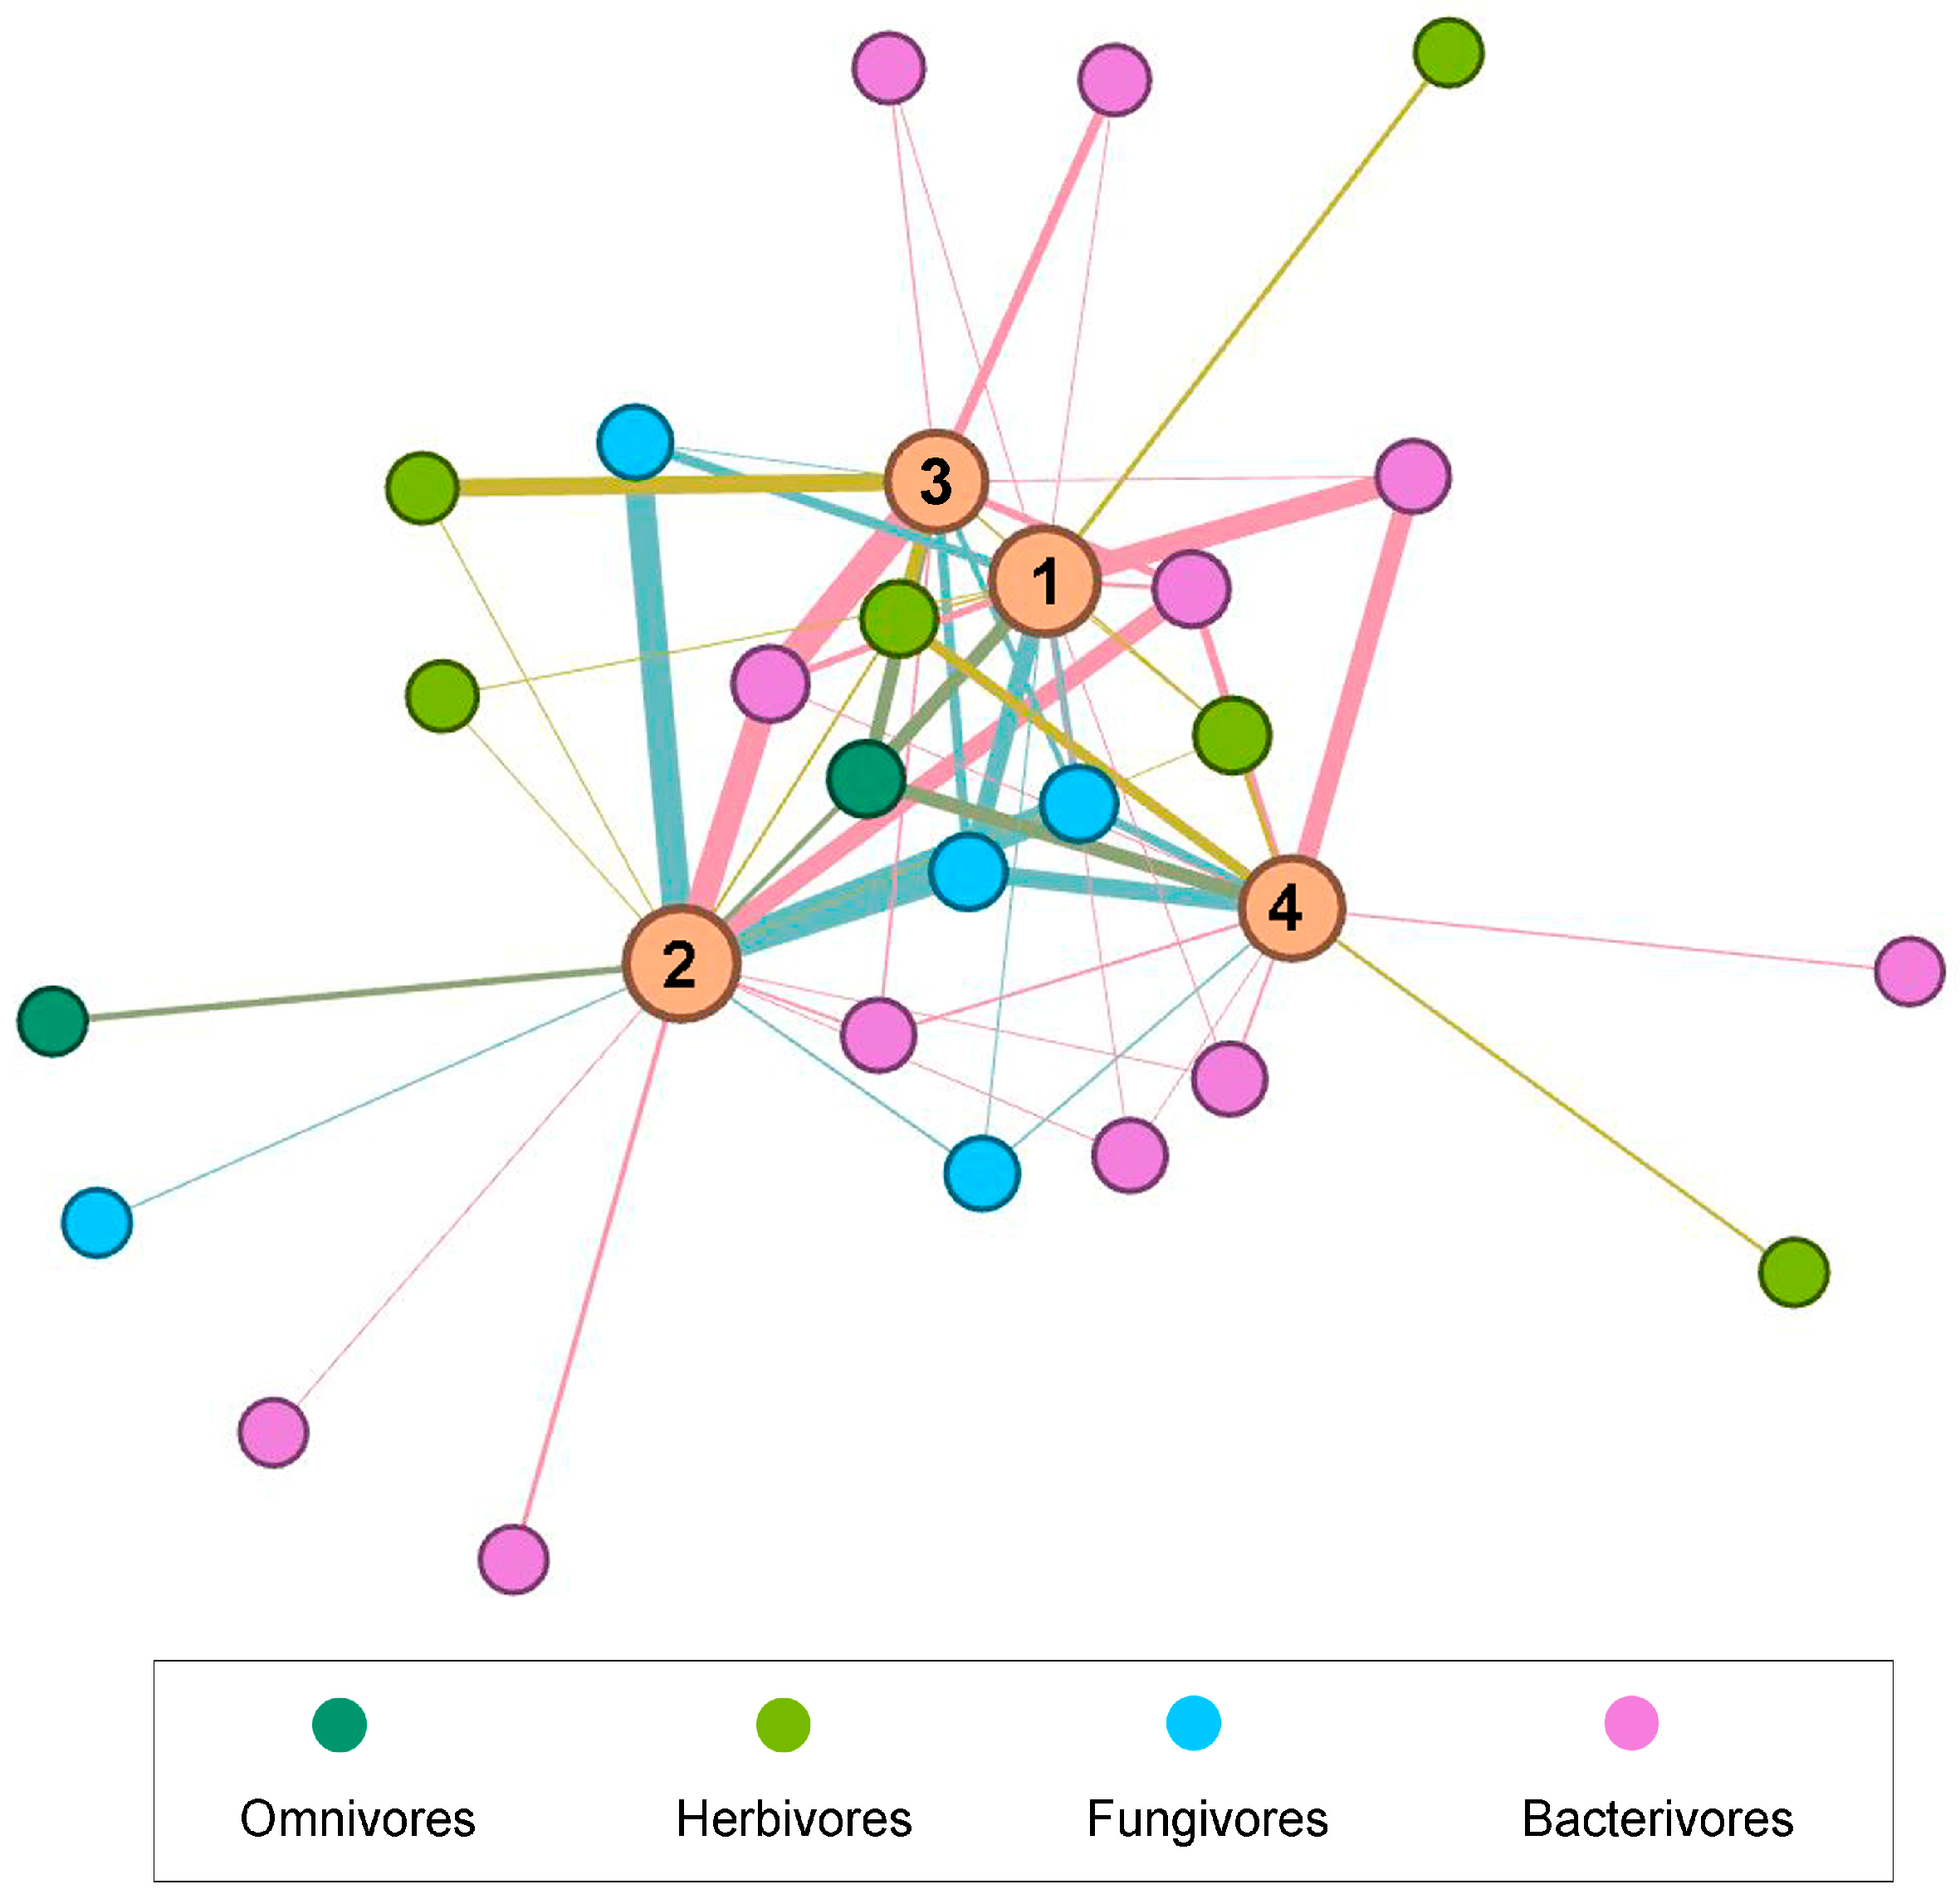
3.5. Data Visualization
4. Discussion
5. Conclusions
Funding
Data Availability Statement
Acknowledgments
Conflicts of Interest
References
- Cifuentes-Croquevielle, C.; Stanton, D.E.; Armesto, J.J. Soil invertebrate diversity loss and functional changes in temperate forest soils replaced by exotic pine plantations. Sci. Rep. 2020, 10, 7762. [Google Scholar] [CrossRef] [PubMed]
- Kamath, D.; Barreto, C.; Lindo, Z. Nematode contributions to the soil food web trophic structure of two contrasting boreal peatlands in Canada. Pedobiologia 2022, 93–94, 150809. [Google Scholar] [CrossRef]
- Yeates, G.W. Nematodes as soil indicators: Functional and biodiversity aspects. Biol. Fertil. Soils 2003, 37, 199–210. [Google Scholar] [CrossRef]
- Ingham, R.E.; Trofymow, J.A.; Ingham, E.R.; Coleman, D.C. Interactions of bacteria, fungi, and their nematode grazers–effects on nutrient cycling and plant–growth. Ecol. Monogr. 1985, 55, 119–140. [Google Scholar] [CrossRef]
- Bongers, T.; Ferris, H. Nematode community structure as a bioindicator in environmental monitoring. Trends Ecol. Evol. 1999, 14, 224–228. [Google Scholar] [CrossRef]
- Neher, D.A. Role of nematodes in soil health and their use as indicators. J. Nematol. 2001, 33, 161–168. [Google Scholar] [PubMed]
- Zhang, X.; Ferris, H.; Mitchell, J.; Liang, W. Ecosystem services of the soil food web after long-term application of agricultural management practices. Soil Biol. Biochem. 2017, 111, 36–43. [Google Scholar] [CrossRef]
- Sánchez-Moreno, S.; Ferris, H. Nematode Ecology and Soil Health; Sikora, R., Coyne, D., Hallmann, J., Timper, P., Eds.; Plant Parasitic Nematodes in Subtropical and Tropical Agriculture, CAB International: Wallingford, UK, 2018; pp. 62–86. [Google Scholar]
- Post-Harvest Innovation (PHI) Programme. Tomatoes—Post Harvest Innovation. 2023. Available online: https://postharvestinnovation.org.za/commodities/tomatoes (accessed on 1 June 2023).
- Marais, M.; Swart, A. Plant nematodes in South Africa. 6. Tzaneen area, Limpopo Province. Afr. Plant Prot. 2003, 9, 99–107. [Google Scholar]
- Shokoohi, E. Morphological and molecular characterisation of Boleodorus volutus Lima & Siddiqi, 1963 from South Africa with the first SEM observations of the species. Russ. J. Nematol. 2021, 29, 101–109. [Google Scholar]
- Shokoohi, E. Morphological and molecular characters of Scutellonema brachyurus (Steiner, 1938) Andrássy, 1958 from South Africa. J. Nematol. 2021, 53, 1–13. [Google Scholar] [CrossRef]
- Shokoohi, E. Observation on Hemicriconemoides Brachyurus (Loof, 1949) Chitwood & Birchfield, 1957 Associated with Grass in South Africa. Helminthologia 2022, 59, 210–216. [Google Scholar] [CrossRef]
- Shokoohi, E.; Abolafia, J. Morphological and molecular characterization of Hemicycliophora poranga Monteiro and Lordello, 1978 (Nematoda: Rhabditida: Hemicycliophoridae) from Iran and South Africa. Biologia 2022, 77, 709–720. [Google Scholar] [CrossRef]
- Postma-Blaauw, M.B.; de Goede, R.G.M.; Bloem, J.; Faber, J.H.; Brussaard, L. Soil biota community structure and abundance under agricultural intensification and extensification. Ecology 2010, 91, 460–473. [Google Scholar] [CrossRef] [PubMed]
- Pankhurst, C.; Hawke, B.; McDonald, H.; Kirkby, C.; Buckerfield, J.; Michelsen, P.; Doube, B. Evaluation of soil biological properties as potential bioindicators of soil health. Anim. Prod. Sci. 1995, 35, 1015–1028. [Google Scholar] [CrossRef]
- Van Capelle, C.; Schrader, S.; Brunotte, J. Tillage-induced changes in the functional diversity of soil biota—A review with a focus on German data. Eur. J. Soil Biol. 2012, 50, 165–181. [Google Scholar] [CrossRef]
- Nisa, R.U.; Nisa, A.U.; Hroobi, A.A.; Shah, A.A.; Tantray, A.Y. Year-Long Assessment of Soil Nematode Diversity and Root Inhibition-Indicator Nematode Genera in Rice Fields. Biology 2022, 11, 1572. [Google Scholar] [CrossRef]
- Tsiafouli, M.A.; Thébault, E.; Sgardelis, S.P.; de Ruiter, P.C.; van der Putten, W.H.; Birkhofer, K.; Hedlund, K. Intensive agriculture reduces soil biodiversity across Europe. Glob. Chang. Biol. 2015, 21, 973–985. [Google Scholar] [CrossRef] [Green Version]
- Vazquez, C.; de Goede, R.G.M.; Korthals, G.W.; Rutgers, M.; Schouten, A.J.; Creamer, R. The effects of increasing land use intensity on soil nematodes: A turn towards specialism. Funct. Ecol. 2019, 33, 2003–2016. [Google Scholar] [CrossRef] [Green Version]
- Whitehead, A.G.; Hemming, J.R. A Comparison of some quantitative methods extracting small vermiform nematodes from the soil. Ann. Appl. Biol. 1965, 55, 25–38. [Google Scholar] [CrossRef]
- De Grisse, A. Redescription ou modifications de quelques techniques utililisées dans l’étude des nématodes phytoparasitaires. Meded. Rijksfac. Landbouwetenschappen Gent 1969, 34, 351–369. [Google Scholar]
- Andrássy, I. Free-Living Nematodes of Hungary (Nematoda Errantia), Vol. I; Hungrian Natural History Museum and Systematic Zoology Research Group of the Hungarian Academy of Sciences: Budapest, Hungary, 2005. [Google Scholar]
- Geraert, E. The Tylenchidae of the World: Identification of the Family Tylenchidae (Nematoda); Academia Press: Ghent, Belgium, 2008. [Google Scholar]
- Shokoohi, E.; Abolafia, J. Soil and Freshwater Rhabditid Nematodes (Nematoda, Rhabditida) from Iran: A Compendium; University of Jaen (UJA) Publishing: Jaen, Spain, 2019; p. 226. [Google Scholar]
- APHA. Standard Methods for the Examination of the Water and Wastewater, 20th ed.; American Public Health Association: Washington, DC, USA, 1998. [Google Scholar]
- Hach, C. Water Analysis Handbook, 7th ed.; Hach: Loveland, CO, USA, 2012; p. 1796. [Google Scholar]
- Norton, D.C.; Schmitt, D.P. Community analyses of plant-parasitic nematodes in the Kalsow Prairie, Iowa. J. Nematol. 1978, 10, 171–176. [Google Scholar] [PubMed]
- Colwell, R.K. Biodiversity: Concepts, Patterns, and Measurement; Levin, S.A., Ed.; The Princeton Guide to Ecology, Princeton University Press: Princeton, NJ, USA, 2009; pp. 257–263. [Google Scholar]
- Renčo, M.; Čerevková, A.; Gömöryová, E. Oil Nematode Fauna and Microbial Characteristics in an Early-Successional Forest Ecosystem. Forests 2019, 10, 888. [Google Scholar] [CrossRef] [Green Version]
- Addinsoft. XLSTAT, Analyse de Données et Statistique Avec MS Excel; Addinsoft: New York, NY, USA, 2007. [Google Scholar]
- Sieriebriennikov, B.; Ferris, H.; de Goede, R.G.M. NINJA: An automated calculation system for nematode-based biological monitoring. Eur. J. Soil Biol. 2014, 61, 90–93. [Google Scholar] [CrossRef]
- Bastian, M.; Heymann, S.; Jacomy, M. Gephi: An open source software for exploring and manipulating networks. Int. AAAI Conf. Weblogs Soc. Media 2009, 3, 361–362. [Google Scholar] [CrossRef]
- Kekelis, P.; Papatheodorou, E.M.; Terpsidou, E.; Dimou, M.; Aschonitis, V.; Monokrousos, N. The Free-Living Nematodes as Indicators of the Soil Quality in Relation to the Clay Content, When Coffee Waste Is Applied. Agronomy 2022, 12, 2702. [Google Scholar] [CrossRef]
- Neher, D.A.; Williams, K.M.; Lovell, S.T. Environmental indicators reflective of road design in a forested landscape. Ecosphere 2017, 8, e01734. [Google Scholar] [CrossRef]
- Yeates, G.W.; Bongers, T.; De Goede, R.G.; Freckman, D.W.; Georgieva, S. Feeding habits in soil nematode families and genera—An outline for soil ecologists. J. Nematol. 1993, 25, 315. [Google Scholar]
- Yeates, G.W.; Wardle, D.A.; Watson, R.N. Responses of soil nematode populations, community structure, diversity and temporal variability to agricultural intensification over a seven-year period. Soil Biol. Biochem. 1999, 31, 1721–1733. [Google Scholar] [CrossRef]
- Freckman, D.W.; Ettema, C.H. Assessing nematode communities in agroecosystems of varying human intervention. Agric. Ecosyst. Environ. 1993, 45, 239–261. [Google Scholar] [CrossRef]
- Yang, B.; Banerjee, S.; Herzog, C.; Ramirez, A.C.; Dahlin, P.; van der Heijden, M.G.A. Impact of land use type and organic farming on the abundance, diversity, community composition and functional properties of soil nematode communities in vegetable farming. Agric. Ecosyst. Environ. 2021, 318, 107488. [Google Scholar] [CrossRef]
- Sánchez-Moreno, S.; Cano, M.; Lopez-Perez, A.; Benayas, J.M.R. Microfaunal soil food webs in Mediterranean semi-arid agroecosystems. Does organic management improve soil health? Appl. Soil Ecol. 2018, 125, 138–147. [Google Scholar] [CrossRef]
- Ferris, H. Form and function: Metabolic footprints of nematodes in the soil food web. Eur. J. Soil Biol. 2010, 46, 97–104. [Google Scholar] [CrossRef]
- Zhong, S.; Zeng, H.C.; Jin, Z.Q. Influences of different tillage and residue management systems on soil nematode community composition and diversity the tropics. Soil Biol. Biochem. 2017, 107, 234–243. [Google Scholar] [CrossRef]
- Sohlenius, B.; Boström, S.; Sandor, A. Carbon and nitrogen budgets of nematodes in arable soil. Biol. Fertil. Soils 1988, 6, 1–8. [Google Scholar] [CrossRef]
- Neher, D.A. Nematode communities in organically and conventionally managed agricultural soils. J. Nematol. 1999, 31, 142–154. [Google Scholar] [PubMed]
- Bongers, T.; van der Meulen, H.; Korthals, G. Inverse relationship between the nematode maturity index and plant parasite index under enriched nutrient conditions. Appl. Soil Ecol. 1997, 6, 195–199. [Google Scholar] [CrossRef]
- Bongers, T. The Maturity Index the evolution of nematode life history traits adaptive radiation and cp—Scaling. Plant Soil 1999, 212, 13–22. [Google Scholar] [CrossRef]
- Laasli, S.-E.; Mokrini, F.; Lahlali, R.; Wuletaw, T.; Paulitz, T.; Dababat, A.A. Biodiversity of Nematode Communities Associated with Wheat (Triticum aestivum L.) in Southern Morocco and Their Contribution as Soil Health Bioindicators. Diversity 2022, 14, 194. [Google Scholar] [CrossRef]
- Dietrich, P.; Cesarz, S.; Liu, T.; Roscher, C.; Eisenhauer, N. Effects of plant species diversity on nematode community composition and diversity in a long-term biodiversity experiment. Oecologia 2021, 197, 297–311. [Google Scholar] [CrossRef]
- Mulder, C.; Schouten, A.J.; Hund-Rinke, K.; Breure, A.M. The use of nematodes in ecological soil classification and assessment concepts. Ecotoxicol. Environ. Saf. 2005, 62, 278–289. [Google Scholar] [CrossRef]
- Ito, T.; Araki, M.; Komatsuzaki, M.; Kaneko, N.; Ohta, H. Soil nematode community structure affected by tillage systems and cover crop managements in organic soybean production. Appl. Soil Ecol. 2015, 86, 137–147. [Google Scholar] [CrossRef] [Green Version]


| Sampling Site | Site | GPS Coordinates |
|---|---|---|
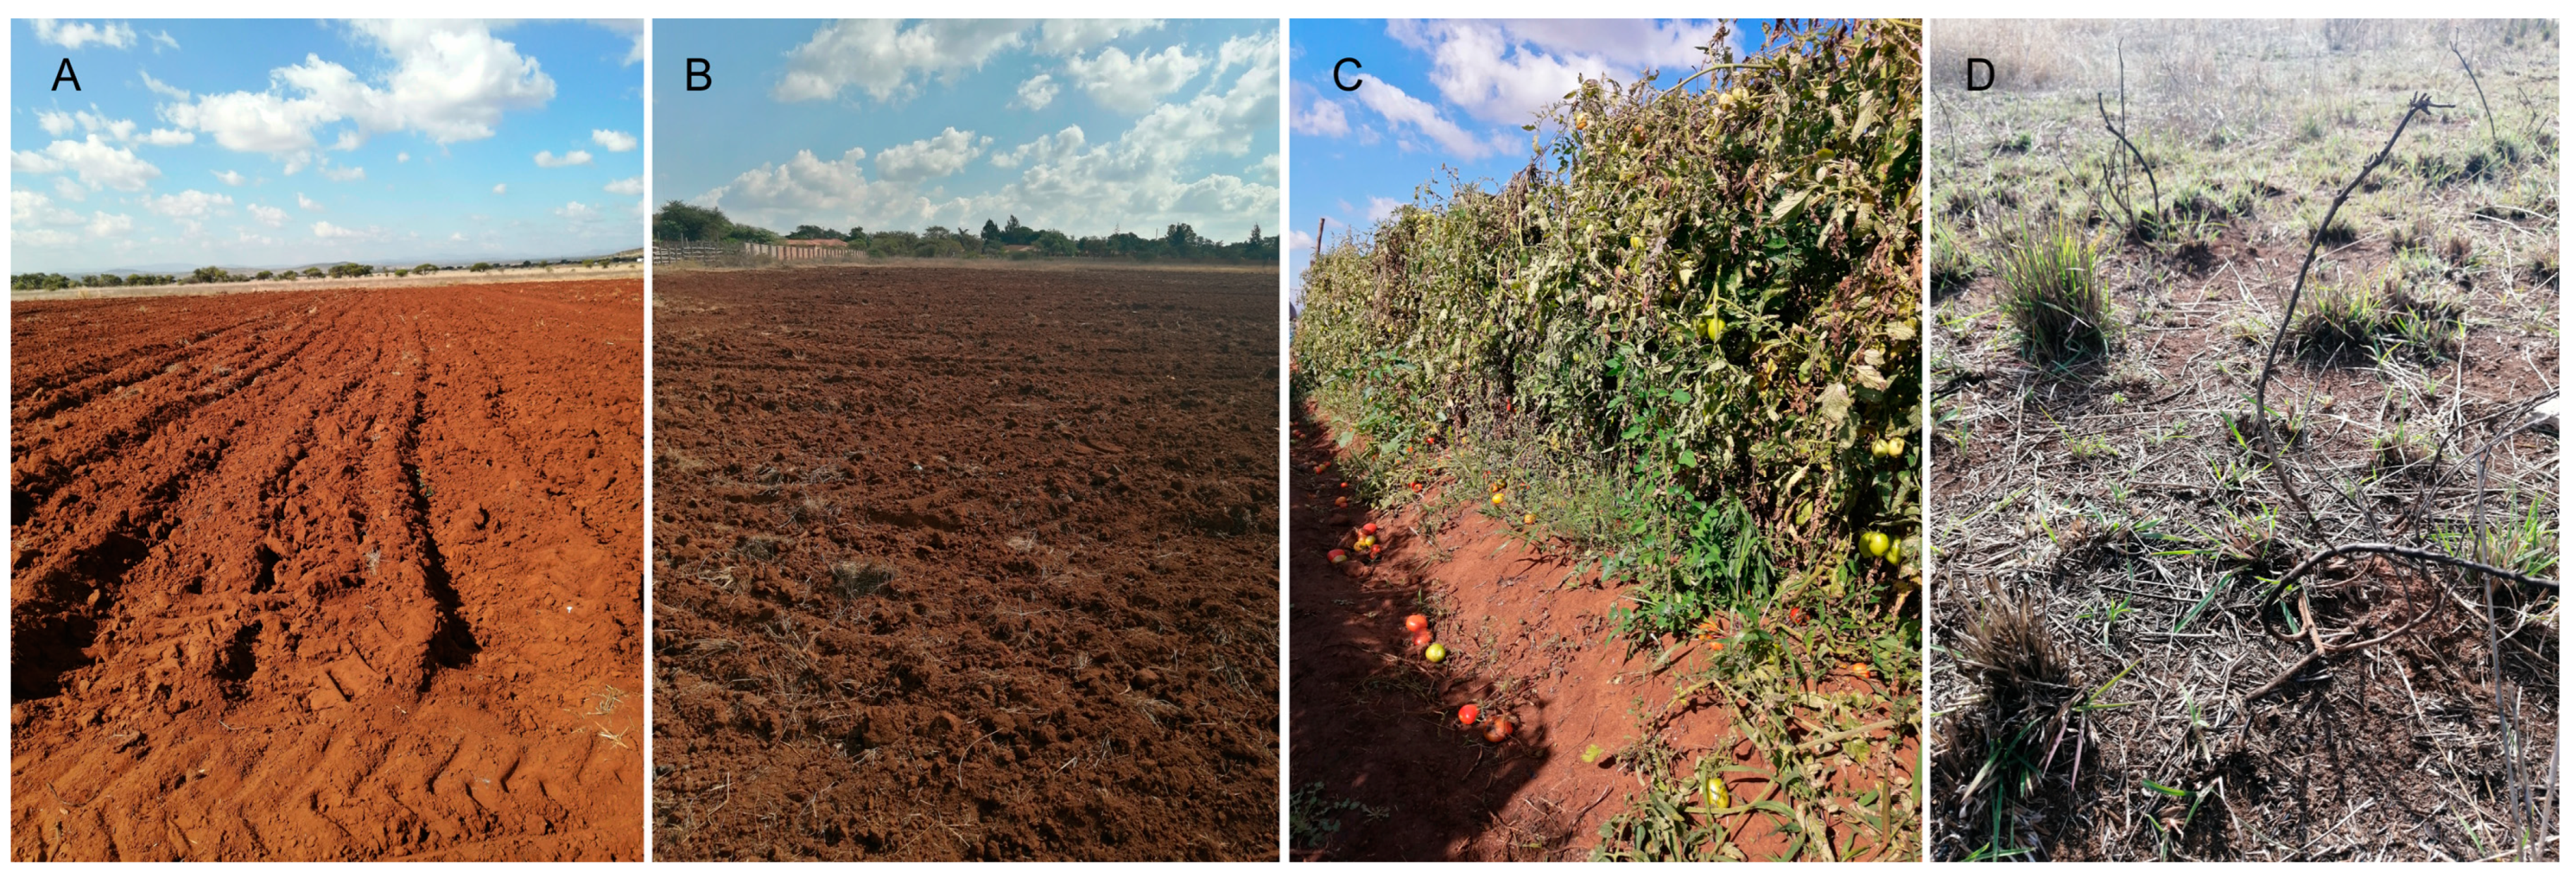
| Field-1 | 3 months not cultivated, prepared for tomato plantation | S: 23°53′44.96″; E: 29°32′52.844″ |
| Field-2 | Free land not cultivated for 5 years | S: 23°53′44.086″; E: 29°32′47.463″ |
| Field-3 | Tomato field | S: 23°53′44.411″; E: 29°32′55.192″ |
| Field-4 | Natural land, not disturbed for 50 years | S: 23°53′39.567″; E: 29°32′53.417″ |
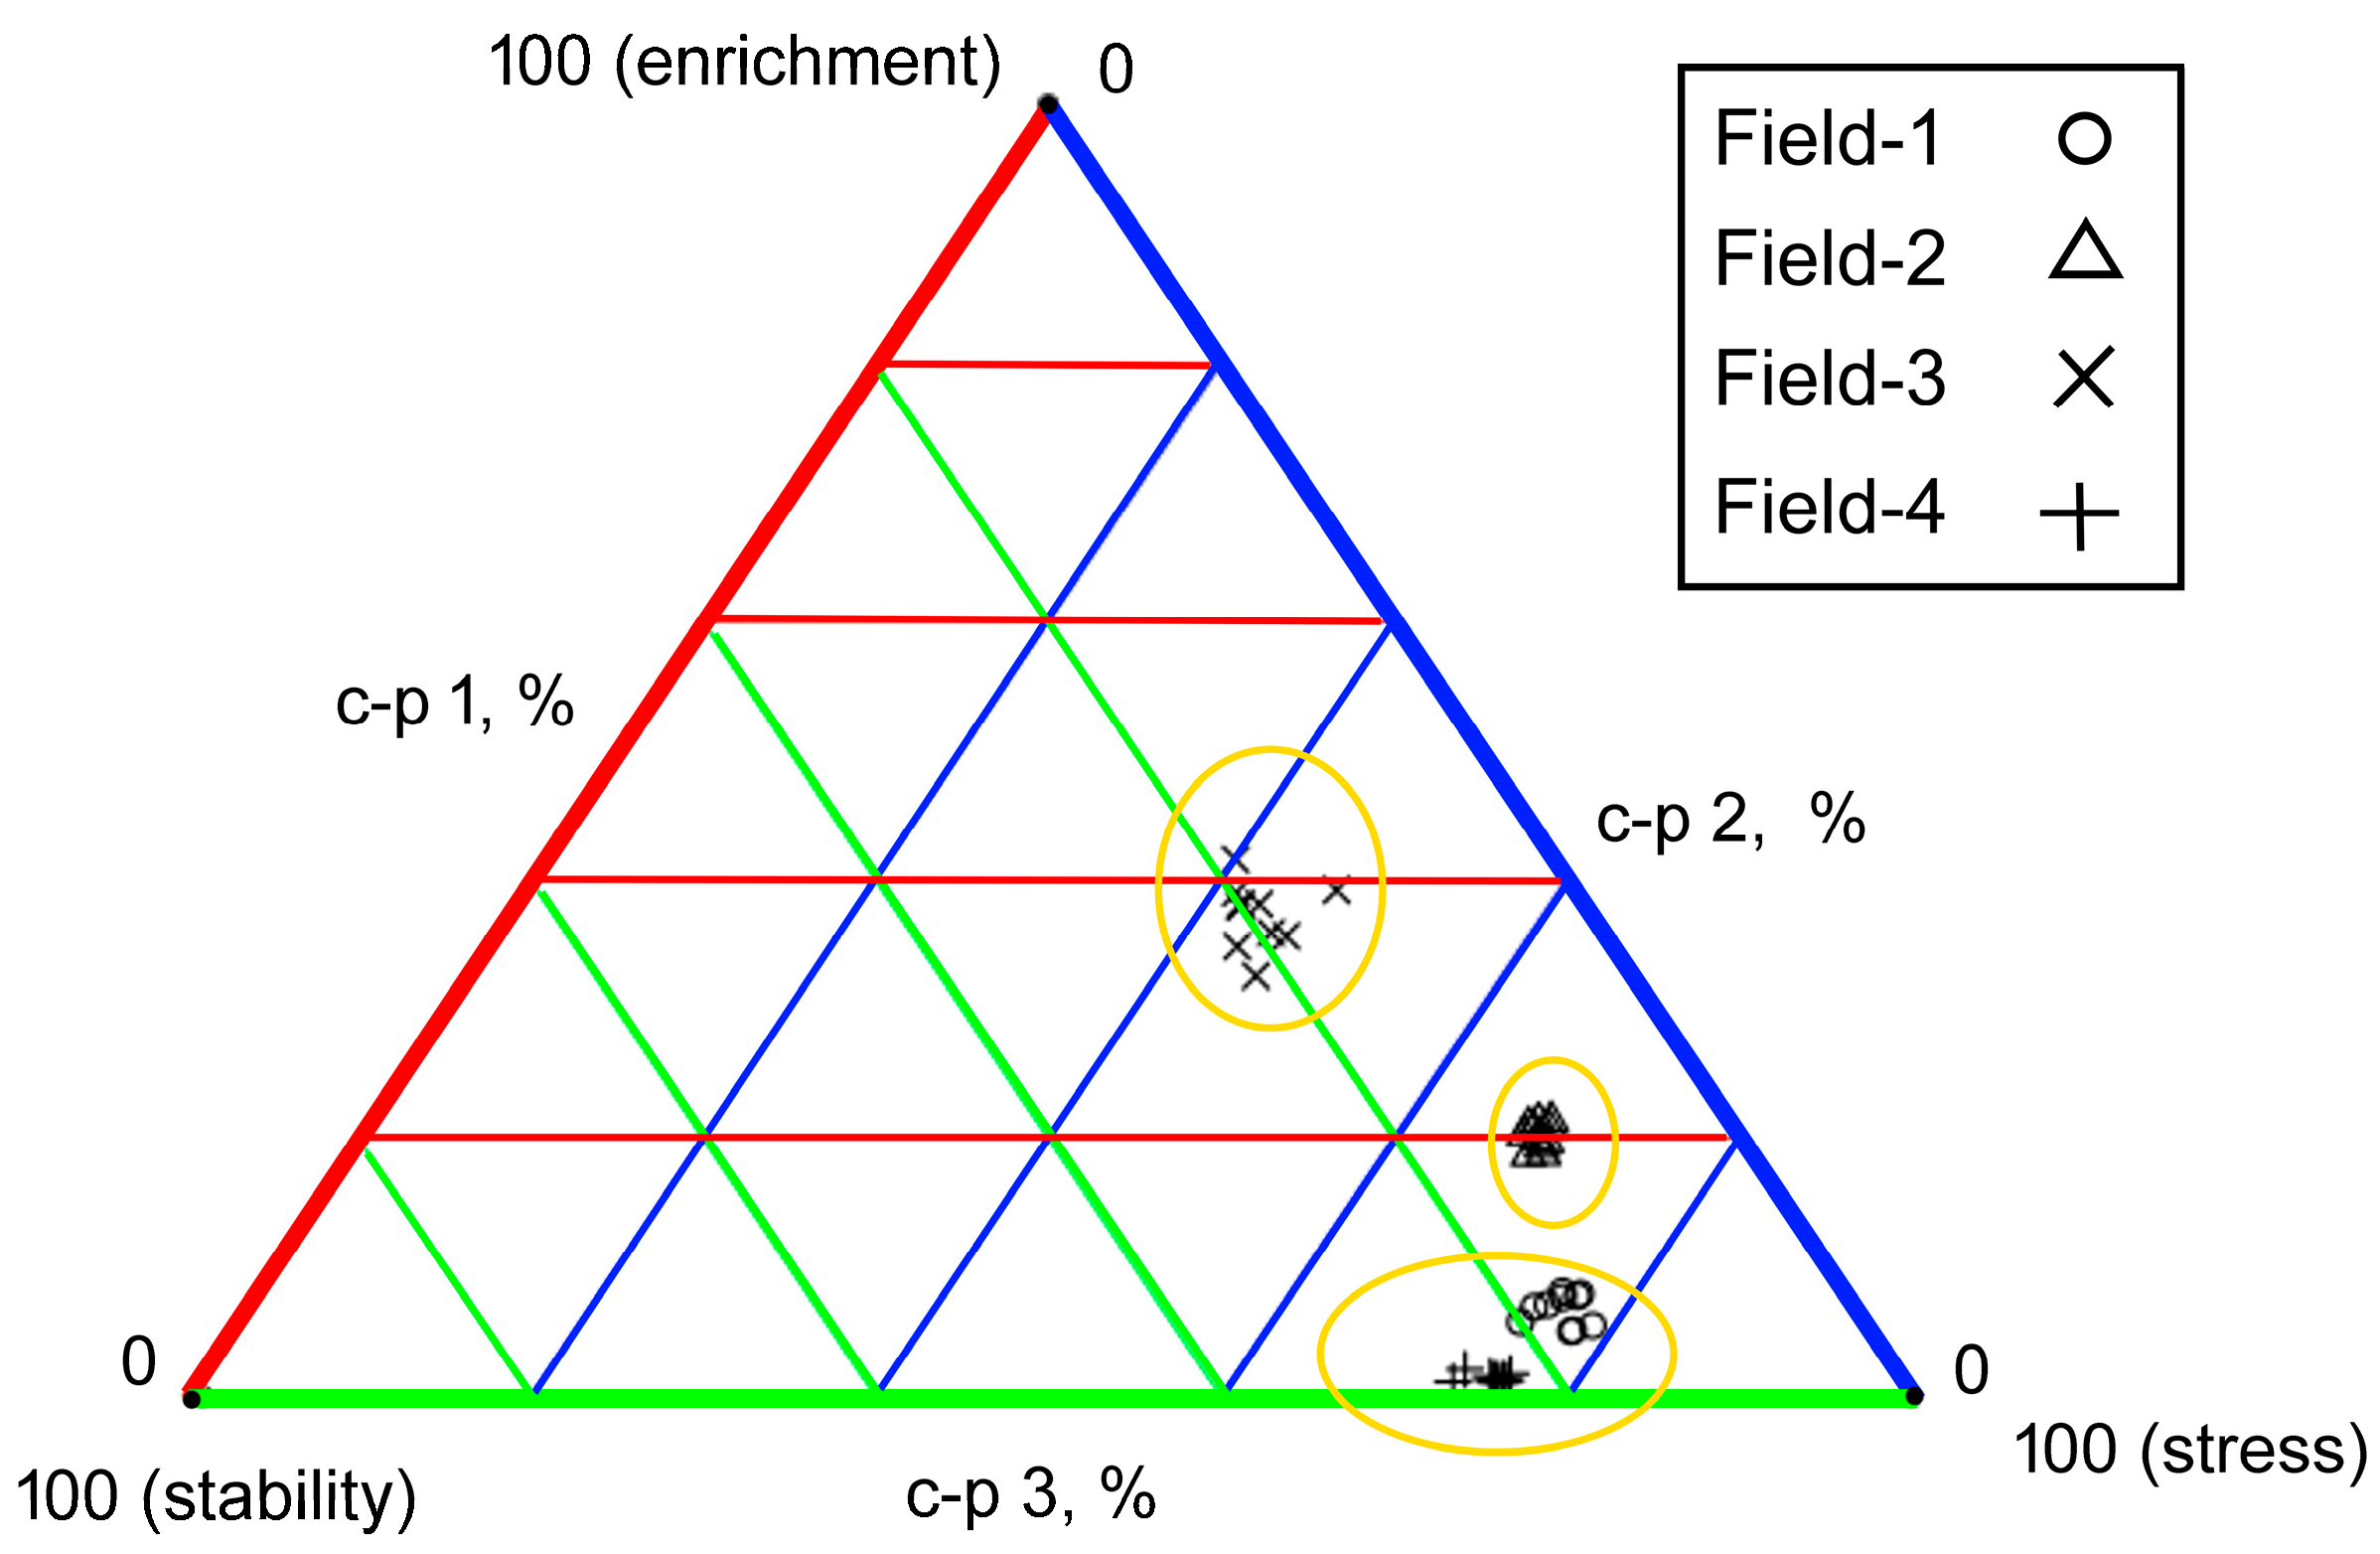
| Genus | C-p Class | P-p Class | Feeding Group | Field-1 | Field-2 | Field-3 | Field-4 |
|---|---|---|---|---|---|---|---|
| Acrobeles | 2 | 0 | Bacterivores | 113.1 | 0 | 4.8 | 99.4 |
| Acrobeloides | 2 | 0 | Bacterivores | 18.3 | 96.2 | 38.3 | 40.8 |
| Aphelenchoides | 2 | 0 | Fungivores | 49 | 138.9 | 4.6 | 0 |
| Aphelenchus | 2 | 0 | Fungivores | 34.3 | 133.2 | 28.7 | 44.5 |
| Aporcella | 5 | 0 | Omnivores | 68.5 | 27.1 | 66.5 | 70.6 |
| Aporcelaimus | 5 | 0 | Omnivores | 0 | 32 | 0 | 0 |
| Bitylenchus | 0 | 3 | Herbivores—ectoparasites | 0 | 5.5 | 84.3 | 0 |
| Cervidellus | 2 | 0 | Bacterivores | 4.7 | 4.7 | 0 | 4.1 |
| Diphtherophora | 3 | 0 | Fungivores | 6.1 | 11.4 | 0 | 9.4 |
| Ditylenchus | 2 | 0 | Fungivores | 88.1 | 112.1 | 46.7 | 86.7 |
| Filenchus | 2 | 0 | Fungivores | 0 | 8.4 | 0 | 0 |
| Meloidogyne | 0 | 3 | Herbivores—sedentary parasites | 22.2 | 0 | 0 | 0 |
| Mesorhabditis | 1 | 0 | Bacterivores | 34.4 | 132.8 | 155.3 | 4.9 |
| Nanidorus | 0 | 4 | Herbivores—ectoparasites | 0 | 0 | 0 | 13.7 |
| Panagrolaimus | 1 | 0 | Bacterivores | 0 | 5.3 | 0 | 0 |
| Plectus | 2 | 0 | Bacterivores | 5.3 | 0 | 7.7 | 0 |
| Pratylenchus | 0 | 3 | Herbivores—semi-endoparasites | 4.9 | 4 | 9.9 | 20.5 |
| Prismatolaimus | 3 | 0 | Bacterivores | 0 | 12.2 | 10.7 | 13.5 |
| Pseudacrobeles | 2 | 0 | Bacterivores | 5 | 0 | 49.5 | 0 |
| Rotylenchus | 0 | 3 | Herbivores—migratory endoparasites | 10.5 | 13 | 61.5 | 53.3 |
| Rotylenchulus | 0 | 3 | Herbivores—migratory endoparasites | 6.1 | 4.6 | 0 | 0 |
| Trypilina | 2 | 0 | Bacterivores | 0 | 0 | 0 | 9.1 |
| Wilsonema | 2 | 0 | Bacterivores | 0 | 22.8 | 0 | 0 |
| Xiphinema | 0 | 5 | Herbivores—ectoparasites | 0 | 0 | 0 | 16.9 |
| Zeldia | 2 | 0 | Bacterivores | 5.1 | 5.1 | 0 | 11.7 |
| Genus | FO% | RA | PD | PV | RF |
|---|---|---|---|---|---|
| Acrobeles | 75% | 54.3 | 1.6 | 1.4 | 9.3 |
| Acrobeloides | 100% | 48.4 | 0.8 | 0.8 | 8.3 |
| Aphelenchoides | 75% | 48.1 | 1.4 | 1.2 | 8.3 |
| Aphelenchus | 100% | 60.2 | 1.0 | 1.0 | 10.3 |
| Aporcelaimus | 25% | 8.0 | 2.1 | 1.1 | 1.4 |
| Aporcella | 100% | 58.2 | 1.0 | 1.0 | 10.0 |
| Bitylenchus | 50% | 22.4 | 1.5 | 1.1 | 3.9 |
| Cervidellus | 75% | 3.4 | 0.1 | 0.1 | 0.6 |
| Diphtherophora | 75% | 6.7 | 0.2 | 0.2 | 1.2 |
| Ditylenchus | 100% | 83.4 | 1.4 | 1.4 | 14.3 |
| Filenchus | 25% | 2.1 | 0.6 | 0.3 | 0.4 |
| Meloidogyne | 25% | 5.6 | 1.5 | 0.7 | 1.0 |
| Nanidorus | 25% | 3.4 | 0.9 | 0.5 | 0.6 |
| Panagrolaimus | 25% | 1.3 | 0.4 | 0.2 | 0.2 |
| Plectus | 50% | 3.3 | 0.2 | 0.2 | 0.6 |
| Pratylenchus | 100% | 9.8 | 0.2 | 0.2 | 1.7 |
| Prismatolaimus | 75% | 9.1 | 0.3 | 0.2 | 1.6 |
| Pseudacrobeles | 50% | 13.6 | 0.9 | 0.6 | 2.3 |
| Rhabditis | 100% | 81.9 | 1.4 | 1.4 | 14.1 |
| Rotylenchus | 100% | 34.6 | 0.6 | 0.6 | 5.9 |
| Rotylenchulus | 50% | 2.7 | 0.2 | 0.1 | 0.5 |
| Trypilina | 25% | 2.3 | 0.6 | 0.3 | 0.4 |
| Wilsonema | 25% | 5.7 | 1.5 | 0.8 | 1.0 |
| Xiphinema | 25% | 4.2 | 1.1 | 0.6 | 0.7 |
| Zeldia | 75% | 5.5 | 0.2 | 0.1 | 0.9 |
| Index Name | Field-1 | Field-2 | Field-3 | Field-4 | p-Value |
|---|---|---|---|---|---|
| Basal Index | 31.5 ± 1.6 | 26.3 ± 0.5 | 13.6 ± 1.1 | 31.7 ± 1.0 | <0.001 |
| Bacterivore Footprint | 44.7 ± 2.5 | 77.9 ± 3.2 | 61.2 ± 5.6 | 48.0 ± 2.6 | <0.001 |
| Channel Index | 60.7 ± 2.9 | 39.1 ± 1.3 | 11.5 ± 1.2 | 86.1 ± 3.4 | <0.001 |
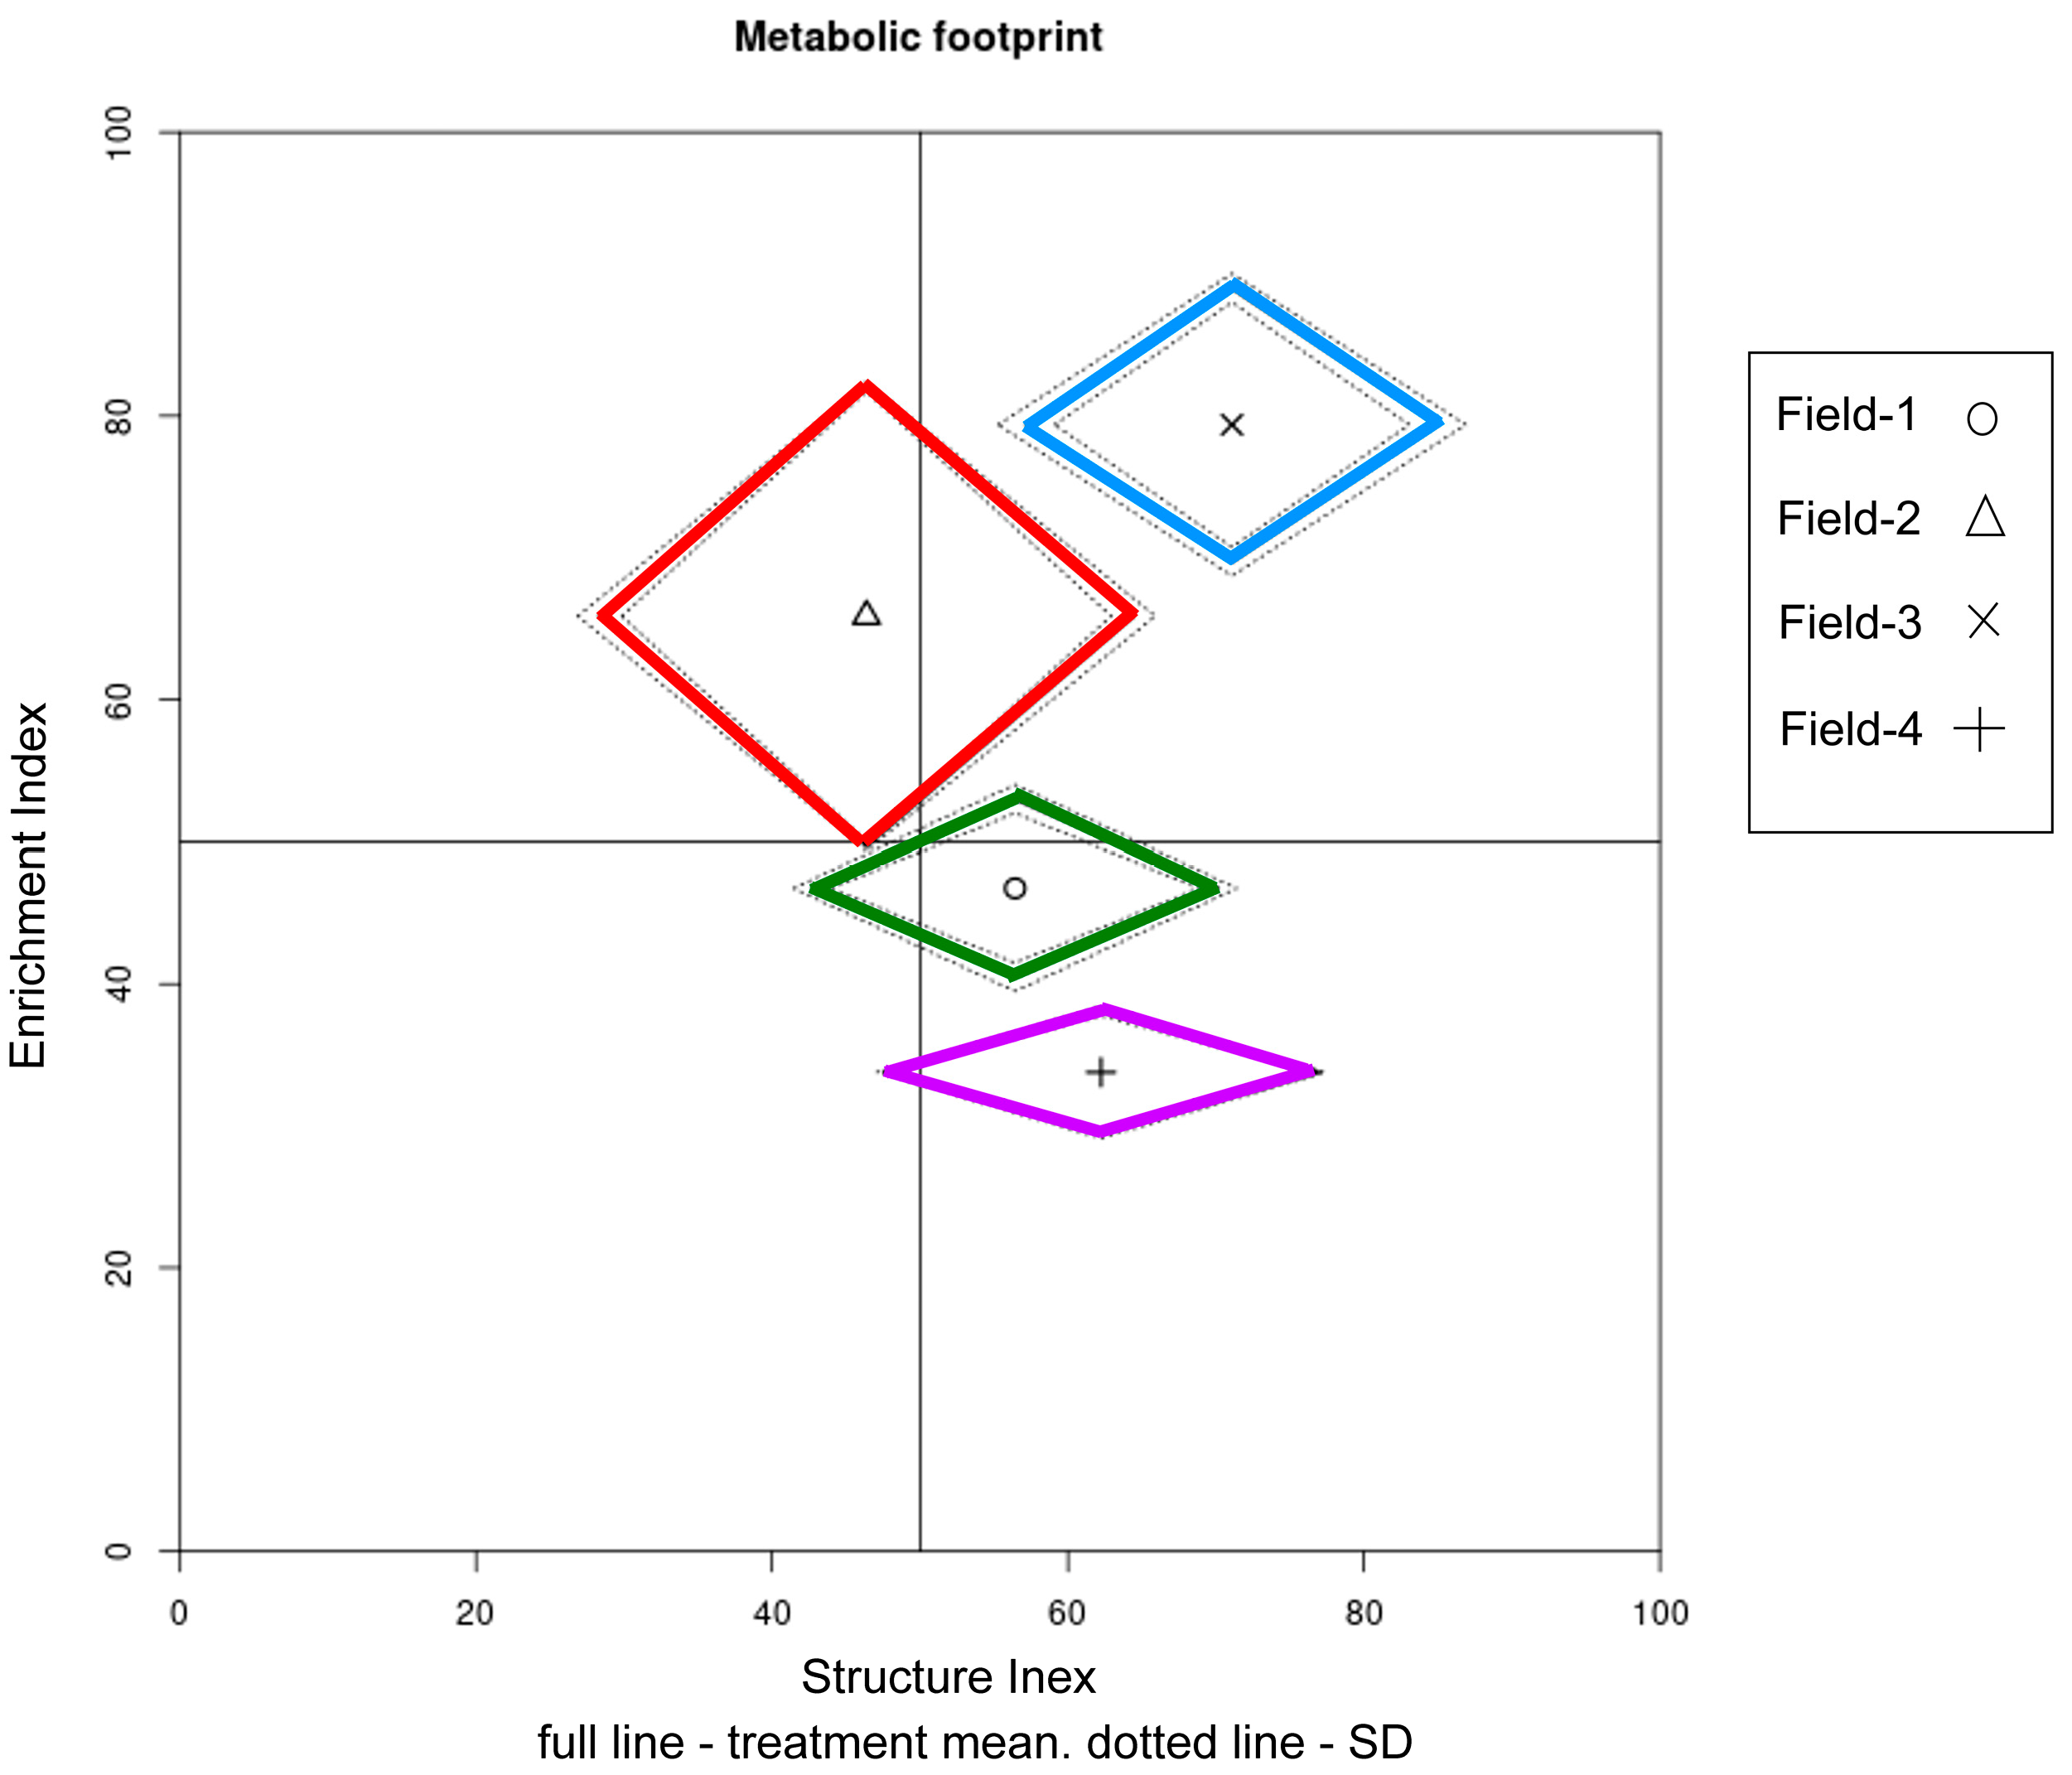
| Composite Footprint | 385.0 ± 42.4 | 216.8 ± 9.4 | 166.5 ± 13.7 | 176.8 ± 4.2 | <0.001 |
| Enrichment Footprint | 31.4 ± 5.0 | 81.3 ± 1.7 | 48.5 ± 5.1 | 21.7 ± 1.7 | <0.001 |
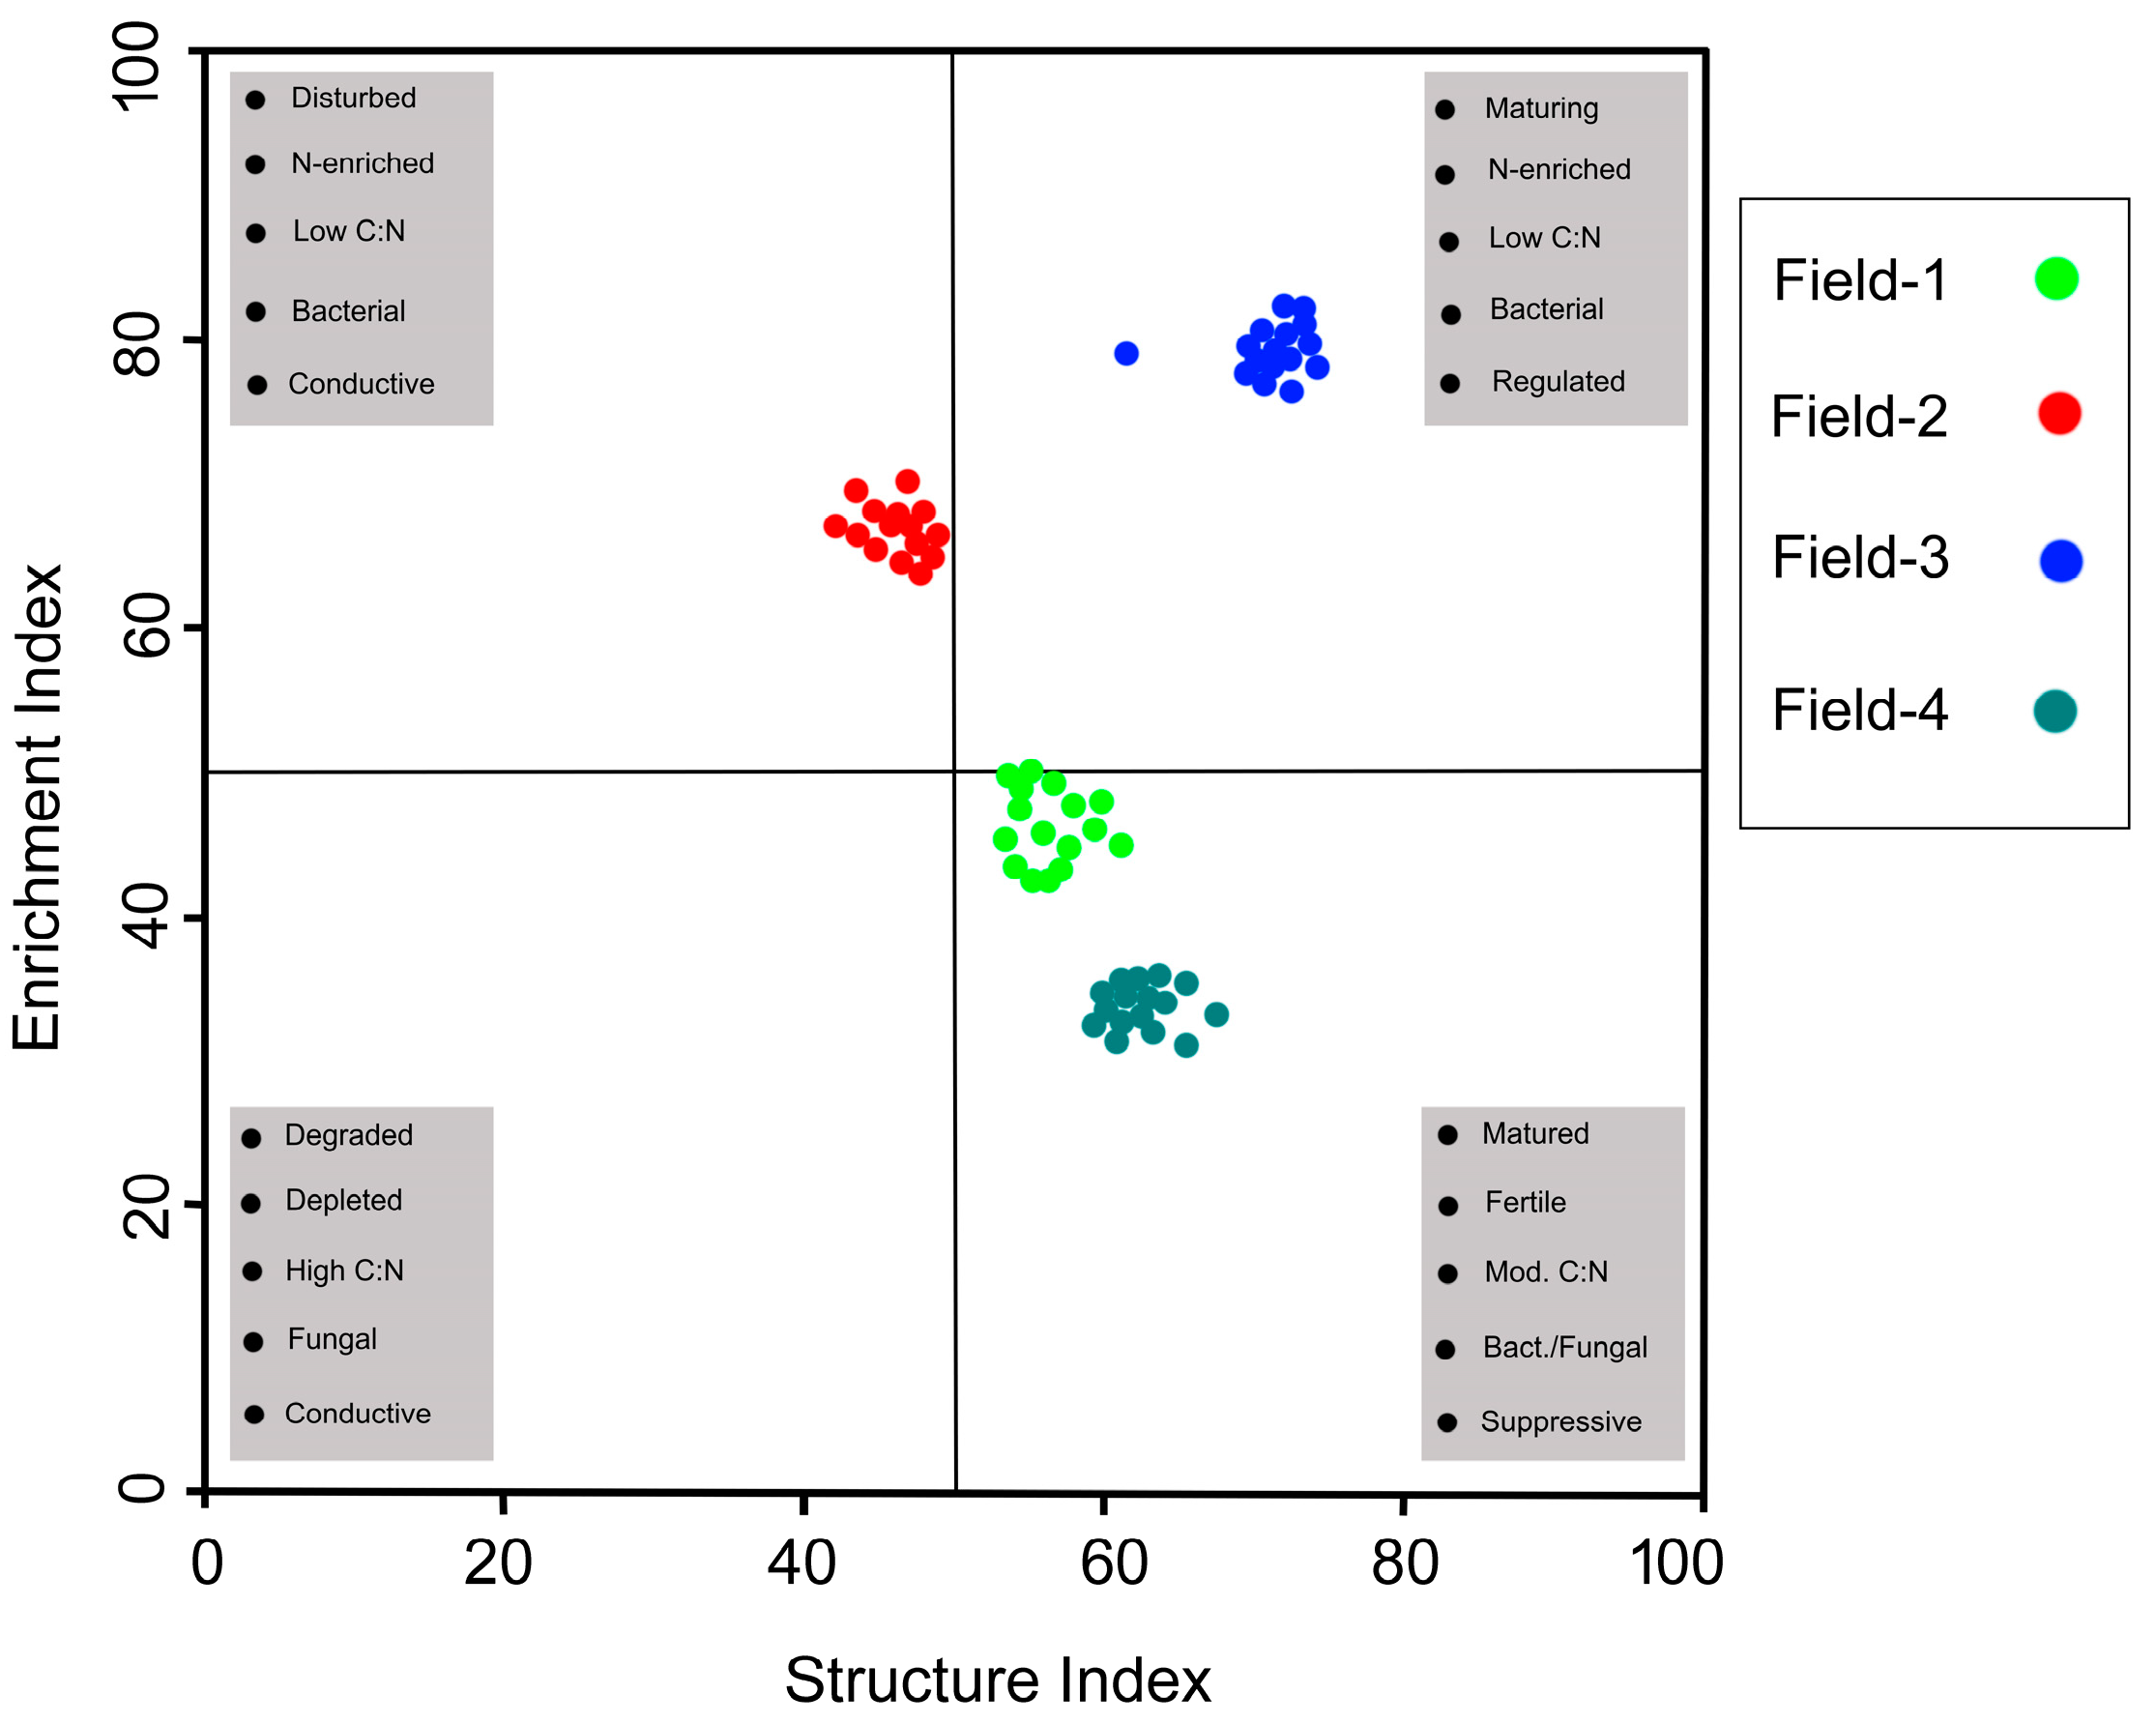
| Enrichment Index | 46.8 ± 3.1 | 65.9 ± 0.8 | 79.4 ± 1.6 | 33.8 ± 1.3 | <0.001 |
| Fungal/Bacterial | 0.9 ± 0.1 | 1.4 ± 0.0 | 0.3 ± 0.0 | 0.7 ± 0.0 | <0.001 |
| Fungivore Footprint | 25.7 ± 3.4 | 47.1 ± 1.0 | 11.9 ± 0.9 | 22.2 ± 1.8 | <0.001 |
| Herbivore Footprint | 247.1 ± 41.4 | 5.2 ± 1.1 | 25.2 ± 3.8 | 36.7 ± 3.4 | <0.001 |
| Maturity Index | 2.4 ± 0.1 | 2.1 ± 0.0 | 2.2 ± 0.1 | 2.6 ± 0.0 | <0.001 |
| Maturity Index 2-5 | 2.5 ± 0.0 | 2.4 ± 0.0 | 2.8 ± 0.1 | 2.6 ± 0.0 | <0.001 |
| Omnivore Footprint | 67.6 ± 6.4 | 30.6 ± 6.5 | 68.2 ± 9.5 | 69.9 ± 2.6 | <0.001 |
| Plant Parasitic Index | 2.9 ± 0.0 | 2.8 ± 0.0 | 3.0 ± 0.0 | 3.4 ± 0.0 | <0.001 |
| Shannon Index (H’) | 1.8 ± 0.0 | 2.2 ± 0.0 | 2.2 ± 0.0 | 2.2 ± 0.0 | <0.001 |
| Sigma Maturity Index | 2.5 ± 0.1 | 2.1 ± 0.0 | 2.4 ± 0.1 | 2.8 ± 0.0 | <0.001 |
| Structure Footprint | 68.8 ± 6.4 | 90.6 ± 7.5 | 69.8 ± 9.6 | 73.7 ± 2.5 | <0.001 |
| Structure Index | 56.4 ± 2.4 | 46.4 ± 2.0 | 71.1 ± 3.6 | 62.2 ± 1.5 | <0.001 |
| Total Biomass, mg | 2.5 ± 0.3 | 0.8 ± 0.1 | 0.6 ± 0.1 | 0.7 ± 0.0 | <0.001 |
| Total Number, Individual | 486.9 ± 31.5 | 795.4 ± 17.6 | 568.3 ± 43.2 | 501.3 ± 14.6 | <0.001 |
| Site | Clay% | Silt% | Sand% |
|---|---|---|---|
| Field-1 | 1.7 | 19 | 79.3 |
| Field-2 | 6 | 38 | 56 |
| Field-3 | 1.9 | 27.5 | 70.6 |
| Field-4 | 1.7 | 8.6 | 89.7 |
Disclaimer/Publisher’s Note: The statements, opinions and data contained in all publications are solely those of the individual author(s) and contributor(s) and not of MDPI and/or the editor(s). MDPI and/or the editor(s) disclaim responsibility for any injury to people or property resulting from any ideas, methods, instructions or products referred to in the content. |
© 2023 by the author. Licensee MDPI, Basel, Switzerland. This article is an open access article distributed under the terms and conditions of the Creative Commons Attribution (CC BY) license (https://creativecommons.org/licenses/by/4.0/).
Share and Cite
Shokoohi, E. Impact of Agricultural Land Use on Nematode Diversity and Soil Quality in Dalmada, South Africa. Horticulturae 2023, 9, 749. https://doi.org/10.3390/horticulturae9070749
Shokoohi E. Impact of Agricultural Land Use on Nematode Diversity and Soil Quality in Dalmada, South Africa. Horticulturae. 2023; 9(7):749. https://doi.org/10.3390/horticulturae9070749
Chicago/Turabian StyleShokoohi, Ebrahim. 2023. "Impact of Agricultural Land Use on Nematode Diversity and Soil Quality in Dalmada, South Africa" Horticulturae 9, no. 7: 749. https://doi.org/10.3390/horticulturae9070749