Article

The Impact of High Temperatures in the Field on Leaf Tissue Structure in Different Grape Cultivars

1
Turpan Research Institute of Agricultural Sciences, Xinjiang Academy of Agricultural Sciences, Turpan 838000, China
2
Xinjiang Grape Engineering Technology Research Center, Turpan 838000, China
3
The State Key Laboratory of Genetic Improvement and Germplasm Innovation of Crop Resistance in Arid Desert Regions (Preparation), Key Laboratory of Genome Research and Genetic Improvement of Xinjiang Characteristic Fruits and Vegetables, Institute of Horticultural Crops, Xinjiang Academy of Agricultural Sciences, Urumqi 830091, China
4
Research Institute of Forestry and Pomology, Shanghai Academy of Agricultural Science, Shanghai 201403, China
5
Colleges of Horticulture, Northwest A&F University, Xianyang 712100, China
*
Authors to whom correspondence should be addressed.
These authors contributed equally to this work.
Horticulturae 2023, 9(7), 731; https://doi.org/10.3390/horticulturae9070731
Submission received: 17 May 2023 / Revised: 15 June 2023 / Accepted: 16 June 2023 / Published: 21 June 2023
(This article belongs to the Special Issue Horticulture Plants Stress Physiology)

Abstract

:
Global warming will significantly affect grapevine growth and development. To analyze the effects of high temperature on the leaf tissue structure of grapevines in the field, 19 representative cultivars were selected from the grapevine germplasm resources garden in Turpan Research Institute of Agricultural Sciences, XAAS. Twelve tissue structure indexes of grapevine leaves, including the thickness of the upper epidermis (TUE), the thickness of palisade tissue (TPT), leaf vein (LV), the thickness of spongy tissue (TST), the thickness of the lower epidermis (TLE), stoma (St), guard cell (GC), cuticle (Cu), leaf tissue compactness (CTR) and leaf tissue porosity (SR), were measured during the natural high-temperature period in Turpan. The results showed significant differences in the leaf tissue structure of the 19 grapevine cultivars under natural high temperature. Based on the comprehensive comparative analysis of the leaf phenotype in the field, we identified that the leaves of some cultivars, including ‘Zaoxia Wuhe’, ‘Centennial Seedless’ and ‘Kyoho’ showed strong heat tolerance, whereas grapevine cultivars ‘Golden Finger’, ‘Shine Muscat’, ‘Flame Seedless’, ‘Bixiang Wuhe’ and ‘Thompson Seedless’ showed sensitivity to high temperature. We further evaluated the heat tolerance of different grapevine cultivars by principal component analysis and the optimal segmentation clustering of ordered samples. These findings provide a theoretical basis for adopting appropriate cultivation management measures to reduce the effect of high temperatures and offer fundamental knowledge for future breeding strategies for heat-tolerant grapevine varieties.

1. Introduction

High temperature is a major factor in the threat to global plant production and distribution. Each degree Celsius of the average growing season temperature may reduce crop production and plant distribution. Grapevine (Vitis L.) has to face the variety of biological and abiotic stresses that are inevitable during its growth and development. High temperature is one of the primary abiotic stress factors that restrict the yield and quality of grapes [1,2]. The most obvious sign of a plant response to heat stress is the change in the tissue structure of grapevine leaves. When evaluating how well various grapevine genetic resources can withstand heat, this method is frequently applied as one of the evaluation indicators of the extent of high temperature damage to the plant [3,4]. Leaves, as the primary organs of land plants, play a crucial role in photosynthesis. Their traits are closely linked to the physiological functions of plants [5]. Several aspects of leaf morphology have been definitively recognized as functional, displaying clear associations with abiotic stress. Leaf thickness, which represents the distance between the upper (adaxial) and lower (abaxial) leaf surfaces, has been shown to correlate with environmental factors such as water availability, temperature and light levels [6]. Additionally, studies indicate that plant diversity and the capacity of plants to adapt to arid conditions often lead to thicker leaves [7,8]. It is important to differentiate between leaf thickness within the context of typical leaf morphology, characterized by clear adaxial/abaxial flattening, and extremely thick leaves known as succulent leaves, which often exhibit a more radial structure. On an organismal level, thicker leaves present a trade-off between rapid growth and tolerance to drought and heat stress [9]. High temperatures not only damage the tissue structure of grapevine leaves but also hinder photosynthesis and nutrient metabolism. Furthermore, they inhibit fruit metabolism and the synthesis of aroma-related compounds, significantly impacting the commercial and market value of grapes [10,11]. When high temperature damage exceeds its ability to regulate adversity, serious heat damage symptoms and even plant death may occur [12,13]. The Turpan region in Xinjiang has great potential to produce high quality grape because of its suitable growing conditions. Abundant sunlight and optimum temperature during grape-growing seasons provide the opportunity to produce high quality grapes in this region. It is an important grape production region in China, covering an area of 38,025 hectares with a yield of 1,211,509 tons per year. However, the unique geography of the Turpan region means that a temperature of beyond 40 °C spans more than 35 days per year. This is likely to induce water loss, the wilting of grapevine leaves, damage to the cell structure, and a destruction of other factors that cause photosynthesis, as well as complicating the way grapes use nutrients. Furthermore, limiting the synthesis and transportation of photosynthetic products will lead to a significant decrease in grape yield and quality. With the increasing frequency and duration of extremely high temperature in the world [14], global grape-producing regions involving Turpan will face more severe challenges from high temperature stress [15]. Therefore, improving plant heat tolerance will be an important research field in response to global warming [16]. Numerous studies have been performed in the past by simulating high temperatures under artificial conditions. However, grapevines often face more complex environments during the field growth and development process, such as the intensity and occurrence time of high temperatures in the field fluctuating and changing. In addition, the high humidity or dry environment often accompanied by high temperature will also experience substantial differences. Therefore, it is difficult to fully and truly reflect the heat tolerance of grapevines in the natural environment when only simulating high-temperature climate indoors [17,18,19]. Therefore, under the unique arid and heat conditions in Turpan, research was carried out with a number of important grape varieties. The present research includes field phenotype observation, tissue structure analysis of different grapevine varieties, and a comprehensive evaluation of leaf heat tolerance to screen and identify the grapevine germplasm with different high-temperature tolerance types. The study’s results will provide an in-depth understanding of the growth of different grapevines under field conditions and assist with information for breeding heat-resistant varieties and cultivating stress resistance.

2. Materials and Methods

2.1. Grapevine Resources and Cultivation Conditions

The representative grapevine varieties available in the grapevine resource garden of the Turpan Research Institute of Agricultural Sciences, Xinjiang Academy of Agricultural Sciences (XAAS), were used as the test materials. The grapevine garden is located at 89°11′ E, 42°56′ N, at an altitude of 0 m. In July, with an average air humidity of 37.20%, the area received a mere 3.4 mm of precipitation, while the humidity ranged from 18.68% to 58.72%. The average photosynthetic radiation measured 163.52 W/m2, and the average light intensity was 46.21 Klux. The detailed information regarding the grapevine varieties used in the current experiment with species characteristics and the parental sources of 19 grapevine varieties are presented in Table 1. In the trial field, a V-shaped leaf curtain was used as a trellis, and the distance between plants and rows was maintained at 1.2 m to 2.5 m. The garden soil is sandy loam with a pH of 8.04, and an organic content of approximately 12.8 g/kg. The area benefits from favorable water conservancy conditions, and fertilization is carried out using a water and fertilizer all-in-one machine. The plants were planted in a south-to-north direction, and they were all 6 years old, moderate and well-handled.

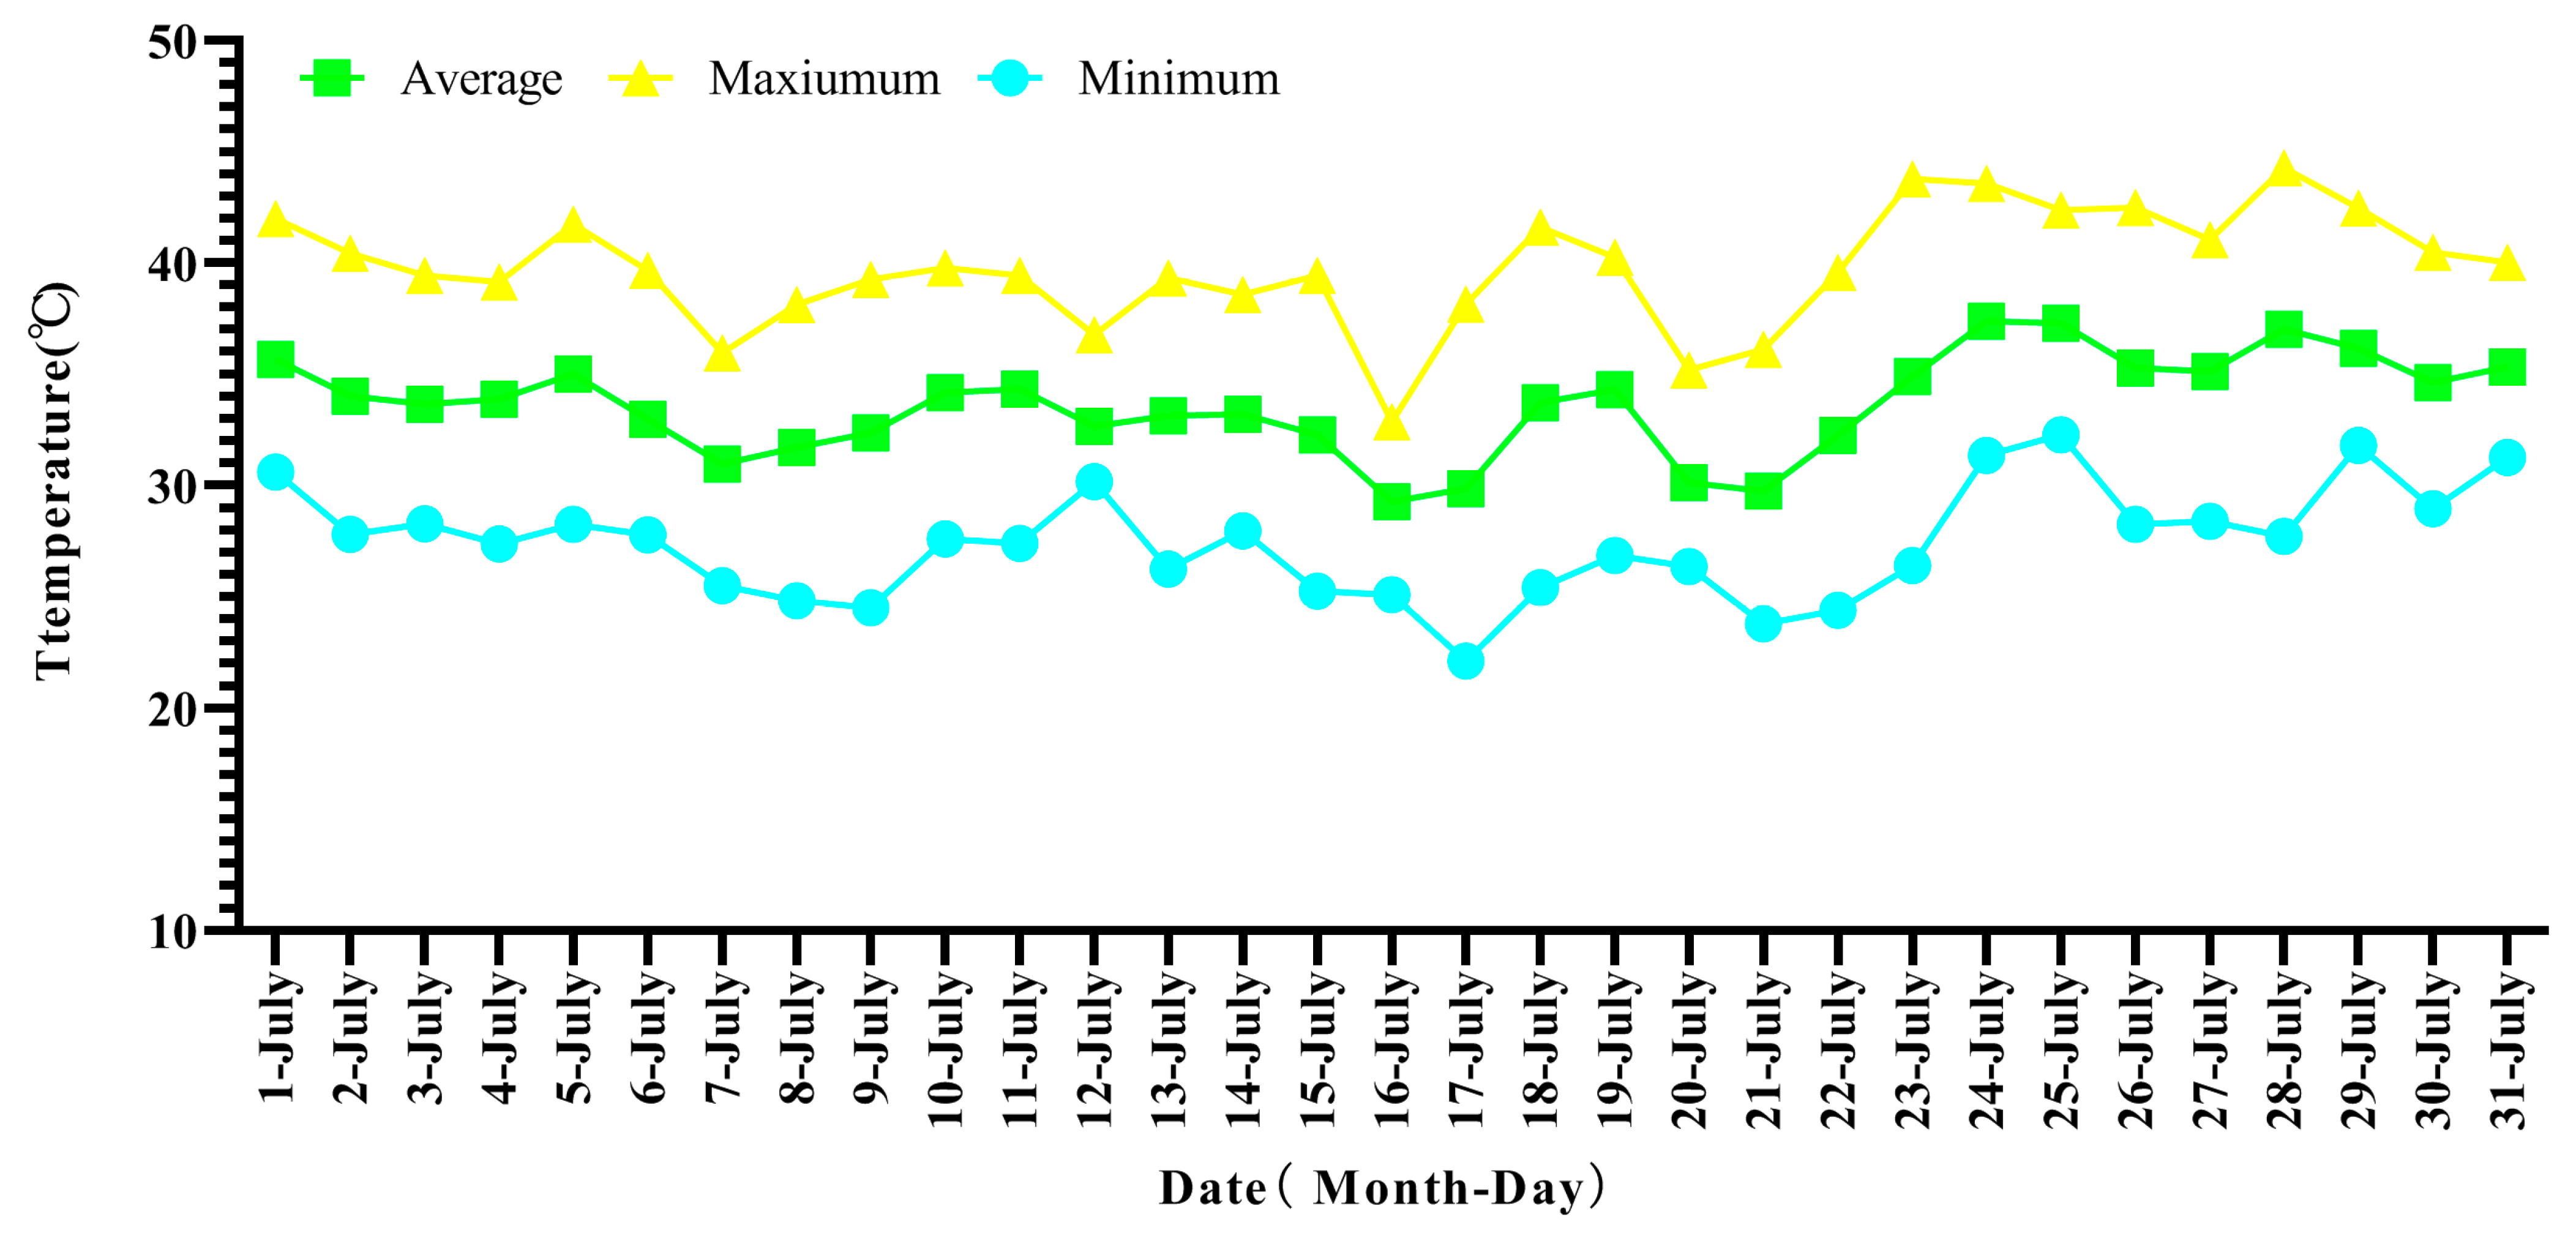
2.2. Temperature Measurement Tested

The experiment was conducted in Turpan, Xinjiang Uygur Autonomous Region, in 2022 during the high-temperature period (July). A MicroLite USB Temperature data Logger (Fourier Systems, Fourtec-Fourier Technologies., Ltd., San Francisco, CA, USA) was used to monitor the temperature data at a point in the grapevine resource garden. The temperature was measured and recorded once an hour throughout the entire high-temperature period.

2.3. Leaf Blade Morphology Observation

The plant growth status was observed in the field on 27 July 2022, and the grape-vine leaves were photographed immediately using a digital compact camera (Canon-G15, Canon Corporation, Tokyo, Japan) by placing the leaves against a fixed black background in a photography chamber (Zhejiang standard photography equipment Corporation., Ltd., Ningbo, Zhejiang, China). Each variety selected functional leaves with essentially the same growth at the 5 to 7th nodes of the middle branch of the vine for photo observation.

2.4. Sampling for Leaf Structure Observation

The leaf sampling for microscopy was performed in July 2022. For detailed structure observation, healthy grapevine plants of the representative population were selected. Mature, healthy, without-disease leaves from the 5th and 7th nodes of middle branches with uniform shape and size were collected during a period of naturally high temperature. A clean and sharp pair of scissors was used to cut the leaves from the plants, preventing any damage to the leaf tissue. Each sample was labeled with basic information and transferred to a clean and dry container for transportation to the laboratory. The leaves were wiped to remove any dust with damp clothes and 0.5~1.0 cm pieces of tissue were cut intercostal between the veins. The leaves were fixed in FAA fixative solution, and a continuous paraffin section of 10 μm was made. The leaf samples were dyed with toluidine blue, soaked in xylene for 5 minutes, and then sealed and dried for later use. The fine tissue structures were observed with the Nikon Digital SightDS-L1 digital microscope camera system (Nikon Instruments Inc., Tokyo, Japan). The thickness of the leaves, upper epidermis, lower epidermis, palisade tissue, spongy tissue, cuticle, stomata and guard cells were evaluated using Image J, ver.1.47 (July 2013, National Institutes of Health, Bethesda, Maryland, USA). In total, 30 visual areas of each sample were measured and used to calculate the leaf tissue compactness (CTR) and leaf tissue porosity (SR) according to the below formulas [19,20]:
CTR = (palisade tissue thickness/leaf thickness) × 100%
SR = (spongy tissue thickness/leaf thickness) × 100%

2.5. Data Analysis

The test data were analyzed by variance, and the Duncan method was used for multiple comparisons and the significance of the difference was tested. p < 0.05. was the significant level of the difference, and p < 0.01 was the extremely significant level of the difference. GraphPad Prism ver.9.0 (October 2020, Dotmatics Corporation, Boston, MA, USA) and IBM SPSS Statistics (Statistical Product and Service Solutions) program, ver. 19.0 (August 2010, IBM Corporation, New York, NY, USA) were used for correlation analysis and cluster analysis. Data in tables and figures show means and standard errors representing 30 technical replications.

3. Results

3.1. Temperature Dynamics in the Field

The average temperature of the research field in July 2022 was 33.62 °C. The daily average high temperature was 39.78 °C, and the average low temperature was 27.41 °C. The highest and lowest temperatures for the month were reported 44.28 °C and 22.10 °C, respectively. Thirty days into the month, temperatures exceeded 35 °C, including 16 days with temperatures between 35 °C and 40 °C and 14 days with temperatures over 40 °C (Figure 1). The samples were collected on 28 July 2022, between 15:00 and 17:00.

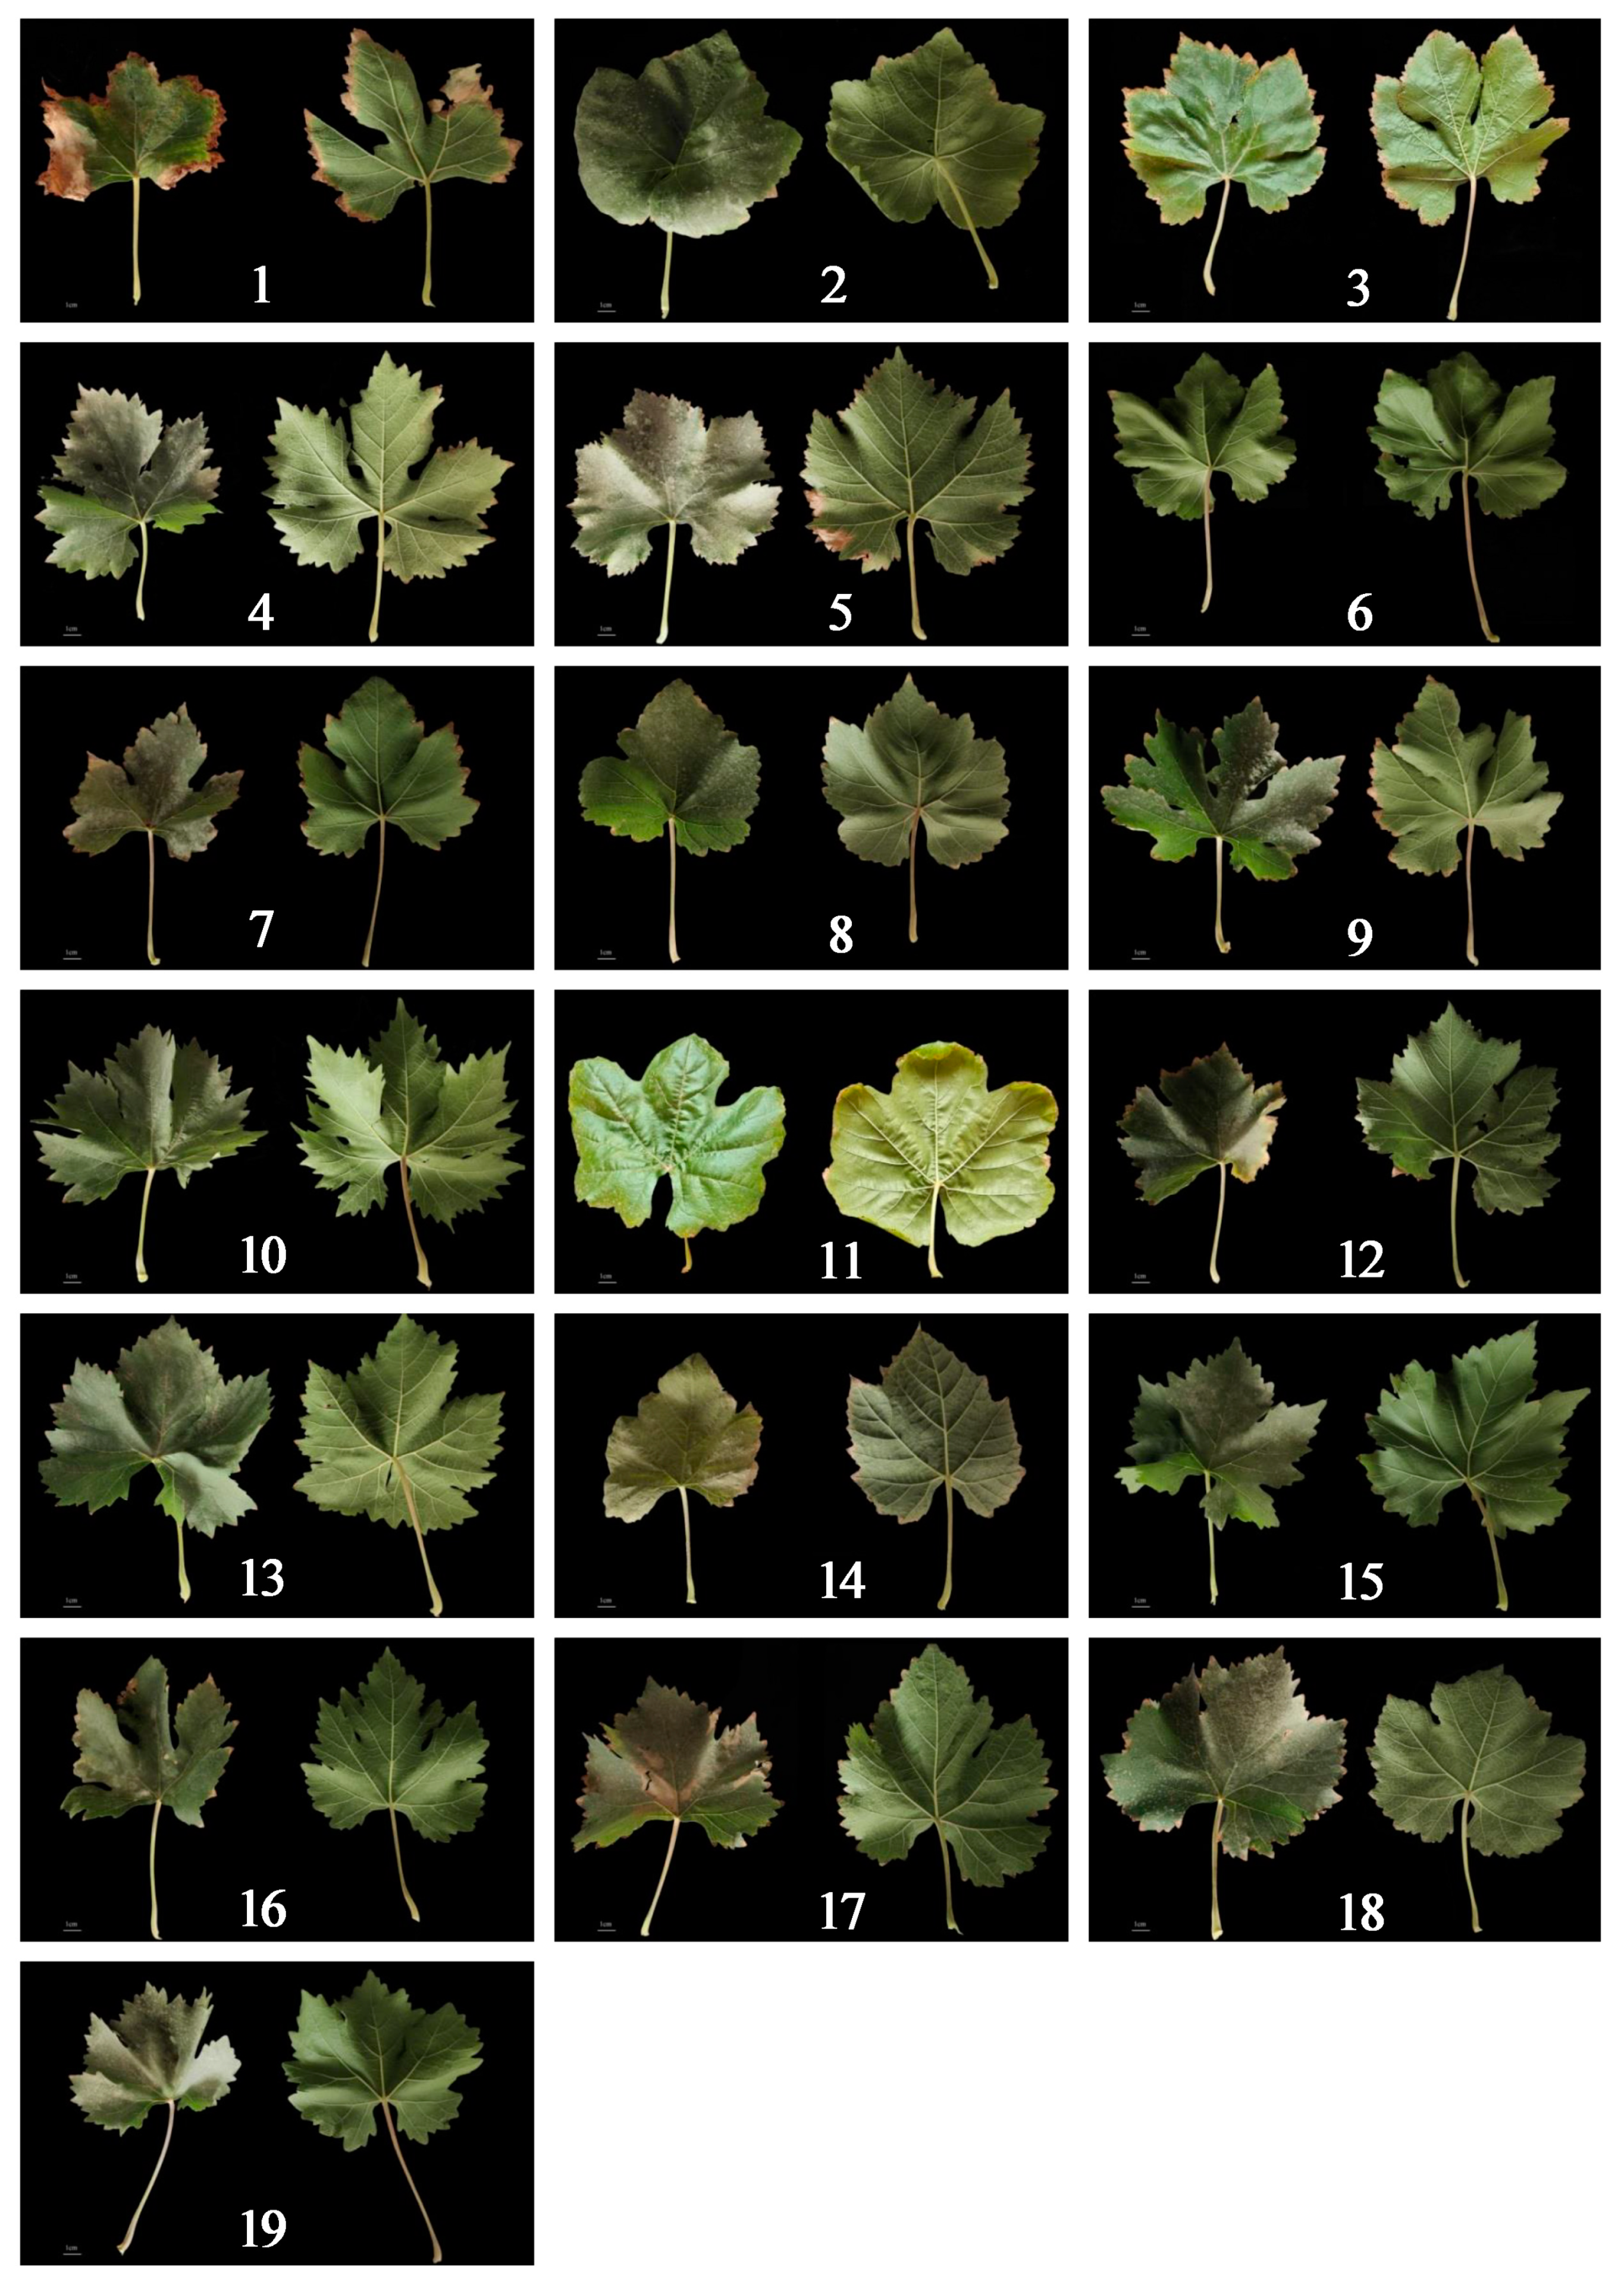
3.2. Phenotypic Observation of Leaves

Under the natural high-temperature conditions in the field, only the ‘Centennial Seedless’, ‘Brilliant Seedless’, ‘Jumeigui’ and ‘Zhengmei’ possessed no obvious heat damage symptoms on leaves (Figure 2). The other varieties showed different degrees of heat damage symptoms on leaves. Among them, the leaves of ‘Thompson Seedless’, ‘Shine Muscat’ and ‘Golden Finger’ became yellowish green. The leaves of ‘Jumeigui’, ‘Kyoho’, ‘Summer Black’ and ‘Zaoxia Wuhe’ turned to dark green, and other varieties remained green. The leaves of ‘Golden Finger’, ‘Zhengyan Wuhe’, ‘Flame Seedless’, ‘Bixiang Wuhe’ and ‘Shine Muscat’ showed curly leaf margins. Except for the varieties ‘Zhengyan Wuhe’, ‘Jumeigui’, ‘Centennial Seedless’, ‘Zhengmei’ and ‘Brilliant Seedless’, the leaf margins of other varieties were all dry to varying degrees, and the leaf margins of ‘Golden Finger’, ‘Zuijinxiang’ and ‘Shine Muscat’ were more obviously dry. The leaves of ‘Golden Finger’, ‘Flame Seedless’, ‘Thompson Seedless’, ‘Bixiang Wuhe’ and ‘Shine Muscat’ were accompanied by spots. The results of the morphological observation showed that ‘Thompson Seedless’, ‘Golden Finger’, ‘Flame Seedless’, ‘Bixiang Wuhe’ and ‘Shine Muscat’ had heat damage symptoms that were more evident, and based on the preliminarily observation, these were of a high-temperature sensitive variety. The varieties ‘Centennial Seedless’, ‘Brilliant Seedless’, ‘Zhengmei’, and ‘Jumeigui’ were found to be high-temperature-tolerant varieties.

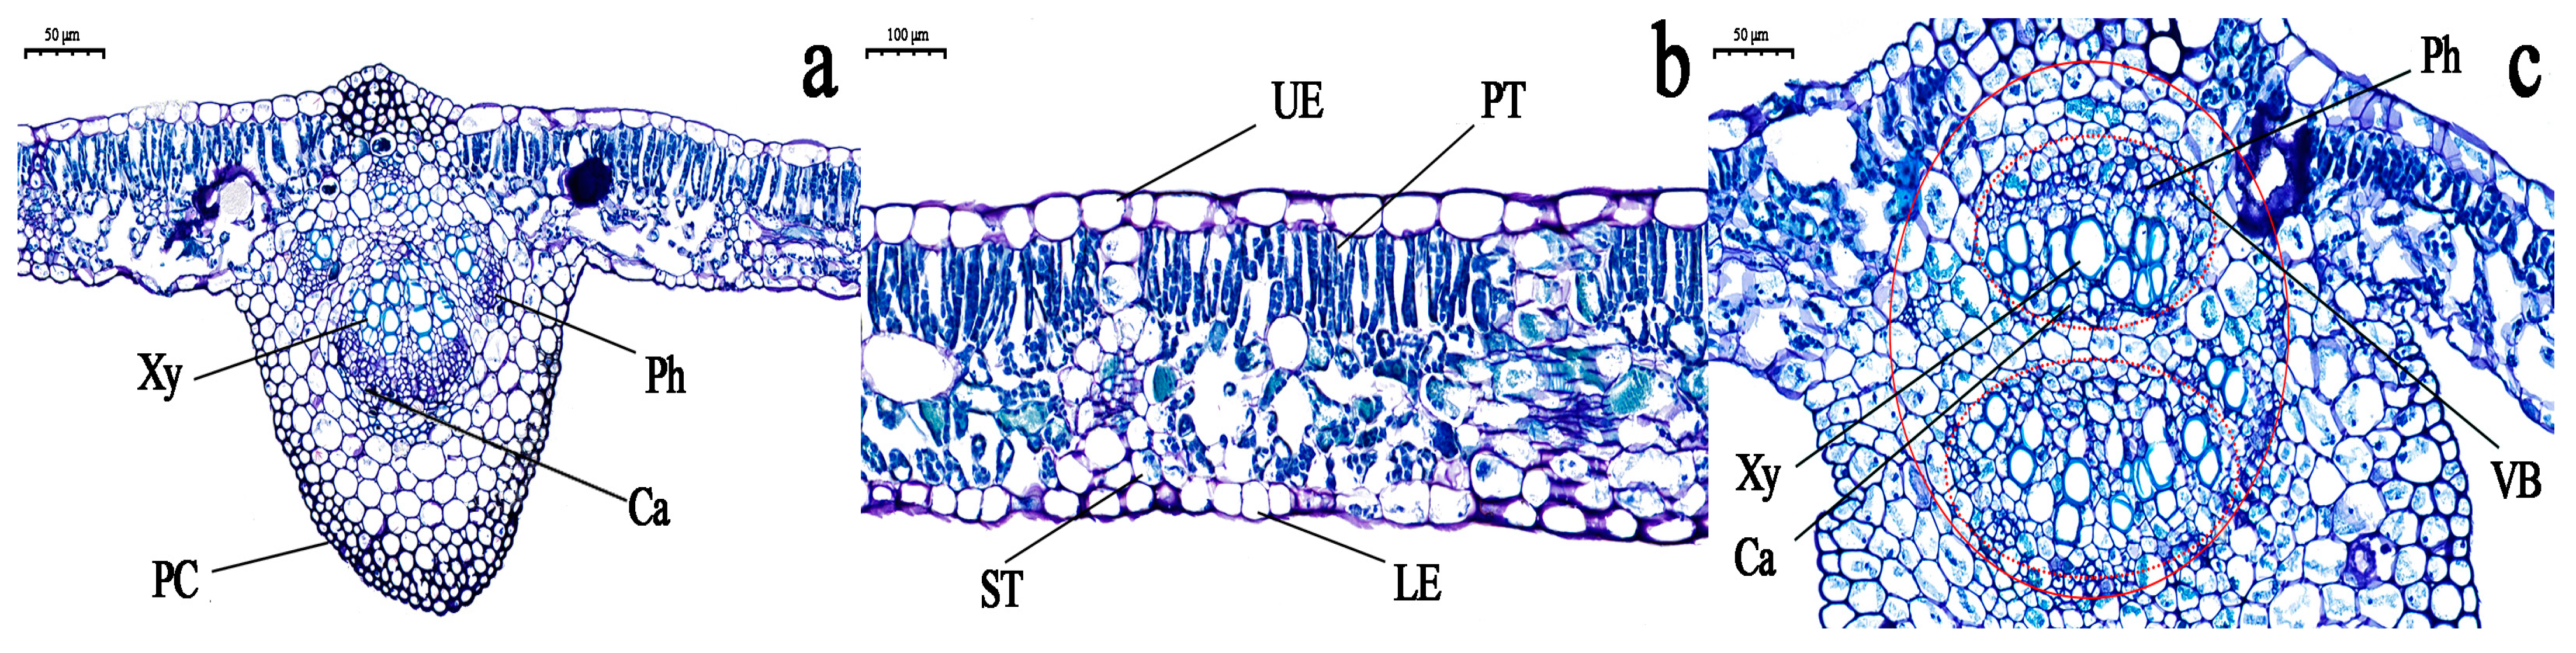
3.3. Observation of the Cell Structure of Grapevine Leaves

The observations from the anatomical diagram of grapevine leaves show that the leaf structure is primarily composed of the thickness of upper epidermis (TUE), thickness of palisade tissue (TPT), leaf vein (LV), thickness of spongy tissue (TST), thickness of lower epidermis (TLE), stoma (St), guard cell (GC), cuticle (Cu), etc. (Figure 3). The thickness of leaf (TL) in 19 grapevine varieties ranged from 85.00~168.26 μm and the average TL was 114.34 ± 12.20 μm. The upper and lower epidermal cells were composed of long oval monolayer cells, and the length of the TUE ranged from 9.88~32.57 μm with an average length of 19.73 ± 6.92 μm. The TLE was observed on palisade tissue, and the shapes of upper and lower epidermal cells were found to be similar (Figure 3). The length of upper and lower epidermal cells varied from to 10.19–24.31 μm with an average length of 17.49 ± 4.27 μm.
The mesophyll tissue is mainly composed of palisade tissue and spongy tissue. The palisade tissue cells are shaped in the form of long columns and are arranged neatly and closely in the mesophyll, with a length of 19.36–57.66 μm; the average length is about 32.68 ± 5.44 μm. Spongy tissue is composed of oval cells located between the palisade tissue and lower epidermis. They are loosely and irregularly arranged in the mesophyll. The cell length varies from 24.65 to 11.77 μm, and the average length is about 18.74 ± 3.88 μm. There were obvious traces of cambium and relatively developed xylem in the leaves. The cambium is composed of several layers of parenchyma cells, and the xylem is composed of five to seven layers of radial and orderly arranged cells. There are vessels in the xylem, and the vascular bundles are uniformly and closely arranged in the veins. The lengths of the veins were in the range of 9.69–34.52 μm; the average length is about 19.48 ± 4.13 μm (Figure 3). The phloem cells are relatively small and thin, arranged in an orderly manner.

3.4. Leaf Thickness and Epidermal Cells

The thickness of leaves (TLs) is one of the indicators to evaluate the heat tolerance of plants. Under high temperature environment, the TLs slow down transpiration to reduce water loss and alleviate heat damage. Depending on their thickness, epidermal cells can affect the heat tolerance of grapevines to a certain extent. There are certain statistical differences in leaf thickness and epidermal cells between the 19 grapevine varieties (Table 2). The TLs of ‘Kyoho’ and ‘Zaoxia Wuhe’ are greater, which are 168.26 μm and 161.29 μm, respectively. The minimum TL of ‘Zhengmei’ (TL = 85.00 μm) is significantly lower than those of other varieties (p < 0.05) except for ‘Shine Muscat’. Comparing TUE and TLE, TUE arranges more orderly and is slightly larger than TLE, but there is no significant difference in cell size (p < 0.05). Under the naturally high-temperature conditions in Turpan, the TUE of ‘Summer Black’ and ‘Centennial Seedless’ are significantly higher than other varieties (p < 0.05), which are 32.57 μm and 30.19 μm, respectively. ‘Flame Seedless’ presents the minimum in 19 grapevine varieties (TUE = 9.88 μm); it is significantly lower than other varieties, except for ‘Qingfeng’, ‘Cardinal’ and ‘Centennial Seedless’ (p < 0.01). The thicknesses of TLE and TUE resemble each other. The TLE of ‘Zitian Wuhe’, ‘Zaoxia Wuhe’, ‘Zuijinxiang’ and ‘Centennial Seedless’ are significantly greater than that of other varieties, except of ‘Centennial Seedless’ (p < 0.01), with ‘Zitian Wuhe’ having a maximum TLE of 24.31 μm, and ‘Golden Finger’ having a significantly lower minimum TLE than other varieties (10.19 μm; p < 0.01) (Figure 3).

3.5. Palisade Tissue, Spongy Tissue and Palisade Tissue/Spongy Tissue

The structural characteristics of mesophyll cells are directly related to photosynthesis, and their degree of differentiation can indirectly indicate the heat tolerance of plants, while the larger the palisade tissue/spongy tissue (P/S), the stronger the heat tolerance. The palisade tissue is significantly the largest in ‘Cardinal’ and ‘Kyoho’, at 57.66 μm and 54.63 μm, respectively (Table 2; p < 0.01). However, it is significantly the smallest in ‘Thompson Seedless’ (p < 0.01). The significantly largest spongy tissue is that of ‘Centennial Seedless’ (24.65 μm), whereas ‘Zhengyan Wuhe’ and ‘Kyoho’ have the significantly smallest one (p < 0.05). The P/S ratio ranges from 1.12 to 3.14. Four varieties have a significantly higher P/S than 2.0, including ‘Qingfeng’, ‘Kyoho’, ‘Cardinal’ and ‘Zaoxia Wuhe’ (p < 0.01). Among them, ‘Qingfeng’ (P/S = 3.14) reaches the maximum, indicating that its heat tolerance is relatively strong, while ‘Zhengyan Wuhe’ has the minimum P/S of 1.12, indicating that its heat tolerance is relatively weak.

3.6. Stomata, Guard Cells and Cuticle

Stomata (St) are the main pathways of photosynthetic gas exchange metabolism in plants. Stomatal opening is mainly regulated by guard cells (GC), which generally increases with the rise in temperature. However, high temperature (>30 °C) will lead to strong transpiration. At this temperature, guard cells close stomata to avoid water loss. Under the natural high-temperature conditions in Turpan, ‘Golden Finger’ (St = 7.34 μm) has the maximum stomata number on leaves, ‘Zaoxia Wuhe’ has the second highest number (St = 6.44 μm), and ‘Summer Black’ has the minimum (St = 3.14 μm) (Table 2). The guard cell dimension of ‘Golden Finger’ is significantly higher than that of other varieties. The guard cell dimension ranges from 5.37 μm to 9.51 μm in 19 grapevine varieties; four varieties bear guard cells longer than 8 μm, including ‘Zaoxia Wuhe’, ‘Centennial Seedless’, ‘Summer Black’ and ‘Zitian Wuhe’. ‘Jintian Meigui’ has the significantly shortest guard cells at 5.37 μm (p < 0.01). The cuticle (Cu) is a membrane composed of impermeable adipose tissue, which can improve heat tolerance in plants by reducing transpiration and prevent water loss in high-temperature environments [21]. The cuticle of ‘Zhengyan Wuhe’ is significantly the thickest one (Cu = 5.50 μm) (Figure 2). ‘Shine Muscat’ (p < 0.05) and ‘Qingfeng’ have the significantly thinnest cuticle (1.34 μm) (p < 0.01).

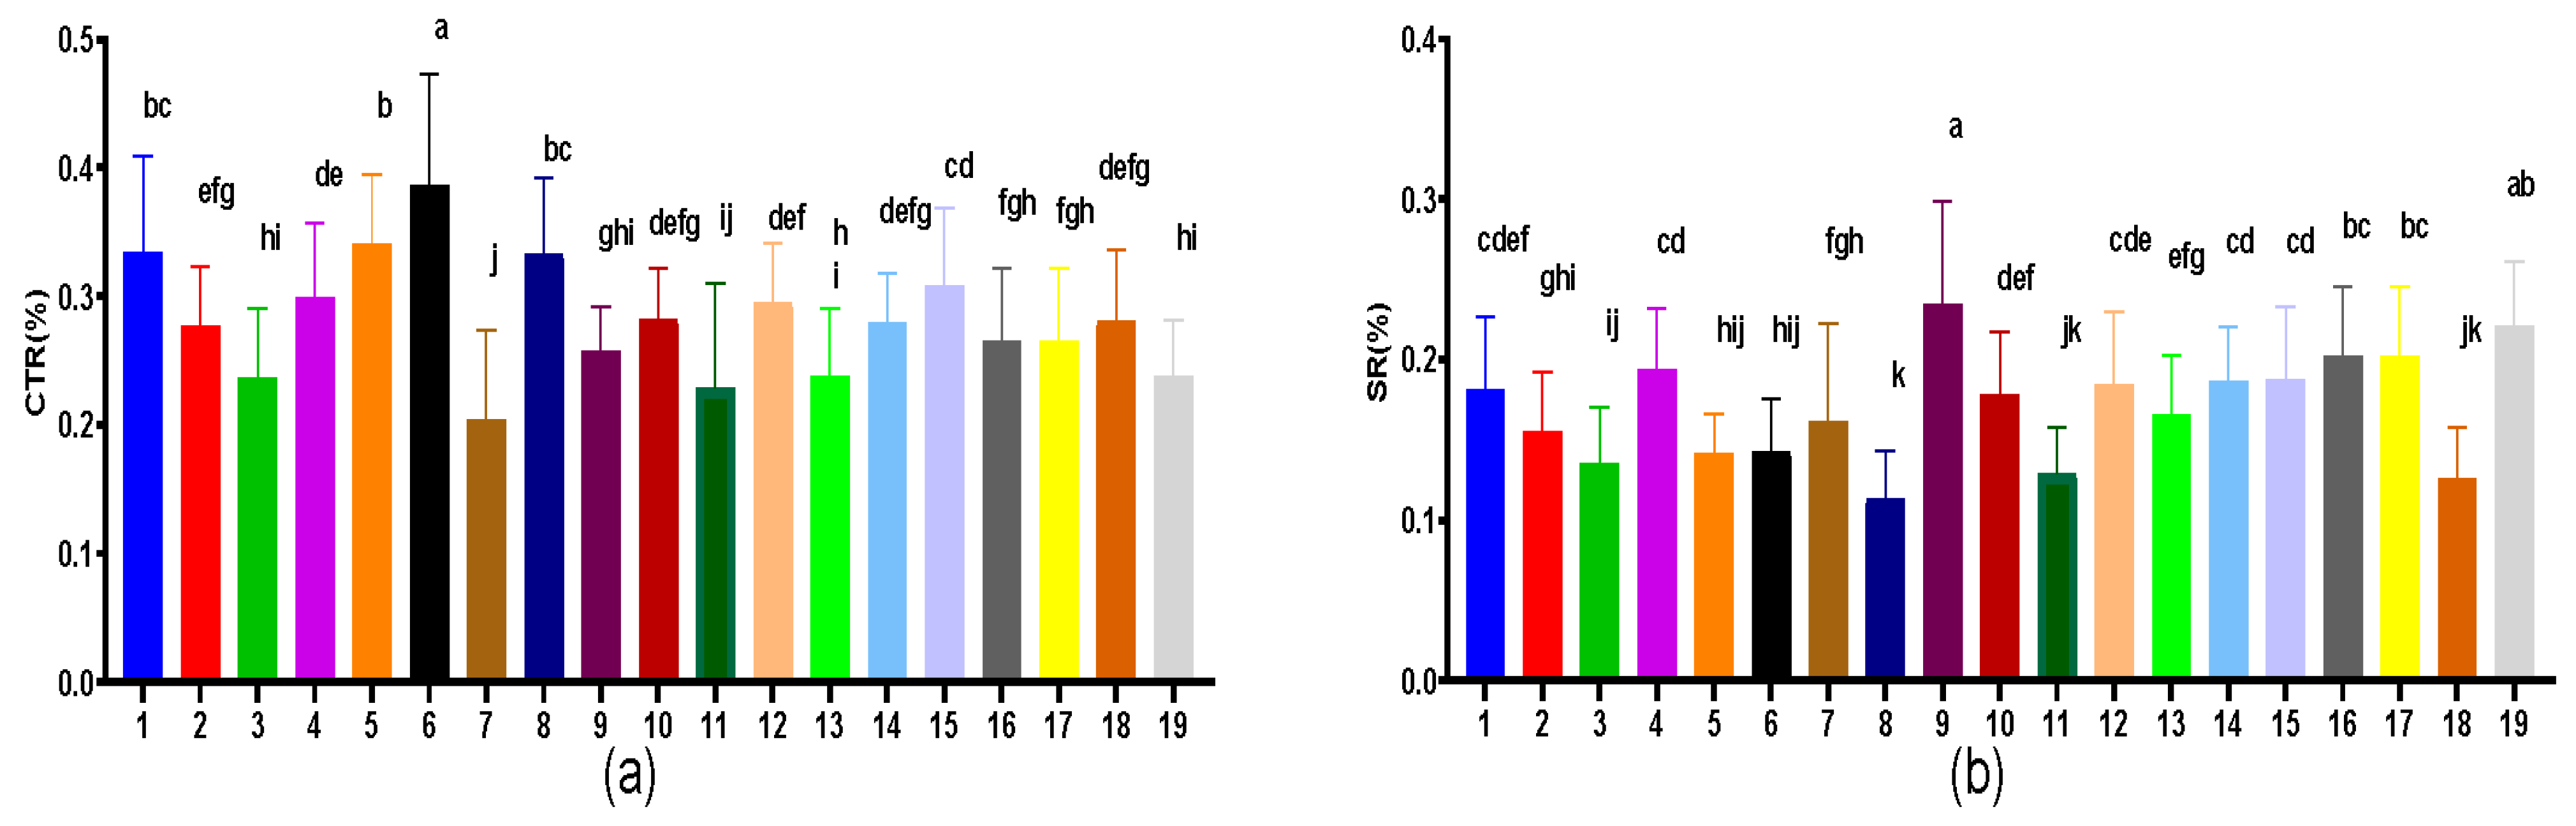
3.7. Leaf Vein, CTR and SR

Leaf veins (LV) are composed of vascular bundles distributed in the mesophyll tissue and play a role in conduction and physical support. The veins of different grape varieties have different compactness and arrangement. Some have thicker vascular bundles. Under the natural high-temperature conditions in Turpan, the stomata of the leaves of ‘Jumeigui’ were significantly the largest (diameter 34.52 μm) of the 19 grapevine varieties, followed by ‘Kyoho’ (diameter: 31.72 μm), ‘Cardinal’ (diameter: 26.94 μm) and other varieties (p < 0.05). ‘Shine Muscat’ significantly has the smallest veins (diameter: 9.69 μm) (p < 0.05). The CTR value is the ratio of palisade tissue thickness to leaf thickness, indicating the compactness of tissue structure. CTR values are commonly used as an important indicator to describe the heat tolerance of plants [19]. The CTR values of 19 grapevine varieties lie between 20.30% and 38.63%. The CTR of ‘Cardinal’ is significantly the highest value (38.63%) (p < 0.01) (Figure 4). ‘Bixiang Wuhe’ has the lowest CTR (20.30%). SR is the ratio of spongy tissue thickness to leaf thickness, indicating the porosity of the tissue structure. The smaller the SR, the stronger the heat resistance [20]. ‘Jintian Meigui’ has the significantly highest SR (23.43%). ‘Zhengyan Wuhe’ and ‘Qingfeng’ have the significantly lowest SR (11.30%).

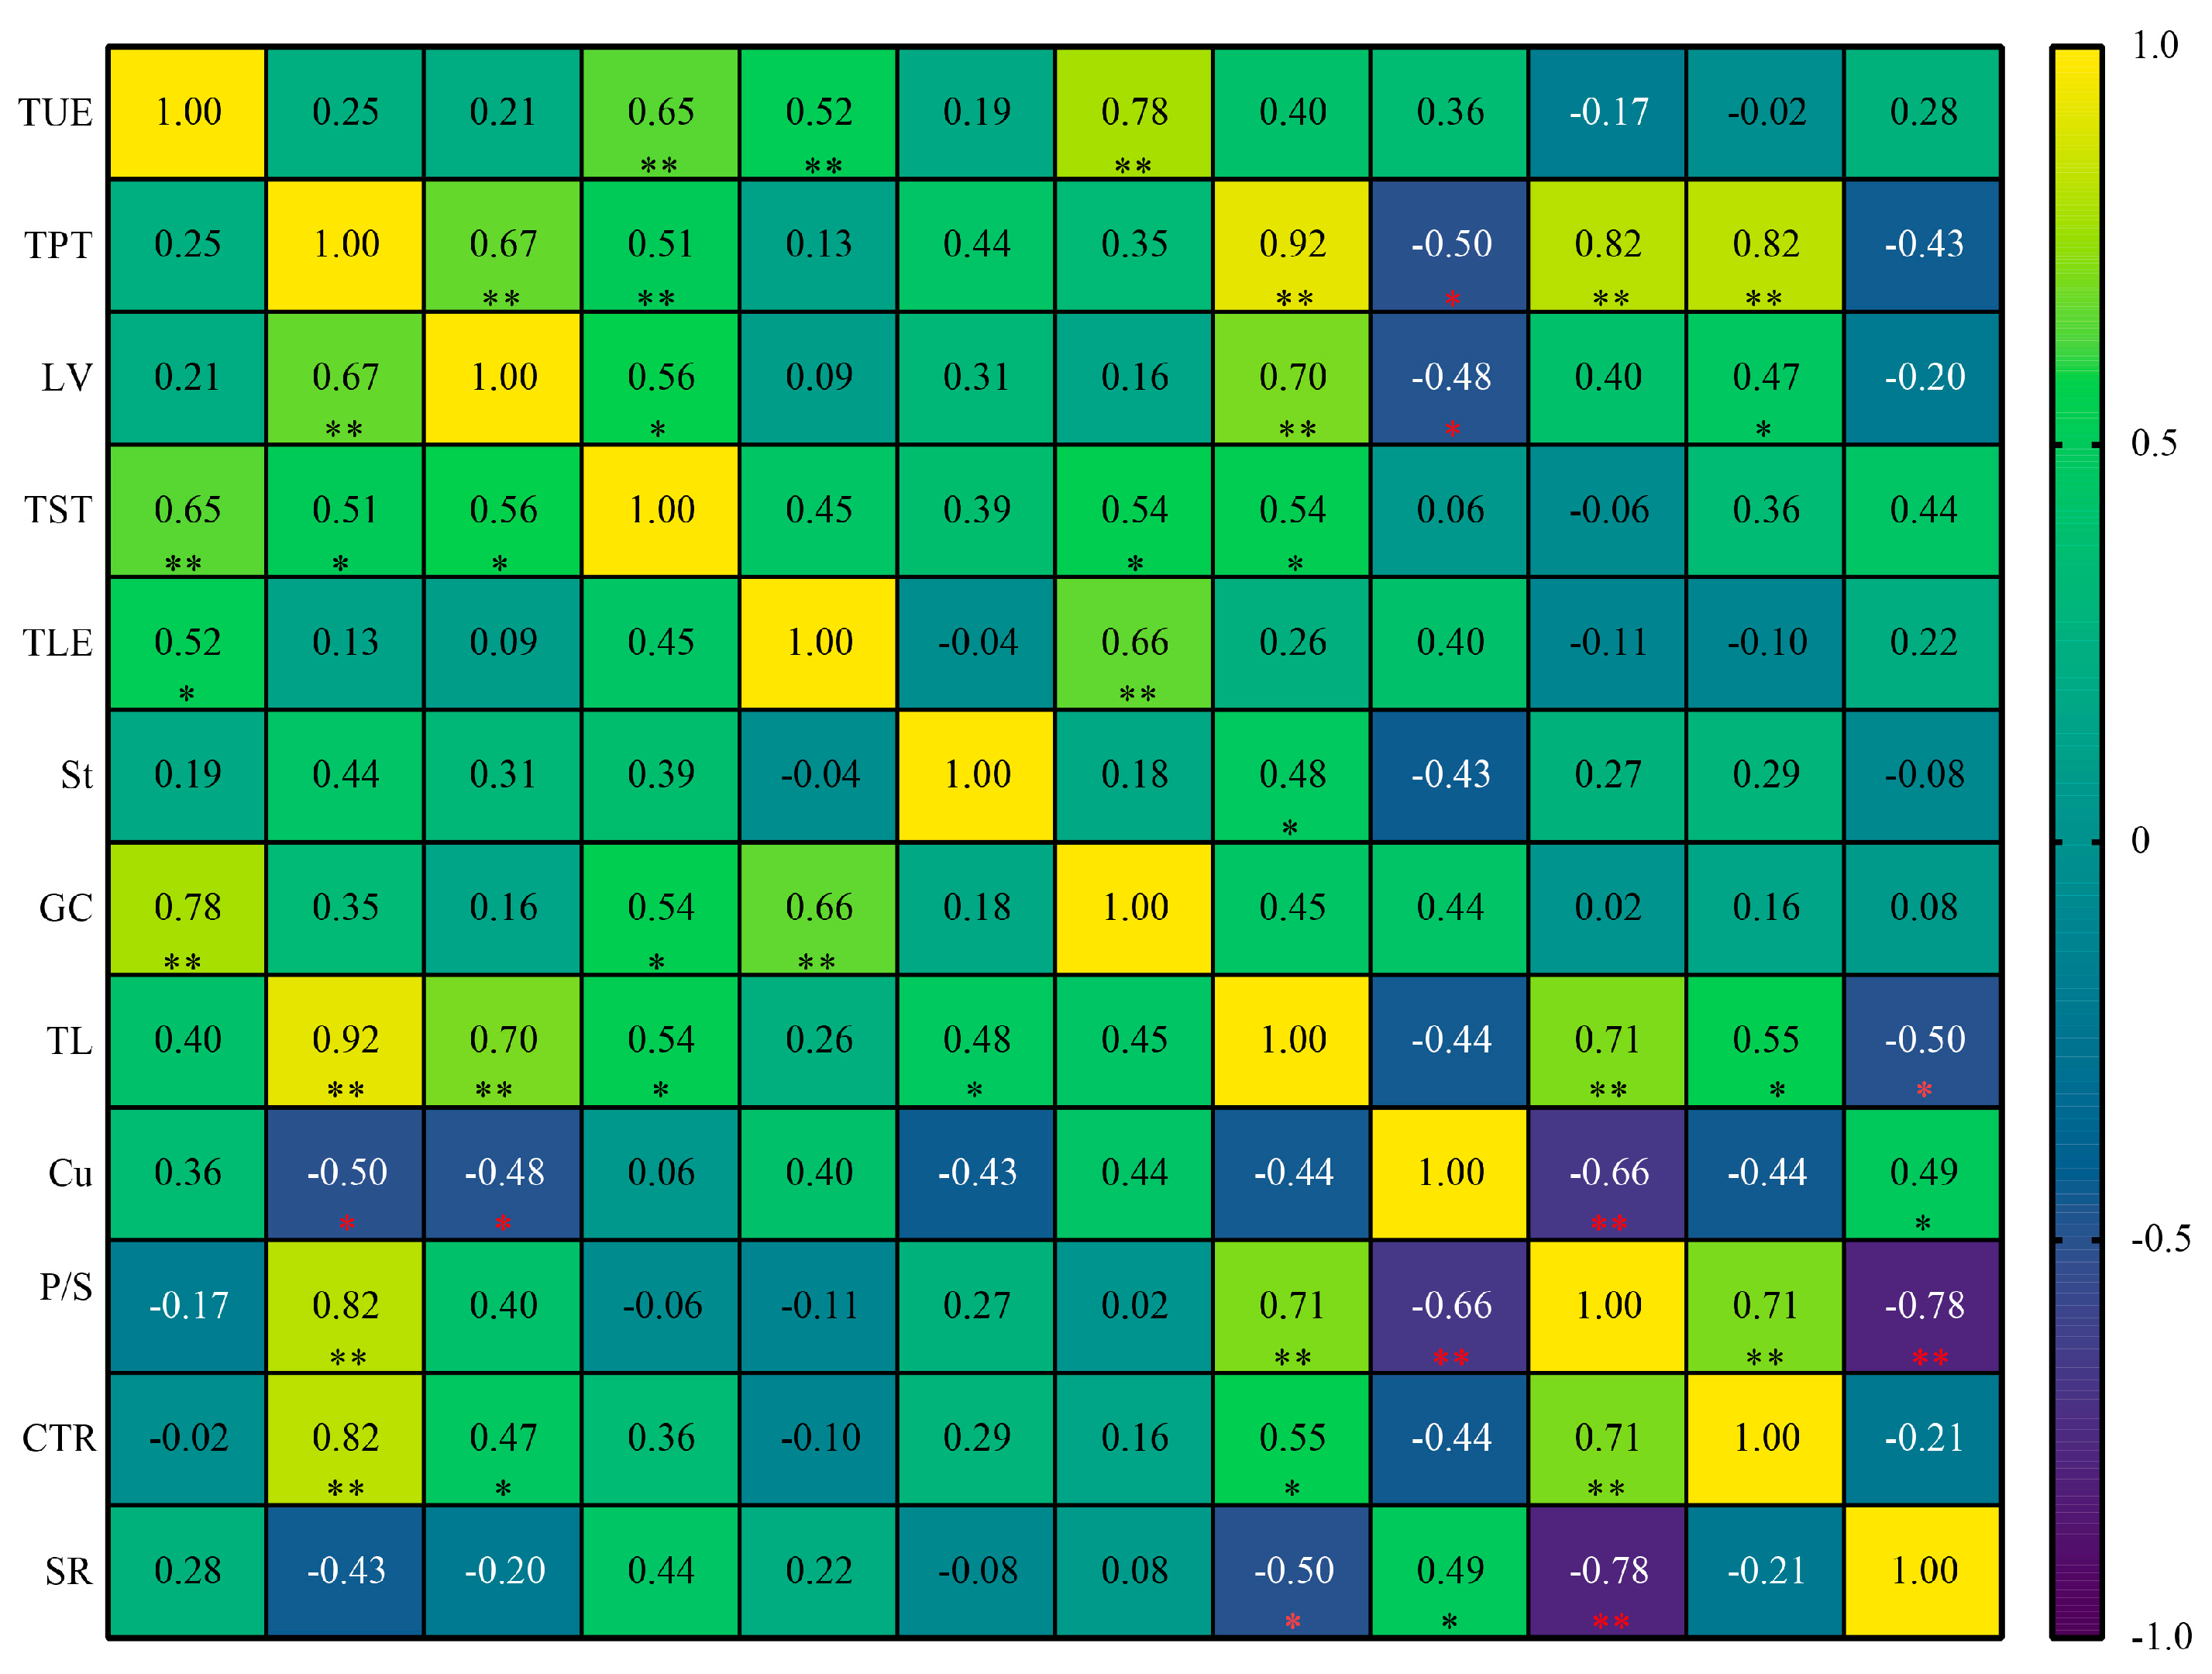
3.8. Correlation Analysis

Pearson correlation analysis of the 12 cell structure indicators was carried out on the leaves of different grapevine varieties. Results showed that there was a certain correlation between the indicators (Figure 5). The TUE was positively correlated with TST (0.650 **), TLE (0.524 **) and GC (0.781 **). The TPT was positively correlated with LV (0.670 **), TST (0.513 **) and TL (0.917 **), and negatively correlated with Cu (−0.499 *). LV was positively correlated with TST (0.565 **), TL (0.700 **) and CTR (0.472 *), and negatively correlated with Cu (−0.482 *). TST was positively correlated with GC (0.537 *) and TL (0.537 *). The TLE was also significantly positively correlated with GC (0.665 *), St and TL (0.481 *). The TL was significantly positively correlated with CTR (0.551 *). A high positive correlation was found with P/S (0.712 **) and a significantly negative correlation was found with Cu (−0.497 *), while SR was significantly positively correlated with Cu (0.495 *).

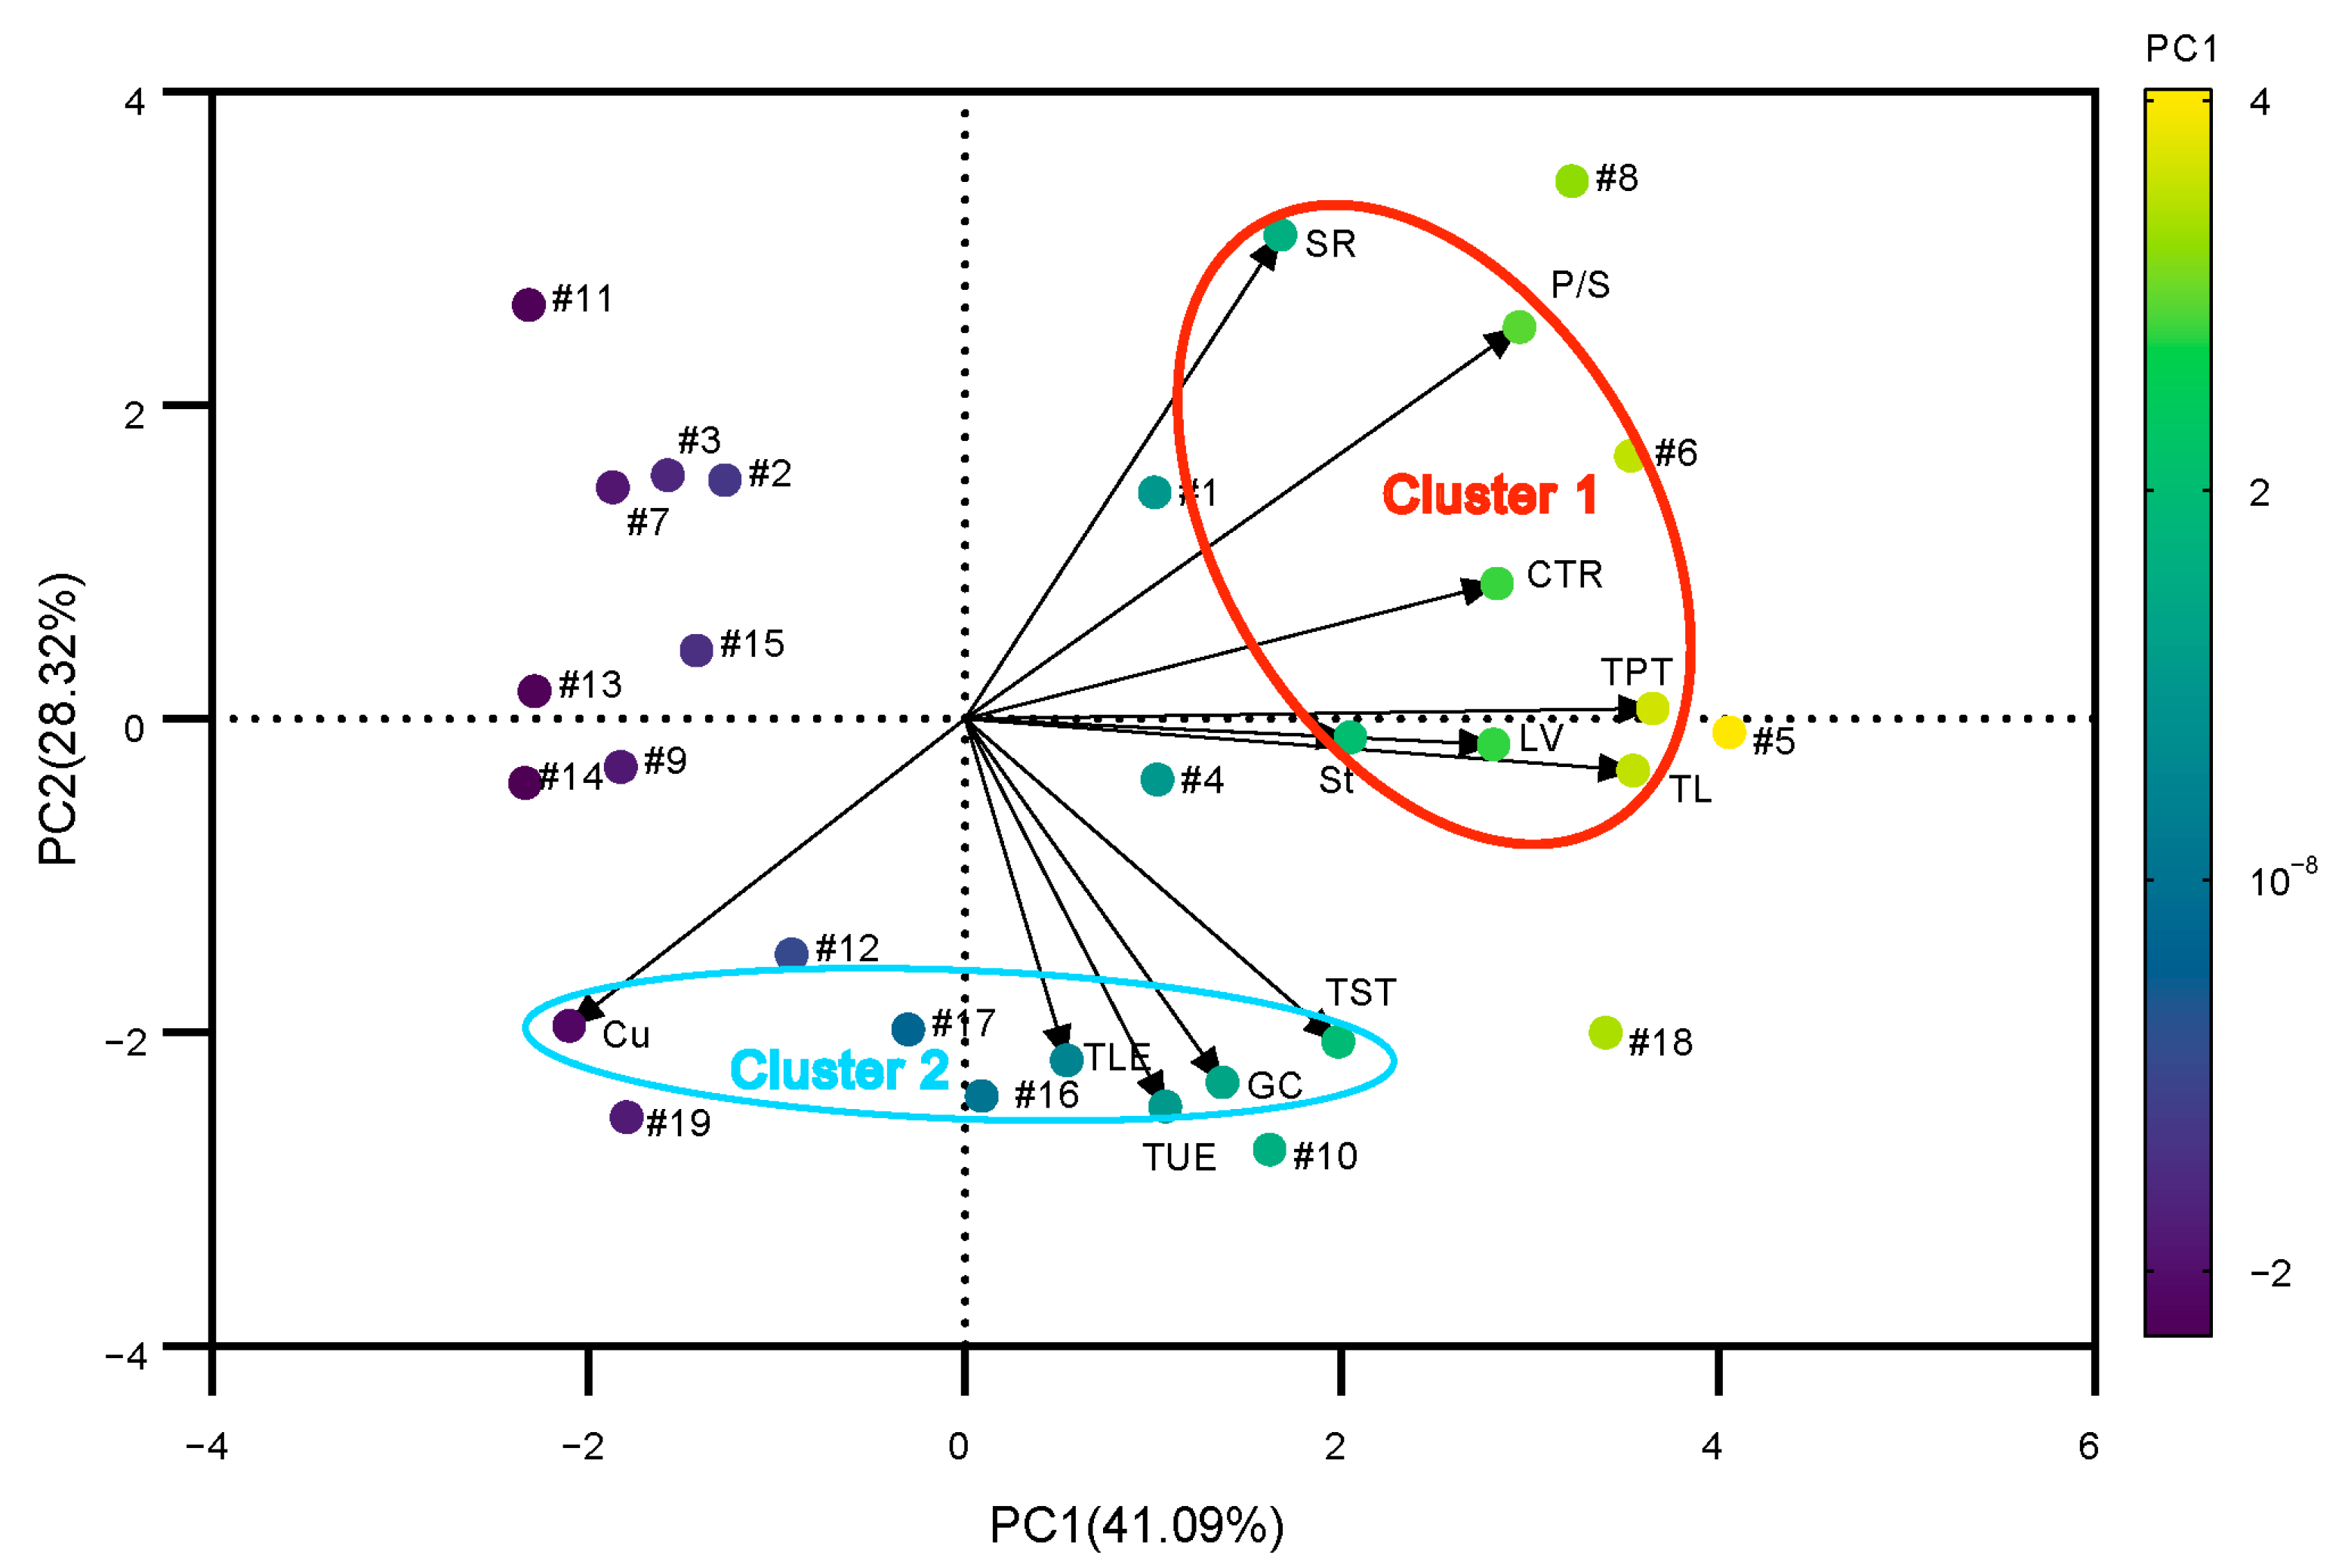
3.9. Principal Component Analysis and Heat Tolerance Evaluation

The principal component analysis (PCA) method can be used to obtain a clear picture of how different grapevine leaf cell structure components contribute to a particular trait [20,22]. The K value (>0.6) and p value (<0.01) obtained from KMO (Kaiser–Meyer–Olkin) and the Bartlett tests showed suitability of the principal component analysis [23]. Through a factor analysis of the 12 main indicators, the cumulative contribution rate of the two principal components is 69.41%, and the eigenvalue is greater than 1.0, which ultimately covers most of the information of each character indicator and can be used as the principal component of the comprehensive character indicator. The variance contribution rate of PC1 is 41.09%, which mainly represents the index information of TPT, TL, P/S, CTR, LV, etc., while the variance contribution rate of PC2 is 28.32%, which mainly represents the index information of the TUE, GC, TLE, TST, Cu, SR, etc. As shown in Figure 6, the selected 12 indicators only formed two clusters with good separation, most of which are located on PC1 (clusters 1 and 2), where cluster 1 is mainly located on PC1, including P/S, CTR, SR, TPT, TL, LV, St, etc., while cluster 2 is mainly located under PC2 and on PC1, including TST, TLE, GC, TUE, etc., while the cuticle is located under PC1 and PC2 (cluster 2).
Based on PCA, the results showed that the ‘Kyoho’, ‘Cardinal’, ‘Zaoxia Wuhe’, ‘Qingfeng’, ‘Centennial Seedless’, ‘Jumeigui’, ‘Golden Finger’ and ‘Zitian Wuhe’ have higher scores of PC1 in 19 grapevine varieties, while the ‘Centennial Seedless’, ‘Brilliant seedless’, ‘Zitian Wuhe’, ‘Zaoxia Wuhe’ and ‘Zuijinxiang’ have higher scores of PC2 in 19 grapevine varieties. The model was used to analyze and rank the comprehensive scores of leaf traits of 19 grapevine varieties. The comprehensive score of the principal components is ranked as follows (Table 3): ‘Zaoxia Wuhe’ > ‘Kyoho’ > ‘Centennial Seedless’ > ‘Cardinal’ > ‘Zitian Wuhe’ > ‘Jumeigui’ > ‘Zuijinxiang’ > ‘Qingfeng’ > ‘Summer Black’ > ‘Brilliant seedless’ > ‘Golden Finger’ > ‘Jintian Meigui’ > ‘Zhengmei’ > ‘Shine Muscat’ > ‘Xinyu’ > ‘Zhengyan Wuhe’ > ‘Flame Seedless’ > ‘Bixiang Wuhe’ > ‘Thompson Seedless’.
In addition, the F value was further classified by using the ordered sample optimal segmentation clustering method to obtain the optimal segmentation error function and classification results of all varieties for heat tolerance (Table 4). With the increase in classification numbers, the error function tended to be stabled, and it was categorized into three grades. The F test shows that the difference between each grade is very significant (p < 0.01). Therefore, a three-level segmentation model was found suitable and all 19 varieties were screened and evaluated according to this standard. It was observed that ‘Zaoxia Wuhe’, ‘Centennial Seedless’ and ‘Kyoho’ were defined as heat-tolerant leaf varieties, and ‘Golden Finger’, ‘Jintian Meigui’, ‘Zhengmei’, ‘Shine Muscat’, ‘Xinyu’, ‘Zhengyan Wuhe’, ‘Flame Seedless’, ‘Bixiang Wuhe’ and ‘Thompson Seedless’ were defined as heat-sensitive varieties.

4. Discussion

Temperature is one of the most important factors influencing the global grapevine distribution [15,24]. With the average temperatures continuously rising due to global warming, high temperature has become one of the most significant negative factors that inevitably limits grape yield and quality [3,25]. In order to adapt to the high-temperature environment, grapevine plants have also evolved their ecological habit of adapting to the high temperature stress by responding to high temperature stress in a timely manner. However, there are significant differences in heat tolerance among grapevine genotypes. Heat tolerance is a genetic characteristic of adaptation for plants to high temperature stress within a long-term period, and it is not only dependent on their internal physiological and biochemical structures, but also mainly on their genetic characteristics and morphological and organizational structures [4,19,26]. Wu et al., (2019) found that physiological and biochemical indexes are susceptible to environmental factors and show different changes [27,28]. Moreover, leaves are mostly composed of plastic tissues and organs which are established during plant evolution. Leaf shape and anatomy result from long-term evolution. Different adaptation types establish under different environmental conditions and are less relatively affected by transient environmental factors [29,30]. Therefore, an important evaluation index in the study of plant heat tolerance has often been used. Previous studies on the heat tolerance of the genera Vitis [19], Jujube [31], Rhododendron [20] and other crops, based on their leaf structures, suggested that the stability of the leaf cell structure is related to the heat tolerance of grapevines. There are many methods and indicators to evaluate plant heat tolerance based on cell structure, among which principal component analysis (PCA) can integrate its performance and simplify the selection process of various indicators, which is convenient for a comprehensive evaluation of the heat tolerance of various plants. The anatomical changes of leaves under high temperature and drought stress are relatively similar [32], so there are many applied studies on the evaluation of drought resistance and heat tolerance of fruit trees, flowers, vegetables, wheat, and other crops using the PCA method [33,34,35]. For instance, Guo et al. (2020) screened 10 relevant indexes as typical indicators for the comprehensive evaluation of drought resistance of 238 chestnut varieties (lines) after PCA analysis on the leaf anatomy of 238 varieties (lines) of Chinese chestnut [36]. Ding et al. (2022) evaluated the leaf cell structure of twenty-five grapevine rootstock cultivars based on PCA analysis and screened five rootstock varieties with strong drought resistance [22]. Qiu et al. (2022) conducted PCA analysis of seven rhododendron species based on leaf structure and found that the damage symptoms under artificial simulation of high temperature stress, and the conclusions reached by the evaluation and screening of field heat-tolerant varieties were ultimately consistent [20]. This previous approach revealed that it is convenient to use PCA analysis while screening and evaluating the heat tolerance of grapevines based on their cells. PCA was used in our study and the results showed that the ‘Kyoho’, ‘Cardinal’, ‘Zaoxia Wuhe’, ‘Qingfeng’, ‘Centennial Seedless’, ‘Jumeigui’, ‘Golden Finger’ and ‘Zitian Wuhe’ had higher scores of PC1 in 19 grapevine varieties. Therefore, the present study used PCA dimension reduction and cluster analysis to conduct a comprehensive evaluation on multiple indicators, allowing for the relative screening of heat-tolerant variety resources while also providing a reference for the evaluation and classification of grapevine heat tolerance.
The heat tolerance of plants is largely related to the cell structure of their leaves, especially the thickness of leaves, epidermal cells, palisade tissue, spongy tissue and cuticle, which have a significant impact on their heat tolerance [20,30]. This study found that under the high temperature (drought) stress conditions in the Turpan area, the cell and tissue structures of the leaves of 19 grapevine varieties had a certain degree of change, including mesophyll tissue disorder, cell gap expansion, mesophyll tissue water loss and atrophy and plasmolysis, which was consistent with the observation results of previous researchers in response to high temperature stress in Citrus [37], Vitis [26] and Azalea [38]. The research shows that the greater the proportion of palisade tissue and the P/S in the leaf structure, the more beneficial it is to enhance the utilization rate of water and light energy in the leaves. In our current study, some varieties with a higher heat tolerance showed a greater proportion of palisade tissue and P/S in the leaf, when compared with the sensitive varieties. It prevents the excessive evaporation of water in the leaves and alleviates the leaf damage caused by high temperature dehydration, which can reflect the heat tolerance of plants [20,39]. In this study, we found that the weak heat-tolerant varieties have relatively lower P/S and higher SR values in 19 grapevine varieties, such as ‘Bixiang Wuhe’, ‘Flame Seedless’, ‘Shine Muscat’ and Thompson Seedless’, while the P/S and TPT were also higher and SR was relatively lower in strong heat-tolerant varieties. At the same time, the thicker leaves are more beneficial in preventing water evaporation, and the epidermal cells have the function of regulating the morphological changes of the leaves [40]. This study found that the thickness of the leaves and epidermal cells of the varieties ‘Zaoxia Wuhe’, ‘Centennial Seedless’ and ‘Kyoho’ had strong and relatively higher heat tolerance, which is consistent with the field observation results.
Photosynthesis is extremely sensitive to high temperatures and often ceases before other cell activities are compromised. As an important channel for plant photosynthesis and gas exchange, the morphological and structural changes of leaves are the most obvious characteristics of grapevines affected by high temperature [41,42]. It not only determines the phenotypic structure and function of leaves, but also their adaptive processes in response to high temperature stress, which reflects the degree of high temperature damage and heat tolerance [12,43]. The methods of simulating high temperatures under controlled conditions were widely used in the past to evaluate the heat tolerance of grapevine, but in the field, the grapevines often encountered environmental effects which made the study more complicated, resulting in both the intensity and the timing of daily high temperatures in the summer to vary. However, the temperature drop at night will provide grapevines with opportunities to resume normal growth [18,44]. Studies related to field natural high temperature and indoor-simulated high temperature were also compared. Previous research showed that the PSII activity and heat shock protein changing trends in grapevine leaves were relatively similar, but the degree was different [23,45]. Therefore, in the current study, we chose to analyze the anatomical structure of grapevine leaves grown in the field under the natural high temperature stress in Turpan, combined with the comprehensive observation and comparison of the field phenotypes of the leaves, and the results have more reference significance for revealing the process of grapevine response to high temperature. At the same time, the leaf cell structure reflects the high temperature tolerance of 19 grapevine varieties, which is also essentially consistent with the situation under natural high temperature stress. This can be used as a reference for research on how to choose grapevine varieties and make them resistant to heat in the Turpan grape production industry. In addition, the heat tolerance of plants is controlled by a variety of heat tolerance genes, which are specifically reflected in the morphological and anatomical structures, tissue cells, photosynthetic organs and the physiological and biochemical aspects of plants. However, this study only observed and studied the relationship between the anatomical structure of leaves and heat tolerance, and further research is needed to provide a more scientific theoretical basis for revealing the process of grapevine response to high temperature.

5. Conclusions

Due to the challenge of accurately representing the heat tolerance of grapevines in their natural environment through indoor high-temperature climate simulations, this study employed a comprehensive comparative analysis based on the leaf tissue structure of different grapevine varieties. Additionally, field observations of leaf phenotypes were conducted under natural high-temperature conditions in Turpan. As a result, three grapevine varieties with high temperature tolerance and five grapevine varieties with high temperature sensitivity were identified. This research not only provides valuable insights for grape production in hot and arid regions, but also contributes to understanding the mechanisms of heat tolerance and aiding in grapevine variety selection.

Author Contributions

Conceptualization, J.W. and X.W.; methodology, H.Z. and Q.Z.; software, J.W., C.Z., V.Y. and F.Z.; validation, J.W., Q.Z., H.Z. and X.W.; investigation, R.A., Y.M. and X.L.; writing—review and editing: J.W., H.Z., V.Y., Q.Z. and X.W.; visualization, J.W. and V.Y.; supervision, Q.Z. and X.W.; funding acquisition, J.W. and X.W. All authors have read and agreed to the published version of the manuscript.

Funding

This research was funded by the Youth Science and Technology Backbone Innovation Ability Training Project of Xinjiang Academy of Agricultural Sciences (xjnkq-2021010), by the Xinjiang Uygur Autonomous Region Tianshan Talents Training Program—Young top-notch scientific and technological talents (2022TSYCJC0036), by the Xinjiang Uygur Autonomous Region Innovation Environment Construction Special Project (PT2314) and by the Xinjiang Uygur Autonomous Region Tianchi Talent—Special Expert Project (Xiping Wang, 2022).

Data Availability Statement

The data that support the findings of this study are available upon request from the corresponding author.

Acknowledgments

We would like to thank supportive and scientific staff in research lab and grape research farm of Xinjiang Academy of Agriculture Sciences.

Conflicts of Interest

The authors declare that they have no conflict of interest.

References

  1. Kim, J.S.; Jeon, B.W.; Kim, J. Signaling Peptides Regulating Abiotic Stress Responses in Plants. Front. Plant Sci. 2021, 12, 704490. [Google Scholar] [CrossRef]
  2. Upadhyay, A.; Upadhyay, A.K. Global transcriptome analysis of heat stress response of grape variety ‘Fantasy Seedless’ under different irrigation regimens. Vitis 2021, 143–151. [Google Scholar] [CrossRef]
  3. Zha, Q.; Xi, X.J.; He, Y.N.; Jiang, A.L. Comprehensive evaluation of heat resistance in 68 Vitis germplasm resources. Vitis 2018, 57, 75–81. [Google Scholar]
  4. Liu, M.; Fang, Y.L. Effects of heat stress on physiological indexes and ultrastructure of grapevines. Sci. Agric. Sin. 2020, 53, 1444–1458. [Google Scholar]
  5. Coneva, V.; Frank, M.H.; Balaguer, M.A.D.L.; Li, M.; Sozzani, R.; Chitwood, D.H. Genetic Architecture and Molecular Networks Underlying Leaf Thickness in Desert-Adapted Tomato Solanum pennellii. Plant Physiol. 2017, 175, 376–391. [Google Scholar] [CrossRef] [Green Version]
  6. Ogburn, R.M.; Edwards, E.J. Chapter 4—The Ecological Water-Use Strategies of Succulent Plants. In Advances in Botanical Research; Academic Press: Cambridge, MA, USA, 2010; Volume 55, pp. 179–225. [Google Scholar] [CrossRef]
  7. Poorter, H.; Niinemets, Ü.; Poorter, L.; Wright, I.J.; Villar, R. Causes and consequences of variation in leaf mass per area (LMA): A meta-analysis. New Phytol. 2009, 182, 565–588. [Google Scholar] [CrossRef]
  8. Wright, I.J.; Reich, P.B.; Westoby, M.; Ackerly, D.D.; Baruch, Z.; Bongers, F.; Cavender-Bares, J.; Chapin, T.; Cornelissen, J.H.C.; Diemer, M.; et al. The worldwide leaf economics spectrum. Nature 2004, 428, 821–827. [Google Scholar] [CrossRef]
  9. Smith, S.D.; Monson, R.K.; Anderson, J.E. Physiological Ecology of North American Desert Plants; Springer: Berlin/Heidelberg, Germany, 1997. [Google Scholar] [CrossRef]
  10. Szenteleki, K.; Ladanyi, M.; Gaal, M.; Zanathy, G.; Bisztray, G. Climatic risk factors of central hungarian grape growing regions. Appl. Ecol. Environ. Res. 2012, 10, 87–105. [Google Scholar] [CrossRef]
  11. Asproudi, A.; Petrozziello, M.; Cavalletto, S.; Guidoni, S. Grape aroma precursors in cv. Nebbiolo as affected by vine microclimate. Food Chem. 2016, 211, 947–956. [Google Scholar] [CrossRef]
  12. Zha, Q.; Xi, X.J.; He, Y.N.; Jiang, A.L. Research on high temperature stress response of different table grape cultivars. Acta Agric. Shanghai 2018, 34, 77–83. [Google Scholar] [CrossRef]
  13. Xu, H.; Song, B.; Gu, Z.F.; Bi, Y.F.; Wei, B. Advances in heat tolerance mechanisms of plants. Jiangsu J. Agr. Sci. 2020, 36, 43–50. [Google Scholar] [CrossRef]
  14. IPCC. Climate Change 2021: The Physical Science Basis; Contribution of Working Group I to the Sixth Assessment Report of the Intergovernmental Panel on Climate Change; Cambridge University Press: Cambridge, UK, 2021. [Google Scholar]
  15. Venios, X.; Korkas, E.; Nisiotou, A.; Banilas, G. Grapevine Responses to Heat Stress and Global Warming. Plants 2020, 9, 1754. [Google Scholar] [CrossRef]
  16. Zhang, H.; Zhu, J.; Gong, Z.; Zhu, J.-K. Abiotic stress responses in plants. Nat. Rev. Genet. 2021, 23, 104–119. [Google Scholar] [CrossRef]
  17. Champa, W.H.; Gill, M.; Mahajan, B.; Aror, N.; Bedi, S. Brassinosteroids improve quality of table grapes (Vitis vinifera L.) cv. flame seedless. Trop. Agric. Res. 2015, 26, 368. [Google Scholar] [CrossRef] [Green Version]
  18. Divi, U.K.; Rahman, T.; Krishna, P. Gene expression and functional analyses in brassinosteroid-mediated stress tolerance. Plant Biotechnol. J. 2015, 14, 419–432. [Google Scholar] [CrossRef]
  19. Zha, Q.; Xi, X.J.; He, Y.N.; Jiang, A.L. High temperature in field: Effect on the leaf tissue structure of grape varieties. Chin. Agric. Sci. Bull. 2019, 35, 74–77. [Google Scholar] [CrossRef]
  20. Qiu, Y.M.; Wang, W.; Hu, X.; Sun, M.M.; Ni, J.Z. Realationship between leaf anatomical structure and heat resistance of Rhododendron simsii. For. Enviromental Sci. 2021, 37, 69–81. [Google Scholar]
  21. Bueno, A.; Alfarhan, A.; Arand, K.; Burghardt, M.; Deininger, A.-C.; Hedrich, R.; Leide, J.; Seufert, P.; Staiger, S.; Riederer, M. Effects of temperature on the cuticular transpiration barrier of two desert plants with water-spender and water-saver strategies. J. Exp. Bot. 2019, 70, 1613–1625. [Google Scholar] [CrossRef] [Green Version]
  22. Ding, X.; Zhong, H.X.; Wang, X.P.; Song, J.Y.; Wu, J.Y.; Liu, G.H.; Zhang, F.C.; Hu, X.; Pan, M.Q.; Wu, X.Y. Observation on leaf anatomical structure and evaluation of drought resistance of grape rootstocks in Xinjiang. Mol. Plant Breed. 2022, 1–18. Available online: https://kns.cnki.net/kcms/detail/46.1068.S.20220429.1131.010.htm (accessed on 16 September 2022).
  23. Zha, Q.; Xi, X.; He, Y.; Yin, X.; Jiang, A. Effect of Short-Time High-Temperature Treatment on the Photosynthetic Performance of Different Heat-Tolerant Grapevine Cultivars. Photochem. Photobiol. 2021, 97, 763–769. [Google Scholar] [CrossRef]
  24. Cramer, G. Abiotic stress and plant responses from the whole vine to the genes. Aust. J. Grape Wine Res. 2010, 16, 86–93. [Google Scholar] [CrossRef]
  25. Jiao, S.-Z.; Guo, C.; Yao, W.-K.; Zhang, N.-B.; Zhang, J.-Y.; Xu, W.-R. An Amur grape VaHsfC1 is involved in multiple abiotic stresses. Sci. Hortic. 2021, 295, 110785. [Google Scholar] [CrossRef]
  26. Yan, T.T. Evaluation of heat tolerance in different grape cultivars and proteomic analysis of heat tolerance difference between cultivars. Master’s Thesis, South China Agricultural University, Guangzhou, China, 16 July 2020. [Google Scholar]
  27. Wu, J.Y.; Lian, W.J.; Zeng, X.Y.; Liu, Z.G.; Mao, L.; Liu, Y.X.; Jiang, J.F. Physiological response to high temperature and heat tolerance evaluation of different grape cultivars. Acta Bot. Boreali-Occident. Sin. 2019, 39, 1075–1084. Available online: https://www.proquest.com/docview/2653586083?pq-origsite=gscholar (accessed on 15 June 2023).
  28. Wu, J.Y.; Lian, W.J.; Liu, Z.G.; Zeng, X.Y.; Jiang, J.F.; Wei, Y.N. High temperature response of chlorophyll fluorescence parameter and heat tolerance evaluation of different grape cultivars. J. Northwest AF Univ. (Nat. Sci. Ed.) 2019, 47, 80–88. [Google Scholar]
  29. Li, M.H.; Cherubini, P.; Dobbertin, M.; Arend, M.; Xiao, W.F.; Rigling, A. Responses of leaf nitrogen and mobile carbohydrates in different Quercus species/provenances to moderate climate changes. Plant Biol. 2013, 15, 177–184. [Google Scholar] [CrossRef]
  30. Yang, J.; Chong, P.; Chen, G.; Xian, J.; Liu, Y.; Yue, Y. Shifting plant leaf anatomical strategic spectra of 286 plants in the eastern Qinghai-Tibet Plateau: Changing gears along 1050–3070 m. Ecol. Indic. 2023, 146, 109741. [Google Scholar] [CrossRef]
  31. Jin, J.; Yang, L.; Fan, D.; Liu, X.; Hao, Q. Comparative transcriptome analysis uncovers different heat stress responses in heat-resistant and heat-sensitive jujube cultivars. PLoS ONE 2020, 15, e0235763. [Google Scholar] [CrossRef]
  32. Wahid, A.; Gelani, S.; Ashraf, M.; Foolad, M.R. Heat tolerance in plants: An overview. Environ. Exp. Bot. 2007, 61, 199–223. [Google Scholar] [CrossRef]
  33. Jiang, J.F.; Zhang, Y.; Tian, Z.S.; Fan, X.C.; Liu, C.H. Observation on microstructure and ultrastucture of leaves in Vitis L. Acta Bot. Boreali-Occident. Sin. 2012, 32, 1365–1371. [Google Scholar]
  34. Fu, L.J.; Li, C.X.; Su, S.Y.; Li, Y.H.; Zhou, Y. Screening of cucumber germplasms in seedling stage and the construction of evaluation system for heat tolerance. Plant Physiol. J. 2020, 56, 1593–1604. [Google Scholar] [CrossRef]
  35. Li, M.; Su, H.; Li, Y.Y.; Li, J.P.; Li, J.C.; Zhu, Y.L.; Song, Y.H. Analysis of heat tolerance of wheat with different genotypes and screening of identification indexes in Huang-huai-hai region. Sci. Agric. Sin. 2021, 54, 3381–3393. [Google Scholar] [CrossRef]
  36. Guo, Y.; Zhang, S.H.; Li, Y.; Zhang, X.F.; Wang, G.P. Leaf morphology, anatomical structure and drought resistance evaluation of 238 Chinese chestnut cultivars (lines). Acta Hortic. Sin. 2020, 47, 1033–1046. [Google Scholar] [CrossRef]
  37. Huang, L.; Sun, Y.Q.; Hao, L.H.; Dang, C.H.; Zhu, Y.; Wang, H.X.; Cheng, D.J.; Zhang, Y.X.; Zheng, Y.P. Effects of high temperatures on leaf structures and physiological metabolism of north highbush blueberry. Acta Hortic. Sin. 2016, 43, 1044–1056. [Google Scholar] [CrossRef]
  38. Ma, W.; Liang, W.; Zhao, B. Effect of Relative Air Humidity and High Temperature on the Physiological and Anatomical Responses of Two Rhododendron Cultivars. Hortscience 2019, 54, 1115–1123. [Google Scholar] [CrossRef] [Green Version]
  39. Tian, M.; Yu, G.; He, N.; Hou, J. Leaf morphological and anatomical traits from tropical to temperate coniferous forests: Mechanisms and influencing factors. Sci. Rep. 2016, 6, 19703. [Google Scholar] [CrossRef] [Green Version]
  40. Kim, S.; Hwang, G.; Kim, S.; Thi, T.N.; Kim, H.; Jeong, J.; Kim, J.; Kim, J.; Choi, G.; Oh, E. The epidermis coordinates thermoresponsive growth through the phyB-PIF4-auxin pathway. Nat. Commun. 2020, 11, 1053. [Google Scholar] [CrossRef] [Green Version]
  41. Xie, Z.S.; Guo, X.J.; Cao, H.M. Effect of root restriction on vegetative growth and leaf anatomy of Kyoho grapevines cultivar. Afr. J. Agric. Res. 2013, 8, 1304–1309. [Google Scholar] [CrossRef] [Green Version]
  42. Wu, J.; Xu, G.; Lian, W.; Chen, Y.; Li, H.; Liu, Y.; Jiang, J.; Wen, J. Physiological response to high temperature and evaluation of heat tolerance of different grape cultivars. Agric. Biotechnol. 2022, 11, 47–54+85. [Google Scholar] [CrossRef]
  43. Liu, Y.; Jiang, J.; Fan, X.; Zhang, Y.; Wu, J.; Wang, L.; Liu, C. Identification of Heat Tolerance in Chinese Wildgrape Germplasm Resources. Horticulturae 2020, 6, 68. [Google Scholar] [CrossRef]
  44. Ahammed, G.J.; Li, X.; Liu, A.; Chen, S. Brassinosteroids in Plant Tolerance to Abiotic Stress. J. Plant Growth Regul. 2020, 39, 1451–1464. [Google Scholar] [CrossRef]
  45. Zha, Q.; Xi, X.; Jiang, A.; Tian, Y. High Temperature Affects Photosynthetic and Molecular Processes in Field-Cultivated Vitis vinifera L. × Vitis labrusca L. Photochem. Photobiol. 2016, 92, 446–454. [Google Scholar] [CrossRef]
Figure 1. The air temperature of the viticultural region of XAAS in July, 2022, in Turpan.
Horticulturae 09 00731 g001
Figure 2. The leaf phenotypes of different grapevine cultivars after exposure to high temperatures in the field. 1: ‘Golden Finger’; 2: ‘ZhengyanWuhe’; 3: ‘Flame Seedless’; 4: ‘Jumeigui’; 5: ‘Kyoho’; 6: ‘Cardinal’; 7: ‘BixiangWuhe’; 8: ‘Qingfeng’; 9: ‘JintianMeigui’; 10: ‘Centennial Seedless’; 11: ‘Thompson Seedless’; 12: ‘Summer Black’; 13: ‘Xinyu’; 14: ‘Shine Muscat’; 15: ‘Zhengmei’; 16: ‘ZitianWuhe’; 17: ‘Zuijinxiang’; 18: ‘ZaoxiaWuhe’; 19: ‘Brilliant Seedless’.
Horticulturae 09 00731 g002
Figure 3. Anatomical structures of grapevine leaves. Anatomical structure of grapevine leaves and response to heat stress. (ac): Different views of leaf cross-section; AS: abaxial surface; Ca: cambium; CU: cuticle; Ep: epidermis; LE: lower epidermis; LV: lateral vein; Me: mesophyll; MV: main vein; PC: parenchymal cells; PT: palisade tissue; ST: spongy tissue; VB: vascular bundles; Ve: vein; VS: ventral surface; Xy: xylem. Scale bars: (a,c), 50 μm; (b), 100 μm.
Horticulturae 09 00731 g003
Figure 4. The CTR and SR values of grapevine leaf anatomy. Different letters indicate means which are significantly different at p < 0.05. (a) The CTR values of 19 grapevines. (b) The SR values of 19 grapevines. X-axis represent grape genotypes. 1: ‘Golden Finger’; 2: ‘Zhengyan Wuhe’; 3: ‘Flame Seedless’; 4: ‘Jumeigui’; 5: ‘Kyoho’; 6: ‘Cardinal’; 7: ‘Bixiang Wuhe’; 8: ‘Qingfeng’; 9: ‘Jintian Meigui’; 10: ‘Centennial Seedless’; 11: ‘Thompson Seedless’; 12: ‘Summer Black’; 13: ‘Xinyu’; 14: ‘Shine Muscat’; 15: ‘Zhengmei’; 16: ‘Zitian Wuhe’; 17: ‘Zuijinxiang’; 18: ‘Zaoxia Wuhe’; 19: ‘Brilliant Seedless’.
Horticulturae 09 00731 g004
Figure 5. Correlation analysis diagram. ** shows highly significant correlation at 0.01 level and * indicates significant correlation at 0.05 level. CTR: Palisade tissue/leaf thickness ratio; Cu: cuticle; GC: guard cell; P/S: ratio of palisade tissue/spongy tissue; LV: leaf vein; SR: spongy tissue/thickness of leaf; St: stoma; TL: thickness of leaf; TLE: thickness of lower epidermis; TPT: thickness of palisade tissue; TST: thickness of spongy tissue; TUE: thickness of upper epidermis.
Horticulturae 09 00731 g005
Figure 6. Principal component analysis of leaf cell structure components. Vectors indicate the direction and strength of each variable to the overall distribution. Colored symbols correspond to leaf structure components. Cluster 1: CTR, P/S, TPS, TL, LV, St, SR, and cluster 2: Cu, TLE, GC, TST, TUE.
Horticulturae 09 00731 g006
Table 1. The tested grapevine cultivars and parental origins.
No.CultivarSpeciesParental Origin (Female/Male)
1Golden FingerV. vinifera × V. labruscaManicure Finger × Seneca
2Zhengyan WuheV. viniferaJingxiu × Bronx Seedless
3Flame SeedlessV. viniferaUnknown
4JumeiguiV. vinifera × V. labruscaShenyang Meigui × Kyoho
5KyohoV. vinifera × V. labruscaIshiharawase × Centennial
6CardinalV. viniferaFlame Tokay × Ribier
7Bixiang WuheV. viniferaZhengzhou Zaoyu × Pearlof Csaba
8QingfengV. vinifera × V. labruscaJingxiu × Bronx Seedless
9Jintian MeiguiV. viniferaMuscat Hamburg × Red Globe
10Centennial SeedlessV. viniferaGold × Q25-6
11Thompson SeedlessV. viniferaUnknown
12Summer BlackV. vinifera × V. labruscaKyoho × Thompson Seedless
13XinyuV. viniferaRed Globe × Rizamat
14Shine MuscatV. vinifera × V. labruscaAkitsu21 × Hakunan
15ZhengmeiV. viniferaManicure Finger × Zhengzhou Zaohong
16Zitian WuheV. viniferaNiunai × Autumroyal
17ZuijinxiangV. vinifera × V. labrusca7601 × Kyoho
18Zaoxia WuheV. vinifera × V. labruscaSummer Black Mutation
19Brilliant SeedlessV. viniferaRed Globe × Centennial Seedless
The numbers represent the name of grapevine varieties. 1: ‘Golden Finger’; 2: ‘Zhengyan Wuhe’; 3: ‘Flame Seedless’; 4: ‘Jumeigui’; 5: ‘Kyoho’; 6: ‘Cardinal’; 7: ‘Bixiang Wuhe’; 8: ‘Qingfeng’; 9: ‘Jintian Meigui’; 10: ‘Centennial Seedless’; 11: ‘Thompson Seedless’; 12: ‘Summer Black’; 13: ‘Xinyu’; 14: ‘Shine Muscat’; 15: ‘Zhengmei’; 16: ‘Zitian Wuhe’; 17: ‘Zuijinxiang’; 18: ‘Zaoxia Wuhe’; 19: ‘Brilliant Seedless’.
Table 2. Comparison of leaf anatomical structure indexes of different grapevine varieties.
No.TUE (μm)TPT (μm)LV (μm)TST (μm)TLE (μm)St (μm)GC (μm)Cu (μm)TL (μm)P/S
114.24 ± 2.28 gh36.8 ± 7.64 cd18.01 ± 3.62 e20.12 ± 4.69 de10.19 ± 3.18 h7.34 ± 3.25 a6.66 ± 2.46 defgh2.89 ± 1.51 g111.33 ± 7.69 e1.91 ± 0.53 d
213.4 ± 3.32 hi25.45 ± 2.84 f18.4 ± 3.49 e14.35 ± 3.33 f16.96 ± 3.4 bcde4.31 ± 1.74 fgh6.06 ± 2.41 fgh3.55 ± 1.03 defg93.34 ± 9.78 hi1.12 ± 0.31 h
39.88 ± 3.32 j24.07 ± 4.01 fg14.14 ± 3.27 fg14.03 ± 4.07 f17.91 ± 3.48 bcd4.08 ± 2.06 ghi6.79 ± 3.19 defgh3.47 ± 1.23 defg103.77 ± 14.34 f1.84 ± 0.53 de
417.12 ± 3.5 fg33.94 ± 6.14 d34.52 ± 7.92 a22.09 ± 4.25 bcd18.86 ± 4.81 bc5.57 ± 1.85 bcde6.68 ± 1.94 defgh3.15 ± 1.15 efg114.44 ± 10.5 e1.58 ± 0.37 defg
530.39 ± 37.78 cd54.63 ± 8.27 a31.72 ± 5.81 b22.7 ± 3.82 abc13.45 ± 3.22 fg5.47 ± 3.24 cdef7.86 ± 2.8 bcd2.94 ± 1.14 g161.29 ± 11.03 b2.47 ± 0.56 c
611.32 ± 3.52 hij57.66 ± 12 a26.94 ± 5.77 c21.07 ± 4.1 bcd17.86 ± 3.37 bcd4.53 ± 2.35 efgh6.47 ± 2.98 defgh2.87 ± 1.26 g149.98 ± 13.12 c2.85 ± 0.95 b
716.37 ± 6.65 fg19.36 ± 3.94 h23.04 ± 4.22 d15.29 ± 3.85 f13.6 ± 3.34 fg4.8 ± 2.5 defgh5.5 ± 2.84 h3.05 ± 1.02 fg101.03 ± 21.9 fg1.35 ± 0.47 gh
812.33 ± 3.74 hij47.92 ± 7.94 b23.26 ± 5.78 d16.26 ± 4.12 f16.3 ± 3.72 cde5.98 ± 2.12 bc5.66 ± 2.32 gh1.34 ± 1.34 h144.93 ± 13.14 cd3.14 ± 0.91 a
922.08 ± 5.28 d23.6 ± 2.18 fg15.11 ± 2.86 f21.38 ± 5.43 bcd15.68 ± 5.04 def4.89 ± 1.6 cdefgh5.37 ± 1.82 h3.02 ± 1.79 fg92.89 ± 12.84 hi1.17 ± 0.3 h
1030.19 ± 9.08 a39.13 ± 5.11 c23.66 ± 5.52 d24.65 ± 5.03 a21.96 ± 5.61 a5.41 ± 1.5 cdef8.9 ± 2.22 ab3.96 ± 1.33 cd139.34 ± 11.73 d1.65 ± 0.38 defg
1110.55 ± 4.39 ij20.87 ± 7.18 gh12.08 ± 4.96 gh11.77 ± 2.38 g12.52 ± 3.49 g4.71 ± 1.38 defgh5.72 ± 2.08 gh3.8 ± 1.15 de92.2 ± 9.18 hi1.85 ± 0.84 de
1225.6 ± 7.27 bc29.47 ± 4.13 e18.92 ± 4.47 e18.41 ± 4.15 e19.22 ± 5.34 b3.14 ± 1.25 i8.39 ± 2.71 abc4.67 ± 0.99 bc100.61 ± 6.98 fg1.67 ± 0.4 def
1321.1 ± 5.69 de22.51 ± 4.73 fgh11.37 ± 2.62 hi15.51 ± 2.94 f16.44 ± 3.77 cde4.57 ± 1.32 efgh6.27 ± 1.88 efgh4.6 ± 1.37 bc95.54 ± 11.63 gh1.5 ± 0.39 fg
1419.04 ± 4.69 ef24.43 ± 2.39 f9.69 ± 2.15 i16.33 ± 2.91 f17.66 ± 4.39 bcd3.95 ± 0.82 hi7.1 ± 3.01 cdefg4.96 ± 1.11 ab87.87 ± 7.48 ij1.54 ± 0.31 efg
1517.37 ± 5.42 f25.45 ± 2.58 f12.39 ± 2.98 gh15.39 ± 2.3 f14.8 ± 3.49 efg5.22 ± 2.03 cdefg7.36 ± 2.24 cdef4.03 ± 1.42 cd85 ± 14.73 j1.68 ± 0.25 def
1626.84 ± 8.01 b34.58 ± 5.02 d15.47 ± 2.81 f20.57 ± 3.79 cd24.31 ± 8.19 a5.8 ± 1.39 bcd8.39 ± 2.47 abc4.15 ± 1.37 cd112.96 ± 17.16 e1.74 ± 0.42 def
1721.92 ± 6.62 de29.32 ± 4.48 e20.2 ± 3.75 e22.15 ± 3.2 bcd22.38 ± 4.65 a5.64 ± 1.55 bcde7.62 ± 1.68 bcde4.15 ± 1.37 cd112.96 ± 17.16 e1.35 ± 0.26 gh
1832.57 ± 5.46 a47.05 ± 8.92 b23 ± 3.59 d21.08 ± 4.9 bcd22.77 ± 4.34 a6.64 ± 1.35 ab9.51 ± 2.12 a3.74 ± 1.57 def168.26 ± 13.56 a2.35 ± 0.75 c
1922.54 ± 5.44 d24.71 ± 3.94 f18.18 ± 2.79 e22.93 ± 4.46 ab19.46 ± 4.37 b4.65 ± 1.63 defgh7.42 ± 2 cdef5.5 ± 1.1 a104.71 ± 7.92 f1.89 ± 0.58 d
The average value of TUE, TPT, LV, TST, TLE, St, GC, Cu, TL and P/S are means ± S.E. Different lowercase letters in each column indicate significant difference at p < 0.05. TUE: thickness of upper epidermis; TPT: thickness of palisade tissue; LV: leaf vein; TST: thickness of spongy tissue; TLE: thickness of lower epidermis; St: stoma; GC: guard cell; Cu: cuticle; TL: thickness of leaves; P/S: palisade tissue/spongy tissue. 1: ‘Golden Finger’; 2: ‘Zhengyan Wuhe’; 3: ‘Flame Seedless’; 4: ‘Jumeigui’; 5: ‘Kyoho’; 6: ‘Cardinal’; 7: ‘Bixiang Wuhe’; 8: ‘Qingfeng’; 9: ‘Jintian Meigui’; 10: ‘Centennial Seedless’; 11: ‘Thompson Seedless’; 12: ‘Summer Black’; 13: ‘Xinyu’; 14: ‘Shine Muscat’; 15: ‘Zhengmei’; 16: ‘Zitian Wuhe’; 17: ‘Zuijinxiang’; 18: ‘Zaoxia Wuhe’; 19: ‘Brilliant Seedless’.
Table 3. Principal component scores of cultivars and rank.
No.CultivarsF1Rank1F2Rank2FRankHeat Tolerance
1Golden Finger0.437017−0.7628213−0.05211Medium
2Zhengyan Wuhe−0.5648811−0.8244815−0.674716Weak
3Flame Seedless−0.695313−0.840916−0.759217Weak
4Jumeigui0.4685260.1956580.35956Medium
5Kyoho1.8175310.07831101.11592Strong
6Cardinal1.619362−0.89711170.59814Medium
7Bixiang Wuhe−0.829515−0.821214−0.831118Weak
8Qingfeng1.474154−1.85897190.11748Medium
9Jintian Meigui−0.82192140.138289−0.433512Weak
10Centennial Seedless0.6955551.5155811.03583Strong
11Thompson Seedless−1.0165617−1.4525518−1.201419Weak
12Summer Black−0.42692100.7839760.06669Medium
13Xinyu−1.0353918−0.0843511−0.65215Weak
14Shine Muscat−1.05973190.227467−0.538714Weak
15Zhengmei−0.6507112−0.2302712−0.482413Weak
16Zitian Wuhe0.0390381.2919530.55265Medium
17Zuijinxiang−0.1327391.0587550.35477Medium
18Zaoxia Wuhe1.5148131.1242941.3641Strong
19Brilliant Seedless−0.83232161.358420.060310Medium
The F (factor) value is represented as the comprehensive principal component factor score, and rank is the classification of heat tolerance of different grapevine varieties by SPSS 19.0. The F1 (factor 1) value is represented as principal component factor 1, and R1 (rank1) is represented as the rank of F1 value in 19 grapevines. The F2 (factor 2) value is represented as the principal component factor 2, and R2 (rank2) is represented as the rank of F2 value in 19 grapevines.
Table 4. Classification results of F value under different cluster numbers.
Cluster NumberError FunctionOptimal Segmentation Results
20.4129 1–11, 12–19
30.1355 1–3, 4–11, 12–19
40.0823 1–3, 4–7, 8–11, 12–19
50.0381 1–3, 4–7, 8–11, 12–18, 19
60.0225 1–3, 4–7, 8–11, 12–14, 15–18, 19
70.0141 1, 2–3, 4–7, 8–11, 12–14, 15–18, 19
The column number of “optimal segmentation results” indicates the rank of 19 cultivars, the same as Table 3.
Disclaimer/Publisher’s Note: The statements, opinions and data contained in all publications are solely those of the individual author(s) and contributor(s) and not of MDPI and/or the editor(s). MDPI and/or the editor(s) disclaim responsibility for any injury to people or property resulting from any ideas, methods, instructions or products referred to in the content.

