Article

Combined Study of Transcriptome and Metabolome Reveals Involvement of Metabolites and Candidate Genes in Flavonoid Biosynthesis in Prunus avium L.

Pomology Institute, Shanxi Agricultural University, Taiyuan 030031, China
*
Author to whom correspondence should be addressed.
Horticulturae 2023, 9(4), 463; https://doi.org/10.3390/horticulturae9040463
Submission received: 1 December 2022 / Revised: 4 March 2023 / Accepted: 29 March 2023 / Published: 6 April 2023
(This article belongs to the Special Issue Horticulture Plants Stress Physiology)

Abstract

:
Sweet cherry (Prunus avium L.) is a popular fruit tree grown for its juicy fruit and pleasing appearance. The fruit pf the sweet cherry contains active antioxidants and other chemical compounds essential for human health. For this study, we performed the transcriptomics and metabolomics analysis using young Green Peel (GP) and mature Red Peel (RP) from sweet cherries to understand the underlying genetic mechanism regulating fruit development and ripening. Using high-throughput RNA sequencing and ultra-performance liquid chromatography, with quadrupole time-of-flight tandem mass spectrometry, respectively, metabolic and transcript profiling was obtained. Relative to GP, there were equal quantities of pronouncedly varied metabolites in RP (n = 3564). Differentially expressed genes (DEGs, n = 3564), containing 45 transcription factor (TF) families, were recorded in RP. Meanwhile, 182 differentially expressed TF (DETF) members of 37 TF families, were displayed in abundance in RP compared to GP sweet cherries. The largest quantities of DETFs were members of the ERF (25) and basic helix–loop–helix (bHLH) (19) families, followed by the MYB (18), WRKY (18), and C2H2 (12) families. Interestingly, most ERF genes were down-regulated, whereas CCCH genes were mainly up-regulated in RP. Other DETFs exhibited significant variations. In addition, RT-QPCR results and metabolomics data together with transcriptomic data revealed that the abundance of catechin, epicatechin, rhoifolin, myricetin, keracyanin, and the other six glycosyltransferase genes was highly increased in RP when compared to GP sweet cherries. The relatively higher expression of DETFs, metabolite, and flavonoid biosynthesis in RP sweet cherries suggests the accumulation of distinct metabolites that cause red coloring during fruit development and ripening. Thus, the metabolomics and transcriptomic analysis of the current study are powerful tools for providing more valuable information for the metabolic engineering of flavonoids biosynthesis in sweet cherries. They are also helpful in understanding the relationship between genotype and phenotype.

1. Introduction

Sweet cherry (Prunus avium L.) is a non-climacteric, economically significant horticultural crop that is produced all over the world for its flesh fruit. The sweet cheery reproductive phase is short as it only takes two months from bloom to mature fruit [1]. Apart from its attractive color, the fruit of the sweet cherry is rich in antioxidants, vitamins, and minerals, and the tree is also suitable for cultivation in temperate regions. Sweet cherry fruits can have different colors, such as yellow, dark red, or blush [2]. Sweet cherry fruit goes through multiple developmental phases, from flower bud to fruit set. Following that, the ripening process begins, defining the quality of the final fruit. Various metabolic and genetic pathways control the fruit’s development and ripening process. Some of the genetic and metabolic regulators of fruit development and ripening have been found in several other horticultural crops [3,4,5,6,7,8]. Anthocyanins is vital in the ripening process as it is involved in skin color pigmentation [9,10].
Flavonoids, the key secondary metabolites of plants, are sub-classed into anthocyanins, flavones, and flavanols [11]. Flavonoids have been found in numerous colored fruits and flowers and are involved in multiple plant functions. For example, they prevent plants from dormancy, ultraviolet light and phytopathogens-caused injury and modulate responses to other environmental stresses [12]. In humans, some reports highlighted flavonoid suppression in patients with chronic and cardiovascular diseases [13]. Furthermore, flavonoids and anthocyanins are the primary determinants of color in fruits and flowers. Six widely accepted anthocyanins (cyanidin, delphinidin, petunidin, pelargonin, peonidin, and malvidin) exist in plants. The peonidin is synthesized by the methylation of cyanidin, malvidin, and delphinium to variousdegrees [14]. In Arabidopsis thaliana, the structural genes in the biosynthetic pathway of anthocyanins can be classified as either “early” or “late” types [15]. Early biosynthetic genes, such as CHS and CHI, are mediated in a coordinated manner and encode enzymes that play a prominent role in the initial process of biosynthesis [16]. Late biosynthetic genes, such as DFR and ANS, participate in the late biosynthesis process [17].
In sweet cherry fruit, the role of flavonoids has previously been reported by study [18]. The study presented the involvement of flavonoids in postharvest sweet cherry fruits in response to UV-C light [18]. In PavMADS7-silenced plants, the level of anthocyanins decreased significantly, affecting fruit skin’s reddening [19]. Several transcription factors (TFs) have been investigated for their role in the development and ripening of sweet cherry fruit. For instance, MIKC-type MADS-box TF PavAGL15 regulates the size of sweet cherryfruits. Virus-induced gene silencing (VIGS) of PavAGL15 significantly increased the size of sweet cherry fruits [20]. The PavFUL gene, when overexpressed, resulted in the formation of multi-silique and double fruits [21]. However, there is no body of research which relates the role of flavonoids and key TFs in regulating fruit development and ripening in sweet cherries.
The interpretation of metabolomics data offers an efficient method that may be used for the functional characterization of genes [22,23]. Metabolomics data can provide a plethora of information on the biochemical status of tissues. Metabolomics studies can also be used as a technical tool for association analysis. This can be used in conjunction with other data to examine the role of particular genes in a metabolic pathway of interest and to facilitate gene mining [24]. Systems biology research is now unable to function without the latest advancements and applications of high-throughput sequencing, high-resolution mass spectrometry, and information processing technologies [25,26]. Through the use of correlation and clustering analyses, transcript and metabolite datasets have been combined and can be visualized as connection networks between genes and metabolites [27]. These networks can show the response mechanism of rice to high nighttime temperatures [28], the regulation mechanism of delphinidin in flower color in grape hyacinths [29], the mechanism of potato pigmentation [30], the mechanism of blue flower formation in waterlilies [31], and catechin production in albino tea. The merging of transcriptomics and metabolomics offers substantial benefits for uncovering the biosynthetic mechanisms of important metabolic pathways [32,33,34]. The combined study of transcriptomics and metabolomics data has not yet been used to investigate the biosynthesis of phenolic chemicals.
In this study, we used a novel sweet cherry cultivar called “Hongmanao” which was developed by the Shanxi Academy of Agriculture Sciences’ Institute of Pomology. For analysis, samples of the fruits’ young green peel (GP) and mature red peel (RP) were taken. Young “GP” and mature “RP” sweet cherry fruit were used for the omics data analysis of extensively targeted metabolome and transcriptome. It was discovered that several significant TFs, including MYB, WRKY, and bHLH, control the biosynthesis of flavonoids. These findings will be beneficial for producing sweet and healthy plants, especially in the area of fruit quality.

2. Materials and Methods

2.1. Plant Materials

Sweet cherry trees (fifteen years old) were selected for this experiment. The orchard is located at the Fruit Research Institute of Shanxi Agricultural University (37°23′42″ N, 112°32′42″ E), Taigu District, Jinzhong City, Shanxi Province, China. The spacing between trees and rows was 2.5 m × 4.0 m. The same methods of cultivation and care were used on all the trees. Fruit samples were taken on 21 May 2021 (green peel), and 31 May 2021 (red peel) (RP). Eighteen tagged fruits were randomly selected, and three biological duplicates were selected at each stage. The fruit samples were cut into cross sections during sampling, frozen in liquid nitrogen, and kept at −80 °C for further studies. For the metabolome and transcriptome investigations, two developmental stages of the sweet cherry, C1 GP and C2 RP, were chosen and examined.

2.2. RNA Extraction, Library Preparation

Following the manufacturer’s instructions, total RNA was extracted and purified using the TRIzol reagent (Invitrogen, Carlsbad, CA, USA). Using the NanoDrop ND-1000, each sample’s RNA concentration and purity were measured (NanoDrop, Wilmington, DE, USA). The Bioanalyzer 2100 (Agilent, Santa Clara, CA, USA) used a RIN score of >7.0 to determine the integrity of the RNA, and denaturing agarose gel electrophoresis was used to corroborate the results. Using Dynabeads Oligo (dT)25-61005 (Thermo Fisher, Waltham, CA, USA), poly (A) RNA waspurified twice from 1 g of total RNA. Then, under 94 °C for 5–7 min, the poly(A) RNA was fragmented into tiny bits using a magnesium RNA fragmentation module (NEB, cat. e6150, San Francisco, CA, USA). Following the reverse transcription of the cleaved RNA fragments to produce the cDNA, E. coli DNA polymerase I (NEB, cat.m0209, USA), RNase H (NEB, cat.m0297, USA), and dUTP Solution (Thermo Fisher, cat. R0133, USA) were used to synthesize U-labeled second-stranded DNAs. The blunt ends of each strand were then given an A-base to help them ligate to the indexed adapters. Each adaptor had a T-base overhang that was used to ligate it to the DNA fragments with an A tail. The fragments were ligated to single- or dual-index adapters, and AMPureXP beads were used for size selection. After the heat-labile UDG enzyme (NEB, cat.m0280, USA) treatment of the U-labeled second-stranded DNAs, the ligated products were amplified with PCR underthe following conditions: initial denaturation at 95 °C for 3 min; 8 cycles of denaturation at 98 °C for 15 s, annealing at 60 °C for 15 s, and extension at 72 °C for 30 s; and then final ex-tension at 72 °C for 5 min. The resultant cDNA collection had an average insert size of 30,050 bp. Finally, using an illumine NovaseqTM 6000 (LC-Bio Technology Co., Ltd., Hangzhou, China), we carried out 2150bp paired-end sequencing (PE150) in accordance with the vendor’s suggested procedure. Following RNA extraction, we used the Agilent 2100 device (Agilent Technologies, Beijing, China), Qubit v. 2.0 (Thermo Fisher Scientific), and the NanoDrop device (Thermo Fisher Scientific, Shanghai, China) to assess RNA purity, concentration, and integrity for the ensuing transcriptome sequencing. Using Qubit v. 2.0 and Agilent 2100 equipment, we evaluated and precisely measured the library concentration and insert size after library formation. Quantitative real-time PCR was used to check the quality of the library (qRT-PCR). With the help of a No-vaseq6000, high-throughput sequencing was carried out (Illumina, Beijing, China).

2.3. Bioinformatics Analysis of RNA-seq

Reads with adapter contamination, low quality bases, and indeterminate bases with default parameters were removed using the Fastp program (https://github.com/OpenGene/fastp accessed on 19 November 2021). Then, using fastp, the sequence quality was also confirmed. We utilized HISAT2 to map reads to the reference genome of Homo sapiens GRCh38 (https://ccb.jhu.edu/software/hisat2 accessed on 19 November 2021) (Prunus avium L.). The mapped readings of each sample were put together using StringTie (https://ccb.jhu.edu/software/stringtie accesse on 19 November 2021) using the default settings. Subsequently, gffcompare (https://github.com/gpertea/gffcompare/ accessed on 19 November 2021) was used to combine the transcriptomes from each sample to create a comprehensive transcriptome. Following the creation of the final transcriptome, all the expression levels of each transcript were estimated using StringTie. By using the formula FPKM (FPKM = [total exon fragments/mapped reads (millions) exon length (kB)]), StringTie was utilized to determine the expression level for mRNAs. With a parametric F-test comparing nested linear models (p value 0.05) and the R package edgeR (https://bioconductor.org/packages/release/bioc/html/edgeR.html accessed on 23 November 2021), the differentially expressed mRNAs were identified. Also, we assessed the read quality using FastQC (http://www.bioinformatics.babraham.ac.uk/projects/fastqc/ accessed on 23 November 2021), which is based on Q30 and GC levels. After acquiring high-quality sequencing data, Trinity [22], we constructed sequences. Functional annotation was aligned with the NR (RefSeq non-redundant proteins), and gene ontology GO and KEGG enrichment analysis were performed on the genes using the DAVID software (https://david.ncifcrf.gov accessed on 29 November 2021) [35,36,37]. Using fragments per kilobase of transcript per million mapped reads (FPKM) [38], we estimated gene expression.

2.4. Sample Preparation and Metabolite Extraction

The freeze-dried materials were ground in a mixer mill at 45 Hz for two minutes. Next, we added 100 mg of powder from each sample into a 5-mL EP tube and finished the extraction by adding 2000 L of a 3:1 v/v methanol and water solution. The samples were vortexed for 30 s, subjected to 15 min of ultrasonication in an ice bath, vibrated at 4 °C overnight, and then centrifuged for 15 min at 12,000 rpm and 4 °C. Afterwards, each supernatant (500 L) was dried while being gently blown by nitrogen. In 250 L of a 1:1 v/v solution of methanol and water, all residues were reconstituted using a 30-min vortexing and 15-min ultrasonication procedure in an ice bath. We preserved the supernatants in 2 mL glass vials at −80 °C for UHPLC-mass spectrometry (MS)/MS after centrifuging the samples for 15 min at 12,000 rpm and 4 °C. Finally, we made samples for quality control by combining equal aliquots of the supernatants from the sample.

2.5. Analyzing Wide-Target Metabolomics Data Qualitatively and Quantitatively

Following the implementation of qualitative metabolite assessment utilizing secondary spectrum data from the in-house metware database (MWDB) and metabolite data from a public database, metabolite quantification using multiple reaction monitoring (MRM) in triple quadrupole MS was carried out (TQMS). With the use of the TQMS, the required fragment ion was chosen, reducing interference from non-target ions and enhancing quantification accuracy and reproducibility. For inconsistent samples, metabolite MS data were collected, and the integration of MS peaks was put into practice to correct the same metabolite [39].
We also used TQMS to screen different ions from each drug. The signal intensities of these ions (measured in cps) were identified, and MULTIAQUANT software was used to open and read the sample MS file. The integrated data for the site were reserved, and the area of each chromatographic peak represented the relative concentrations of the respective metabolites. In order to ensure the accuracy of qualitative and quantitative analyses on the strength of the peak type and the reservation time of metabolites, contributing to the comparison of each metabolite level in disparate samples, correction of the mass spectrum peaks was later implemented for each metabolite in disparate samples.
As previously mentioned [40], we used principal component analysis (PCA) and partial least squares-discriminant analysis to identify cultivar-specific metabolite accumulation. To find the significantly different metabolites, fold change (FC) 2 or 0.5 and variable relevance in projection 1 were used as the selection criterion. Between DEGs and DEMs, Pearson correlation (PCA) analysis was carried out using R program.
Additionally, using the Roche LightCycler® 480 II Real-Time System, eight TFs in a 96-well plate were validated using qRT-PCR (Shanghai, China). The PCR amplification procedure used a thermal cycling schedule that consisted of 95 °C for 5 min, 95 °C for 10 s 40 cycles, and 60 °C for 30 s 40 cycles. All of the PCRs were carried out using the Hieff® qPCR SYBR Green Master Mix (No Rox) provided by Yeasen Biotech Co., Ltd., in accordance with the instructions’ protocol (Shanghai, China). We established three technical and three biological replicates for each qRT-RCR.

2.6. Data Processing and Analysis

We utilized the 95% confidence interval (p < 0.05) and SPSS software (version 25.0, SPSS Inc., Chicago, IL, USA) to examine the data in this paper for statistical analysis (ANOVA) and statistical significance. For all measured parameters, the data are reported as the mean standard deviation (SD) of three biologically separate replicates; GraphPad Prism (version 8.0.2) (GraphPad Software, Inc., LA Jolla, CA, USA) was then used for graphical representations.

3. Results

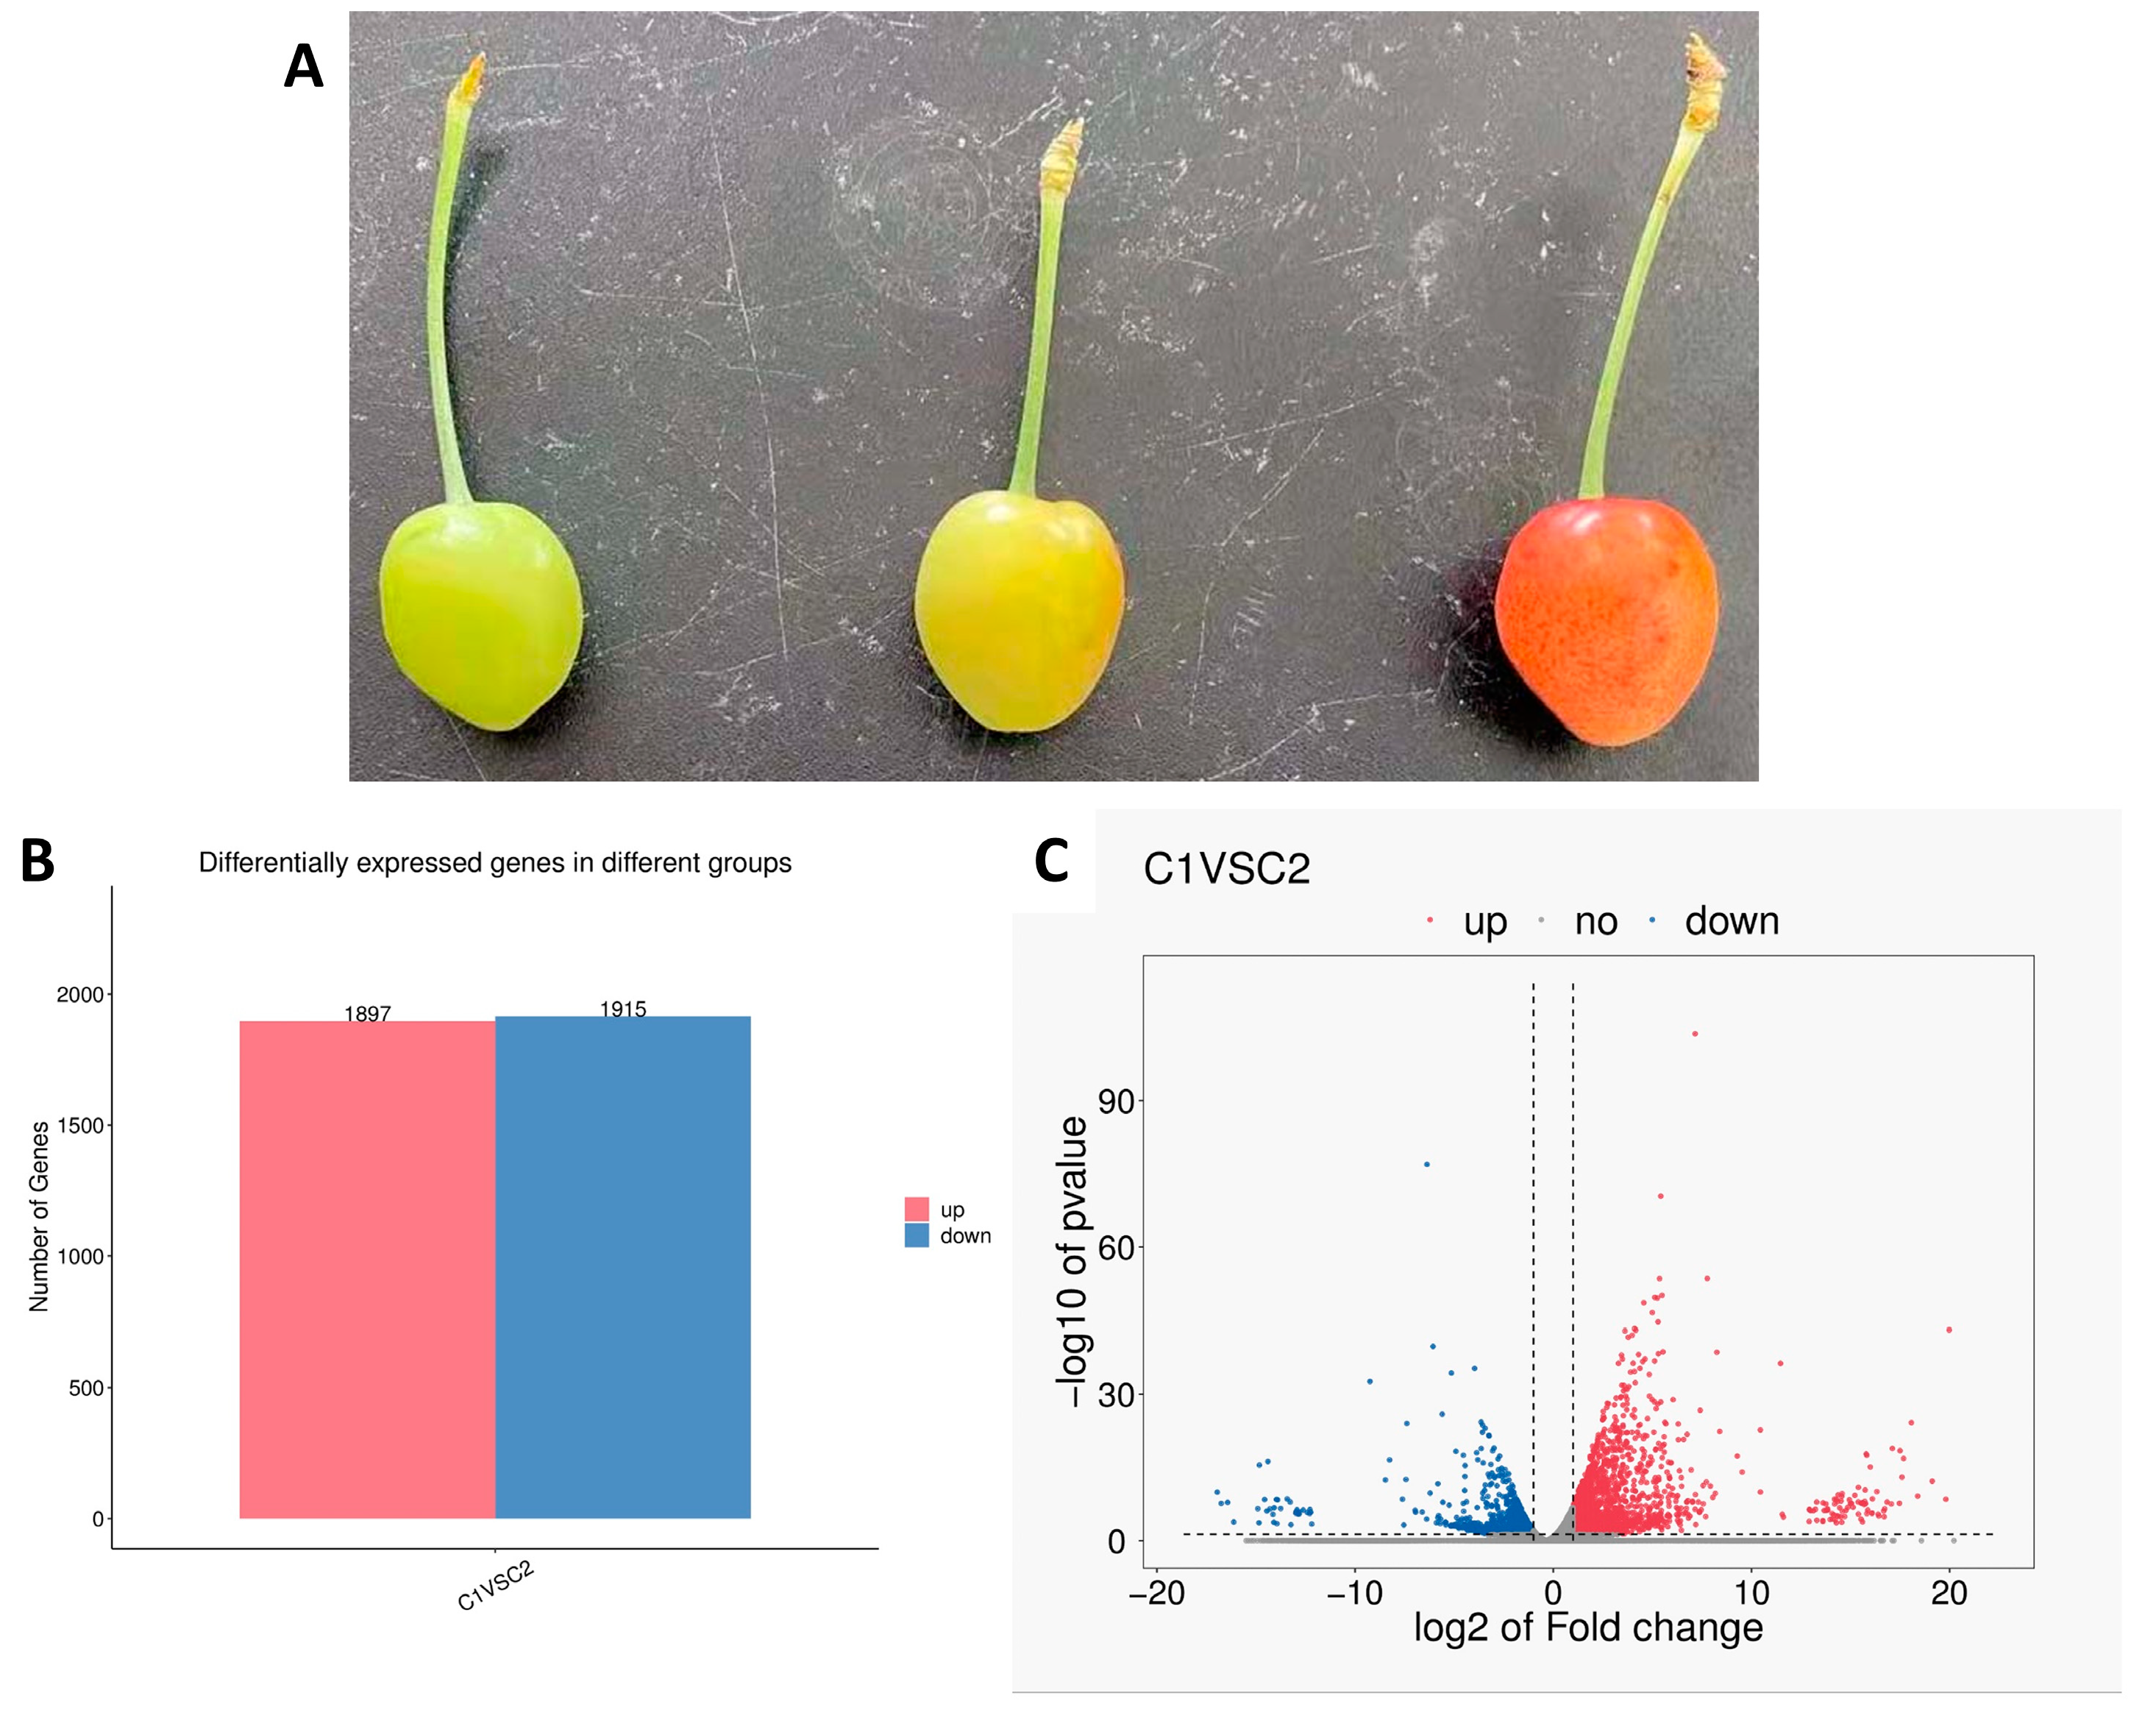
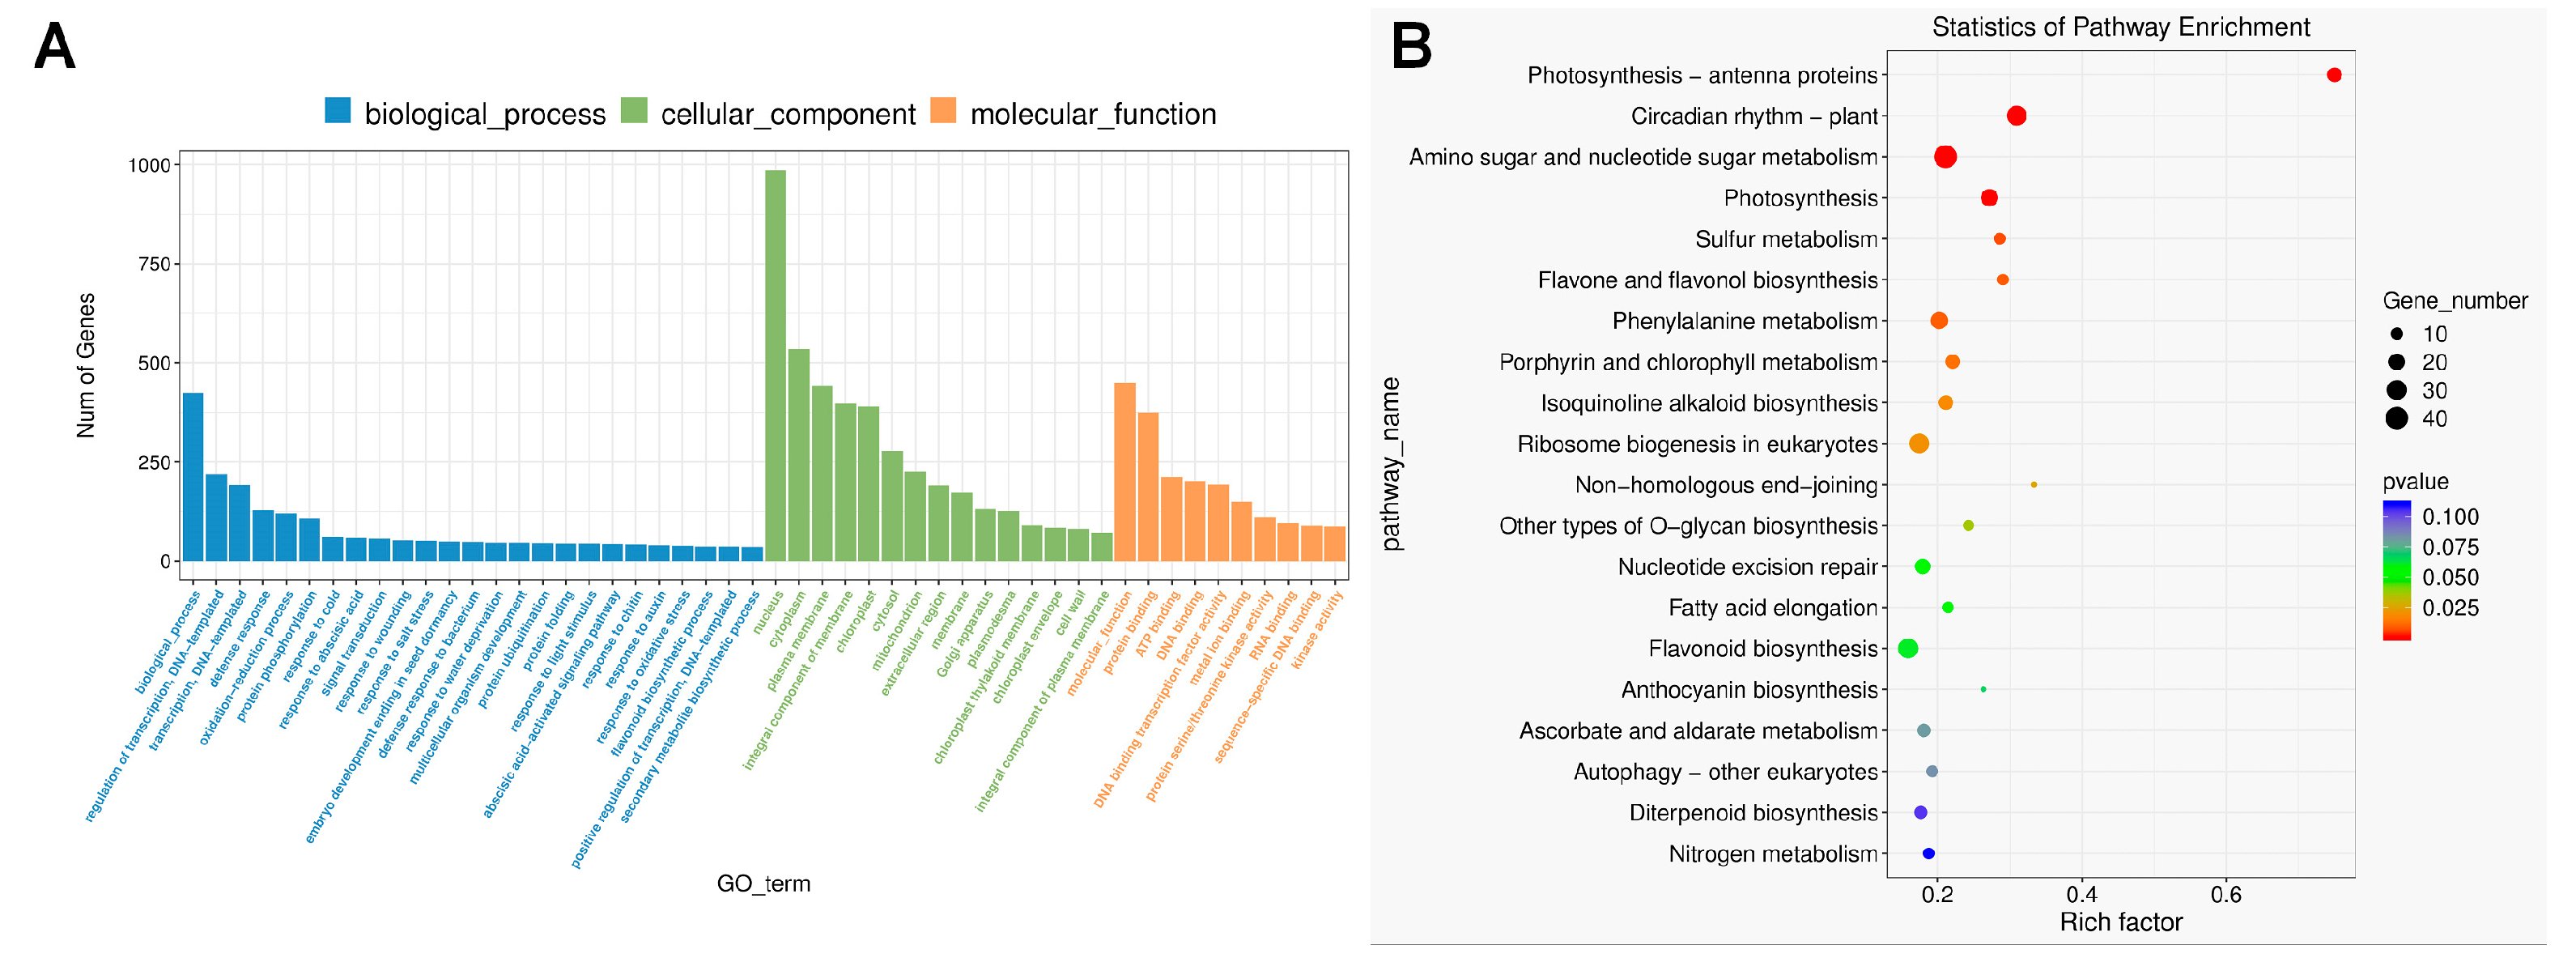
3.1. Transcriptomic Analysis of Two Developmental Stages of Sweet Cheery Fruit

We implemented a transcriptomic analysis of the green and red peel cherries to confirm DEGs at two different developmental stages (Figure 1A). In agreement with FC ≤ 2.0 and FDR < 0.05, we filtered out 3812 DEGs in RP and GP sweet cherries, of which 1897 and 1915 genes showed an upward trend and a downward trend, respectively (Figure 1B,C). The GO was classified into molecular, biological, and cellular functions. The GO terms enriched in the cellular component classification were amino sugars and photosynthesis, while flavone and flavonol biosynthesis were the GO terms which were most enriched in the molecular function. DEGs regulating key molecular processes, such as ATP binding, RNA, and DNA binding, accumulated in abundance (Figure 2A). High numbers of DEGs reside in the nucleus and are key in the chloroplast thylakoid membrane, as shown in the cellular processes category (Figure 2A). Several key biological processes were also on display, such as flavonoid biosynthesis, response to abscisic acid, and auxin responsiveness. The KEGG pathway enrichment analysis highlighted that the majority of the DEGs are involved in photosynthesis–antenna proteins, circadian rhythm, amino sugars, photosynthesis, and flavone and flavonol biosynthesis (Figure 2B).

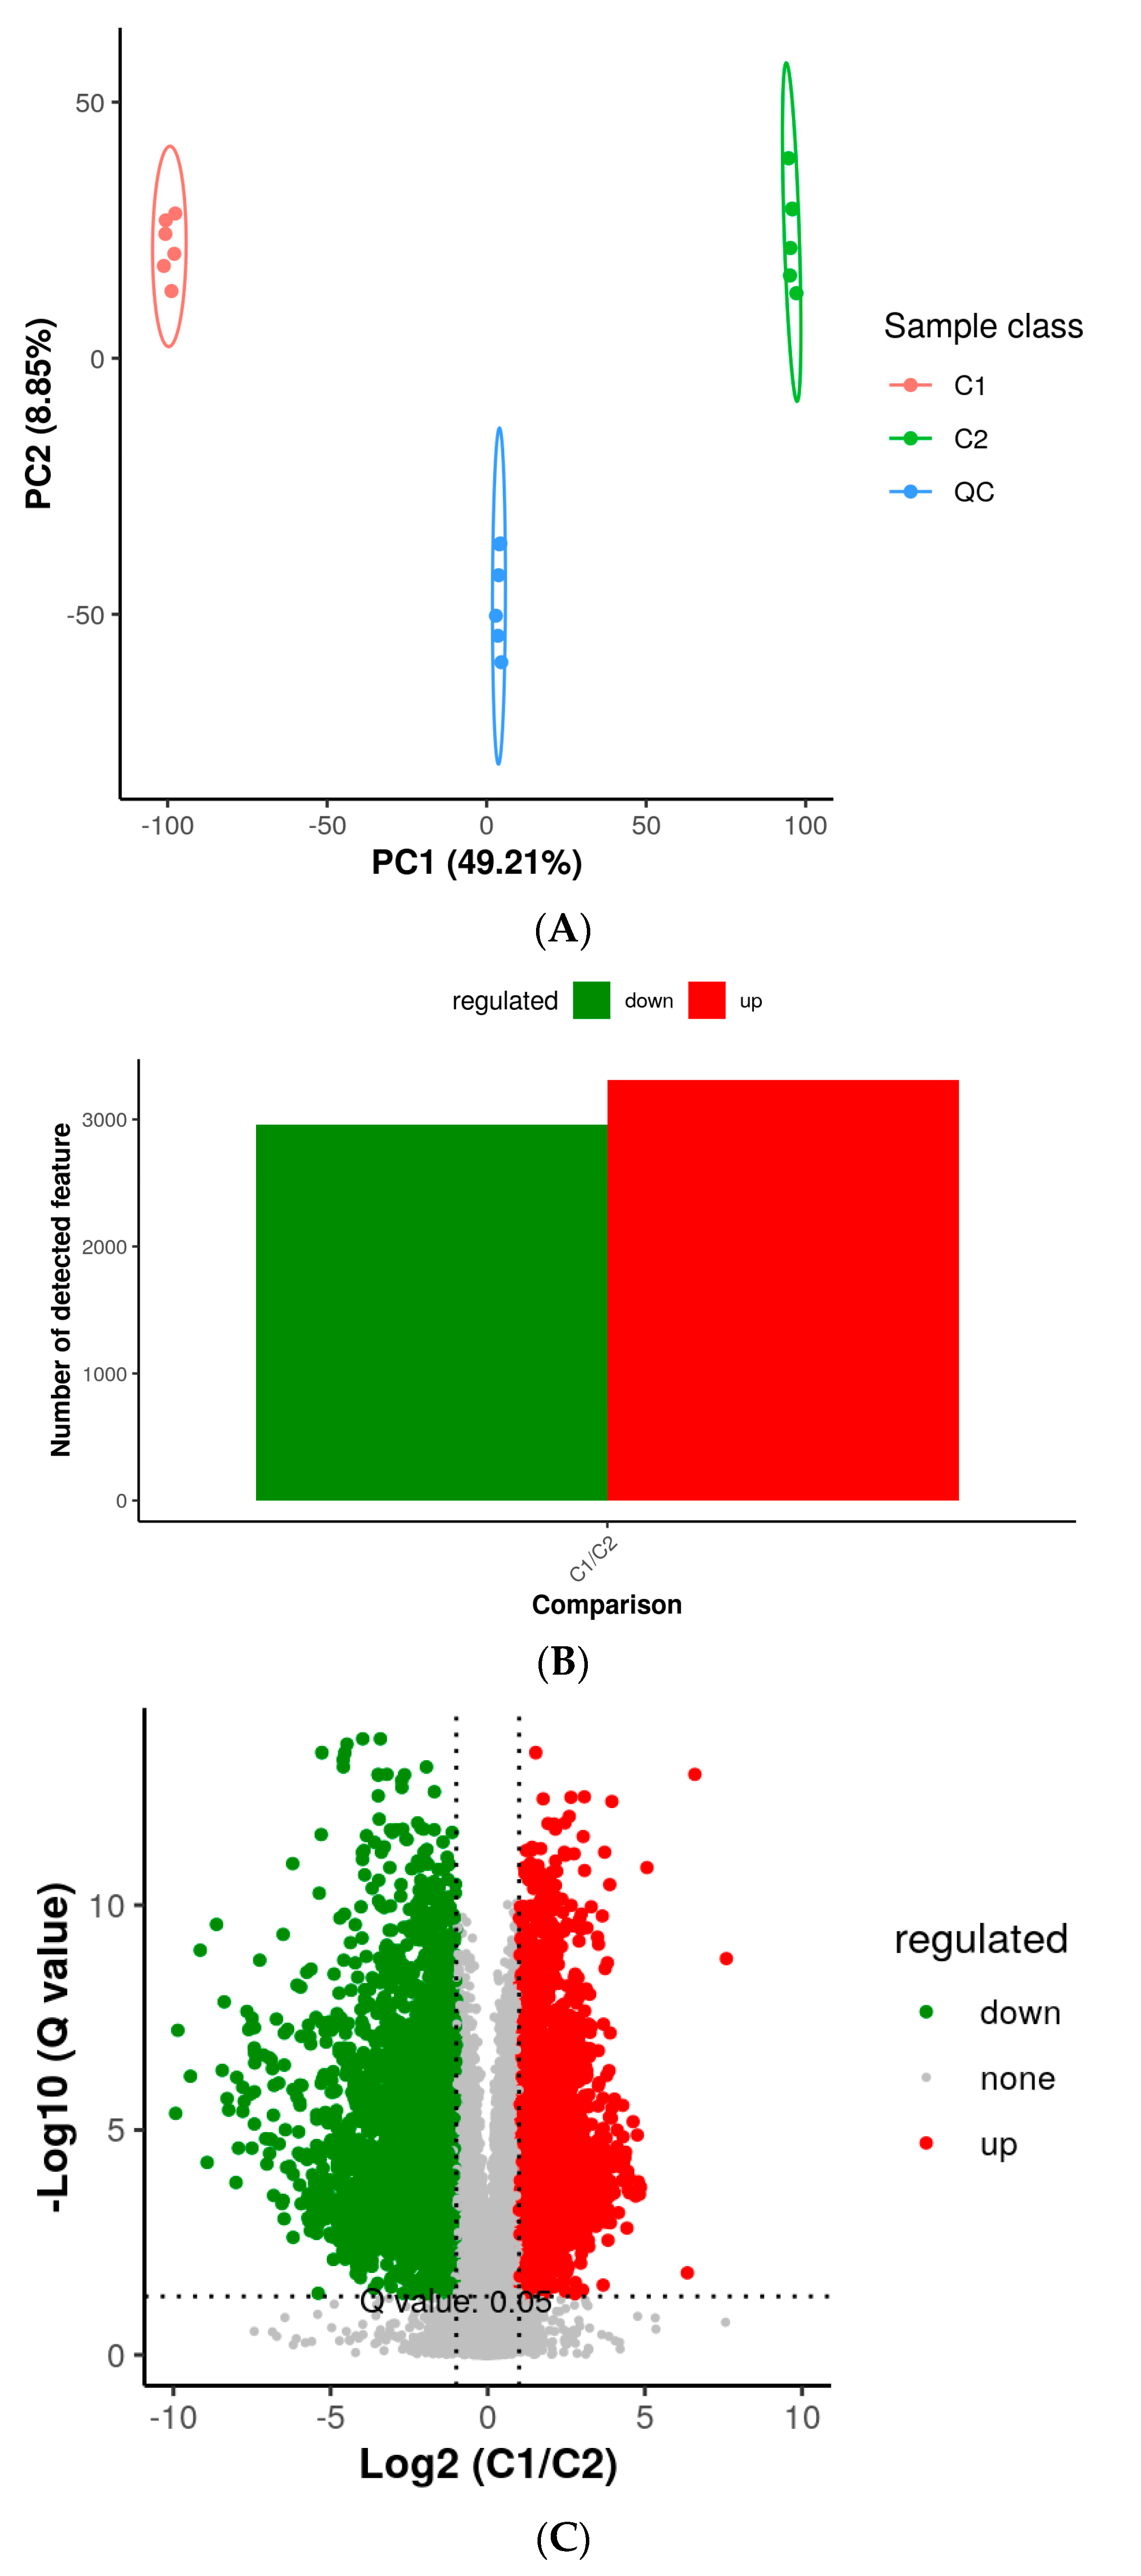
3.2. Metabolic Differences in Two Developmental Stages

We implemented LC-ESI-MS/MS sample analysis to compare the differences in two metabolite pathways. PCA analysis showed that GP (C1) and RP (C2) sweet cherry trees were distinct in the PC1 ×PC2 score plots (Figure 3A). In this work, we clarified 1942 up-regulated and 1622 down-regulated differentially expressed metabolites (DEMs) (3564 in total) in both groups (Figure 3B). As illustrated by the volcano plot (Figure 3C), the metabolite contents differed significantly between the two developmental stages. Based on the annotation information, the DEMs fell into 16 categories: pyrenes, flavonoids, prenol lipids, benzene and substituted derivatives, organ oxygen compounds, isobenzofurans, and indoles and their derivatives. From these, 25 flavonoids were screened, in 11 of which flavonoids accumulated in abundance, and14 were poorly enriched.

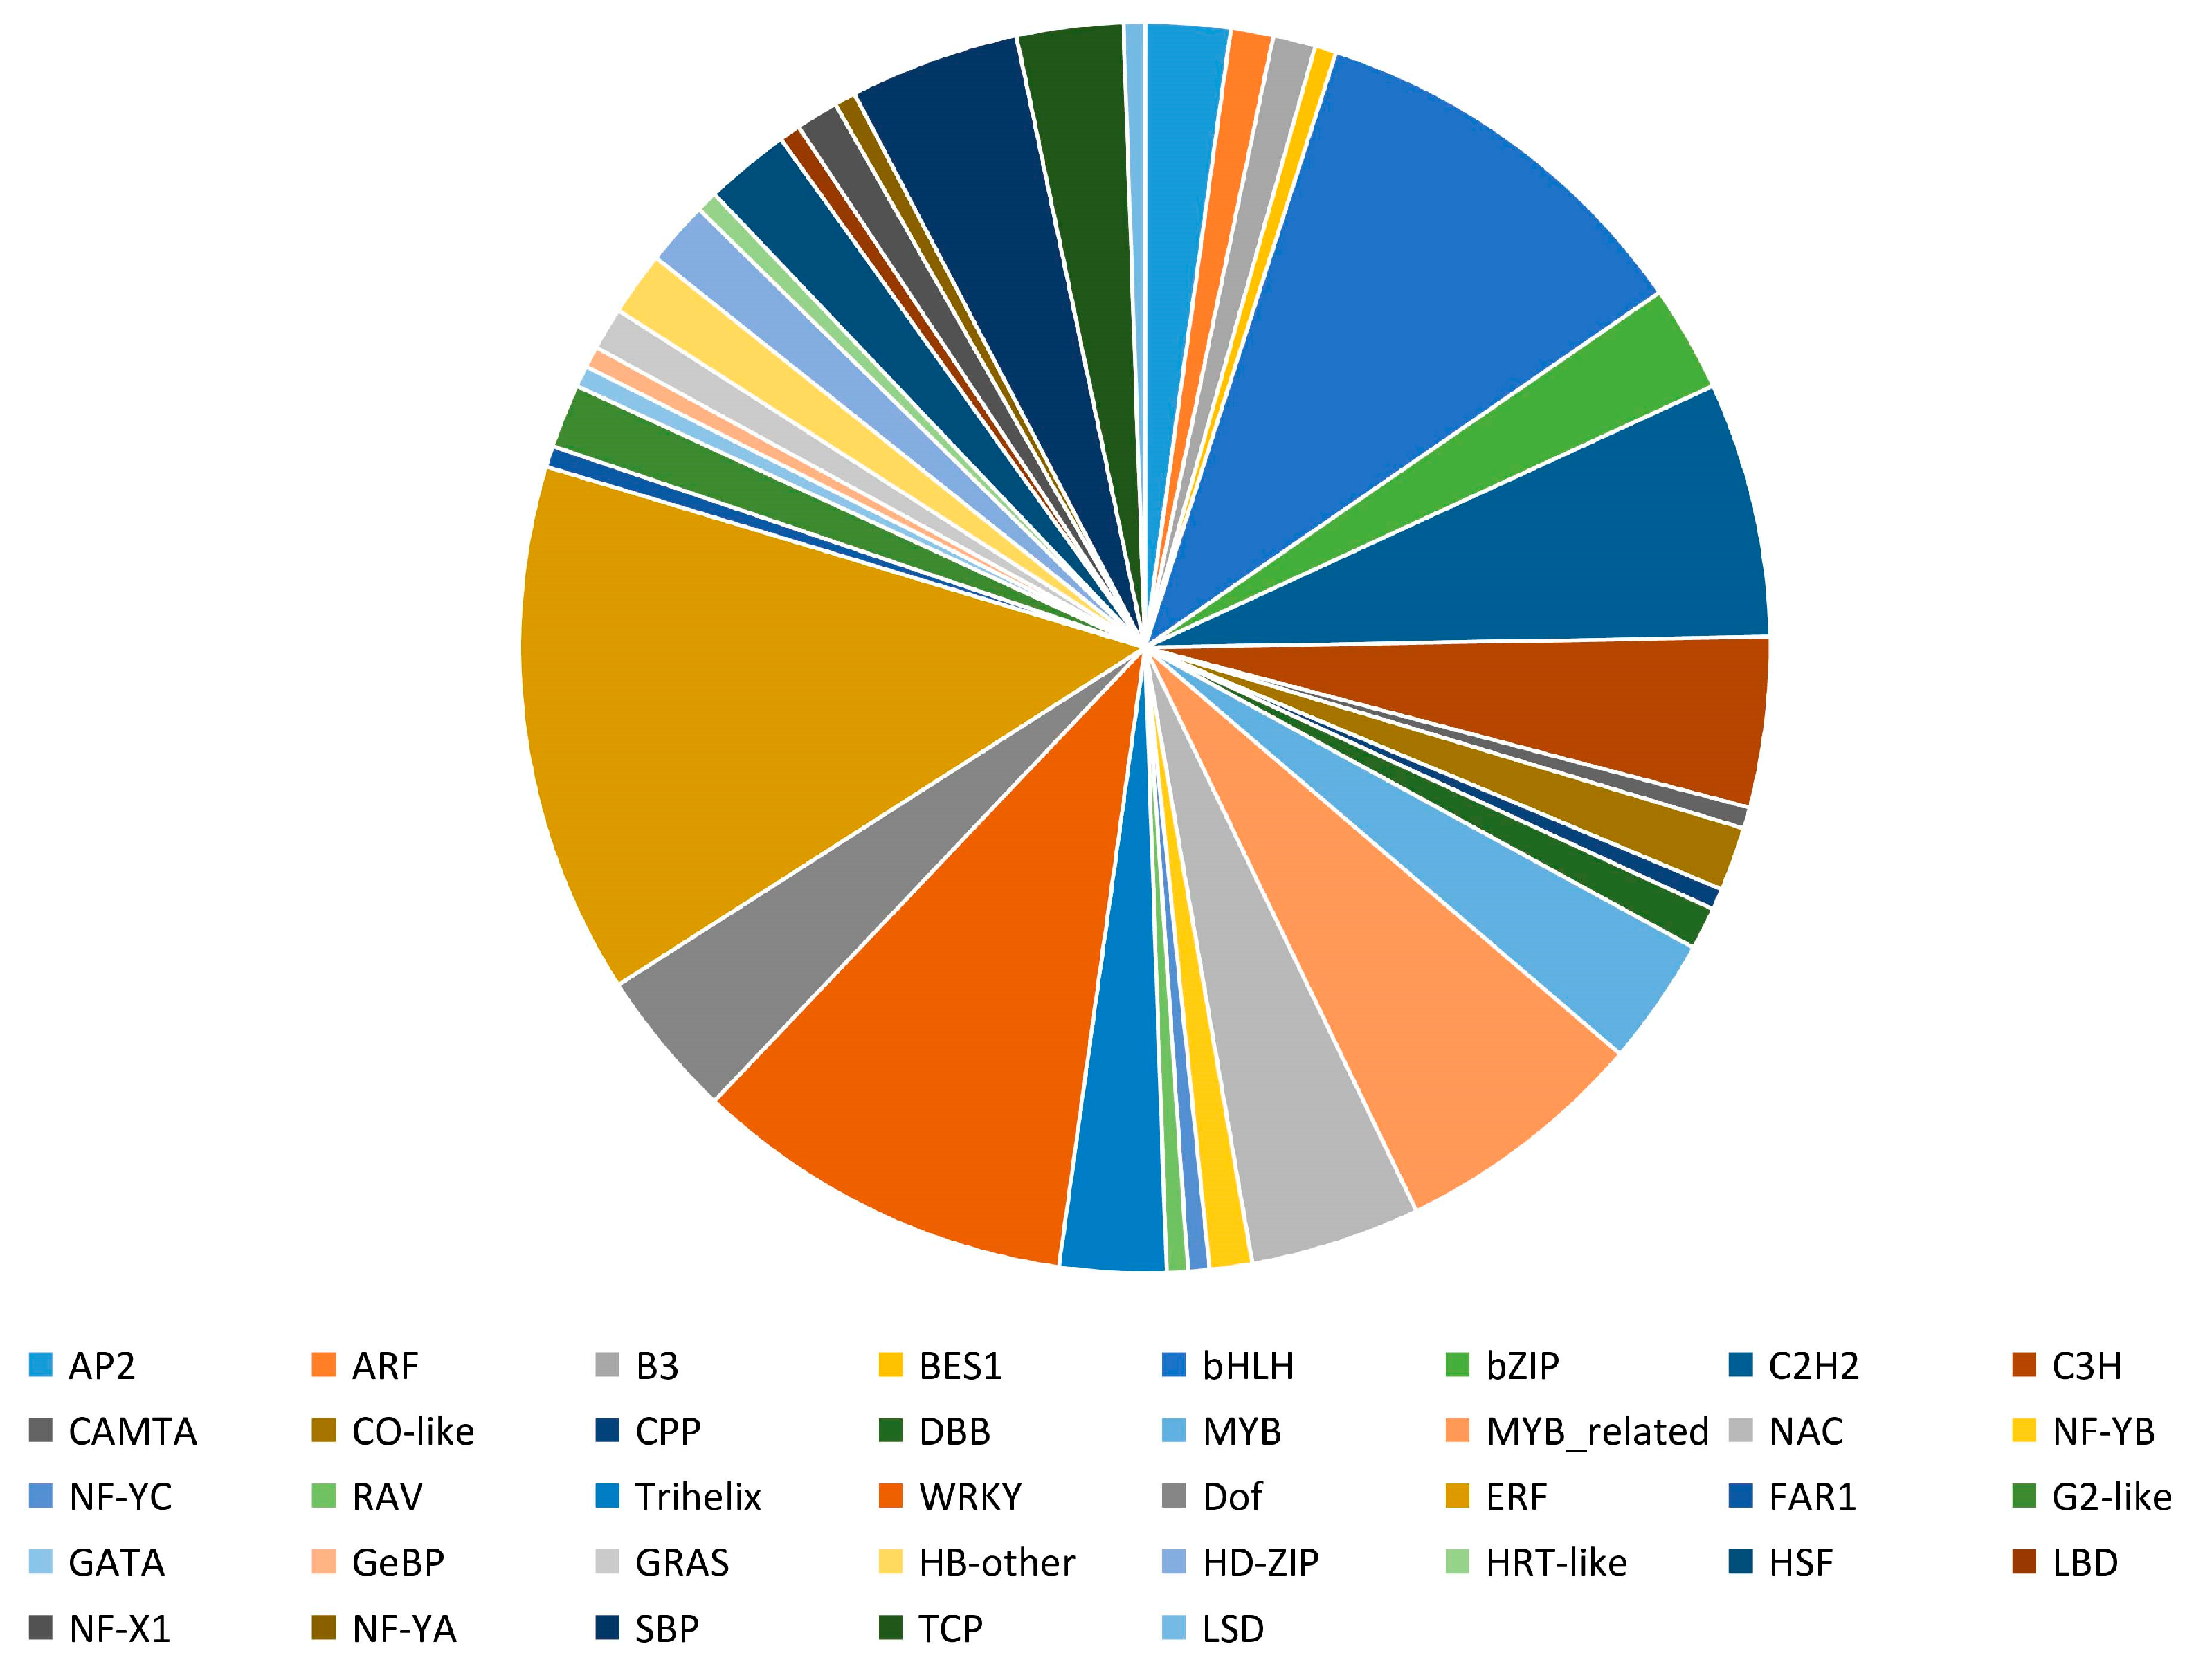
3.3. TFs Are Relevant to Differential Accumulation of Metabolites in “Red Peel” (C2) Sweet Cherries

The highly important TFs, including MYBs and bHLH, are instrumental in the biosynthesis and homeostasis of flavonoids [29,30]. Our data unveiled that 182 differentially expressed TFs (DETFs) from 37 TF families were discovered in the RP sweet cherries and this percentage is shown in Figure 4. The DETFs found in the largest quantities were members of the ERF (25) and bHLH (19) families, followed by the MYB (18), WRKY (18), and C2H2 (12) families. Interestingly, most ERF genes showed down-regulated expression, whereas CCCH genes were mainly up-regulated in C2. Apart from that, other DETFs displayed high expression variation among the tested samples.

3.4. Anthocyanin, Flavonoid, and Flavonol Biosynthesis Pathways

Omics data integration of transcriptomics and metabolomics analysis showed 44 DEGs genes (Table 1) and a total of 3564 DEMs and 7 genes which were involved in anthocyanin, flavonoid, flavone, and flavanol biosynthesis pathways are shown in (Table 2). Among the 7 DEMs, the levels of catechin, epicatechin, myricetin, rhoifolin, myricetin, and keracyanin were significantly higher in the C2, and only rutin was also up-regulated.
The flavonoid biosynthesis pathway genes, such as anthocyanidin 3-O-glucosyltransferase 2 (3GT2) and four UDP-glycosyltransferase 88F5 (UGT 88f5), were all up-regulated in the C2 group. From the 30 DEGs in flavonoid biosynthesis, 11 DEGs were found to be highly expressed in C2, and 19 were down-regulated. In the flavone and flavanol biosynthesis pathway, four phenolic glucoside malonyl transferases (PMATs) and one flavonoid 3-O-glucosyltransferase (Pav_sc0000308.1_g350.1.mk) (3GT) were up-regulated. On the other hand, flavonoid 3-O-glucosyltransferase (Pav_sc0000308.1_g360.1.mk) (F3GT), flavonoid-3′-hydroxylase (F3’H), UDP-glycosyltransferase (UGT), and flavonoid 3′-monooxygenase were down-regulated in C2 vs. C1.

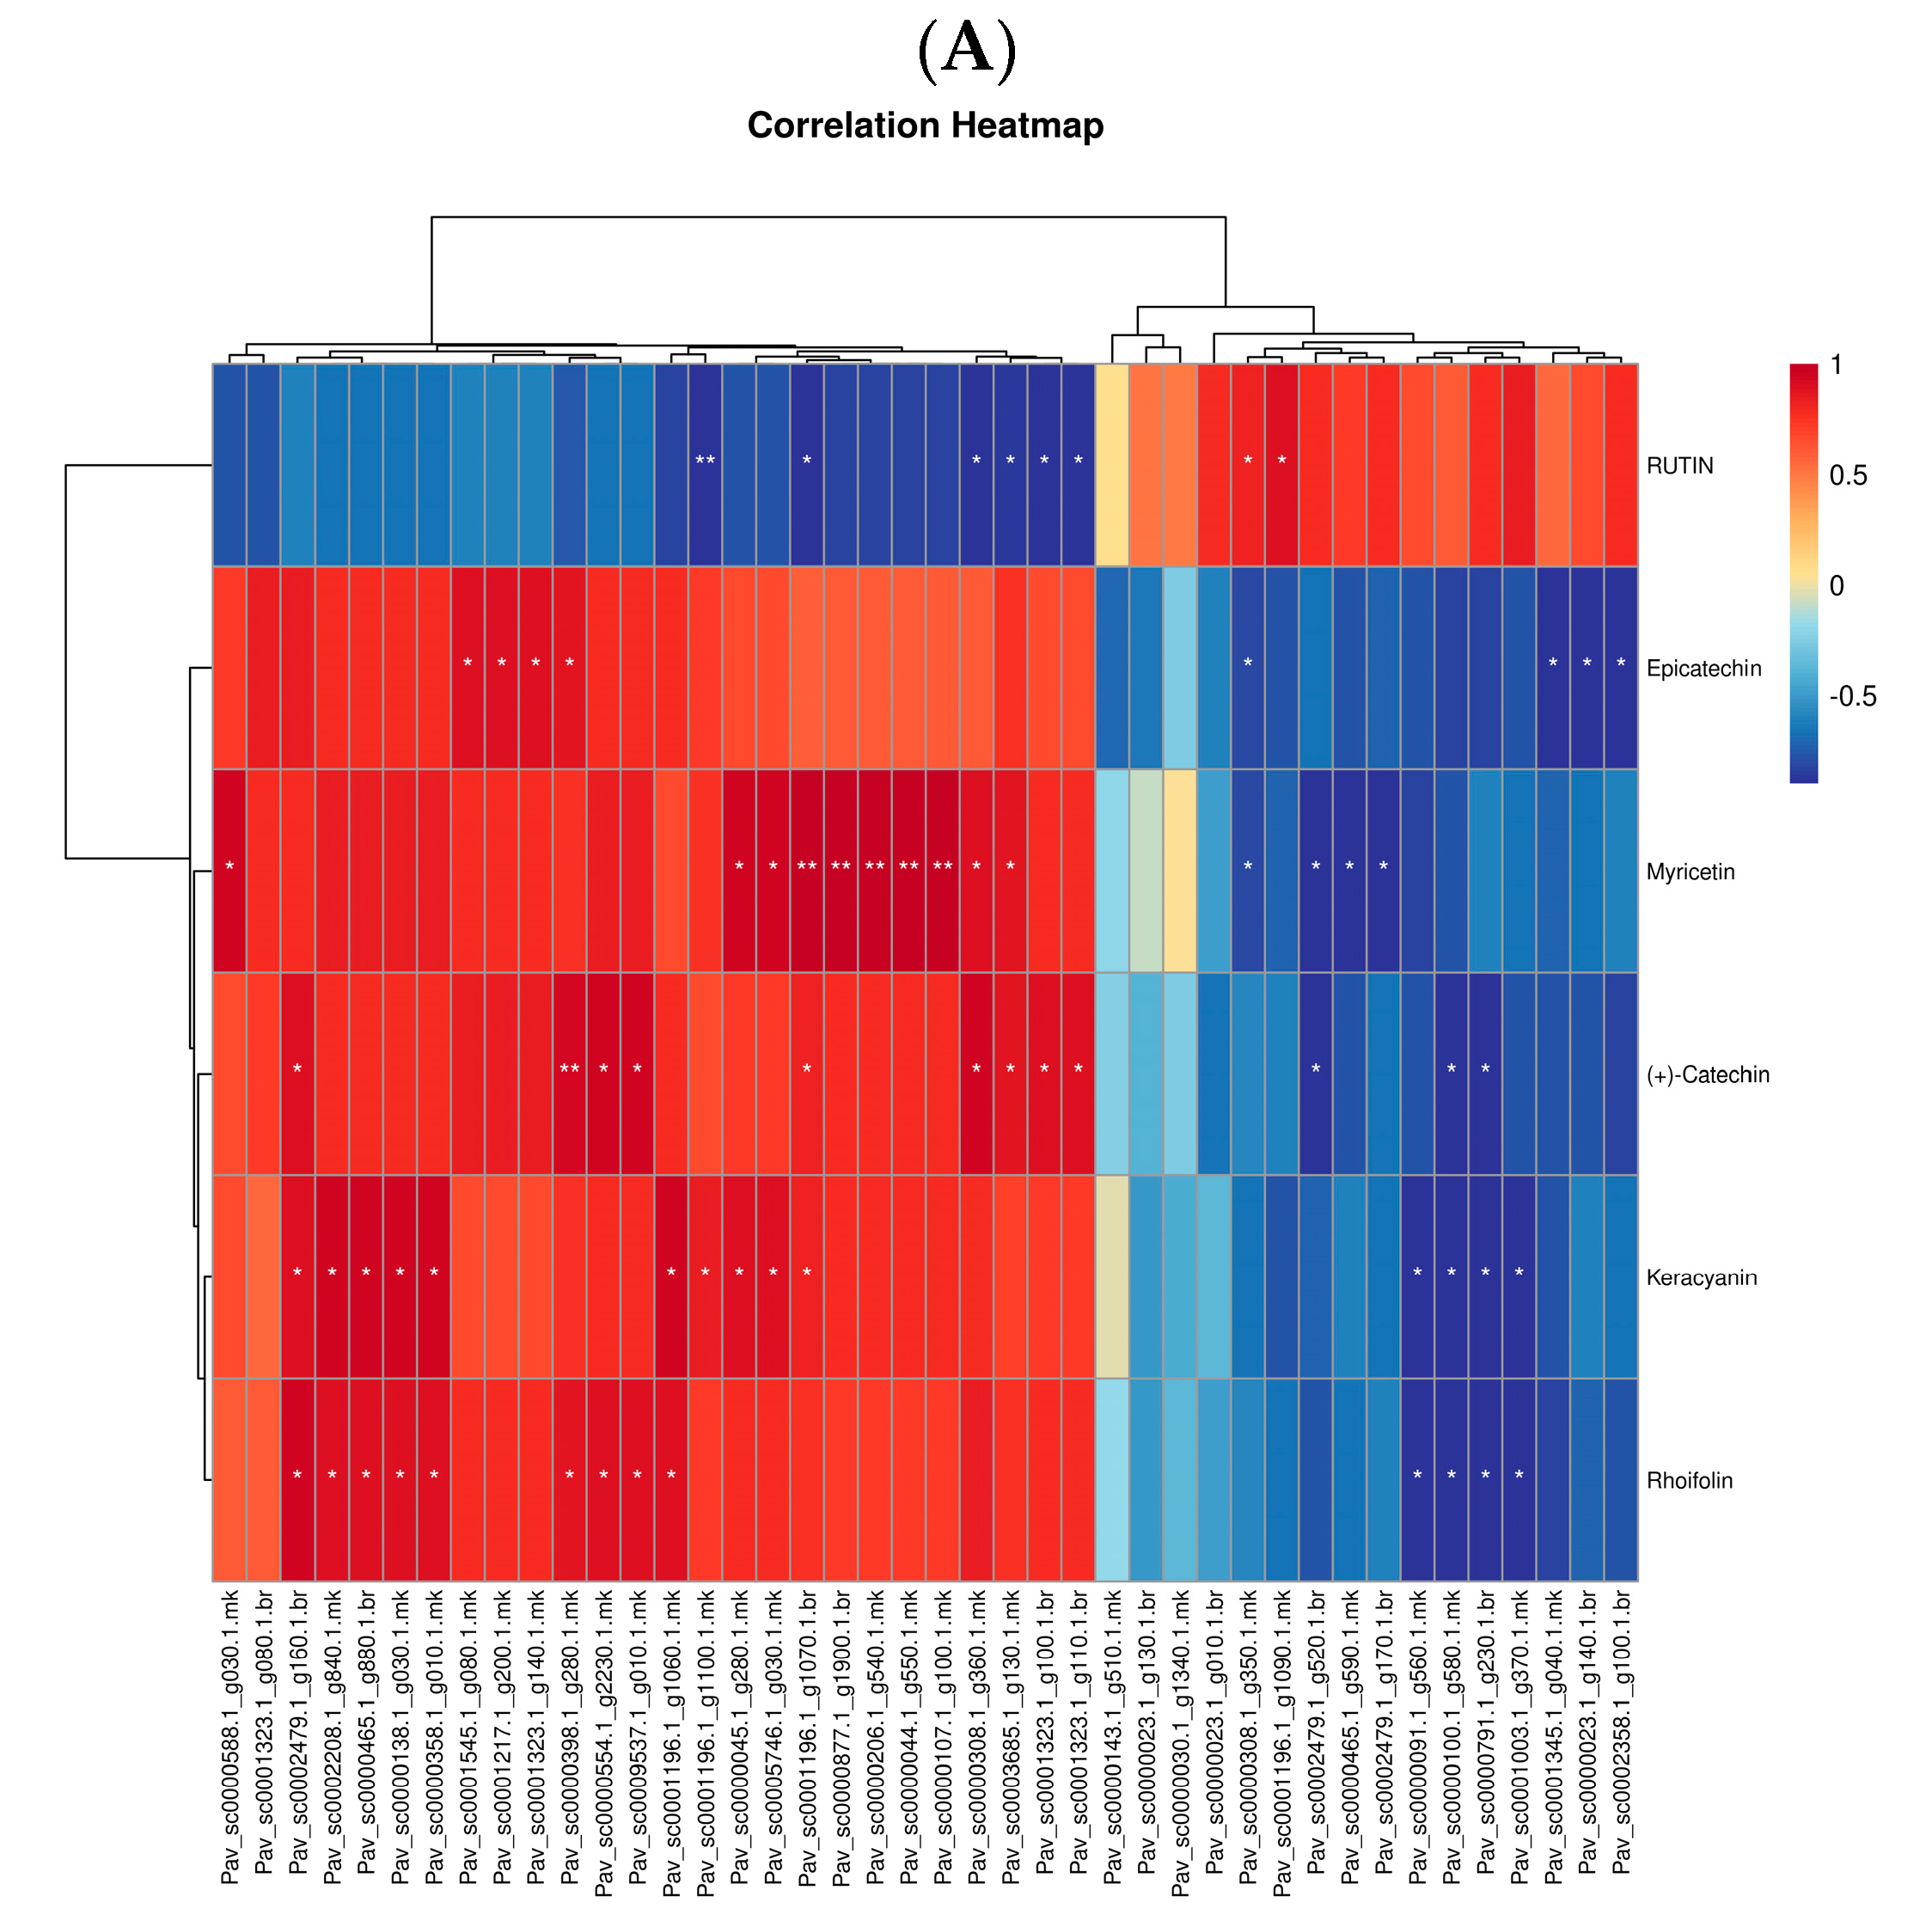
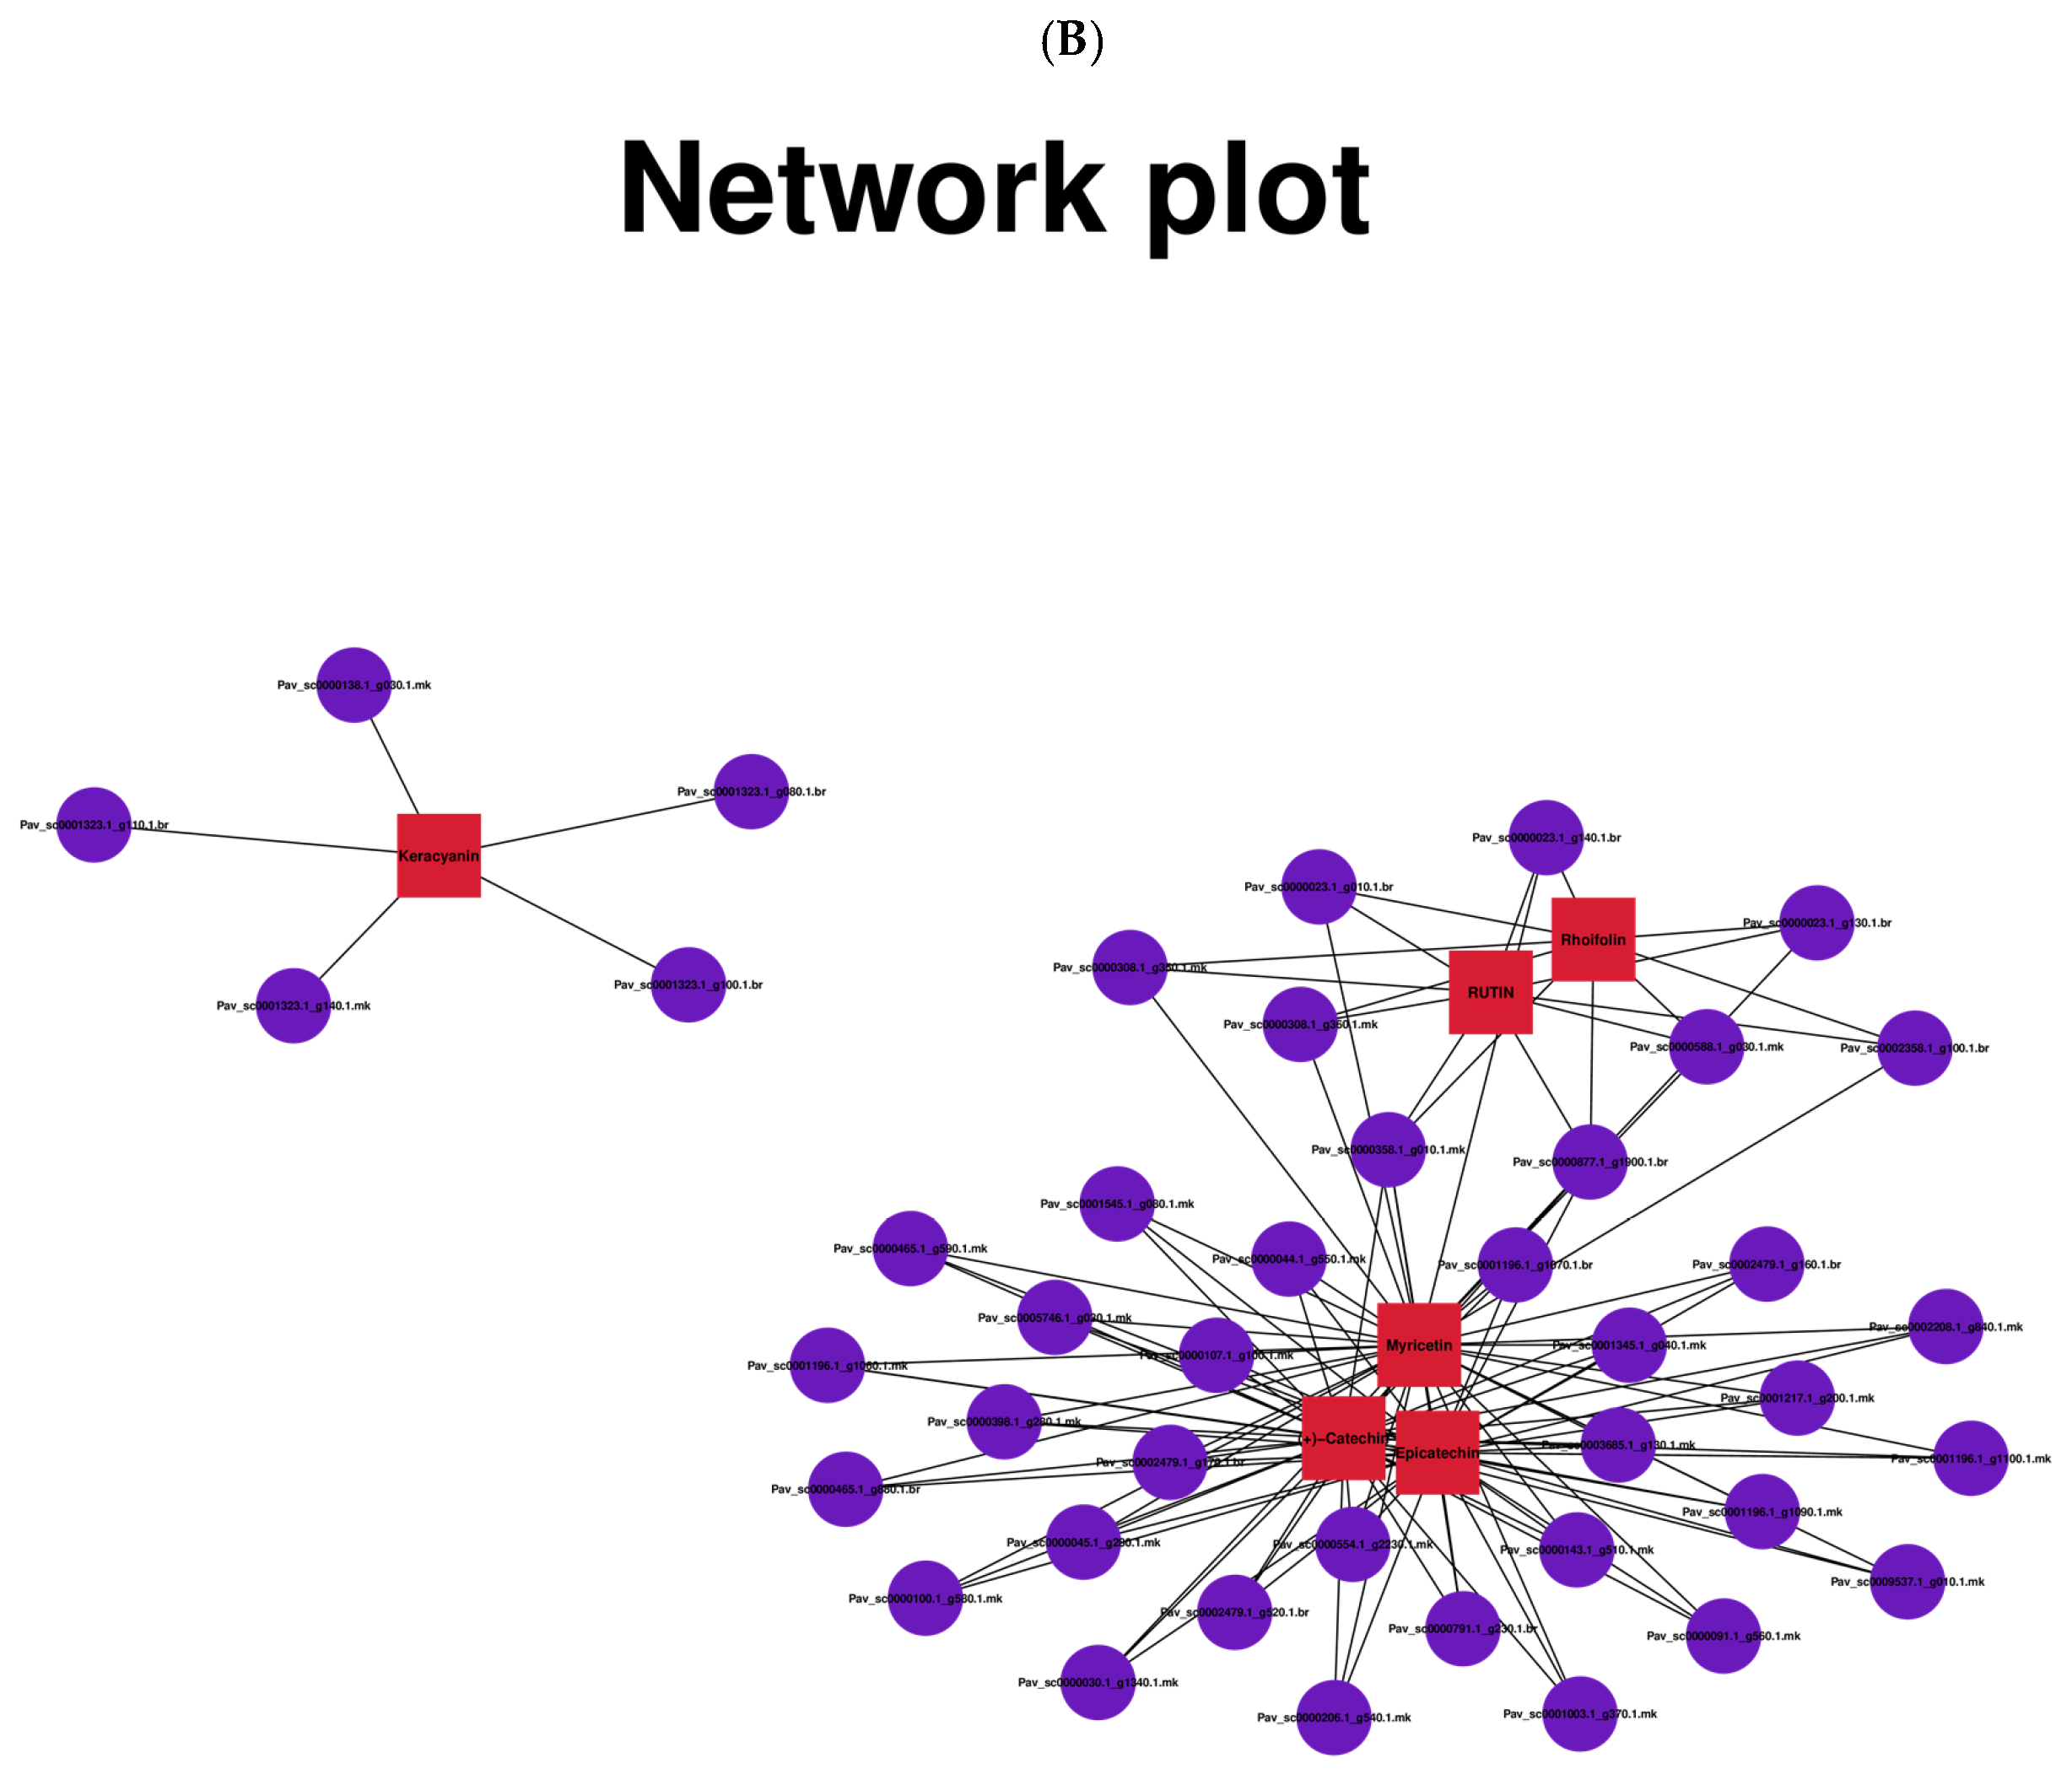
3.5. Correlation Analysis between DEGs and DEMs in Anthocyanin, Flavonoid, Flavone, and Flavanol Biosynthesis Pathways Reveals the Differential Regulatory Network

A correlation analysis was conducted between DEGs and DEMs in anthocyanin, flavonoid, flavone, and flavanol biosynthesis pathways. In total, 7 flavonoids and 44 genes underwent Pearson correlation analysis. As unveiled by the results, 20 genes were inextricably associated with 6 metabolites (r2 > 0.9, Figure 5A). The network analysis was divided into two clusters. Keracyanin was found to be abundant in cluster 1, and highly correlated with 5 genes. Myricetin, epicatechin, and catechin were more predominantly enriched in cluster 2, and highly connected to 15 genes (Figure 5B).

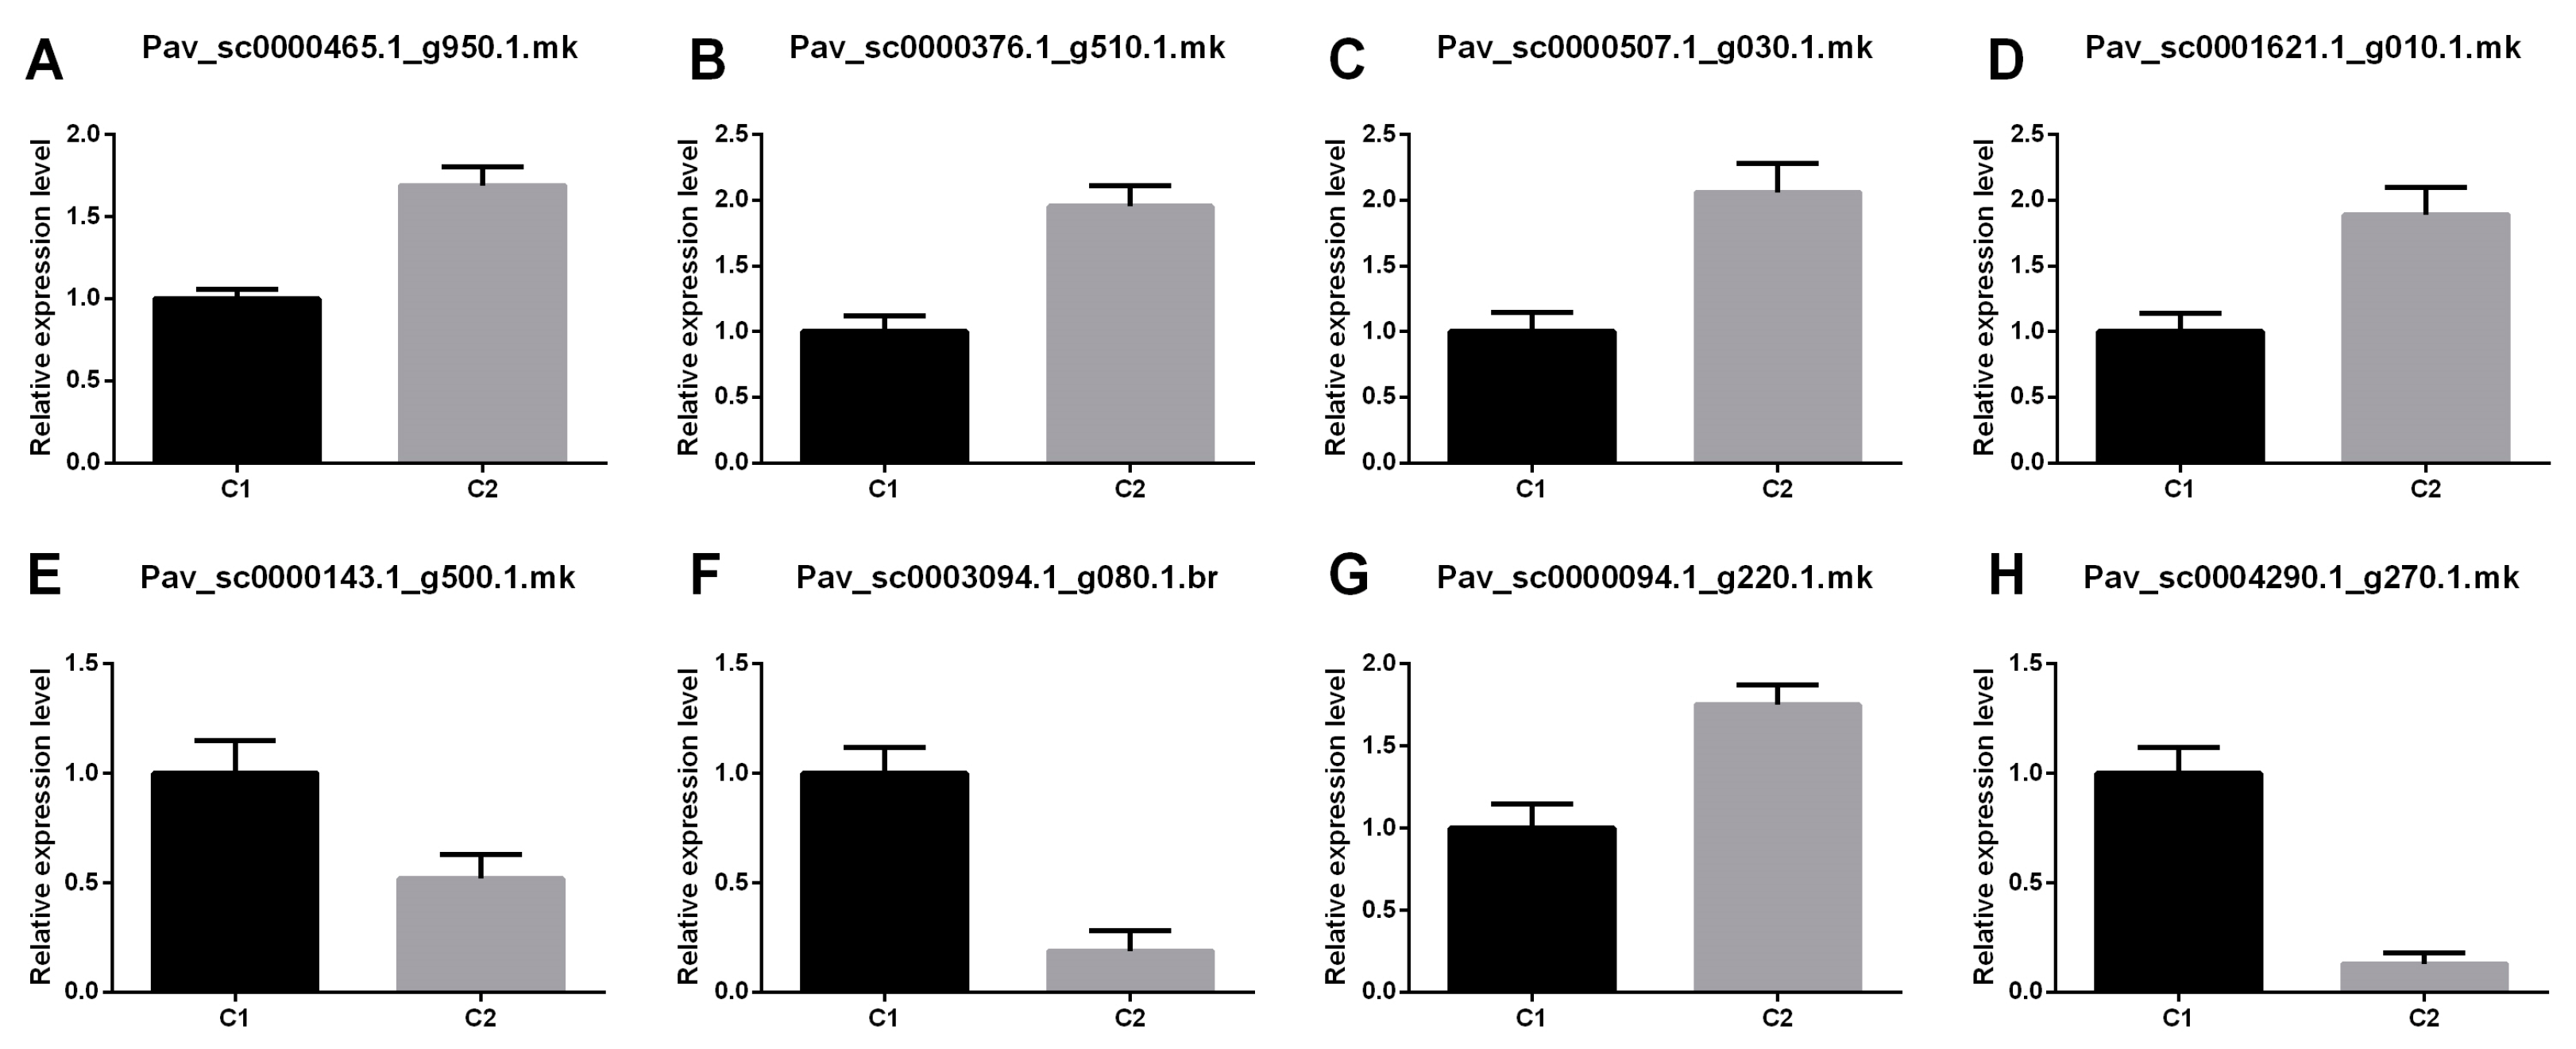
3.6. Verification of the Expression of Genes Relevant to the Route of Flavonoid Biosynthesis

We used qRT-PCR verification with eight TF genes to assess the precision and reproducibility of RNA-Seq data. All the genes’ levels of expression were analyzed at every step, from development to ripening. Figure 6 displayed the expression level of specific genes. During the fruits’ development through theirripening stages, the expression of the majority of genes was considerably altered. In light of these results, we can thus hypothesize that up-regulation of these genes may aid in fruit development up to the point of ripening.

4. Discussion

Similar to genomics and proteomics, the new omics technique known as metabolomics can be used to identify and measure small-molecular-weight compounds that are present in an organism’s cells [41]. In the post-genome era, a new area called plant metabolomics been extensively used for examining patterns of metabolite accumulation [42]. Furthermore, by identifying the genes involved in the metabolism, a subject of interest in contemporary plant biology, this approach was used to examine the underlying genetic basis of these patterns. Metabolites are the byproducts of acell’s biological regulating process, and their concentrations can be viewed as the way a plant responds to genetic and environmental changes as it grows [43]. In this study, omics data assessment of metabolome and transcriptome provides extensive data about the transferred product profiles in secondary metabolism and the underlying variations in gene-expression networks. In the present study, 3812 DEGs were identified in RP sweet cherries, of which 1897 and 1915 genes were up-regulated and down-regulated, respectively. Meanwhile, in metabolome analysis, 3564 DEMs including 1942 up-regulated and 1622 down-regulatedmetabolites were also screened. The DEGs and DEMs are expected to be crucial in exploring the color change mechanism insweet cherries.
Flavonoids, which dominatesecondary metabolites, exist in heterogeneous plants [44,45]. They are determinants of the color of flowers, fruits, and leaves and are crucial for plant growth, development, and environmental adaptation. In particular, Flavonols, flavanones, and isoflavones, which are the distinct subclasses of flavonoids, are present in common vegetables and fruits [46]. For instance, catechin and epicatechin content was suppressed significantly in melatonin-treated bananas [47]. The bananas treated with melatonin showed delayed skin browning under cold temperature stress [48]. Augmented level of flavonoids and anthocyanins not only displayed the red color phenotype in mango, but they also enhanced resistance against cold stress and anthracnose disease [49]. A higher accumulation of carotenoid and flavonol was recorded in damaged-peel-colored apples [50]. In the present study, enrichment of 7 DEMs was unveiled in anthocyanin, flavonoid, and flavone and flavonol biosynthesis pathways. In particular, levels of catechin, epicatechin, rhoifolin, myricetin, and keracyanin were increased significantly in mature fruits, indicating the substances were responsible for the change of color.
The progression in fruit ripening initiates the colorful pathway which controls peel color. As a critical player, flavonoid regulates the pigmentation of peel color during fruit development and the ripening stage [51]. In the complex flavonoid pathway, anthocyanidin 3-O-galactosyltransferase is instrumental in catalyzing the galactosylation of anthocyanidin [52]. Higher transcriptional activity of galactosyltransferase and glucosyltransferase genes regulate the peel color in various horticultural crops [53,54]. In our study, one anthocyanidin 3GT2, four UGT 88f5, and one 3GT showed up-regulated expression in the RP sweet cherry group, indicating they are involvedt in the pigmentation of red peel sweet cherries (Table 1) [55].
TFs, namely transacting factors, initiate or impede gene expression to achieve regulations in response to environmental stresses, secondary metabolite biosynthesis, and plant growth and development [32,56]. In the present study, 182 DETFs, classified into 37 TF families, were found in RP indicating that the DETFs play a crucial role in the flavonoid-mediated peel pigmentation of sweet cherries. Previously, the MYB and bHLH (basic he-lix-loop-helix) TFs, the two largest TF families inplants, were intensively discussed in relation totheir role in flavonoid biosynthesis [57,58]. For instance, a bHLH3, when overexpressed, disturbed the flavonoid metabolic network by altering the levels of anthocyanins, flavonoids, and flavonols in mulberry fruits with discrepant colors [59]. In order to control the accumulation of plant flavonoids, MYB and bHLH collaborate with WDR protein to produce the ternary complex MBW [60,61]. The complex ternary MYB-113, a key regulator of flavonoid production in pepper [62], has no effect on how the MBW module functions. According to a study conducted on the plant Arabidopsis thaliana, the zinc finger protein TT1 (MYB TF) interacts with TT2 (MYB TF) to modify the expression of the genes involved in structural flavonoid biosynthesis [63].
In our research, bHLH (19) and MYB (18) account for high proportions of the TFs that have been discovered, including bHLH30, bHLH35, bHLH128, bHLH143, MYB8, MYB4, and MYB44 (Figure 4). Plants infiltrated with the MYB+bHLH combination construct showed specificity and significant accumulation of flavonoid pathway intermediates [64]. AtWRKY23 in A. thaliana impels flavonoid bio-synthesis by elevating enzyme-encoding genes in the flavonoid biosynthesis pathway [65]. In our study,18 WRKY genes significantly changed the expression levels in C2, which might play a significant role in the flavonoid synthesis that could induce fruit ripening. Over-expression of MdWRKY11 gears up the expressions of F3H, FLS, DFR, ANS, and UFGT, and facilitates anthocyanin and flavonoid accumulation in apple callus [66].

5. Conclusions

The present study involves combined metabolomics and transcriptomic assessments at two different stages, i.e., GP (young) and RP (mature), of fruit development and ripeningin sweet cherries. Our metabolome and transcriptome analyses provide a clear view of the participatory role of anthocyanin, flavonoid, flavone, and flavonol expression during the transition from young GP to mature RP sweet cherries. The candidate genes and metabolomics include six genes: catechin, epicatechin, rhoifolin, myricetin, keracyanin, and glycosyltransferase. These candidate genes give important information and useful references so we can better understand the regulation of the flavonoid biosynthesis pathway and the accumulation of metabolites in GP (young) and RP (mature) sweet cherries during distinct developmental stages. Even though these genes were predicted by the bioinformatics analysis, the validation of the transcriptome expression was verified by qRT-PCR. During fruit development and ripening, there is a greater accumulation of important TFs that control the pathway for secondary metabolites. However, the particular mechanism sill requires future research.

Author Contributions

The authors confirm their contributions to this work: B.F. in conceptualization, original draft preparation, and writing; and Y.T. in revising, and review. All authors have read and agreed to the published version of the manuscript.

Funding

This research was funded by Shanxi Agricultural University (YCX2020SJ10).

Data Availability Statement

The NCBI public database has the datasets produced for this investigation. The Bio Sample accession number PRJNA824997 in the Sequence Read Archive (SRA) contains all of the sequences.

Conflicts of Interest

The authors declare no conflict of interest.

References

  1. Jin, W.; Wang, H.; Li, M.; Wang, J.; Yang, Y.; Zhang, X.; Yan, G.; Zhang, H.; Liu, J.; Zhang, K. The R2R3 MYB transcription factor PavMYB10.1 involves in anthocyanin biosynthesis and determines fruit skin colour in sweet cherry (Prunus avium L.). Plant Biotechnol. J. 2016, 14, 2120–2133. [Google Scholar] [CrossRef] [PubMed] [Green Version]
  2. Wei, H.; Chen, X.; Zong, X.; Shu, H.; Gao, D.; Liu, Q. Comparative transcriptome analysis of genes involved in anthocyanin biosynthesis in the red and yellow fruits of sweet cherry (Prunus avium L.). PLoS ONE 2015, 10, e0121164. [Google Scholar] [CrossRef] [PubMed]
  3. Khoso, M.A.; Hussain, A.; Ritonga, F.N.; Ali, Q.; Channa, M.M.; Alshegaihi, R.M.; Meng, Q.; Ali, M.; Zaman, W.; Brohi, R.D.; et al. WRKY transcription factors (TFs): Molecular switches to regulate drought, temperature, and salinity stresses in plants. Front. Plant Sci. 2022, 13, 1039329. [Google Scholar] [CrossRef]
  4. Khan, M.; Ali, S.; Manghwar, H.; Saqib, S.; Ullah, F.; Ayaz, A.; Zaman, W. Melatonin Function and Crosstalk with Other Phytohormones under Normal and Stressful Conditions. Genes 2022, 13, 1699. [Google Scholar] [CrossRef]
  5. Su, L.; Rahat, S.; Ren, N.; Kojima, M.; Takebayashi, Y.; Sakakibara, H.; Wang, M.; Chen, X.; Qi, X. Cytokinin and auxin modulate cucumber parthenocarpy fruit development. Sci. Hortic. 2021, 282, 110026. [Google Scholar] [CrossRef]
  6. Kong, M.; Sheng, T.; Liang, J.; Ali, Q.; Gu, Q.; Wu, H.; Chen, J.; Liu, J.; Gao, X. Melatonin and Its Homologs Induce Immune Responses via Receptors trP47363-trP13076 in Nicotiana benthamiana. Front. Plant Sci. 2021, 12, 691835. [Google Scholar] [CrossRef]
  7. Raza, A.; Tabassum, J.; Fakhar, A.Z.; Sharif, R.; Chen, H.; Zhang, C.; Ju, L.; Fotopoulos, V.; Siddique, K.H.M.; Singh, R.K.; et al. Smart reprograming of plants against salinity stress using modern biotechnological tools. Crit. Rev. Biotechnol. 2022, 42, 1–28. [Google Scholar] [CrossRef]
  8. Sharif, R.; Su, L.; Chen, X.; Qi, X. Hormonal interactions underlying parthenocarpic fruit formation in horticultural crops. Hortic. Res. 2022, 9, uhab024. [Google Scholar] [CrossRef]
  9. Michailidis, M.; Karagiannis, E.; Tanou, G.; Karamanoli, K.; Lazaridou, A.; Matsi, T.; Molassiotis, A. Metabolomic and physico-chemical approach unravel dynamic regulation of calcium in sweet cherry fruit physiology. Plant Physiol. Biochem. PPB 2017, 116, 68–79. [Google Scholar] [CrossRef]
  10. Martínez-Esplá, A.; Zapata, P.J.; Valero, D.; García-Viguera, C.; Castillo, S.; Serrano, M. Preharvest application of oxalic acid increased fruit size, bioactive compounds, and antioxidant capacity in sweet cherry cultivars (Prunus avium L.). J. Agric. Food Chem. 2014, 62, 3432–3437. [Google Scholar] [CrossRef]
  11. Mohotti, S.; Rajendran, S.; Muhammad, T.; Strömstedt, A.A.; Adhikari, A.; Burman, R.; de Silva, E.D.; Göransson, U.; Hettiarachchi, C.M.; Gunasekera, S. Screening for bioactive secondary metabolites in Sri Lankan medicinal plants by microfractionation and targeted isolation of antimicrobial flavonoids from Derris scandens. J. Ethnopharmacol. 2020, 246, 112158. [Google Scholar] [CrossRef] [PubMed]
  12. Wang, A.; Li, R.; Ren, L.; Gao, X.; Zhang, Y.; Ma, Z.; Ma, D.; Luo, Y. A comparative metabolomics study of flavonoids in sweet potato with different flesh colors (Ipomoea batatas (L.) Lam). Food Chem. 2018, 260, 124–134. [Google Scholar] [CrossRef] [PubMed]
  13. Casili, G.; Lanza, M.; Campolo, M.; Messina, S.; Scuderi, S.; Ardizzone, A.; Filippone, A.; Paterniti, I.; Cuzzocrea, S.; Esposito, E. Therapeutic potential of flavonoids in the treatment of chronic venous insufficiency. Vasc. Pharmacol. 2021, 137, 106825. [Google Scholar] [CrossRef] [PubMed]
  14. Tanaka, Y.; Brugliera, F.; Chandler, S. Recent progress of flower colour modification by biotechnology. Int. J. Mol. Sci. 2009, 10, 5350–5369. [Google Scholar] [CrossRef]
  15. Pelletier, M.K.; Murrell, J.R.; Shirley, B.W. Characterization of flavonol synthase and leucoanthocyanidin dioxygenase genes in Arabidopsis. Further evidence for differential regulation of “early” and “late” genes. Plant Physiol. 1997, 113, 1437–1445. [Google Scholar] [CrossRef] [Green Version]
  16. Li, X.W.; Li, J.W.; Zhai, Y.; Zhao, Y.; Zhao, X.; Zhang, H.J.; Su, L.T.; Wang, Y.; Wang, Q.Y. A R2R3-MYB transcription factor, GmMYB12B2, affects the expression levels of flavonoid biosynthesis genes encoding key enzymes in transgenic Arabidopsis plants. Gene 2013, 532, 72–79. [Google Scholar] [CrossRef]
  17. Wei, J.; Yang, J.; Jiang, W.; Pang, Y. Stacking triple genes increased proanthocyanidins level in Arabidopsis thaliana. PLoS ONE 2020, 15, e0234799. [Google Scholar] [CrossRef]
  18. Zhang, Q.; Yang, W.; Liu, J.; Liu, H.; Lv, Z.; Zhang, C.; Chen, D.; Jiao, Z. Postharvest UV-C irradiation increased the flavonoids and anthocyanins accumulation, phenylpropanoid pathway gene expression, and antioxidant activity in sweet cherries (Prunus avium L.). Postharvest Biol. Technol. 2021, 175, 111490. [Google Scholar] [CrossRef]
  19. Qi, X.; Liu, C.; Song, L.; Li, M. PaMADS7, a MADS-box transcription factor, regulates sweet cherry fruit ripening and softening. Plant Sci. 2020, 301, 110634. [Google Scholar] [CrossRef]
  20. Dong, Y.; Qi, X.; Liu, C.; Song, L.; Ming, L. A sweet cherry AGAMOUS-LIKE transcription factor PavAGL15 affects fruit size by directly repressing the PavCYP78A9 expression. Sci. Hortic. 2022, 297, 110947. [Google Scholar] [CrossRef]
  21. Wang, J.; Sun, W.; Wang, L.; Liu, X.; Xu, Y.; Sabir, I.A.; Jiu, S.; Wang, S.; Zhang, C. FRUITFULL is involved in double fruit formation at high temperature in sweet cherry. Environ. Exp. Bot. 2022, 201, 104986. [Google Scholar] [CrossRef]
  22. Grabherr, M.G.; Haas, B.J.; Yassour, M.; Levin, J.Z.; Thompson, D.A.; Amit, I.; Adiconis, X.; Fan, L.; Raychowdhury, R.; Zeng, Q.; et al. Full-length transcriptome assembly from RNA-Seq data without a reference genome. Nat. Biotechnol. 2011, 29, 644–652. [Google Scholar] [CrossRef] [PubMed] [Green Version]
  23. Chen, C.; Chen, H.; Yang, W.; Li, J.; Tang, W.; Gong, R. Transcriptomic and Metabolomic Analysis of Quality Changes during Sweet Cherry Fruit Development and Mining of Related Genes. Int. J. Mol. Sci. 2022, 23, 7402. [Google Scholar] [CrossRef] [PubMed]
  24. Fukushima, A.; Kusano, M.; Redestig, H. Integrated omics approaches in plant systems biology. Curr. Opin. Chem. Biol. 2009, 13, 532–538. [Google Scholar] [CrossRef] [PubMed]
  25. Kuhn, N.; Maldonado, J.; Ponce, C.; Arellano, M.; Time, A.; Multari, S.; Martens, S.; Carrera, E.; Donoso, J.M.; Sagredo, B.; et al. RNAseq reveals different transcriptomic responses to GA3 in early and midseason varieties before ripening initiation in sweet cherry fruits. Sci. Rep. 2021, 11, 13075. [Google Scholar] [CrossRef]
  26. Li, Y.K.; Fang, J.B.; Qi, X.J.; Lin, M.M.; Zhong, Y.P.; Sun, L.M.; Cui, W. Combined analysis of the fruit metabolome and transcriptome reveals candidate genes involved in flavonoid biosynthesis in Actinidia arguta. Int. J. Mol. Sci. 2018, 19, 1471. [Google Scholar] [CrossRef] [Green Version]
  27. Kleessen, S.; Irgang, S.; Klie, S.; Giavalisco, P.; Nikoloski, Z. Integration of transcriptomics and metabolomics data specifies Chlamydomonas’ metabolic response to rapamycin tratment. Plant J. 2015, 81, 822–835. [Google Scholar] [CrossRef]
  28. Glaubitz, U.; Li, X.; Schaedel, S.; Erban, A.; Sulpice, R.; Kopka, J.; Hincha, D.K.; Zuther, E. Integrated analysis of rice transcriptomic and metabolomic responses to elevated night temperatures identifies sensitivity- and tolerance-related profiles: Integrated profiling analysis of rice under HNT. Plant Cell Environ. 2017, 40, 121–137. [Google Scholar] [CrossRef]
  29. Hunter, D.A.; Napier, N.J.; Erridge, Z.A.; Saei, A.; Chen, R.K.Y.; McKenzie, M.J.; O’Donoghue, E.M.; Hunt, M.; Favre, L.; Lill, R.E.; et al. Transcriptome Responses of Ripe Cherry Tomato Fruit Exposed to Chilling and Rewarming Identify Reversible and Irreversible Gene Expression Changes. Front. Plant Sci. 2021, 12, 685416. [Google Scholar] [CrossRef]
  30. Cho, K.; Cho, K.S.; Sohn, H.B.; Ha, I.J.; Hong, S.Y.; Lee, H.; Kim, Y.M.; Nam, M.H. Network analysis of the metabolome and transcriptome reveals novel regulation of potato pigmentation. J. Exp. Bot. 2016, 67, 1519. [Google Scholar] [CrossRef] [Green Version]
  31. Wu, Q.; Wu, J.; Li, S.S.; Zhang, H.J.; Feng, C.Y.; Yin, D.D.; Wu, R.Y.; Wang, L.S. Transcriptome sequencing and metabolite analysis for revealing the blue flower formation in waterlily. BMC Genom. 2016, 17, 897. [Google Scholar] [CrossRef] [Green Version]
  32. Liu, G.F.; Han, Z.X.; Feng, L.; Gao, L.P.; Gao, M.J.; Gruber, M.Y.; Zhang, Z.L.; Xia, T.; Wan, X.C.; Wei, S. Metabolic flux redirection and transcriptomic reprogramming in the albino tea cultivar ‘Yu-Jin-Xiang’ with an emphasis on catechin production. Sci. Rep. 2017, 7, 45062. [Google Scholar] [CrossRef] [Green Version]
  33. Zhu, G.T.; Wang, S.C.; Huang, Z.J.; Zhang, S.B.; Liao, Q.G.; Zhang, C.Z.; Lin, T.; Qin, M.; Peng, M.; Yang, C.K.; et al. Rewiring of the fruit metabolome in tomato breeding. Cell 2018, 172, 249–261.e12. [Google Scholar] [CrossRef] [Green Version]
  34. Islam, M.A.U.; Nupur, J.A.; Khalid, M.H.B.; Din, A.M.U.; Shafiq, M.; Alshegaihi, R.M.; Ali, Q.; Ali, Q.; Kamran, Z.; Manzoor, M.; et al. Genome-Wide Identification and In Silico Analysis of ZF-HD Transcription Factor Genes in Zea mays L. Genes 2022, 13, 2112. [Google Scholar] [CrossRef]
  35. Poux, S.; Arighi, C.N.; Magrane, M.; Bateman, A.; Wei, C.H.; Lu, Z.; Boutet, E.; Bye, A.J.H.; Famiglietti, M.L.; Roechert, B.; et al. On expert curation and scalability: UniProtKB/Swiss-Prot as a case study. Bioinformatics 2017, 33, 3454–3460. [Google Scholar] [CrossRef] [Green Version]
  36. Ashburner, M.; Ball, C.A.; Blake, J.A.; Botstein, D.; Butler, H.; Cherry, J.M.; Davis, A.P.; Dolinski, K.; Dwight, S.S.; Eppig, J.T.; et al. Gene ontology: Tool for the unification of biology. The Gene Ontology Consortium. Nat. Genet. 2000, 25, 25–29. [Google Scholar] [CrossRef] [Green Version]
  37. Kanehisa, M.; Goto, S.; Kawashima, S.; Okuno, Y.; Hattori, M. The KEGG resource for deciphering the genome. Nucleic Acids Res. 2004, 32, D277–D280. [Google Scholar] [CrossRef] [Green Version]
  38. Trapnell, C.; Williams, B.A.; Pertea, G.; Mortazavi, A.; Kwan, G.; van Baren, M.J.; Salzberg, S.L.; Wold, B.J.; Pachter, L. Transcript assembly and quantification by RNA-Seq reveals unannotated transcripts and isoform switching during cell differentiation. Nat. Biotechnol. 2010, 28, 511–515. [Google Scholar] [CrossRef] [Green Version]
  39. Fraga, C.G.; Clowers, B.H.; Moore, R.J.; Zink, E.M. Signature-discovery approach for sample matching of a nerve-agent precursor using liquid chromatography-mass spectrometry, XCMS, and chemometrics. Anal. Chem. 2010, 82, 4165–4173. [Google Scholar] [CrossRef]
  40. Wang, M.; Avula, B.; Wang, Y.H.; Zhao, J.; Avonto, C.; Parcher, J.F.; Raman, V.; Zweigenbaum, J.A.; Wylie, P.L.; Khan, I.A. An integrated approach utilising chemometrics and GC/MS for classification of chamomile flowers, essential oils and commercial products. Food Chem. 2014, 152, 391–398. [Google Scholar] [CrossRef]
  41. Guo, H.H.; Guo, H.X.; Zhang, L.; Tang, Z.M.; Yu, X.M.; Wu, J.F.; Zeng, F.C. Metabolome and transcriptome association analysis reveals dynamic regulation of purine metabolism and flavonoid synthesis in transdifferentiation during somatic embryogenesis in cotton. Int. J. Mol. Sci. 2019, 20, 2070. [Google Scholar] [CrossRef] [Green Version]
  42. Hall, R.; Beale, M.; Fiehn, O.; Hardy, N.; Sumner, L.; Bino, R. Plant metabolomics: The missing link in functional genomics strategies. Plant Cell 2002, 14, 1437–1440. [Google Scholar] [CrossRef] [Green Version]
  43. Jalal, A.; Ali, Q.; Manghwar, H.; Zhu, D. Identification, Phylogeny, Divergence, Structure, and Expression Analysis of A20/AN1 Zinc Finger Domain Containing Stress-Associated Proteins (SAPs) Genes in Jatropha curcas L. Genes 2022, 13, 1766. [Google Scholar] [CrossRef]
  44. Mehrtens, F.; Kranz, H.; Bednarek, P.; Weisshaar, B. The Arabidopsis transcription factor MYB12 is a flavonol-specific regulator of phenylpropanoid biosynthesis. Plant Physiol. 2005, 138, 1083–1096. [Google Scholar] [CrossRef] [Green Version]
  45. Liu, J.; Osbourn, A.; Ma, P. MYB Transcription Factors as Regulators of Phenylpropanoid Metabolism in Plants. Mol. Plant 2015, 8, 689–708. [Google Scholar] [CrossRef] [Green Version]
  46. Xu, W.; Dubos, C.; Lepiniec, L. Transcriptional control of flavonoid biosynthesis by MYB-bHLH-WDR complexes. Trends Plant Sci. 2015, 20, 176–185. [Google Scholar] [CrossRef] [PubMed]
  47. Wang, Z.; Yu, Q.; Shen, W.; El Mohtar, C.A.; Zhao, X.; Gmitter, F.G., Jr. Functional study of CHS gene family members in citrus revealed a novel CHS gene affecting the production of flavonoids. BMC Plant Biol. 2018, 18, 189. [Google Scholar] [CrossRef]
  48. Chen, C.; Zhou, G.; Chen, J.; Liu, X.; Lu, X.; Chen, H.; Tian, Y. Integrated Metabolome and Transcriptome Analysis Unveils Novel Pathway Involved in the Formation of Yellow Peel in Cucumber. Int. J. Mol. Sci. 2021, 22, 1494. [Google Scholar] [CrossRef] [PubMed]
  49. Wang, Z.; Pu, H.; Shan, S.; Zhang, P.; Li, J.; Song, H.; Xu, X. Melatonin enhanced chilling tolerance and alleviated peel browning of banana fruit under low temperature storage. Postharvest Biol. Technol. 2021, 179, 111571. [Google Scholar] [CrossRef]
  50. Sivankalyani, V.; Feygenberg, O.; Diskin, S.; Wright, B.; Alkan, N. Increased anthocyanin and flavonoids in mango fruit peel are associated with cold and pathogen resistance. Postharvest Biol. Technol. 2016, 111, 132–139. [Google Scholar] [CrossRef]
  51. Naeem, M.; Shahzad, K.; Saqib, S.; Shahzad, A.; Nasrullah; Younas, M.; Afridi, M.I. The Solanum melongena COP1LIKE manipulates fruit ripening and flowering time in tomato (Solanum lycopersicum). Plant Growth Regul. 2022, 96, 369–382. [Google Scholar] [CrossRef]
  52. Shen, N.; Wang, T.; Gan, Q.; Liu, S.; Wang, L.; Jin, B. Plant flavonoids: Classification, distribution, biosynthesis, and antioxidant activity. Food Chem. 2022, 383, 132531. [Google Scholar] [CrossRef] [PubMed]
  53. He, X.; Huang, R.; Liu, L.; Li, Y.; Wang, W.; Xu, Q.; Yu, Y.; Zhou, T. CsUGT78A15 catalyzes the anthocyanidin 3-O-galactoside biosynthesis in tea plants. Plant Physiol. Biochem. PPB 2021, 166, 738–749. [Google Scholar] [CrossRef] [PubMed]
  54. Ranganath, K.G.; Shivashankara, K.S.; Roy, T.K.; Dinesh, M.R.; Geetha, G.A.; Pavithra, K.C.; Ravishankar, K.V. Profiling of anthocyanins and carotenoids in fruit peel of different colored mango cultivars. J. Food Sci. Technol. 2018, 55, 4566–4577. [Google Scholar] [CrossRef]
  55. Liu, Y.; Tikunov, Y.; Schouten, R.E.; Marcelis, L.F.M.; Visser, R.G.F.; Bovy, A. Anthocyanin Biosynthesis and Degradation Mechanisms in Solanaceous Vegetables: A Review. Front. Chem. 2018, 6, 52. [Google Scholar] [CrossRef]
  56. Zhang, Q.; Wang, L.; Liu, Z.; Zhao, Z.; Zhao, J.; Wang, Z.; Zhou, G.; Liu, P.; Liu, M. Transcriptome and metabolome profiling unveil the mechanisms of Ziziphus jujuba Mill. peel coloration. Food Chem. 2020, 312, 125903. [Google Scholar] [CrossRef]
  57. Feller, A.; Machemer, K.; Braun, E.L.; Grotewold, E. Evolutionary and comparative analysis of MYB and bHLH plant transcription factors. Plant J. Cell Mol. Biol. 2011, 66, 94–116. [Google Scholar] [CrossRef]
  58. Wang, X.-Y.; Tian, L.; Feng, S.-J.; Wei, A.-Z. Identifying potential flavonoid biosynthesis regulator in Zanthoxylum bungeanum Maxim. by genome-wide characterization of the MYB transcription factor gene family. J. Integr. Agric. 2022, 21, 1997–2018. [Google Scholar] [CrossRef]
  59. Zhu, L.; Guan, Y.; Zhang, Z.; Song, A.; Chen, S.; Jiang, J.; Chen, F. CmMYB8 encodes an R2R3 MYB transcription factor which represses lignin and flavonoid synthesis in chrysanthemum. Plant Physiol. Biochem. 2020, 149, 217–224. [Google Scholar] [CrossRef]
  60. Zhu, J.-H.; Xia, D.-N.; Xu, J.; Guo, D.; Li, H.-L.; Wang, Y.; Mei, W.-L.; Peng, S.-Q. Identification of the bHLH gene family in Dracaena cambodiana reveals candidate genes involved in flavonoid biosynthesis. Ind. Crops Prod. 2020, 150, 112407. [Google Scholar] [CrossRef]
  61. Arlotta, C.; Puglia, G.D.; Genovese, C.; Toscano, V.; Karlova, R.; Beekwilder, J.; De Vos, R.C.H.; Raccuia, S.A. MYB5-like and bHLH influence flavonoid composition in pomegranate. Plant Sci. 2020, 298, 110563. [Google Scholar] [CrossRef] [PubMed]
  62. Li, H.; Yang, Z.; Zeng, Q.; Wang, S.; Luo, Y.; Huang, Y.; Xin, Y.; He, N. Abnormal expression of bHLH3 disrupts a flavonoid homeostasis network, causing differences in pigment composition among mulberry fruits. Hortic. Res. 2020, 7, 83. [Google Scholar] [CrossRef] [PubMed]
  63. Naik, J.; Misra, P.; Trivedi, P.K.; Pandey, A. Molecular components associated with the regulation of flavonoid biosynthesis. Plant Sci. 2022, 317, 111196. [Google Scholar] [CrossRef] [PubMed]
  64. Fiehn, O.; Kopka, J.; Dormann, P.; Altmann, T.; Trethewey, R.N.; Willmitzer, L. Metabolite profiling for plant functional genomics. Nat. Biotechnol. 2000, 18, 1157–1161. [Google Scholar] [CrossRef]
  65. Liu, Y.; Lv, J.; Liu, Z.; Wang, J.; Yang, B.; Chen, W.; Ou, L.; Dai, X.; Zhang, Z.; Zou, X. Integrative analysis of metabolome and transcriptome reveals the mechanism of color formation in pepper fruit (Capsicum annuum L.). Food Chem. 2020, 306, 125629. [Google Scholar] [CrossRef]
  66. Appelhagen, I.; Lu, G.H.; Huep, G.; Schmelzer, E.; Weisshaar, B.; Sagasser, M. TRANSPARENT TESTA1 interacts with R2R3-MYB factors and affects early and late steps of flavonoid biosynthesis in the endothelium of Arabidopsis thaliana seeds. Plant J. Cell Mol. Biol. 2011, 67, 406–419. [Google Scholar] [CrossRef]
Figure 1. DEGs between young “Green Peel” and mature “Red Peel” sweet cherries. (A) Photograph of red peel, yellow peel and red peel sweet cherries; (B) Bar plot of DEGs; (C) As illustrated in the volcano plot, the difference in the expression level of genes displays statistical significance between the two groups of samples.
Horticulturae 09 00463 g001
Figure 2. GO enrichment analysis (A) and KEGG enrichment analysis (B) of DEGs. The modules only illustrate the top 20 pathways showing the most pronounced enrichment.
Horticulturae 09 00463 g002
Figure 3. DEM profile. (A) PCA score map; (B) Comparison of DEMs between young “Green Peel” and mature “Red Peel” sweet cherry trees; (C) Volcano plot of DEMs.
Horticulturae 09 00463 g003
Figure 4. The pie chart shows the number of transcription factors.
Horticulturae 09 00463 g004
Figure 5. Principal component analysis (PCA) analysis of RNA−seq between the cultivars. Co-expression analysis of structural genes of anthocyanin, flavonoid, flavone, and flavanol biosynthesis pathways and transcription factors (TFs) in the RP and GP. (A) Clustering correlation heatmap with structural genes and metabolites using the OmicStudio tools; (B)The correlation networks of structural genes and metabolites anthocyanin, flavonoid, flavone, and flavanol biosynthesis.
Horticulturae 09 00463 g005aHorticulturae 09 00463 g005b
Figure 6. The qRT-PCR validation for 8 TFs. (A) Pav_sc0000465.1-g950.1.mk; (B) Pav_sc0000376.1-g510.1.mk; (C) Pav_sc0000507.1-g030.1.mk; (D) Pav_sc0001621.1-g010.1.mk; (E) Pav_sc0000143.1-g500.1.mk; (F) Pav_sc0003094.1-g080.1.mk; (G) Pav_sc0000094.1-g220.1.mk; (H) Pav_sc0004290.1-g270.1.mk. The histogram bars represent the means ± SE. All the data were calculated with three technical replicates, and the statistical significance was set at p < 0.05.
Horticulturae 09 00463 g006
Table 1. Omics data integration of transcriptome and metabolome yields 44 DEGs in anthocyanin, flavonoid, and flavone and flavonol biosynthesis pathways.
Pathway_idPathway_NameGene_IDDescriptionRegulation
ko00942Anthocyanin biosynthesisPav_sc0000138.1_g030.1.mkanthocyanidin 3-O-glucosyltransferase 2-like [Prunus avium]down
ko00942Anthocyanin biosynthesisPav_sc0001323.1_g080.1.brUDP-glycosyltransferase 88F5-like [Prunus avium]down
ko00942Anthocyanin biosynthesisPav_sc0001323.1_g100.1.brUDP-glycosyltransferase 88F5-like [Prunus avium]down
ko00942Anthocyanin biosynthesisPav_sc0001323.1_g110.1.brUDP-glycosyltransferase 88F5-like [Prunus avium]down
ko00942Anthocyanin biosynthesisPav_sc0001323.1_g140.1.mkLOW QUALITY PROTEIN: UDP-glycosyltransferase 88F5-like [Prunus avium]down
ko00941Flavonoid biosynthesisPav_sc0000030.1_g1340.1.mkflavonol synthase/flavanone 3-hydroxylase-like [Prunus avium]up
ko00941Flavonoid biosynthesisPav_sc0000044.1_g550.1.mknaringenin,2-oxoglutarate 3-dioxygenase [Prunus avium]down
ko00941Flavonoid biosynthesisPav_sc0000045.1_g280.1.mkchalcone synthase [Prunus avium]down
ko00941Flavonoid biosynthesisPav_sc0000091.1_g560.1.mkELMO domain-containing protein A [Prunus avium]up
ko00941Flavonoid biosynthesisPav_sc0000100.1_g580.1.mkprotein ECERIFERUM 26-like [Prunus avium]up
ko00941Flavonoid biosynthesisPav_sc0000107.1_g100.1.mkleucoanthocyanidin dioxygenase [Prunus avium]down
ko00941Flavonoid biosynthesisPav_sc0000143.1_g510.1.mkprobable 2-oxoglutarate-dependent dioxygenase At5g05600 [Prunus avium]up
ko00941Flavonoid biosynthesisPav_sc0000206.1_g540.1.mktrans-cinnamate 4-monooxygenase [Prunus avium]down
ko00941Flavonoid biosynthesisPav_sc0000358.1_g010.1.mkflavonoid-3′-hydroxylase, partial [Prunus avium]down
ko00941Flavonoid biosynthesisPav_sc0000398.1_g280.1.mkputative anthocyanidin reductase [Prunus avium]down
ko00941Flavonoid biosynthesisPav_sc0000465.1_g590.1.mkcodeine O-demethylase-like [Prunus avium]up
ko00941Flavonoid biosynthesisPav_sc0000465.1_g880.1.brcodeine O-demethylase-like [Prunus avium]down
ko00941Flavonoid biosynthesisPav_sc0000554.1_g2230.1.mkprobable LRR receptor-like serine/threonine-protein kinase MEE39 [Prunus avium]down
ko00941Flavonoid biosynthesisPav_sc0000791.1_g230.1.brBAHD acyltransferase At5g47980-like [Prunus avium]up
ko00941Flavonoid biosynthesisPav_sc0000877.1_g1900.1.brflavonoid 3′-monooxygenase [Prunus avium]down
ko00941Flavonoid biosynthesisPav_sc0001003.1_g370.1.mkvacuolar-sorting receptor 7 isoform X2 [Prunus avium]up
ko00941Flavonoid biosynthesisPav_sc0001196.1_g1060.1.mkcytochrome P450 98A2-like isoform X1 [Prunus avium]down
ko00941Flavonoid biosynthesisPav_sc0001196.1_g1070.1.brcytochrome P450 98A2-like isoform X1 [Prunus avium]down
ko00941Flavonoid biosynthesisPav_sc0001196.1_g1090.1.mkcytochrome P450 98A2-like [Prunus avium]up
ko00941Flavonoid biosynthesisPav_sc0001196.1_g1100.1.mkcytochrome P450 98A2 [Prunus persica]down
ko00941Flavonoid biosynthesisPav_sc0001217.1_g200.1.mkprotein DMR6-LIKE OXYGENASE 2-like [Prunus avium]down
ko00941Flavonoid biosynthesisPav_sc0001345.1_g040.1.mkprobable 2-oxoglutarate-dependent dioxygenase At3g111800 [Prunus avium]up
ko00941Flavonoid biosynthesisPav_sc0001545.1_g080.1.mkhypothetical protein PRUPE_4G029700 [Prunus persica]down
ko00941Flavonoid biosynthesisPav_sc0002208.1_g840.1.mkbifunctional dihydroflavonol 4-reductase/flavanone 4-reductase [Prunus avium]down
ko00941Flavonoid biosynthesisPav_sc0002479.1_g160.1.brvinorine synthase-like [Prunus avium]down
ko00941Flavonoid biosynthesisPav_sc0002479.1_g170.1.bruncharacterized protein Pyn_04376 [Prunus yedoensis var. nudiflora]up
ko00941Flavonoid biosynthesisPav_sc0002479.1_g520.1.brvinorine synthase-like [Prunus avium]up
ko00941Flavonoid biosynthesisPav_sc0003685.1_g130.1.mkleucoanthocyanidin reductase [Prunus avium]down
ko00941Flavonoid biosynthesisPav_sc0005746.1_g030.1.mkprobable chalcone—flavonone isomerase 3 [Prunus avium]down
ko00941Flavonoid biosynthesisPav_sc0009537.1_g010.1.mkchalcone synthase [Prunus yedoensis var. nudiflora]down
ko00944Flavone and flavonol biosynthesisPav_sc0000023.1_g010.1.brphenolic glucoside malonyltransferase 1-like [Prunus avium]up
ko00944Flavone and flavonol biosynthesisPav_sc0000023.1_g130.1.brphenolic glucoside malonyltransferase 1-like [Prunus avium]up
ko00944Flavone and flavonol biosynthesisPav_sc0000023.1_g140.1.brphenolic glucoside malonyltransferase 1-like [Prunus avium]up
ko00944Flavone and flavonol biosynthesisPav_sc0000308.1_g350.1.mkflavonoid 3-O-glucosyltransferase-like [Prunus avium]up
ko00944Flavone and flavonol biosynthesisPav_sc0000308.1_g360.1.mkflavonoid 3-O-glucosyltransferase-like [Prunus avium]down
ko00944Flavone and flavonol biosynthesisPav_sc0000358.1_g010.1.mkflavonoid-3′-hydroxylase, partial [Prunus avium]down
ko00944Flavone and flavonol biosynthesisPav_sc0000588.1_g030.1.mkUDP-glycosyltransferase 89A2-like [Prunus avium]down
ko00944Flavone and flavonol biosynthesisPav_sc0000877.1_g1900.1.brflavonoid 3′-monooxygenase [Prunus avium]down
ko00944Flavone and flavonol biosynthesisPav_sc0002358.1_g100.1.brphenolic glucoside malonyltransferase 1-like [Prunus avium]up
Table 2. Omics data integration of transcriptome and metabolome yielded DEMs in anthocyanin, flavonoid, and flavone and flavanol biosynthesis pathways.
Pathway IDRegulatedMS2 MetaboliteMS2 SuperclassMS2 ClassMS2 KEGG
map00941down(+)-CatechinPhenylpropanoids and polyketidesFlavonoidsC06562
map00941downEpicatechinPhenylpropanoids and polyketidesFlavonoidsC09727
map00941downMyricetinPhenylpropanoids and polyketidesFlavonoidsC10107
map00944downRhoifolinPhenylpropanoids and polyketidesFlavonoidsC12627
map00944upRUTINPhenylpropanoids and polyketidesFlavonoidsC05625
map00944downMyricetinPhenylpropanoids and polyketidesFlavonoidsC10107
map00942downKeracyaninPhenylpropanoids and polyketidesFlavonoidsC08620
Disclaimer/Publisher’s Note: The statements, opinions and data contained in all publications are solely those of the individual author(s) and contributor(s) and not of MDPI and/or the editor(s). MDPI and/or the editor(s) disclaim responsibility for any injury to people or property resulting from any ideas, methods, instructions or products referred to in the content.

