Article

A Simple Method for Drip Irrigation Scheduling of Spinach (Spinacia oleracea L.) in a Plastic Greenhouse in the North China Plain Using a 20 Cm Standard Pan Outside the Greenhouse

1
Key Laboratory of Agricultural Water Resources, Center for Agricultural Resources Research, Institute of Genetics and Developmental Biology, Chinese Academy of Sciences, Shijiazhuang 050021, China
2
School of Chemical Engineering, Shijiazhuang University, Shijiazhuang 050035, China
3
The Institute of Agricultural Information and Economics (IAIE), Hebei Academy of Agriculture and Forestry Sciences, Shijiazhuang 050051, China
*
Author to whom correspondence should be addressed.
Horticulturae 2023, 9(6), 706; https://doi.org/10.3390/horticulturae9060706
Submission received: 9 May 2023 / Revised: 8 June 2023 / Accepted: 13 June 2023 / Published: 16 June 2023
(This article belongs to the Section Vegetable Production Systems)

Abstract

:
The objective of this paper is to perform drip irrigation scheduling for spinach (Spinacia oleracea L.) in a plastic greenhouse using the standard 20 cm evaporation pan. A drip irrigation experiment with four levels of irrigation, i.e., 0.6, 0.8, 1.0, and 1.2 times the cumulative evaporation of a 20 cm standard pan (Epan) were set up. The irrigation interval was controlled using a 20 mm Epan, and optimal irrigation water amounts of 0.8 Epan and 0.6 Epan were recommended for the spring and autumn growing seasons, respectively. Overirrigation (1.2 Epan) also led to yield losses, particularly for stem growth. In addition, a proper greenhouse index, defined as the ratio of the cumulative Epan inside and outside the greenhouse, could predict the Epan inside the greenhouse using the external Epan to a high degree of accuracy (daily data with r2 = 0.85, root mean square error (RMSE = 0.68 mm d−1), for a 4-day interval with r2 = 0.95, RMSE = 1.81 mm 4 day−1, and for the entire growth period with r2 = 1.0, RMSE = 2.40 mm). A simple and low-cost greenhouse index method could be used to formulate drip irrigation schedules for spinach in low-technology plastic greenhouses using a 20 cm standard pan outside the greenhouse.

1. Introduction

The North China Plain (NCP) is suffering rapid groundwater descent, which is the biggest threat to sustainable socioeconomic development [1]. Previously, agricultural water use was the main reason for groundwater recession. However, vegetable cultivation is expanding in this region, and intensive vegetable cropping systems use large amounts of water [1]. The misuse of water in conventional vegetable production systems can cause water waste, higher costs of production, and negative environmental problems [2]. Increasing water use efficiency (WUE) should be a premise for sustainable horticulture, which depends on applying efficient irrigation technology, including precision irrigation scheduling (IS) [3]. Nevertheless, compared to stable food crops, vegetable crops, especially leafy vegetables, are generally more sensitive to water limitation mainly for their shallow roots and succulence. Accurate IS, providing appropriate water at the right time to meet optimum crop growth, is critical to improve WUE and decrease nutrient leaching in intensive vegetable production systems. Compared with conventional practice, the improved IS probably saved half of the water and labor use and improved WUE 2–3-fold [4].
Four methods are commonly used to achieve efficient irrigation scheduling: (1) evapotranspiration and water balance, (2) soil moisture status, (3) plant water status, and (4) models [5]. Each method has its advantages and disadvantages [3]. Precision irrigation using several sensors to determine soil and plant water status is still expensive. Although soil moisture sensors are available for deciding when to irrigate vegetables, they are less helpful for predicting how much water to supply [5]. Therefore, an accurate prediction of actual crop evapotranspiration (ET) is the premise for a reasonable irrigation schedule. The FAO-56 methodology proposed by Allen et al. [6] is the most commonly used approach for irrigation water management [7]. ET is determined by multiplying the reference evapotranspiration (ETo) and the crop coefficient (Kc). Crop coefficients for most major vegetable crops were summarized by Allen et al. [6] and Guerra et al. [8]. Updated data were generalized by Pereira et al. [7]. However, crop coefficients are often crop-specific and year-specific and depend on growth stages, regional meteorological conditions, and agricultural practices such as irrigation and fertilization [9]. Kc values change with the soil coverage by the crop canopy and thus affects the leaf area index (LAI). Therefore, it is necessary to estimate the local Kc for better prediction of net crop water requirements [10]. Therefore, Kc must be determined experimentally.
Many studies have shown that pan evaporation is a competitive candidate for formulating an irrigation schedule as a simple and easy approach [11]. The irrigation scheduling approach using pan evaporation was adopted due to its simplicity, data availability, and high flexibility at the farmers’ side [12]. A pan of 20 cm diameter (20 cm diameter, 11 cm depth) is a standard evaporimeter because of its low cost, small size, easy transportation, and simple measurement. It is widely used in weather meteorological stations in China. The pan method was used to optimize irrigation for lettuce [13] and cabbage production [14].
Spinach (Spinacia oleracea L.) is a popular leafy vegetable planted all over the world due to its high nutritive value. Spinach is very sensitive to water stress and therefore requires precision irrigation. Many studies on irrigation scheduling and Kc of spinach have been conducted in sprinkler irrigation [15], pot experiments [16], or open fields [15]. Previous irrigation work conducted on spinach mostly focusing on physiological and chemical composition changes such as affected water regimes [17,18,19], waste water or saline water irrigation [20], model calibration and validation for predicting crop water requirement [21], and the nutrient and water coupling effect [22]. The seasonal water supply and marketable spinach yield presented quadratic relationships [12]. In the North China Plain, new water-saving technologies such as drip irrigation and sprinkle irrigation are adopted in the greenhouse production system because of labor and water savings and government promotion policies. Compared to sprinkler irrigation, drip irrigation has the potential to be used to produce organic spinach, save water, improve WUE, control downy mildew, and reduce nitrate leaching more stably [23]. Many farmers still estimate crop water requirements and irrigation time empirically. Overwatering is common in practice and is not beneficial to improvements in yield and WUE. New precision irrigation scheduling of drip irrigation on the field level is not set up following irrigation system changes. In this paper, an attempt was made to develop scientific drip irrigation scheduling based on accumulative pan evaporation (Epan) measured using a standard 20 cm pan to assist farmers in the effective utilization of water resources in greenhouse spinach production. Additionally, the FAO-56 “single crop coefficient” method was designed and applied. Changes in Kc over the whole spinach growth period and the relationship between Epan and the reference evaporation (ETo) were also discussed. The possibility of scheduling drip irrigation for spinach in a plastic greenhouse using an outdoor 20 cm pan was also investigated in this paper.

2. Materials and Methods

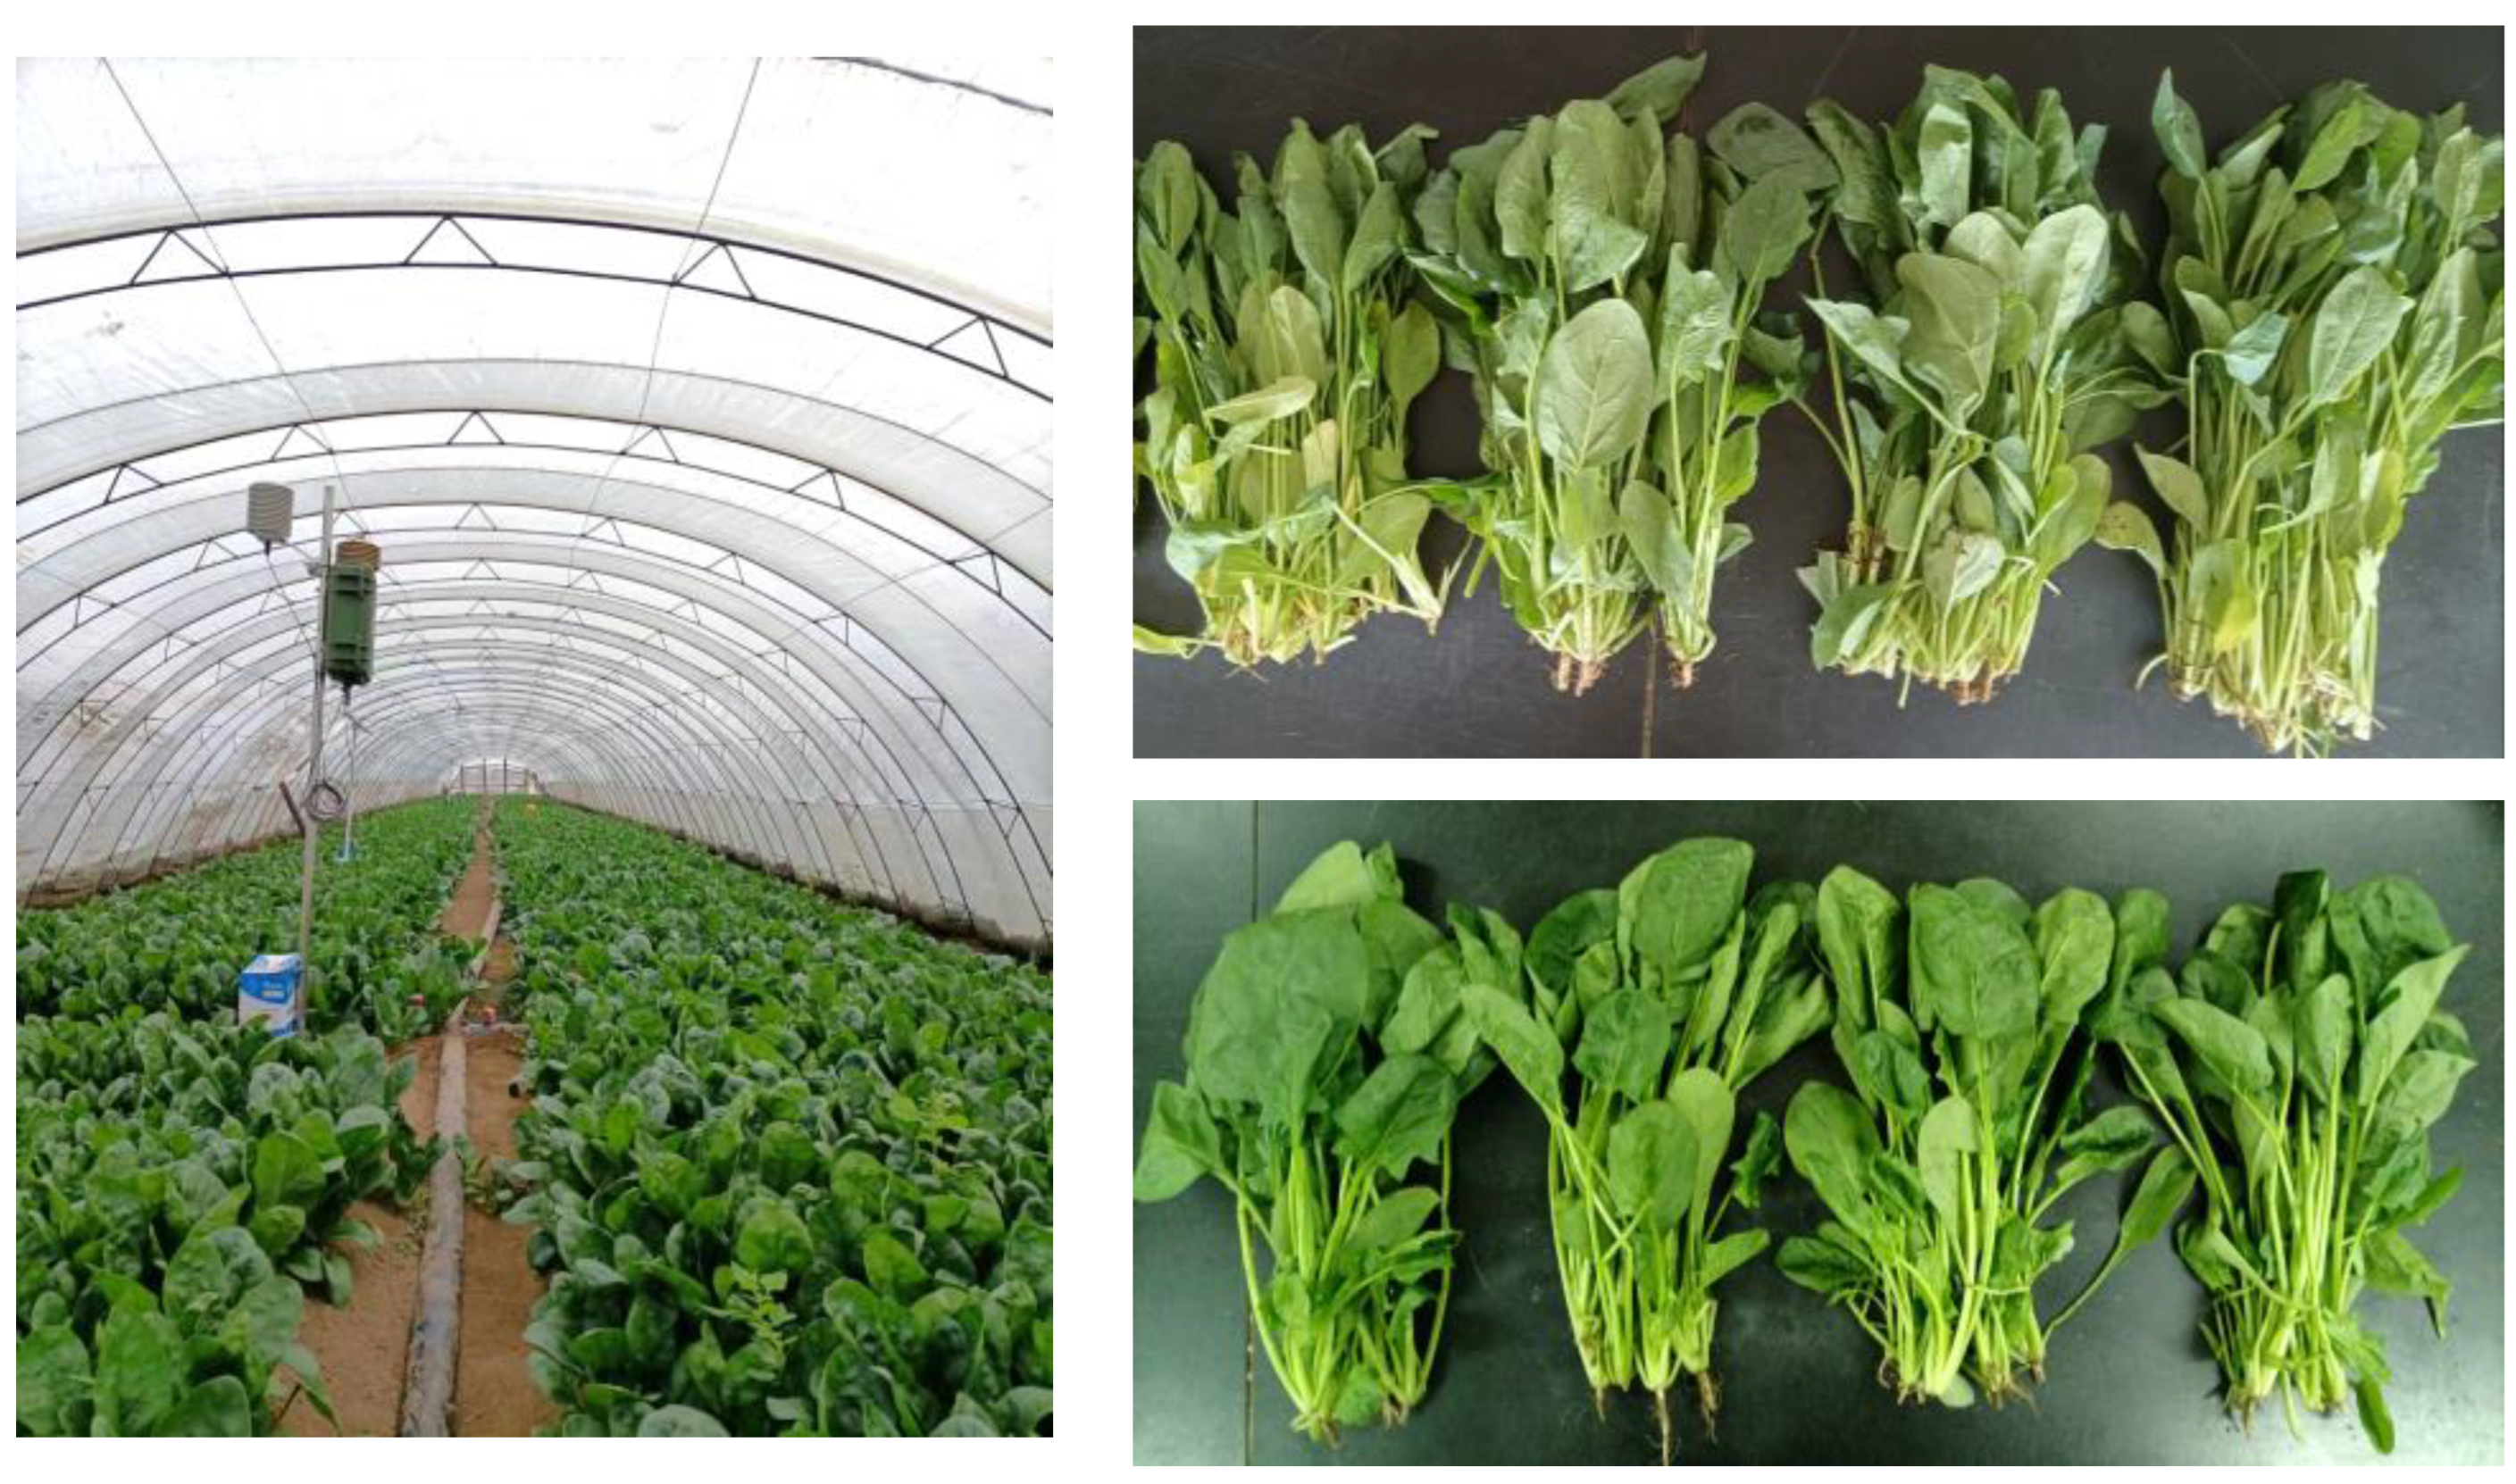
2.1. Experimental Site

This experiment was conducted in a 75 m long and 6 m wide plastic greenhouse located in Fantai village near the Luancheng AgroEcosystem Experimental Station in Hebei Province (37°53′ N, 114°41′E; elevation 50 m above sea level), China. The experimental station is situated in a semiarid monsoon climate region. Three soil samples were collected randomly inside the greenhouse according to the S-shaped curve. The physical and chemical characters of 0–20 cm soil were determined by Bao et al. [24]. The soil at the experimental site is sandy loam with a pH (H2O) of 7.5. The soil is classified as silt loam Haplic Cambisol [25]. The soil organic matter content is 19.0 g kg−1, total nitrogen is 1.29 g kg−1, available phosphorus (P-Olsen) is 368.4 mg kg−1, and available potassium is 531.2 mg kg−1 in the top 0–20 cm soil layer. The soil bulk densities through cutting ring method for the 0–20, 20–40, and 40–60 cm layers were 1.25 g cm−3, 1.73 g cm−3, and 1.62 g cm−3, respectively. The annual average temperature was 12.3 °C, and the annual average precipitation was 481 mm.

2.2. Experimental Design

Two seasons of spinach field experiments, including the spring (12 May to 12 June 2022) and autumn seasons (21 September to 28 October 2022), were carried out in a plastic greenhouse. The greenhouses were arched single-span structures with side openings only, covered with plastic film on the roof and with a 70-mesh insect net at a height of 1 m on the side, with an area of 380 m2. Thus, the microclimate conditions followed the outside conditions through natural ventilation. The horizontal sidewalls were opened to 1 m height when the maximum air temperature in the greenhouse was >30 °C. The arched doorways at a height of 2 m positioned along the N–S axis were kept open during the whole experimental time. A complete randomized experimental design was used with different irrigation amounts with four replicates. Each replicate plot was 2.5 m× 6 m in size, and the spacing between adjacent plots was 2 m to avoid mutual influence of water infiltration.
Spinach is a cool-season leafy vegetable. In order to acclimatize the climate condition changes to achieve optimal growth, a special heat-tolerant spinach cultivar named “Shengxialv” and a common spinach cultivar called “Qianlaisi” in Hebei Province were manually sown in May and September for the spring and autumn seasons, respectively. Spinach was sown at a seeding rate of 30 kg ha−1 in a stripe with a 15 cm linewidth. Plant density was controlled at approximately 200 plants per square meter. Fertilizer N (urea) was uniformly applied two times during each experimental season, first as basal fertilizer at 75 kg ha−1 when the soil was plowed and second as top-dressing fertilizer at 150 kg N ha−1 with irrigation at the six- or seven-leaf stage. No phosphorus or potassium fertilizer was applied due to high fertility for long-term vegetable planting. Other agricultural management practices, including pesticide and herbicide applications, were the same as those used for high-yield spinach production in local regions in both seasons. The spinach growing in the plastic greenhouse is shown in Figure 1.
A drip irrigation system was set up before the experiment. The drip irrigation system included a main pipeline water delivery system and plot water delivery systems. The drip tape (ϕ16 mm) with two droppers in 20 cm in the plot was installed along the center of each row [26]. The distance between the two drip lines was 30 cm. The drip tape flow rate of each dropper was approximately 2.0 L per hour. A water meter at the inlet of the pipe recorded the water used.
After sowing, a 20 cm standard evaporation pan (ϕ200) was placed on a platform in the center of the greenhouse. Pan evaporation above the canopy in the greenhouse (Epan-in) was determined manually using a glass-graduated flask at 20:00 h daily. The pan was cleaned after the measurement and filled with 20 mm fresh water according to the standard of water surface evaporation measurement. Irrigation time and amounts were determined by the cumulative evaporation of the ϕ200 pan. Four irrigation levels, i.e., four pan coefficients (Kpan), 0.6, 0.8, 1.0, and 1.2, were set in the experiment, and the corresponding treatments were labeled T1, T2, T3, and T4, respectively. The irrigation frequency was set up on the Epan-in with a critical value of 20 mm, and the irrigation quantity of each application was decided by Epan-in multiplied by Kpan. An adequate water supply of 25–35 mm was applied at the first irrigation to guarantee seed germination. Table 1 lists the irrigation amount and irrigation time under the four coefficient values for both crop seasons.

2.3. Sampling, Measurement and Analyses

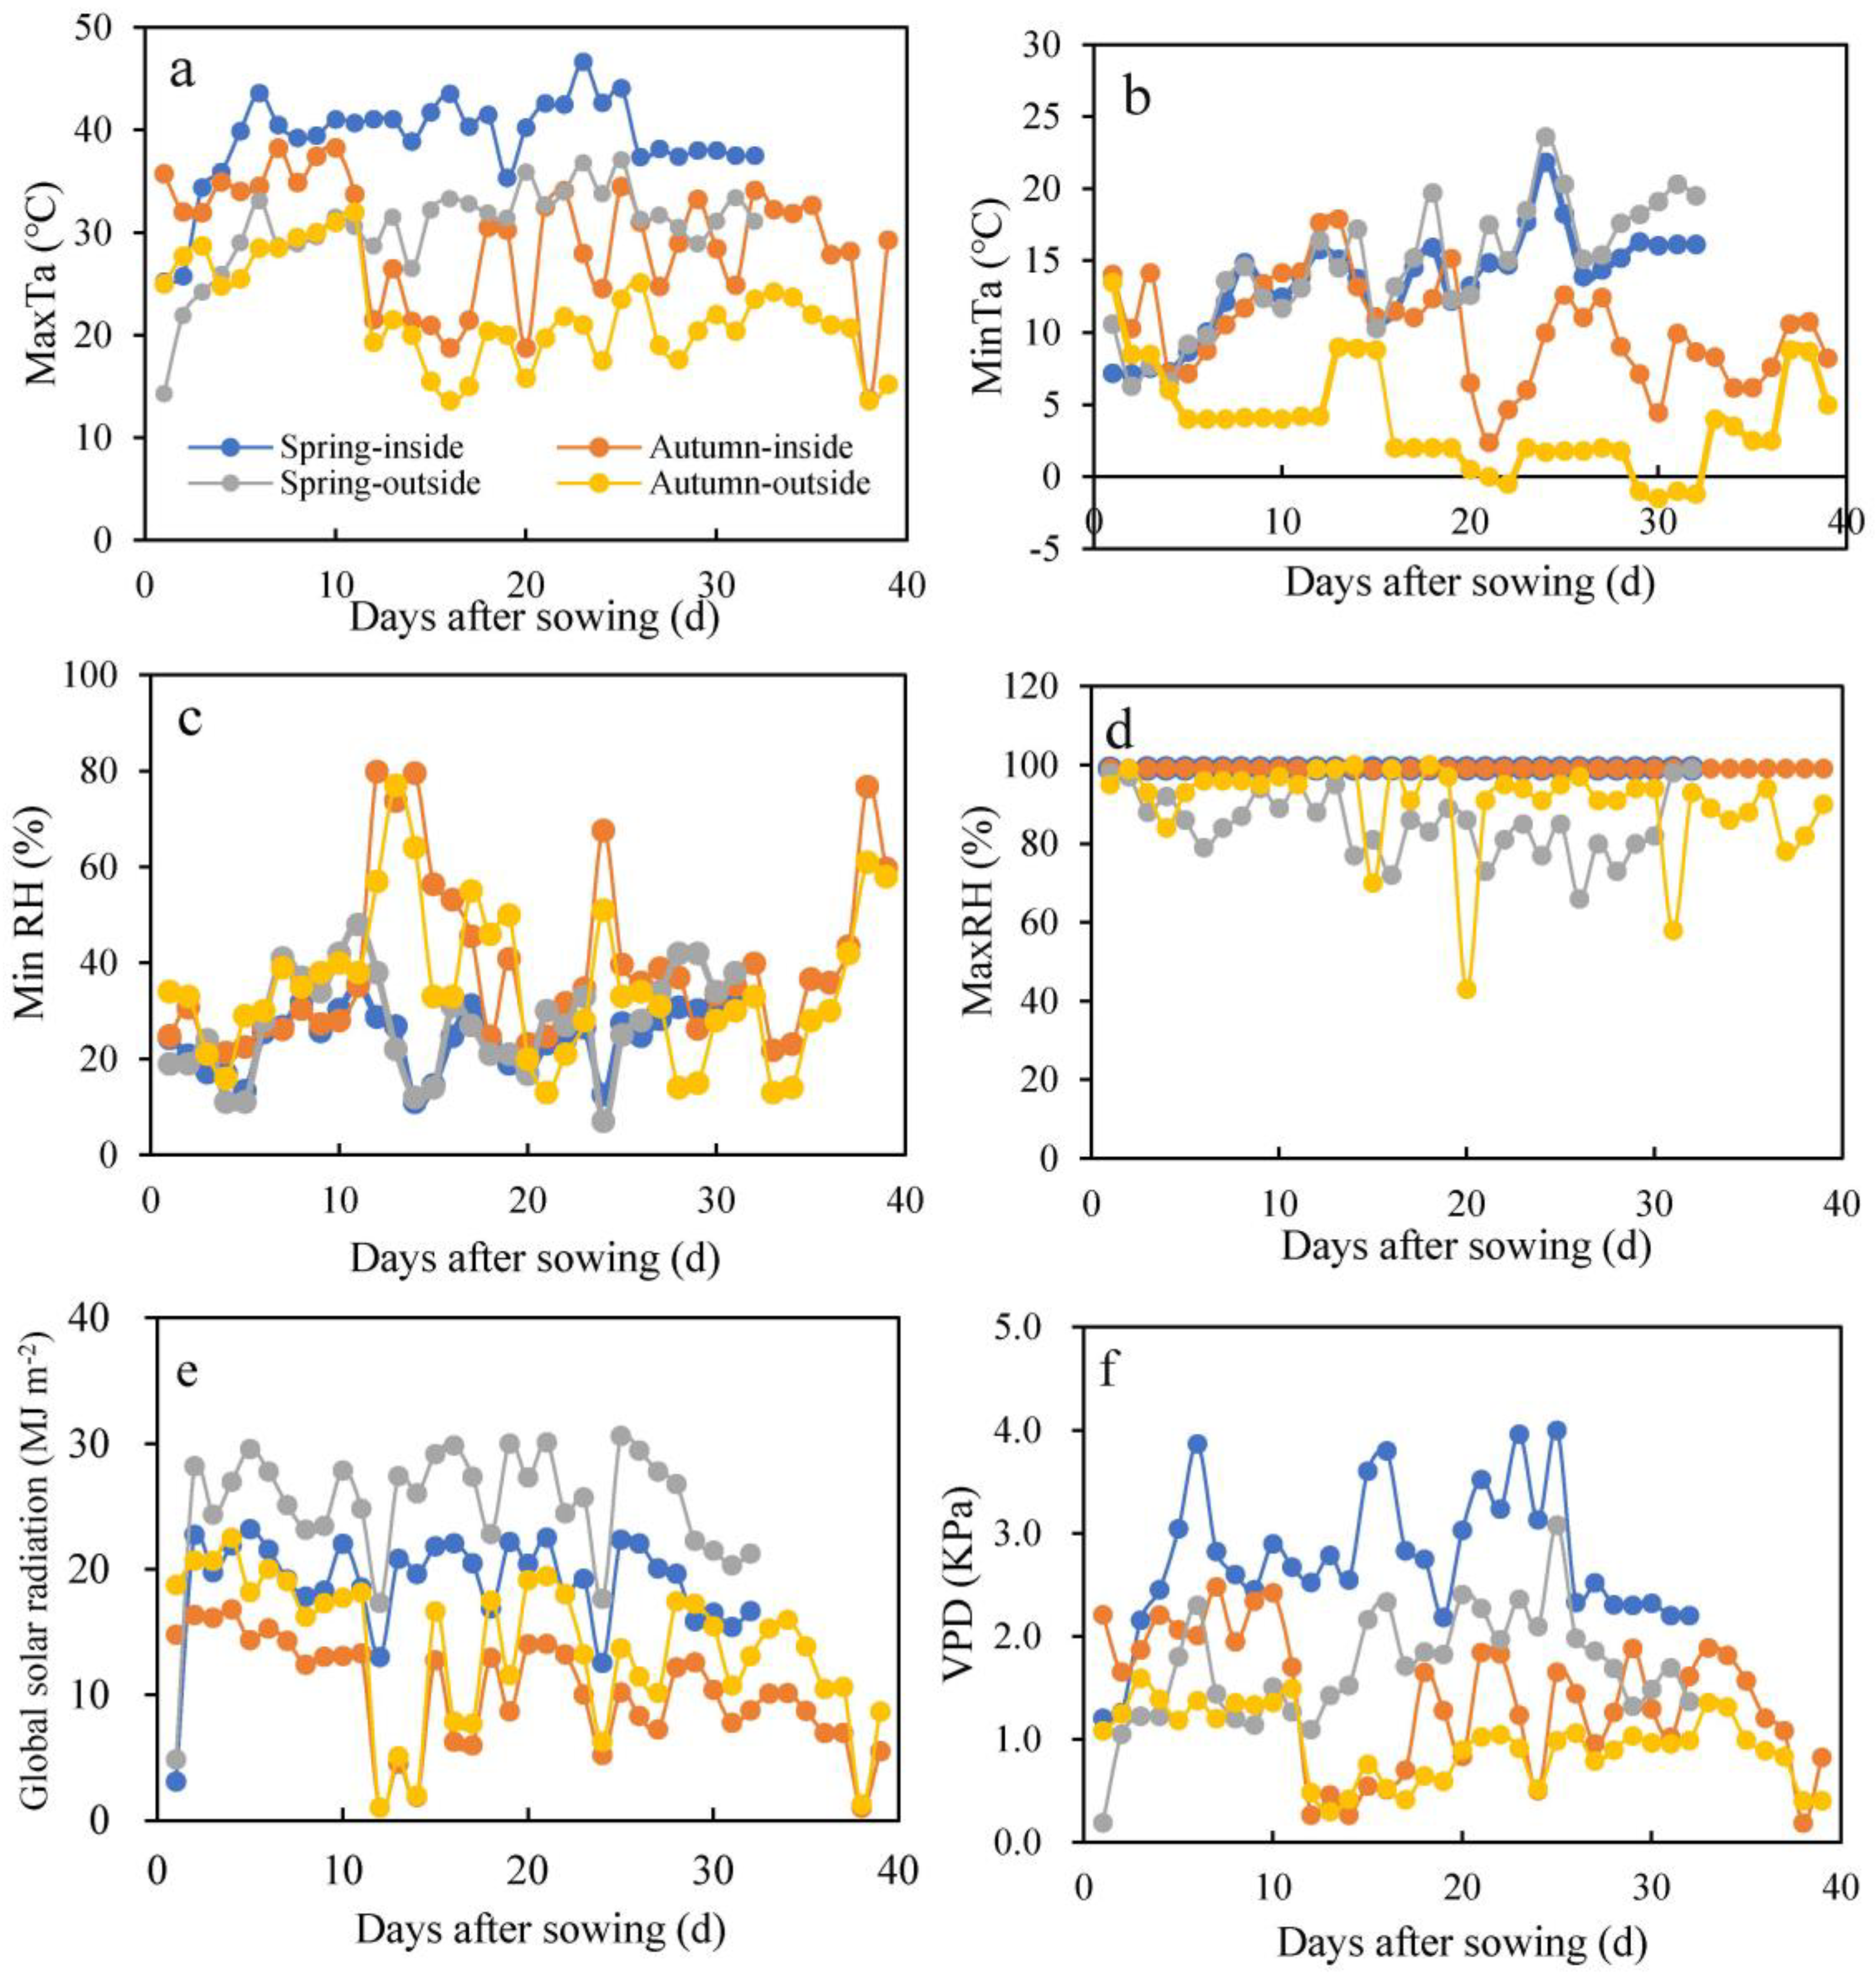
2.3.1. Meteorological Conditions Inside and Outside of the Greenhouse

Microclimatological data inside the greenhouse were collected automatically using a standard Rainroot Scientific (Beijing, China) climate station. These data include global solar radiation, air temperature, and relative humidity monitored daily at a temporal resolution of 10 min and a height of 2 m, and the highest and lowest air temperatures at the test site were recorded daily. The climate station was set up in the center of the greenhouse. A standard weather station about 1000 m away from the experimental location was used to record the meteorological conditions outside of the greenhouse, including rainfall and wind speed, in addition to the meteorological variables inside the greenhouse.

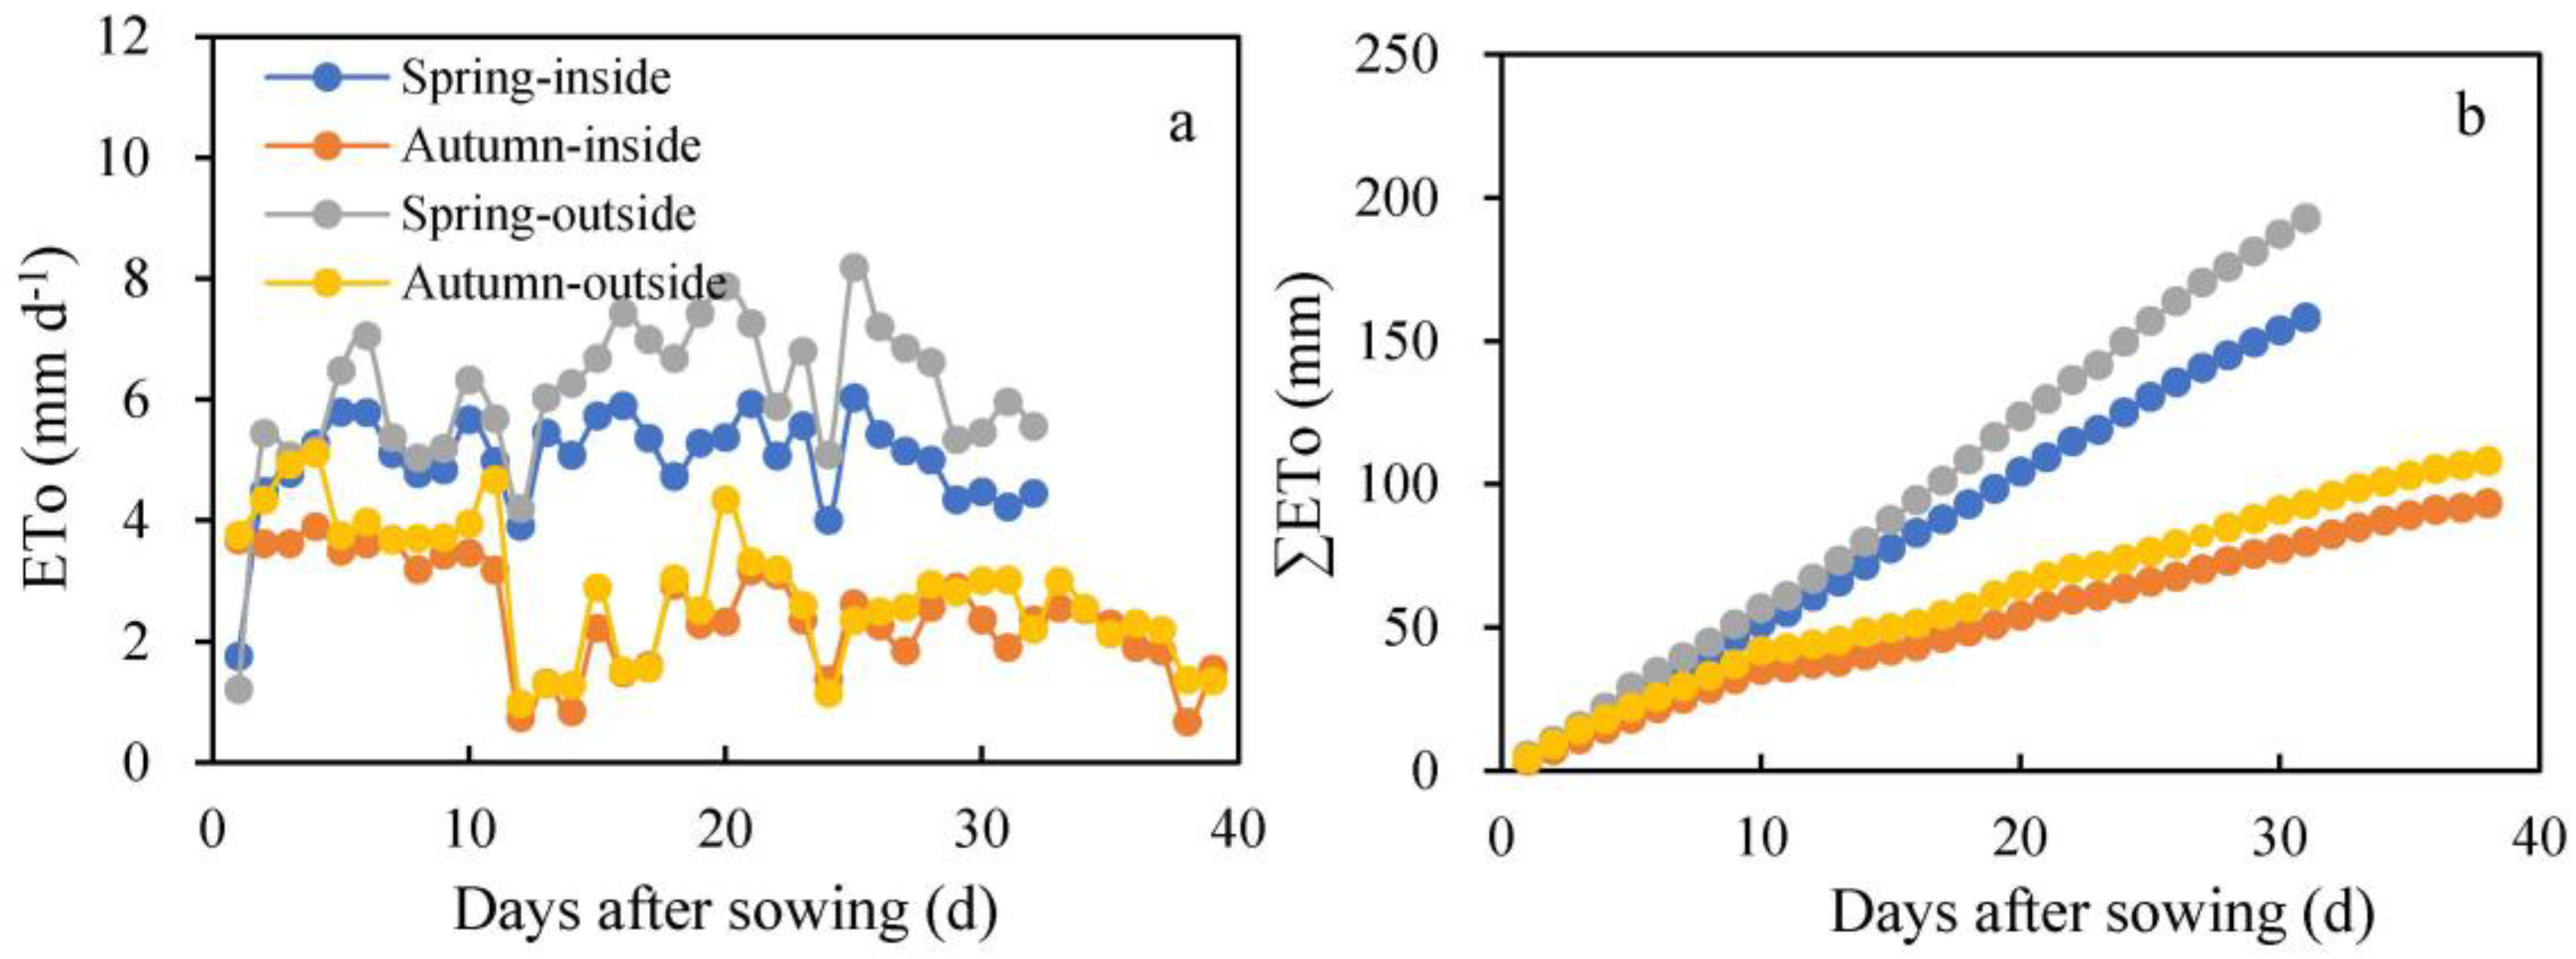
2.3.2. Reference Crop Evapotranspiration and Actual Crop Evapotranspiration

Reference evapotranspiration (ETo) is calculated using the Penman–Monteith equation [6] from meteorological variables measured at ground weather stations. ETo outside of the greenhouse (ETo-out), in mm day−1, was calculated as shown in Equation (1):
E T o = 0.408 R n G + γ 900 T + 273 υ 2 ( e s e a ) + γ ( 1 + 0.34 υ 2 )
where Δ is the vapor pressure slope in kPa °C−1, Rn is the net radiation in MJ m−2 day−1, G is the ground soil flux in MJ m−2 day−1, γ is the psychrometric constant kPa °C −1, T is the daily mean air temperature °C, υ2 is the daily mean wind velocity rescaled at 2 m of height expressed in m s−1, and (es − ea) is the vapor pressure deficit (VPD) in kPa:
Due to very low wind speed in the greenhouse, the reference evapotranspiration inside the greenhouse (ETo-in) was calculated using the modified Penman–Monteith equation as follows. The variables in this formula had the same meaning as the equation mentioned above [27].
E T o i n = 0.408 R n G + γ 634 T + 273 V P D + 1.24 γ
Actual crop evapotranspiration (ET) for an individual period or the whole growing season was measured using the soil water balance equation as follows [10]:
ET = SWD + P + I − Wg − D − R
where ET, P, I, Wg, D, R, SWD denote evapotranspiration, precipitation, irrigation, capillary rise, water drainage, surface runoff, and soil water depletion for a given soil depth. All of these parameters are measured in mm. Runoff was not observed, and the capillary rise was negligible because the groundwater table was 40 m below the soil surface. Due to the small amount of drip irrigation applied in this greenhouse experiment, no precipitation or water drainage occurred. Thus, ET = I + SWD was used under this experimental condition.
Soil water changes for the 0–60 cm soil depth were used to measure SWD. The soil moisture status of the top 60 cm was measured every week using the soil auger method. The soil mass water content was converted to the volumetric soil water content (SWC) by multiplying by the bulk density of the corresponding depth to calculate the SWD.

2.3.3. Evaporation from Pan

The pan evaporation in the greenhouse (Epan-in) was measured as mentioned above. Additionally, the daily value of evaporation from the pan 70 cm above the ground surface (Epan-out) at standard meteorological stations of the Luancheng experimental station of the China Academic of Science 1000 m away from this experimental site was recorded.
Pan evaporation (Epan) was calculated using the following equation:
Epan = Wbase − Wleft + R
where Wbase is the initial water amount and is 20 mm; Wleft is the water amount left in the pan after a 24 h period of evaporation. R is the rainfall during the corresponding period of pan evaporation determined using a rain gauge, 20 cm in diameter, at the weather station of the Luancheng experimental station.

2.3.4. Plant Measurement

Leaf area and plant height, fresh biomass, and dry biomass of spinach plants in a subplot were measured periodically from the initial season, mid-season, and late season in both crop seasons. Ten plants were harvested from each plot. The leaf area of 10 stems was determined using a leaf area meter (LI-3000, LI-COR Inc., Lincoln, NE, USA) every 6–9 days during the most active growing period. Additionally, plant height was measured using rulers. The leaf area, fresh weight and dry weight per 10 plants used in the present paper were the mean values of the measurements. For dry biomass measurement, stem and leaf samples were collected and then oven dried at 70 °C for 48 h to constant weight. The total weight of leaves and stems was the total aboveground biomass.
The leaf chlorophyll contents of the new fully expanded leaves of 10 plants per replicate were determined using a SPAD-502 portable chlorophyll meter (Konica Minolta Sensing Inc., Osaka, Japan). The midribs of the leaves were avoided. The average value was used to represent the plant chlorophyll concentration for each plot.
Sixteen subplots of 1.0 m2 area in every crop season were selected randomly in the experimental fields for spinach yield sampling.

2.3.5. Kc and WUE

Kc for spinach was determined by the relationship with ETo and ET, as shown in Equation (5):
Kc = ET/ETo
Crop water use efficiency was computed as biomass produced per unit of ET. WUE was calculated as spinach yield divided by total water consumption over the whole season, expressed as Equation (6):
WUE (kg m−3) = Yield (kg ha−1) ÷ ET (mm) × 0.1

2.4. Data Processing and Statistical Analysis

Graphs were plotted using Excel 2019 software. One-way ANOVA was adopted to evaluate for effects between different irrigation treatments. The SAS System for Windows, Release 8.2 (SAS Institute, Cary, NC, USA) was used for the statistical analyses of growth parameters and water use efficiency. Two goodness of fit characters were used to determine the accuracy of indoor Epan estimation by the outdoor Epan. The coefficient of determination (r2) of the linear regression and the root mean square error (RMSE) were used. Principal component analysis (PCA) and correlation analysis among the growth characteristics, ETo, and Epan were conducted using OriginLab 2023.

3. Results

3.1. Meteorological Conditions

A summary of climatic variables during the growing season of spring and autumn spinach is shown in Figure 2. The mean maximum air temperature (MAT), minimum air temperature (MIT), minimum relative humidity (MinRH), and maximum relative humidity (MaxRH) inside the greenhouse were 39.1 °C, 13.5 °C, 24.4%, and 99% in the spring growing season and 29.5 °C, 10.2 °C, 38.8%, and 99.1% in the autumn growing season, respectively. The corresponding values outside the greenhouse were 30.4 °C, 14.6 °C, 31.8%, and 85.2% in the spring season and 22.2 °C, 3.7 °C, 35%, and 90.5% in the autumn growing season. The mean minimum and maximum temperatures, global solar radiation, and VPD were higher in the spring season than in the autumn season, especially in the late growth period. Changes in maximum temperature and minimum air temperature inside were larger in amplitude in the autumn season than in the spring season, as was the case for MinRH. In summary, the greenhouse had higher MAT, MIT, MaxRH, MinRH, and VPD and lower global solar radiation in both seasons except for MIT and MinRH in spring. Higher MAT, MIT, VPD, and global solar radiation in spring seasons appeared than in autumn seasons either inside or outside the greenhouse.

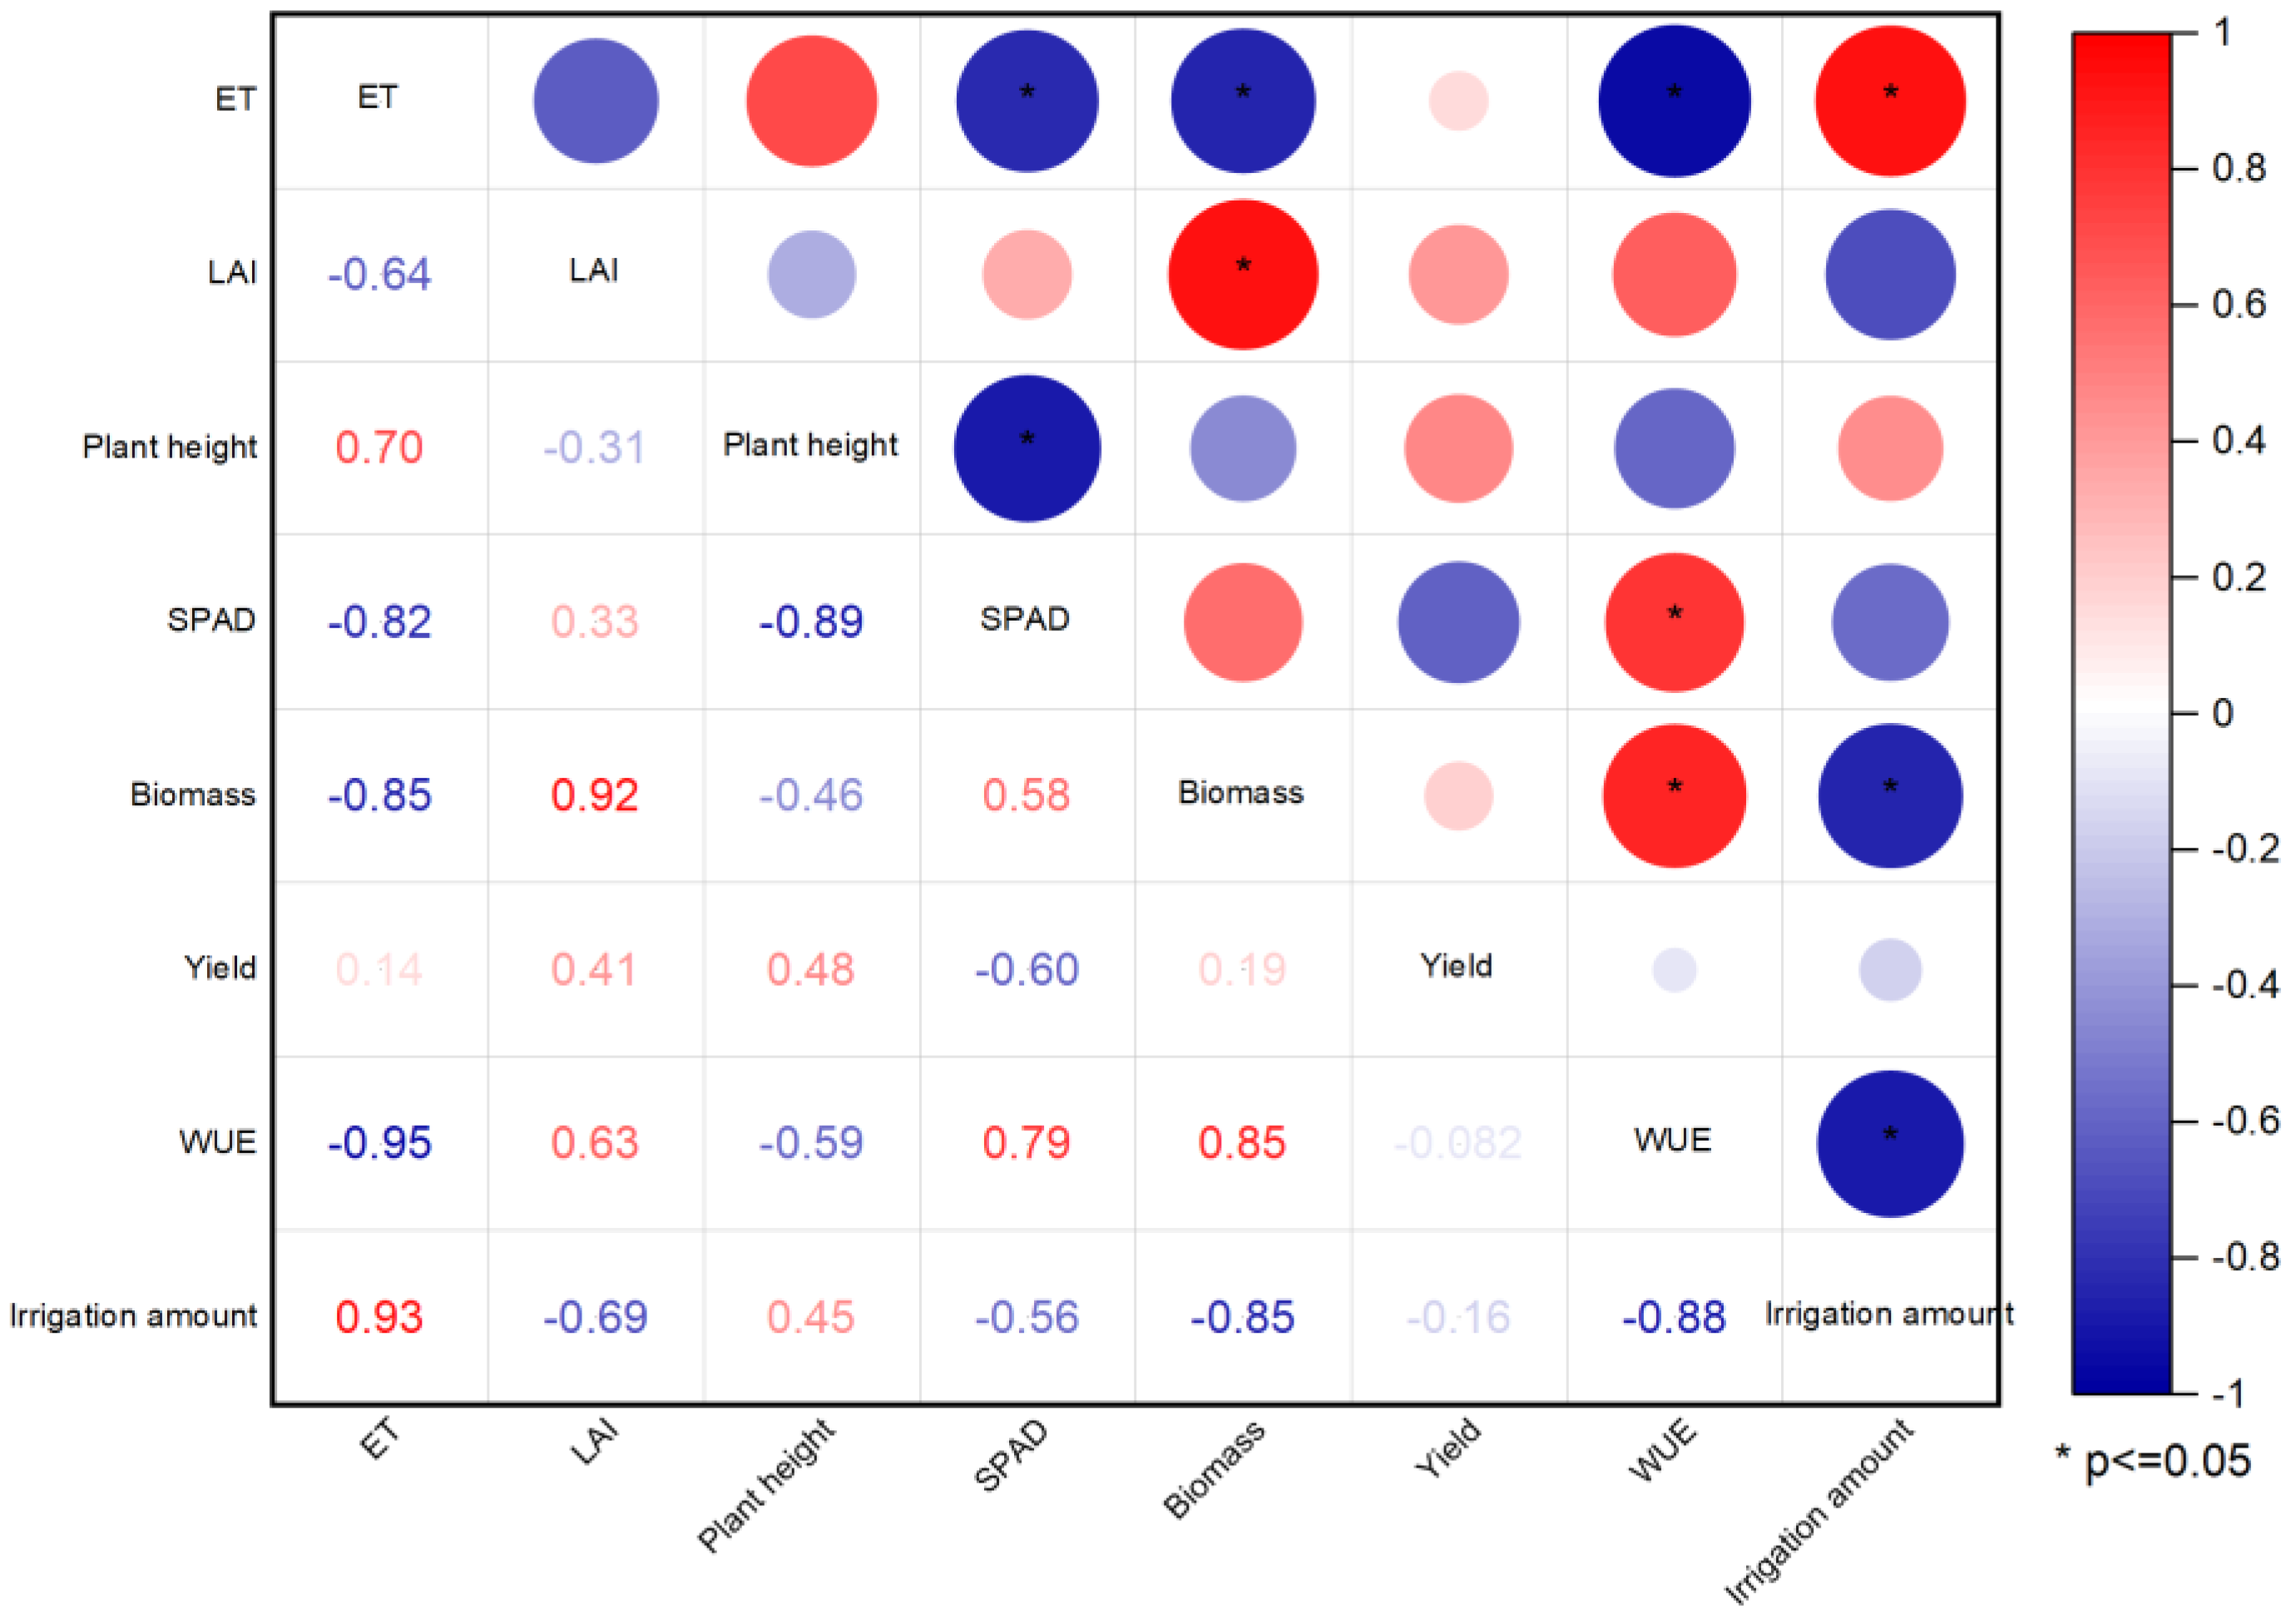
3.2. Yield and Water Use Efficiency

Spinach yield increased with irrigation but decreased when the water was excessive in the spring season (Figure 3). Although there were no significant differences in spinach fresh yield between all of irrigation treatments, less irrigation (0.6 Epan irrigation treatment) limited spinach growth obviously, as shown in Figure 1. The 0.8 Epan irrigation treatment (T2) and 0.6 Epan irrigation treatment (T1) were more water productive than all other treatments in terms of fresh biomass yield in the spring season and the autumn season, respectively (Figure 3). With more irrigation supply, yield losses occurred at rates of 5.8% and 9.7% in the T3 and T4 treatments in the spring season and 3.8%, 4.5%, and 6.8% in the T2, T3, and T4 treatments in the autumn season, respectively. However, there were no significant differences between all treatments in both seasons. Similar yields were produced in both spinach growing seasons.
The T2 treatment with less irrigation water input outperformed the other treatments in terms of WUE (Figure 3). Moreover, it also outperformed in the autumn season with a significant difference compared to all other treatments and in the spring growing season compared to T3 and T4 (Figure 3). With the increase in irrigation amount, the water use efficiency of spinach decreased by 8.8%, 27.7%, and 39.4% in the spring growing season and by 22.6%, 31.4%, and 42.9% in the autumn season under the T2, T3, and T4 treatments, respectively. WUE in the autumn growing season surpassed that in the spring growing season due to climate conditions (Figure 3).

3.3. Crop Growth Performance

The whole growing period was divided into three parts: the initial growth stage (0–14 days after sowing), middle growth stage (15–25 days after sowing), and late growth stage (26–38 days after sowing). Plant height and biomass of spinach plants at fresh weight and dry weight of 10 plants are shown in Table 2 and Table 3 for the spring growing season and the autumn growing season, respectively. No significant differences between any treatments were found at the initial stage in both growing seasons. At the middle stage, a decrease in total fresh weight and dry weight occurred under T4 treatment in both growth seasons, especially for stem fresh weight, with a significant decline compared with that under the T1 treatment (Table 3). At harvest time, the results showed that the highest total fresh and dry biomass appeared under T2 treatment in the spring growing season and under T1 treatment in the autumn growing season (Table 2 and Table 3). Gradual declines in plant height, total fresh and dry biomass, and stem and leaf fresh weight occurred with increasing irrigation water amount, and the maximum drop in T4 treatment in terms of plant height and stem fresh weight reached a significant level in the autumn growth season (Table 3).
Leaf areas, specific leaf weight, SPAD, and leaf area index were also measured at three stages. None of the leaf trait parameters showed any significant difference between treatments except for specific leaf weight in the T4 treatment in the autumn growing season (Table 4). In general, all the leaf characteristics in the autumn growth season surpassed those in the corresponding treatment in the spring growing season (Table 4).

3.4. Crop Coefficient

Kc varied from 0.5 to 1.1 during the entire growth period in the spring growing season and from 0.5 to 0.9 in the autumn growing season (Table 5). The Kc values were 0.9, 0.5, 0.7, 0.6, and 0.5 in the spring season and 0.7, 0.7, 0.6, 0.6, and 0.50 in the autumn growing season at different periods at a one-week interval under T1 treatment. With more irrigation water supply, the Kc values were higher than those in the same growth period (Table 5).

3.5. ETo, Epan, and Their Mutual Relationships

Daily ETo and daily Epan inside (ETo-in) and outside (ETo-out) plastic greenhouses during the whole growth duration are shown in Figure 4 and Figure 5, respectively. Daily ETo-out and Epan-out were obviously higher than the corresponding ETo-in and Epan-in in both growing seasons except for ETo in the spring growing season. The cumulative ETo inside and outside the greenhouse (∑ETo-in and ∑ETo-out) increased linearly with the development of spinach plant growth. The sequence of the increase rate was ∑ETo-out in the spring growing season, ∑ETo-in in the spring growing season, ∑ETo-out in the autumn growing season, and ∑ETo-in in the autumn growing season (Figure 4b). The same trend was found in cumulative Epan inside and outside the greenhouse (∑Epan-in and ∑Epan-out) in the middle and late seasons (Figure 5b). The variation with a larger amplitude was found in the autumn season concerning daily Epan changes and the difference between indoor and outdoor Epan and ∑Epan (Figure 5).
The positive linear relationships between ETo-in and ETo-out, Epan-in and Epan-out, ETo and Epan inside and outside the greenhouse, ∑ETo-in and ∑ETo-out, ∑Epan-in and ∑Epan-out, and ∑ETo and ∑Epan inside and outside the plastic greenhouse are shown in Figure 6. The correlation coefficient, r2, exceeded 0.99 between ∑ETo-in and ∑ETo-out, ∑Epan-in and ∑Epan-out, and ∑ETo and ∑Epan inside and outside the plastic greenhouse (Figure 6d–f), which was dramatically higher than the corresponding values based on the daily scale (Figure 6a–c). Furthermore, the slope of the correlation line of the accumulative ETo and Epan remains the same whether in spring growing seasons or in autumn growing season.
The results of PCA are shown in Figure 7, where the sum of principal components 1 and 2 (PC1 and PC2) accounted for 70.2% of the variation in the data. The first component of PCA (PC1) explained the majority of the variation (46.8%). PC1 showed strong correlations with sunshine hour (SH), global solar radiation (GSR), ETo, and Epan. Additionally, PC1 was moderately correlated with VPD, MAT, and MIT. The second component of PCA (PC2) accounted for 23.4% of the total variance and was strongly correlated with MaxRH and MAT. Epan had a negative correlation with precipitation and MinRH. On the basis of the PCA results, it is possible to present the real interrelationships among the traits clearly.
In addition, the relationship between spinach yield on fresh weight and other parameters, such as ET, LAI, plant height, leaf SPAD values, WUE, biomass based on dry weight, and irrigation amount, was discussed, as shown in Figure 7. The results show that spinach yield had a positive correlation with LAI and plant height and a negative correlation with leaf SPAD value. WUE was slightly negatively correlated with spinach yield. WUE had a negative relationship with ET, plant height and irrigation amount and a positive effect on leaf SPAD values, biomass based on dry weight, and LAI in the present trial (Figure 8).

4. Discussion

4.1. Spinach Growth and Yield

Spinach is a fast-maturing, cool-season leafy vegetable crop. Seasonal water supply and the marketable yield of vegetable crops have shown quadratic relationships [12]. In this trial, spinach yield showed the same trend in the spring growing season, and the highest yield, 39.8 ton ha−1, occurred in the T2 treatment with an 80% Epan irrigation amount (Figure 3). Symptoms for water stress in the T1 treatment with 0.6 Epan irrigation amount had begun to show old yellow leaves at the bottom in the spring growing season (Figure 1). However, in the autumn growing season, the T1 treatment with the lowest irrigation amount, 60% of Epan, obtained the maximum yield (Figure 3). All treatments had no significant difference in terms of fresh yield in both growing seasons. These results indicate that the irrigation level was slightly higher than the water stress threshold. The water requirement of spinach plants in the autumn growing season was less than that in the spring season due to small evapotranspiration for the microclimate with lower solar radiation, air temperature, VPD, and minimum relative humidity (Figure 2).
Excessive water irrigation when surpassing the optimal irrigation amount resulted in spinach yield loss, whether dry weight or fresh weight, in both growing seasons, with particularly significant dry yield reduction in the T4 treatment in terms of whole plant biomass in the spring season and stem biomass in autumn growing season (Table 2 and Table 3). These results showed that overwatering and deficit irrigation were not beneficial to improving yield [28]. Growth parameters were negatively affected by severe deficit irrigation [19]. Water deficit significantly restrained leaf growth, plant height extension, and leaf area expansion of spinach [29,30]. The impact of irrigation level on leaf chlorophyll content was not obvious (Table 4), which is consistent with a previous study [31]. In the spring growing season, the total phenological cycle was shorter than that observed in the autumn growing season, lasting only 32 days. Due to the greater water supply, there were no obvious water stress phenomena in this experiment in most treatments. However, excessive water supply in the T4 treatment led to restrained leaf growth and leaf area extension, which caused slight LAI reduction (Table 4), although there were no significant differences between any of the treatments in both growing seasons. It is noteworthy that overirrigation also had a significant detrimental effect on plant height and stem growth, whether based on dry weight or fresh weight, in the autumn growing season (Table 3). Moreover, in the autumn growing season, stem biomass reduction appeared in the mid-season, which indicates that the period of excessive irrigation occurred sooner than that in the spring growing season (Table 2 and Table 3).

4.2. ET and WUE

The actual evaporation during the trial period ranged from 102.7 mm to 159.4 mm and 53.3 mm to 86.9 mm for the spring and autumn growing seasons, respectively. WUE in the autumn growing season surpassed that in the spring growing season due to the different microclimate conditions (Figure 3). Whereas higher irrigation rates did not afford higher yields, lower rates afforded higher irrigation water use efficiency (Figure 3). A high positive correlation coefficient (r = 0.93) with ET and irrigation water amount and a negative response of WUE with ET were found in this trial (Figure 8). Many studies have shown that water stress results in improved WUE for morphological adaptation in plants by reducing leaf area and ET [22]. Overirrigation in T3 and T4 caused a further decrease in WUE compared to the optimal irrigation treatments (Figure 3), which is consistent with the findings of Zhang et al. [32]. A significant portion of irrigation water may be lost through evaporation rather than transpiration, resulting in a decrease in WUE. If the irrigation amount is below or above a certain limit (threshold level), there is a decline in WUE. However, the critical irrigation level in terms of the yield and WUE may not coincide. In this trial, the T1 treatment with less irrigation water input outperformed the T3 and T4 treatments in terms of WUE with significant differences (Figure 3).
Positive linear relationships between ET and grain yield have been reported in many studies [33], and some studies have shown a quadratic relationship [28]. In this trial, WUE and ET were independent of spinach yield (Figure 8).
In the present trial, the maximum fresh yield and WUE reached 39.8 ton ha−1 and 70.5 kg m−3, respectively, which outperformed the corresponding values reported in other studies [15,30,32]. These differences were attributed to different experimental climate conditions, spinach cultivars, irrigation regimes, planting seasons, soil types, and cultivation patterns, such as planting density. In this region, the North China Plain, which experiences serious water shortage, intensive drip irrigation is recommended for greenhouse cultivation due to its water saving potential [26]. WUE in drip irrigation was twice as much as that in furrow irrigation [26]. However, greenhouse farmers often irrigate more water than the actual water requirement, and overwatering is common in this irrigation system. Setting up an appropriate drip irrigation regime in greenhouse vegetable production systems is a matter of urgency. The results indicated that 0.8 and 0.6 times Epan of irrigation application at an accumulative pan evaporation of 20 mm is optimum for the spring and autumn seasons in this experimental area to obtain maximum marketable yield and net return from drip-irrigated spinach in this region. In the autumn season, the optimal irrigation may be less than 0.6 Epan due to the higher irrigation amount, and more studies should be conducted.

4.3. ETo, Epan, and Crop Coefficient

For zero wind speed and low radiation, low transpiration occurs in the greenhouse for high temperature and humidity [34]. ETo obtained outside the greenhouse shows values higher than those for ETo estimated inside the greenhouse (Figure 4). In this trial, the ETo and Epan inside the greenhouse were lower than the corresponding values outside the greenhouse (Figure 4 and Figure 5). The total amounts of applied irrigation water ranged from 91.5 mm to 158.0 mm and from 74.4 to 113.7 mm in the spring and autumn growing seasons (Table 1), respectively. The cumulative ETo-in, ETo-out, Epan-in, and Epan-out measurements of the entire growth period were 158.2 mm, 192.8 mm, 140.2 mm, and 236.0 mm in the spring growing season and 93.0 mm, 108.0 mm, 78.9 mm, and 143.2 mm in the autumn growing season, respectively (Figure 4 and Figure 5).
The Kc values at the different stages in both growing seasons except for the T4 treatment in the spring growing season were less than 1.0 (Table 5), which indicates that ET was lower than the cumulative ETo. With the increase in irrigation water amount, Kc values increased due to the improvement in ET (Table 5). The recommended values of Kc were 0.9, 0.5, 0.7, 0.6, and 0.5 for 1–8, 9–14, 15–20, 12–26, and 27–32 days after sowing in the spring growing season, respectively (Table 5). The corresponding values of Kc were 0.7, 0.7, 0.6, 0.6, and 0.5 in the autumn growing season (Table 5).
As mentioned above, Kc varies in climates, crops, and seasons. Therefore, determination of region-specific Kc is necessary for accurate estimation of crop water requirements [10]. Kc showed significant seasonality and interannual fluctuations [35]. Many studies on Kc values of spinach plants have been different. Part of the discrepancy may be explained by the special agroclimatic conditions of greenhouses in contrast to open fields. Other factors to be taken into account are pot experiments [16] and sprinkle irrigation [10,12,15]. Improper Kc values lead to overestimated or underestimated crop water requirements and result in yield reduction or water waste. Therefore, more experimental data are needed to correct the crop water requirement for site- and crop-specific adjustments to ETo or Kc.
In Figure 7, the PCA results showed strong correlations with SH, GSR, ETo, and Epan. Additionally, PC1 was moderately correlated with VPD, MAT, and MIT. In other words, GSR and SH account for a large part of the reason for Epan and ETo. Solar radiation was the primary environmental factor influencing greenhouse ET, followed by VPD [35,36]. High radiation with high air temperature and low humidity increase the leaf transpiration rate and crop water requirement.

4.4. A simple Method to Formulate an Irrigation Schedule for Spinach in a Plastic Greenhouse

Drip irrigation is recommended for greenhouse cultivation in North China [26]. The proper drip irrigation regime is of great significance to greenhouse vegetable production. The main constraints on WUE improvement are relevant to the overall cost of these technologies and extension policies to professional farmers [3]. Therefore, cheap and simple tools are preferable for smallholders to optimize their irrigation regime in North China.
A precise prediction of ET is the premise for good irrigation scheduling. ETo is a key factor in better evaluation of crop water requirements. Thus, predicting daily ETo accurately is crucial for formulating appropriate irrigation schedules in greenhouses. However, no general international standard for predicting the reference crop evapotranspiration in greenhouses has been reported [36]. Furthermore, PM and other direct meteorological-based methods are rarely used in greenhouses, mainly because specific determinations are required for each individual greenhouse to evaluate external meteorological parameters [37]. Farmers have commonly considered these methods of computing ETo impractical for scheduling irrigation in greenhouse vegetable systems. Facilities and equipment are not available for smallholders to measure climatic data inside greenhouses due to high cost. Therefore, many researchers have attempted to find a proper well-documented approach to evaluate indoor ETo in greenhouses using available outdoor greenhouse meteorological data, particularly from nearby weather stations [37]. ETo in naturally ventilated greenhouses could be estimated using solar radiation outside the greenhouse as the only measured parameter [37]. Another major difficulty is the uncertainty of Kc values, as mentioned above. The Kc-ETo method is difficult to apply in actual greenhouse vegetable production. Moreover, this approach only estimates irrigation water amounts, and the irrigation time cannot be supplied, which is determined by soil moisture status using expensive sensors. Therefore, new soil watering paradigm developments, such as the intrasoil pulse continuous-discrete watering paradigm, are important for overcoming current irrigation limitations [38,39]. In the present trial, ∑ETo-out and ∑ETo-in had a strong positive linear relationship in both seasons (r2 = 0.994, Figure 6e) despite the relatively poor correlation between the corresponding daily data (Figure 6a). The slope remained unchanged in both seasons. The ETo-in can be estimated using ETo-out, which, in theory, can be obtained using the standard PM equation. In this paper, this method was not a practical method to formulate irrigation schedules, and thus further discussion is not held.
Due to its simplicity and low cost, Epan has proven easy to apply in determining crop water requirements for irrigation scheduling [40]. Using Epan to predict ETo on a daily basis is not suitable because pan evaporation is not sensitive to rapid climate change over a daily course for the NCP [41], which is similar to the present results, shown in Figure 6c. However, the results were acceptable when averaged over periods of 5, 7, and 10 days in open-field conditions [42]. In this trial, ∑ETo and ∑Epan inside and outside the greenhouse had significant positive linear relationships with the same coefficients of 1.13 and 0.81, respectively, independent of growing season (r2 = 1.0, Figure 6f).
Based on the greenhouse index obtained in the autumn growth period, the Epan-in in the spring growing season predicted well using Epan-out for daily data with r2 = 0.85 and root mean square error (RMSE = 0.68 mm d−1), for 4-day intervals with r2 = 0.95 and RMSE = 1.81 mm 4 day−1, and for the entire growth period with r2 = 1.0 and RMSE = 2.40 mm (Figure 9). The high r2 for the regression between the measured Epan inside the greenhouse and the estimated values using Epan in the open field (Figure 6), particularly for the 4-day interval or entire growth period, supported the assumption that a proper greenhouse index (the ratio of ∑Epan-in to ∑Epan-out) could predict Epan inside the greenhouse by external Epan to a high degree of accuracy. Therefore, Epan-out can be used to determine when crop planting in the greenhouse should be irrigated. In other words, the external Epan outside the greenhouse could provide precise irrigation predictions and be used to formulate the irrigation schedule for crops inside the greenhouse.
However, this approach has limitations. In this trial, shading, screening, and heating were not considered. Therefore, this method was suitable for a low technology plastic greenhouse for fast-maturing leafy vegetables with short growth duration. The change in cover transmittance for cover degradation, washing from rain, and dust accumulation with time should be taken into account in future research using long-term experiments. Furthermore, because the values of Epan-out became zero when the precipitation amounts proceeded the initial values of water amount in the pan, i.e., 20 mm, this could result in a nonlinear increase in ∑Epan-out and worsening of the relations between ∑Epan-in and ∑Epan-out. Generally, the greenhouse was in fallow in summer with high precipitation and air temperature. In addition, the Epan-out is not available due to air temperatures below zero degrees centigrade in this experimental site, and the crops were seldom irrigated due to less evapotranspiration for lower solar radiation and air temperature in winter. Due to extremely low temperatures, planting crops was not allowed in the low-technology greenhouse. Most irrigation in greenhouse vegetable production systems occurs in spring and autumn in the North China Plain. Therefore, this approach was only used in the spring and autumn growing seasons with less precipitation in arid and semiarid regions. The greenhouse index can be obtained easily by measuring Epan inside and outside for 7–10 days. These values remain constant independent of season and can be used for longer times. Epan-in determination was not performed in each greenhouse. This time- and labor-saving method is simple and low-cost, suitable for smallholders and advantageous for optimizing irrigation scheduling to save water and protect the environment. Using this method, more practical, accurate, and easily adaptable irrigation scheduling applications should be developed for real-time farming operations. Weather station networks and online data access should be improved to better serve irrigation schedule applications.

5. Conclusions

The T2 treatment with 0.8 Epan and T1 treatment with 0.6 Epan obtained the highest fresh spinach yield, 39.8 t ha−1 and 37.56, in the spring and autumn season, respectively. Excessive drip water (T4) also significantly limited spinach growth and led to yield loss, particularly for stem growth, in both seasons. Less irrigation water input (T2) afforded the highest water use efficiency (WUE) with 37.2 kg m−3 and 70.5 in both seasons. Irrigation interval was controlled using a 20 mm Epan and optimal irrigation water amount with 0.8 Epan and 0.6 Epan being recommended for the spring and autumn growing season, respectively. A simple and easily fulfilling drip irrigation schedule for spinach is feasible using the standard 20 cm evaporation pan despite the optimal irrigation amount needing be increased in the autumn growing season. In addition, the slope, i.e., the ratio of ∑Epan-in to ∑Epan-out, defined as the greenhouse index, remained unchanged independent of growing seasons. A proper greenhouse index could predict Epan inside the greenhouse by external Epan to a high degree of accuracy (daily data with r2 = 0.85, root mean square error (RMSE = 0.68 mm d−1), for a 4-day interval with r2 = 0.95, RMSE = 1.81 mm 4 day−1, and for the entire growth period with r2 = 1.0, RMSE = 2.40 mm). In conclusion, the simple method using greenhouse indexing was formulated for drip irrigation scheduling of spinach in plastic greenhouse in the North China Plain using a 20 cm standard pan outside the greenhouse. This method was suitable for fast-maturing leafy vegetables in a low-technology greenhouse in arid and semiarid areas. Low-technology greenhouse systems with very simple plastic shelters is one of the predominant types of greenhouse in the North China Plain. This simple and low-cost approach will benefit the sustainable development of high-yield and efficient agriculture in the greenhouse vegetable production system. This simple method combined with weather station networks and cellphones could be widely used by smallholders to optimize the irrigation scheduling of leafy vegetables in greenhouses.

Author Contributions

F.F. and J.N.: Conceptualization, Project administration, Funding acquisition. J.N.: Investigation, Writing—original draft, Writing—review and editing, Statistical analyses. J.F., S.L., and S.J.: Conceptualization, Project administration, Funding acquisition, Investigation. All authors have read and agreed to the published version of the manuscript.

Funding

This research was funded by the S&T Program of Hebei, grant number 21326904D.

Data Availability Statement

Not applicable.

Acknowledgments

We are grateful to Xuchuan Nie at Luancheng Agro-Ecosystem Experimental Station for assisting with sampling and measurement in the field.

Conflicts of Interest

The authors declare no conflict of interest.

Abbreviations

WS: wind speed; MIT: minimum air temperature; MAT: maximum air temperature; MinRH: minimum relative humidity; MaxRH: maximum relative humidity; SH: sunshine hours; VPD: vapor pressure difference; GSR: global solar radiation; ET: evapotranspiration (mm); P: precipitation (mm); I: irrigation (mm); D: water drainage (mm); R: surface runoff; SWD: soil water depletion for a given soil depth; Wg: capillary rise; SWC: soil water content; ETo: reference crop evapotranspiration; Epan: pan evapotranspiration; RMSE: root mean square error; r2: correlation coefficient; WUE: water use efficiency; ∑Epan-out: cumulative Epan outside the greenhouse; ∑Epan-in: cumulative Epan inside the greenhouse; ∑ETo-out: cumulative ETo outside the greenhouse; ∑ETo-in: cumulative ETo inside the greenhouse; ETo-out: daily ETo outside the greenhouse; ETo-in: daily ETo inside the greenhouse; Epan-out: daily Epan outside the greenhouse; Epan-in: daily Epan inside the greenhouse; LAI: leaf area index; Kc: crop coefficient; NCP: North China Plain; IS: irrigation scheduling; Kpan: pan coefficients; Δ: vapor pressure slope in kPa °C−1; Rn: net radiation in MJ m−2 day−1; G: ground soil flux in MJ m−2 day−1; γ: psychrometric constant kPa °C−1; T: daily mean air temperature °C; υ2: daily mean wind velocity rescaled at 2 m of height expressed in m s−1; es: saturation vapor pressure; ea: actual vapor pressure.

References

  1. Meng, J.; Yao, X.Q.; Yang, X.L.; Luo, J.M.; Shen, Y.J. Spatial and temporal evolution of agricultural planting structure and crop water consumption in groundwater overdraft area. Trans. Chin. Soc. Agric. Mach. 2020, 51, 302–312. [Google Scholar]
  2. Chen, Q.; Zhang, H.; Tang, L.; Li, X.; Liebig, H.P. Effects of water and nitrogen supply on spinach (Spinacia oleracea L.) growth and soil mineral N residues. Pedosphere 2002, 12, 171–178. [Google Scholar]
  3. Pardossi, A.; Incrocci, L. Traditional and new approaches to irrigation scheduling in vegetable crops. Horttechnology 2011, 21, 309–313. [Google Scholar] [CrossRef] [Green Version]
  4. McPhee, J.; Eberhard, J.; Melland, A.; Uddin, J.; Dunn, L.; Hin, S.; Lim, V.; Touch, V.; Sisouvanh, P.; Somphou, I.; et al. Simple ETo-Based rules for irrigation scheduling by smallholder vegetable farmers in Laos and Cambodia. Water 2022, 14, 2010. [Google Scholar] [CrossRef]
  5. Gu, Z.; Qi, Z.; Burghate, R.; Yuan, S.; Jiao, X.; Xu, J. Irrigation Scheduling Approaches and Applications: A Review. J. Irrig. Drain. Eng. 2020, 146, 04020007. [Google Scholar] [CrossRef]
  6. Allen, R.G.; Pereira, L.S.; Raes, D.; Smith, M. Crop Evapotranspiration. In Guidelines for Computing Crop Water Requirements, Irrigation and Drainage Paper; No. 56; FAO: Rome, Italy, 1998. [Google Scholar]
  7. Pereira, L.S.; Paredes, P.; Lopez-Urrea, R.; Hunsaker, D.J.; Mota, M.; Shad, Z.M. Standard single and basal crop coefficients for vegetable crops, an update of FAO56 crop water requirements approach. Agric. Water Manag. 2021, 243, 106196. [Google Scholar] [CrossRef]
  8. Guerra, E.; Ventura, F.; Snyder, R.L. Crop coefficients: A literature review. J. Irrig. Drain. Eng. 2016, 142, 06015006. [Google Scholar] [CrossRef]
  9. Čereković, N.; Todorovic, M.; Snyder, R. The relationship between leaf area index and crop coefficient for tomato crop grown in Southern Italy. Euroinvent 2010, 1, 3–10. [Google Scholar]
  10. Okechukwu, M.E.; Mbajiorgu, C.C. Determination of crop coefficients and spatial distribution of evapotranspiration and net irrigation requirement for three commonly cultivated crops in South-East Nigeria. Irrig. Drain. 2020, 69, 743–755. [Google Scholar] [CrossRef]
  11. Wu, H.; Yan, H.Y.; Zhang, C.; Huang, S.; Sam, A.J. Responses of yield and water use efficiency of drip-irrigated cucumber in greenhouse to water stress. Trans. Chin. Soc. Agric. Eng. 2020, 36, 84–93. [Google Scholar]
  12. Imtiyaz, M.; Mgadla, N.P.; Chepete, B.; Manase, S.K. Response of six vegetable crops to irrigation schedules. Agric. Water Manag. 2000, 45, 331–342. [Google Scholar] [CrossRef]
  13. Li, Y.K.; Zhan, B.C.; Guo, W.Z.; Liang, Y.; Li, L.; Bai, M.Z. Optimizing irrigation amount for greenhouse lettuce production based on pan-measured evaporation. J. Irrig. Drain. 2022, 41, 13–19. [Google Scholar]
  14. Xu, Z.L.Y.; Guo, W.; Liang, Y.; Li, L.; Bai, M. Water consumption law of greenhouse vegetable core based on weighing lysimeter. North. Horti. Sci. 2017, 16, 85–90. [Google Scholar]
  15. Piccinni, G.; Marek, J.K.T.; Leskovar, D.I. Crop coefficients specific to multiple phenological stages for evapotranspiration-based irrigation management of onion and spinach. Hortscience 2009, 44, 421–425. [Google Scholar] [CrossRef] [Green Version]
  16. Bianchi, A.; Masseroni, D.; Facchi, A. Modelling water requirements of greenhouse spinach for irrigation management purposes. Hydrol. Res. 2017, 48, 776–788. [Google Scholar] [CrossRef] [Green Version]
  17. Jabeen, M.; Akram, N.A.; Ashraf, M.; Aziz, A. Assessment of Biochemical Changes in Spinach (Spinacea oleracea L.) Subjected to Varying Water Regimes. Sains Malays. 2019, 48, 533–541. [Google Scholar] [CrossRef]
  18. Schlering, C.; Zinkernagel, J.; Dietrich, H.; Frisch, M.; Schweiggert, R. Alterations in the chemical composition of Spinach (Spinacia oleracea L.) as provoked by season and moderately limited water supply in open field cultivation. Horticulturae 2020, 6, 25. [Google Scholar] [CrossRef] [Green Version]
  19. Seymen, M. Comparative analysis of the relationship between morphological, physiological, and biochemical properties in spinach (Spinacea oleracea L.) under deficit irrigation conditions. Turk. J. Agric. For. 2021, 45, 55–67. [Google Scholar]
  20. Caparrotta, S.; Masi, E.; Atzori, G.; Diamanti, I.; Azzarello, E.; Mancuso, S.; Pandolfi, C. Growing spinach (Spinacia oleracea) with different seawater concentrations: Effects on fresh, boiled and steamed leaves. Sci. Hortic. 2019, 256, 108540. [Google Scholar] [CrossRef]
  21. Nyathi, M.K.; van Halsema, G.E.; Annandele, J.G.; Struik, P.C. Calibration and validation of the AquaCrop model for repeatedly harvested leafy vegetables grown under different irrigation regimes. Agric. Water Manag. 2018, 208, 107–119. [Google Scholar] [CrossRef]
  22. Ramezanifar, H.; Yazdanpanah, N.; Yazd, H.G.H.; Tavousi, M.; Mahmoodabadi, M. Spinach growth regulation due to interactive salinity, water, and nitrogen stresses. J. Plant Growth Regul. 2022, 41, 1654–1671. [Google Scholar] [CrossRef]
  23. Montazar, A.; Cahn, M.; Putman, A. Research advances in adopting drip irrigation for california organic spinach: Preliminary findings. Agriculture 2019, 9, 177. [Google Scholar] [CrossRef] [Green Version]
  24. Bao, S.D. Soil Agricultural–Chemical Analysis, 3rd ed.; China Agriculture Press: Beijing, China, 2020. [Google Scholar]
  25. IUSS Working Group WRB. World Reference Base for Soil Resources, 2nd ed.; World Soil Resources Reports No. 103; FAO: Rome, Italy, 2006. [Google Scholar]
  26. Liu, H.; Yuan, B.; Hu, X.; Yin, C. Drip irrigation enhances water use efficiency without losses in cucumber yield and economic benefits in greenhouses in North China. Irrig. Sci. 2021, 40, 135–149. [Google Scholar] [CrossRef]
  27. Fernandez, M.D.; Bonachela, S.; Orgaz, F.; Thompson, R.; Lopez, J.C.; Granados, M.R.; Gallardo, M.; Fereres, E. Measurement and estimation of plastic greenhouse reference evapotranspiration in a Mediterranean climate. Irrig. Sci. 2010, 28, 497–509, Erratum to: Irrig. Sci. 2011, 28, 91–92.. [Google Scholar] [CrossRef] [Green Version]
  28. Zhang, X.Y.; Chen, S.Y.; Sun, H.Y.; Pei, D.; Wang, Y.M. Dry matter, harvest index, grain yield and water use efficiency as affected by water supply in winter wheat. Irrig. Sci. 2008, 27, 1–10. [Google Scholar] [CrossRef]
  29. Leskovar, D.I.; Piccinni, G. Field and leaf quality of processing spinach under deficit irrigation. Hortscience 2005, 40, 1868–1870. [Google Scholar] [CrossRef] [Green Version]
  30. Zhang, J.; Yue, Y.; Sha, Z.; Kirumba, G.; Zhang, Y.; Bei, Z.; Cao, L. Spinach-irrigating and fertilizing for optimum quality, quantity, and economy. Acta Agric. Scand. Sect. B Soil Plant Sci. 2014, 64, 590–598. [Google Scholar] [CrossRef]
  31. Zhang, J.; Liang, Z.; Jiao, D.; Tian, X.; Wang, C. Different water and nitrogen fertilizer rates effects on growth and development of spinach. Commun. Soil Sci. Plant Anal. 2018, 49, 1922–1933. [Google Scholar] [CrossRef]
  32. Zhang, J.; Sha, Z.; Zhang, Y.; Bei, Z.; Cao, L. The effects of different water and nitrogen levels on yield, water and nitrogen utilization efficiencies of spinach (Spinacia oleracea L.). Can. J. Plant Sci. 2015, 95, 671–679. [Google Scholar] [CrossRef]
  33. Siahpoosh, M.R.; Dehghanian, E. Water use efficiency, transpiration efficiency, and uptake efficiency of wheat during drought. Agron. J. 2012, 104, 1238–1243. [Google Scholar] [CrossRef]
  34. Yan, H.; Acquah, S.; Zhang, J.J.; Wang, G.; Zhang, C.; Darko, R.O. Overview of modelling techniques for greenhouse microclimate environment and evapotranspiration. Int. J. Agric. Biol. Eng. 2021, 14, 1–8. [Google Scholar] [CrossRef]
  35. Bonachela, S.; Gonzalez, A.M.; Fernandez, M.D. Irrigation scheduling of plastic greenhouse vegetable crops based on historical weather data. Irrig. Sci. 2006, 25, 53–62. [Google Scholar] [CrossRef]
  36. Gong, X.W.; Liu, H.; Sun, J.S.; Ma, X.J.; Wang, W.N.; Cui, Y.S. Variation of evapotranspiration in different spatial scales for solar greenhouse tomato and its controlling meteorological factors. Trans. Chin. Soc. Agric. Eng. 2017, 33, 166–175. [Google Scholar]
  37. Saadon, T.; Lazarovitch, N.; Jerszurki, D.; Tas, E. Predicting net radiation in naturally ventilated greenhouses based on outside global solar radiation for reference evapotranspiration estimation. Agric. Water Manag. 2021, 257, 107102. [Google Scholar] [CrossRef]
  38. Okolelova, A.A.G.; Glinushkin, A.P.; Sviridova, L.L.; Podkovyrov, I.Y.; Nefedieva, E.E.; Egorova, G.S.; Kalinitchenko, V.P.; Minkina, T.M.; Sushkova, S.N.; Mandzhieva, S.S. Biogeosystem Technique (BGT*) methodology will provide semiarid landscape sustainability (A case of the south russia volgograd region soil resources). Agronomy 2022, 12, 2765. [Google Scholar] [CrossRef]
  39. Kalinitchenko, V.P.; Glinushkin, A.P.; Minkina, T.M.; Mandzhieva, S.S.; Sushkova, S.N.; Sukovatov, V.A.; Il’ina, L.P.; Makarenkov, D.A. Chemical soil-biological engineering theoretical foundations, technical means, and technology for safe intrasoil waste recycling and long-term higher soil productivity. ACS Omega 2020, 5, 17553–17564. [Google Scholar] [CrossRef] [PubMed]
  40. Stanhill, G. Is the Class A evaporation pan still the most practical and accurate meteorological method for determining irrigation water requirements? Agric. For. Meteorol. 2002, 112, 233–236. [Google Scholar] [CrossRef]
  41. Liu, Y.; Costa, S. In Reference evapotranspiration. In Water and Soil Management for Sustainable Agriculture in the North China Plain; Pereira, L.S., Musy, A., Liang, R.J., Hann, M., Eds.; ISA: Lisbon, Portugal, 1998; pp. 49–57. [Google Scholar]
  42. Liu, H.J.; Kang, Y. Sprinkler irrigation scheduling of winter wheat in the North China Plain using a 20cm standard pan. Irrig. Sci. 2007, 25, 149–159. [Google Scholar] [CrossRef]
Figure 1. Spinach plants growing in the plastic greenhouse as shown on the left. The spinach plants under different irrigation treatments at last harvest in spring growing seasons in upper right and in autumn growing seasons in lower right. The treatments from left to right were T1, T2, T3, and T4 with four levels of irrigation, i.e., 0.6, 0.8, 1.0, and 1.2 times the cumulative evaporation of an indoor 20 cm standard pan.
Horticulturae 09 00706 g001
Figure 2. Meteorological conditions inside and outside of the greenhouse, including maximum air temperature (MAT) (a), minimum air temperature (MIT) (b), minimum relative humidity (MinRH) (c), maximum relative humidity (MaxRH) (d), global solar radiation (e), and vapor pressure deficit (VPD) (f).
Horticulturae 09 00706 g002
Figure 3. Spinach fresh yield and water use efficiency (WUE) based on fresh yield during both crop seasons. T1, T2, T3, and T4 denote treatments with four levels of irrigation amount, i.e., 0.6, 0.8, 1.0, and 1.2 times the cumulative evaporation of an indoor 20 cm standard pan. Bars denote standard error, n = 4.
Horticulturae 09 00706 g003
Figure 4. Reference crop evapotranspiration (ETo) (a) and cumulative reference crop evapotranspiration (∑ETo) (b) during both spinach growing seasons.
Horticulturae 09 00706 g004
Figure 5. Pan evapotranspiration (Epan) (a) and cumulative pan evapotranspiration (∑Epan) (b) during both spinach growing seasons.
Horticulturae 09 00706 g005
Figure 6. The relationship between reference crop evapotranspiration (ETo) and Epan in both spinach growing seasons. (a): The daily outdoor ETo (ETo-out) and indoor ETo (ETo-in); (b): the daily indoor Epan and outdoor Epan; (c): the daily ETo and Epan inside and outside plastic greenhouse; (d): the outdoor and indoor cumulative ETo(∑ETo-out and ∑ETo-in) during the whole growth period; (e): the outdoor and indoor cumulative Epan (∑Epan-out and ∑Epan-in) during the whole growth period; (f): the cumulative ETo (∑ETo) and Epan (∑Epan) inside and outside the plastic greenhouse during spring and autumn growth periods.
Horticulturae 09 00706 g006
Figure 7. The PCA of the correlation among the meteorological parameters and ETo and Epan. All the relationships were significant at the 0.05 level of probability. WS: wind speed; MIT: minimum air temperature; MAT: maximum air temperature; MinRH: minimum relative humidity; MaxRH: maximum relative humidity; SH: sunshine hours; VPD: vapor pressure difference; GSR: global solar radiation; ETo: reference crop evapotranspiration; Epan: pan evapotranspiration.
Horticulturae 09 00706 g007
Figure 8. The heat map of correlation between spinach yield, actual crop evapotranspiration (ET), leaf area index (LAI), plant height, SPAD values, biomass, water use efficiency (WUE), and irrigation amount. All the relationships are significant at 0.05 level of probability. The circle size indicated the variable importance (i.e., the proportion of explained variability).
Horticulturae 09 00706 g008
Figure 9. The predicted indoor daily Epan (a) and cumulative Epan (∑Epan) (b) in spring growing season using greenhouse index obtained in autumn growing season.
Horticulturae 09 00706 g009
Table 1. Irrigation time and irrigation amount during both spinach growing seasons.
SeasonTreatmentIrrigation Time (Month/Day) and Irrigation Water Amount (mm)Total Irrigation Water Amount
(mm)
5/135/175/225/276/16/7
Spring growing
season
T12513.012.513.712.714.691.5
T22517.316.718.316.919.4113.6
T32521.620.922.921.124.3135.8
T42525.925.127.525.329.2158.0
Autumn growing
season
9/219/2710/1010/23---
T13512.814.512.0--74.4
T23517.119.416.0--87.5
T33521.424.220.0--100.6
T43525.729.024.0--113.7
“-” indicate no data. T1, T2, T3, and T4 denote treatments with four levels of irrigation amount, i.e., 0.6, 0.8, 1.0, and 1.2 times cumulative evaporation of an indoor 20 cm standard pan.
Table 2. Plant height and biomass of spinach based on fresh and dry weight of 10 plants in different organs as affected by irrigation amounts in spring growing season in 2022.
Sampling DateTreatmentsPlant Height
(cm)
Total Fresh Weight
(g)
Leaf Fresh Weight
(g)
Stem Fresh Weight (g)Leaf Dry Weight
(g)
Stem Dry Weight
(g)
Total Dry Weight (g)Fresh Weight/Dry Weight
Ratio
5/31T114.1a37.1a23.7a13.4a2.1a0.8a2.9a12.8a
T214.1a36.6a24.6a12.0a2.3a0.7a2.9a12.5a
T314.0a36.6a24.5a12.1a2.3a0.7a3.0a12.3a
T414.8a36.9a23.9a13.0a2.1a0.6a2.7a13.4a
6/6T126.2a102.6a53.0a49.6a4.3a2.3a6.6a15.6a
T226.3a103.8a55.5a48.3a4.3a2.5a6.8a15.3a
T325.9a105.4a56.1a49.3a4.5a2.4a6.9a15.3a
T425.3a92.1a47.9a44.2a3.9a2.4a6.3a14.6a
6/12T137.2a203.1a89.7a113.4ab7.1a5.9a13.0ab15.6a
T236.3a210.1a91.3a118.8ab7.6a6.0a13.7a15.4a
T336.6a207.8a86.3a121.6a7.1a6.0a13.0ab15.9a
T436.5a175.3a74.4a100.9b6.0a5.2a11.2b15.6a
Note: T1, T2, T3, and T4 denoted treatments with four levels of irrigation amount, i.e., 0.6, 0.8, 1.0, and 1.2 times cumulative evaporation of an indoor 20 cm standard pan. Values in columns followed by the same letter in the same season are not significantly different at p < 0.05.
Table 3. Plant height and biomass of spinach based on fresh and dry weight of 10 plants in different organs as affected by irrigation amounts in autumn growing season in 2022.
Sampling DateTreatmentsPlant Height
(cm)
Total Fresh Weight (g)Leaf Fresh Weight
(g)
Stem Fresh Weight (g)Leaf Dry Weight
(g)
Stem Dry Weight
(g)
Total Dry Weight (g)Fresh Weight/Dry Weight Ratio
10/4T110.2a20.0a15.7b4.3a1.4a0.3a1.6a12.2a
T210.0a19.9a15.5b4.4a1.4a0.3a1.7a12.0a
T310.0a20.3a15.8b4.5a1.3a0.3a1.7a12.2a
T410.4a22.0a17.2a4.8a1.5a0.3a1.8a12.4a
10/11T122.8a105.5a67.5a38.0a5.0a1.9a6.9a15.2a
T222.4a106.7a69.9a36.9ab5.3a1.8a7.2a14.9a
T322.8a105.1a67.9a37.2ab5.2a1.8a7.0a15.1a
T421.7a93.2a60.9a32.3b4.7a1.6a6.4a14.6a
10/28T134.0a231.7a116.8a114.9a13.7a10.0a23.7a9.8a
T232.9ab219.7a115.8a103.9ab13.7a9.6ab23.3a9.4a
T333.0ab210.9a111.6a99.3b13.2a9.2b22.3a9.4a
T431.8b208.4a111.6a96.8b13.5a9.5ab22.9a9.1a
Note: T1, T2, T3, and T4 denoted treatments with four levels of irrigation, i.e., 0.6, 0.8, 1.0, and 1.2 times cumulative evaporation of an indoor 20 cm standard pan. Values in columns followed by the same letter in the same season are not significantly different at p < 0.05.
Table 4. Leaf area index (LAI) and leaf traits including leaf areas, specific leaf area, and leaf SPAD values during both spinach growth seasons.
Sampling DateTreatmentSpring Growing SeasonAutumn Growing Season
LAILeaf Areas (cm2)Specific Leaf Weight
(mg cm−2)
SPADLAILeaf Areas (cm2)Specific Leaf Weight (mg cm−2)SPAD
Initial season T11.4a61.1a3.50a41.3a0.76a38.3a3.62a43.8a
T21.6a63.1a3.64a41.4a0.77a38.5a3.53a43.7a
T31.7a64.2a3.56a41.1a0.79a39.7a3.39a43.4a
T41.5a63.5a3.38a41.6a0.84a42.0a3.47a43.6a
Mid-seasonT13.8a160.7a2.67a42.1a3.7a185.4a2.73a44.6a
T24.5a163.4a2.64a41.8a3.8a190.2a2.80a45.2a
T34.4a158.4a2.84a42.0a3.7a186.0a2.75a44.5a
T43.6a149.3a2.61a42.3a3.4a170.0a2.79a44.3a
Late seasonT16.4a274.1a2.60a44.3a7.0a352.4a3.88b49.7a
T26.9a275.4a2.78a44.7a7.0a350.3a3.92b49.4a
T36.7a262.8a2.69a44.3a6.5a324.4a4.07ab49.2a
T45.7a235.4a2.56a45.1a6.5a326.7a4.15a49.5a
Note: The initial season growth stage, mid-season growth stage, and late season growth stage indicate 0–20, 21–26, and 27–32 days after sowing for spring growing season, and 0–21, 22–30, and 31–38 days after sowing for autumn growing season, respectively. T1, T2, T3, and T4 denote treatments with four levels of irrigation, i.e., 0.6, 0.8, 1.0, and 1.2 times cumulative evaporation of an indoor 20 cm standard pan. Values in columns followed by the same letter in the same season are not significantly different at p < 0.05.
Table 5. Crop coefficients during both growing seasons of spinach.
SeasonsTreatmentsDays after Sowing (d)
1–89–1415–2021–2627–32
Spring T10.90.50.70.60.5
T21.00.70.80.70.5
T31.00.90.90.90.6
T41.11.11.01.00.8
Autumn 1–78–1415–2122–3031–38
T10.70.70.60.60.5
T20.70.70.70.70.7
T30.60.80.80.80.8
T40.60.90.90.90.9
FAO-recommended Kc values0.700.70.7–1.01.01.0
Disclaimer/Publisher’s Note: The statements, opinions and data contained in all publications are solely those of the individual author(s) and contributor(s) and not of MDPI and/or the editor(s). MDPI and/or the editor(s) disclaim responsibility for any injury to people or property resulting from any ideas, methods, instructions or products referred to in the content.

