Article

RVE1, DBB1b, and COL2 Transcription Factors Are Responsive to Combined Stress by UV-B Radiation and Cold in Bell Pepper (Capsicum annuum)

by
Brandon Estefano Morales-Merida
1,
Jesús Christian Grimaldi-Olivas
1,
Abraham Cruz-Mendívil
2,
Claudia Villicaña
3,
José Benigno Valdez-Torres
1,
José Basilio Heredia
1,
Rubén León-Chan
4,
Luis Alberto Lightbourn-Rojas
4 and
Josefina León-Félix
1,*
1
Laboratorio de Biología Molecular y Genomica Funcional, Centro de Investigación en Alimentación y Desarrollo, A. C., Culiacán 80110, Sinaloa, Mexico
2
CONACYT—Instituto Politécnico Nacional, Centro Interdisciplinario de Investigación para el Desarrollo Integral Regional Unidad Sinaloa, Guasave 81101, Sinaloa, Mexico
3
CONACYT—Laboratorio de Biología Molecular y Genómica Funcional, Centro de Investigación en Alimentación y Desarrollo, A. C., Culiacán 80110, Sinaloa, Mexico
4
Laboratorio de Genética, Instituto de Investigación Lightbourn, A. C., Jiménez 33981, Chihuahua, Mexico
*
Author to whom correspondence should be addressed.
Horticulturae 2023, 9(6), 699; https://doi.org/10.3390/horticulturae9060699
Submission received: 20 April 2023 / Revised: 27 May 2023 / Accepted: 12 June 2023 / Published: 14 June 2023

Abstract

:
Ultraviolet-B radiation (UV-B) and cold limit the growth and development of plants, which generates changes in gene expression. This allows plants to respond to stress through regulatory proteins, such as transcription factors, that activate or repress the expression of stress-response genes. RNA-Seq data and WGCNA analyses were utilized to identify the hub genes. Our study found a total of 25, 24, and 29 transcription factors at different time points T1, T2, and T3, respectively, under combined stress (ultraviolet-B radiation and cold). RVE1 (MYB-related), COL2 (CO-like), and DBB1b (DBB) were identified as candidate hub genes. Moreover, Gene Ontology (GO) and Kyoto Encyclopedia of Genes and Genomes (KEGG) enrichment showed that RVE1, DBB1b, and COL2 were mostly involved in energy production, the antioxidant system (enzymatic and non-enzymatic), signaling through abscisic acid and CA2+, response to light stimulus, and cellular homeostasis. These findings provide the basis for further investigation related to UV-B radiation and cold stress response mechanisms in plants.

1. Introduction

As sensitive and immobile organisms, plants face several abiotic stresses such as heat, drought, ultraviolet radiation (UV), and cold (among others); these greatly limit plant growth, yield, and quality [1,2,3]. The growth, geographical distribution, productivity, and seasonal behavior of plants are governed by temperature and light; when the temperature ranges between 0–15 °C, the plants suffer cold damage [4,5]. On the other hand, ultraviolet B radiation (280–320 nm) is an integral component of sunlight. Exposure to high amounts of UV-B causes plant injury [6,7,8].
To adapt or avoid these unfavorable conditions, plants have evolved complex signal transduction pathways and response processes generated by functional and regulatory proteins. Regulatory proteins that respond to stress include protein kinases, proteinases, and transcription factors (TFs) [9]. TFs play crucial roles as terminal transducers; they activate or repress the expression of stress-response genes by interacting with local and distal specific cis-elements in their promoter region, and in transcriptional complexes that regulate the expression of a huge number of genes [10,11,12]. Around 80 TFs families exist in plants, but only a few have been exhaustively studied in response to cold and UV-B radiation stress abiotic stress, such as APETALA 2/Ethylene Responsive Factor (AP2/ERF), double B-box zinc finger (DBB), CONSTANS-like (CO-like), basic/helix–loop–helix (bHLH), basic leucine zipper (bZIP), gibberellic-acid insensitive (GAI), repressor of GAI (RGA), and SCARECROW (SCR) (GRAS), heat stress transcription factors (HSF), myeloblastosis (MYB), NAM, ATAF, and CUC transcription factors (NAC), and WRKY [11,13,14,15].
MYB-related TFs are a subfamily of the MYB family, frequently containing a single MYB repeat (1R-MYB). Each repeat section R consists of residues and spacer sequences with a length of 51–52 conserved amino acids [16,17]. In Capsicum annuum, 103 MYB-related members were identified; they were expressed during all plant developmental tissues (leaf, flower, ovary, pulp, seed, and placenta) [18]. The DBB TFs consists of one or two B-box domain in the N-terminal region [19]. There are 24 DBBs found in C. annuum, named CaDBB1 ~ 24, that were expressed in root, stem, leaf, flower, fruit, and seed, as well as under cold, heat, salt, and drought stress [20]. The CO-like family is defined by two conserved domains: the first is the CO, COL TOC1 (CCT) domain at the C-terminus (43 amino acids) and N-terminus with one to two B-box type zinc finger structures [21,22]. A total of 10 COL TFs were described in C. annuum. The expression patterns of COL genes were identified in different tissues (root, stem, leaf, bud, flower, and fruit development), and the expression levels also showed changes in response to cold, heat, salt, and osmotic stress [23].
Several studies showed that bioinformatic tools, such as weighted gene co-expression network analysis (WGCNA), have been developed to assess biomarkers and detect hub genes of RNA-Seq data involved in abiotic stress responses [24,25,26,27]. For example, Liu et al. reported 17 TFs as hub genes of maize drought stress adaptation with WGCNA [28]. Moreover, one and nine candidates hub TFs related to salt response in rice have been detected using WGCNA [29,30]. Likewise, the use of WGCNA focused on the study of hub TFs has helped to improve the response of plants to abiotic stress. Long et al. identified one hub TF (ZmHsftf13) whose overexpression in transgenic lines results in a healthier growth phenotype than wild-type plants under heat stress [31]. Further, a novel bZIP transcription factor (HvbZIP21) was discovered in wild barley, and silencing of HvbZIP21 suppressed drought tolerance. In Arabidopsis, overexpression of HvbZIP21 boosted drought tolerance by increasing superoxide dismutase, peroxidase, and catalase activities [32]. Similar research in rice showed that overexpression of the GhNAC072 gene enhanced drought and salt stress tolerance [33]. Therefore, TFs contribute to the response and adaptation of plants to abiotic stresses; they are also key candidates to be genetically engineered to breed stress-tolerant crops [10,34].
Studies in C. annuum have reported morphological, biochemical, and molecular changes in response to cold [35,36,37] and UV-B radiation [38,39]. Additionally, cold and UV-B radiation can happen simultaneously [40,41,42]. Referring to this, transcriptional regulation of five anthocyanin biosynthetic genes has been identified, as well as the reduction of chlorophyll and accumulation of carotenoids, total flavonoids, apigenin, and luteolin glucosides [43,44]. In a previous study, we detected the gene expression in response to combined stress by cold and UV-B radiation to obtain insights into the temporal dynamics of some functional genes [45]. Nevertheless, an exhaustive analysis of the behavior of TFs in response to combined stress is lacking, as is the identification of hub TFs. For these reasons, the expression profile of transcription factors responsive to combined stress by UV-B radiation and cold in C. annuum needs to be addressed.
Thus, the present study was focused on determining the expression profile of TFs genes of bell pepper stems (C. annuum L.) in response to combined stress factors (UV-B radiation and cold) and temporal dynamic expression. Using these data, we performed WGCNA to identify candidate hub genes.

2. Materials and Methods

2.1. Data Collection

The RNA-Seq data utilized in the current study were retrieved from the Sequence Read Archive (SRA) of NCBI with accession number PRJNA84432. The plant material used to generate the RNA-Seq data was previously described [43]. Bell pepper plants were put into a plant growth chamber 28 days after sowing (DAS) for three days (28 to 30 DAS) at 25/20 °C (day/night), a 12 h photoperiod (from 6:00 to 18:00 h) of photosynthetically active radiation (PAR) (972 μmol·m−2·s−1) and relative humidity of 65%. The control plants were continued until 31 DAS, as described. For the cold and cold + UV-B radiation treatments, the growth chamber was set at 15/10 °C the previous night (day 30 at 18:00 h), and it was maintained until 31 and 32 DAS. While for the UV-B radiation and cold + UV-B radiation treatments, the plants were irradiated for six h with PAR (from 06:00 to 10:00 and 16:00 to 18:00 h) and 6 h of UV-B irradiation (72 kJ·m2, from 10:00 to 16:00 h) to 31 and 32 DAS. Stem samples from 10 bell pepper plants per treatment were utilized; control plants were collected at 10:00 of day 31 (T0), and plants under stress were taken at 11:00 on day 31 (T1), 13:00 on day 31 (T2), and 11:00 on day 32 (T3) (Figure 1) [44].

2.2. Re-Analyses of Transcriptome Data

The raw reads quality was visualized using FASTQC (v0.11.9, https://www.bioinformatics.babraham.ac.uk/projects/fastqc/, accessed on 15 April 2022), and low-quality short reads (Q < 25, length > 20 bp) were removed using Trimmomatic (v0.39) [46]. Then, the trimmed RNA-Seq reads were aligned to the pepper reference genome (Pepper Zunla 1 Ref_v1.0) using HISAT2 (v2.2.1) [47]. After that, the number of reads mapped to each gene was calculated using HTSeq-count (v0.13.5) [48]. R/DESeq2 (v1.34.0) was used for differential expression analysis, where different times after the application of cold, UV-B radiation, and cold + UV-B were compared vs. control. Genes with absolute value log2FoldChange ≥ 1.5 and false discovery rate (FDR) < 0.05 were accepted as differentially expressed genes (DEGs) [49].

2.3. Transcription Factors Identification

First, nucleotide and amino acid sequences of total genes regulated (log2FoldChange < 0 and >0) by combined stress (cold + UV-B) were used to identify TFs in the databases iTAK (http://itak.feilab.net/cgi-bin/itak/db_family.cgi?cat=transcription%20factor&plant=4072, accessed on 12 May 2022) and PlantTFDB (http://planttfdb.gao-lab.org/index.php?sp=Can, accessed on 12 May 2022). After that, TFs were matched with the DEGs list to identify differentially expressed TFs (DETFs). Those DETFs found in the three time points (T1, T2, and T3) of the combined stress were selected as common TFs [50]. Next, the heatmaps and Venn diagrams were plotted with the pheatmap (v1.0.12) and VennDiagram (v1.7.1) packages in RStudio (v1.4.1103).

2.4. Co-Expression and Functional Annotation

The automatic network construction function was used to construct co-expression modules in WGCNA (v1.70-3); default settings were employed, except the power was 10, minModuleSize was 30, and networkType = “signed” [24]. The count values of all genes were normalized (median of ratios with R/DESeq2 (v1.34.0)), and all low-expression genes were removed (count < 10 in each treatment). Next, the networks were visualized using Cytoscape (v3.9.0) [51]. The three main TFs in modules related to treatments trait were selected as hub genes using cytoHubba package in the Cytoscape software (v3.9.0). GO (Gene Ontology) and KEGG (Kyoto Encyclopedia of Genes and Genomes) enrichment analyses were conducted for neighbor genes connected to three TFs. GO enrichment analysis in the gene sets was performed using Gene List Analysis in the PANTHER database (http://www.pantherdb.org/about.jsp, accessed on 20 June 2022). KEGG pathway-enrichment analysis in the gene sets was performed using KOBAS (3.0) (http://kobas.cbi.pku.edu.cn, accessed on 30 June 2022). The GO terms and KEGG pathways with FDR < 0.05 were considered significantly enriched.

2.5. RT-qPCR Validation of the TFs

Six TFs genes were randomly selected, and their expression profiles were verified by RT-qPCR. Primers were designed with Primer3 software (https://bioinfo.ut.ee/primer3-0.4.0/primer3/, accessed on 13 June 2022) with the following attributes: amplicon size between 115 to 250 bp, primer size of 20 bp, the melting temperature near 60 °C, and GC content between 50 and 60% [44]. β-tubulin (β-TUB) gene was used as reference (housekeeping) gene [52]. All primers were manufactured by T4 oligo. The Superscript III kit (Invitrogen, Life Technologies, Carlsbad, CA, USA) was used to synthesize first-strand cDNA. A SsoAdvanced Universal SYBR® Green Supermix (Bio-Rad, Hercules, CA, USA) and CFX96TM Real-Time PCR detection system (Bio-Rad, Hercules, CA, USA) were used to perform RT–qPCR. The reaction program was: pre-denaturation at 95 °C for 30 s, followed by 40 cycles of denaturation at 95 °C for 10 s, and the annealing temperature (Ta) as described in Table 1 during 30 s. Melting curves were performed at the end of the amplification program to determine primer specificity. The FC = 2−ΔΔCt method was used with T0 as an internal reference for the quantification of gene expression.

3. Results

3.1. Differentially Expressed Transcription Factors

To find the total TFs, we compared combined stress in different time points (T1, T2, and T3) vs. control (T0). A total of 869 (458 up-regulated and 411 down-regulated), 842 (449 up-regulated and 393 down-regulated), and 937 (453 up-regulated and 484 down-regulated) TFs were identified for T1, T2, and T3, respectively (Figure S1; Table S1).
The differentially expressed TFs analysis showed a total of 25 TFs (17 up-regulated and 8 down-regulated) in T1, 24 TFs (17 up-regulated and 7 down-regulated) in T2, and 29 TFs (16 up-regulated and 13 down-regulated) in T3 (Figure 2; Table S2).

3.2. Common TFs

For common TFs (Table S3) across time points, ten TFs were up-regulated (Figure 3A), and three TFs were down-regulated (Figure 3B). The expression profiles of TF family members selected from combined stress were plotted in a heatmap graph (Figure 4); the TFs families detected were two bHLH (bHLH93 and bHLH38), one CO-like (COL2), one DBB (DBB1b), one DOF (CDF2), one AP2/ERF (DREB2A), three HSF (HSFC1, HSFA6B, and HSFA7A), and four MYB (MYB111, RVE1, RVE2, and MYB15). While four TFs (bHLH93, COL2, CDF2, and RVE2) were identified as uniquely responsive to combined stress (log2FoldChange ≥ 1.5), these TFs were identified solely in response to combined stress, compared to each stress individual.
The TF bHLH93 was more strongly induced by the combined stress than by each stress individual, except for UV-B T1, in which no induction was observed (Figure 4). Although bHLH38 was down-regulated under all stress conditions, the most significant down-regulation occurred in the cold and combined stress conditions (Figure 4).
COL2, DBB1b, and CDF2 showed the highest values of up-regulation in combined stress compared to each separate stress. This finding suggests that combined stress may have a secondary effect of inducing COL2, DBB1b, and CDF2 (Figure 4).
All treatments induced DREB2A, HSFC1, and HSFA6B. Otherwise, HSFA7A displayed down-regulation, except in radiation UV-B T1 (Figure 4).
Interestingly, we found that MYB111 showed the highest value of up-regulation in all treatments (Figure 4). RVE1 was up-regulated in all stress treatments but presented the highest induction by combined stress. RVE2 was up-regulated under cold and combined stress, but it was down-regulated by UV-B radiation stress (Figure 4). Lastly, MYB15 was down-regulated under cold and combined stress, but in UV-B T2, it was up-regulated. This TF showed the highest value of down-regulation under cold stress (Figure 4).

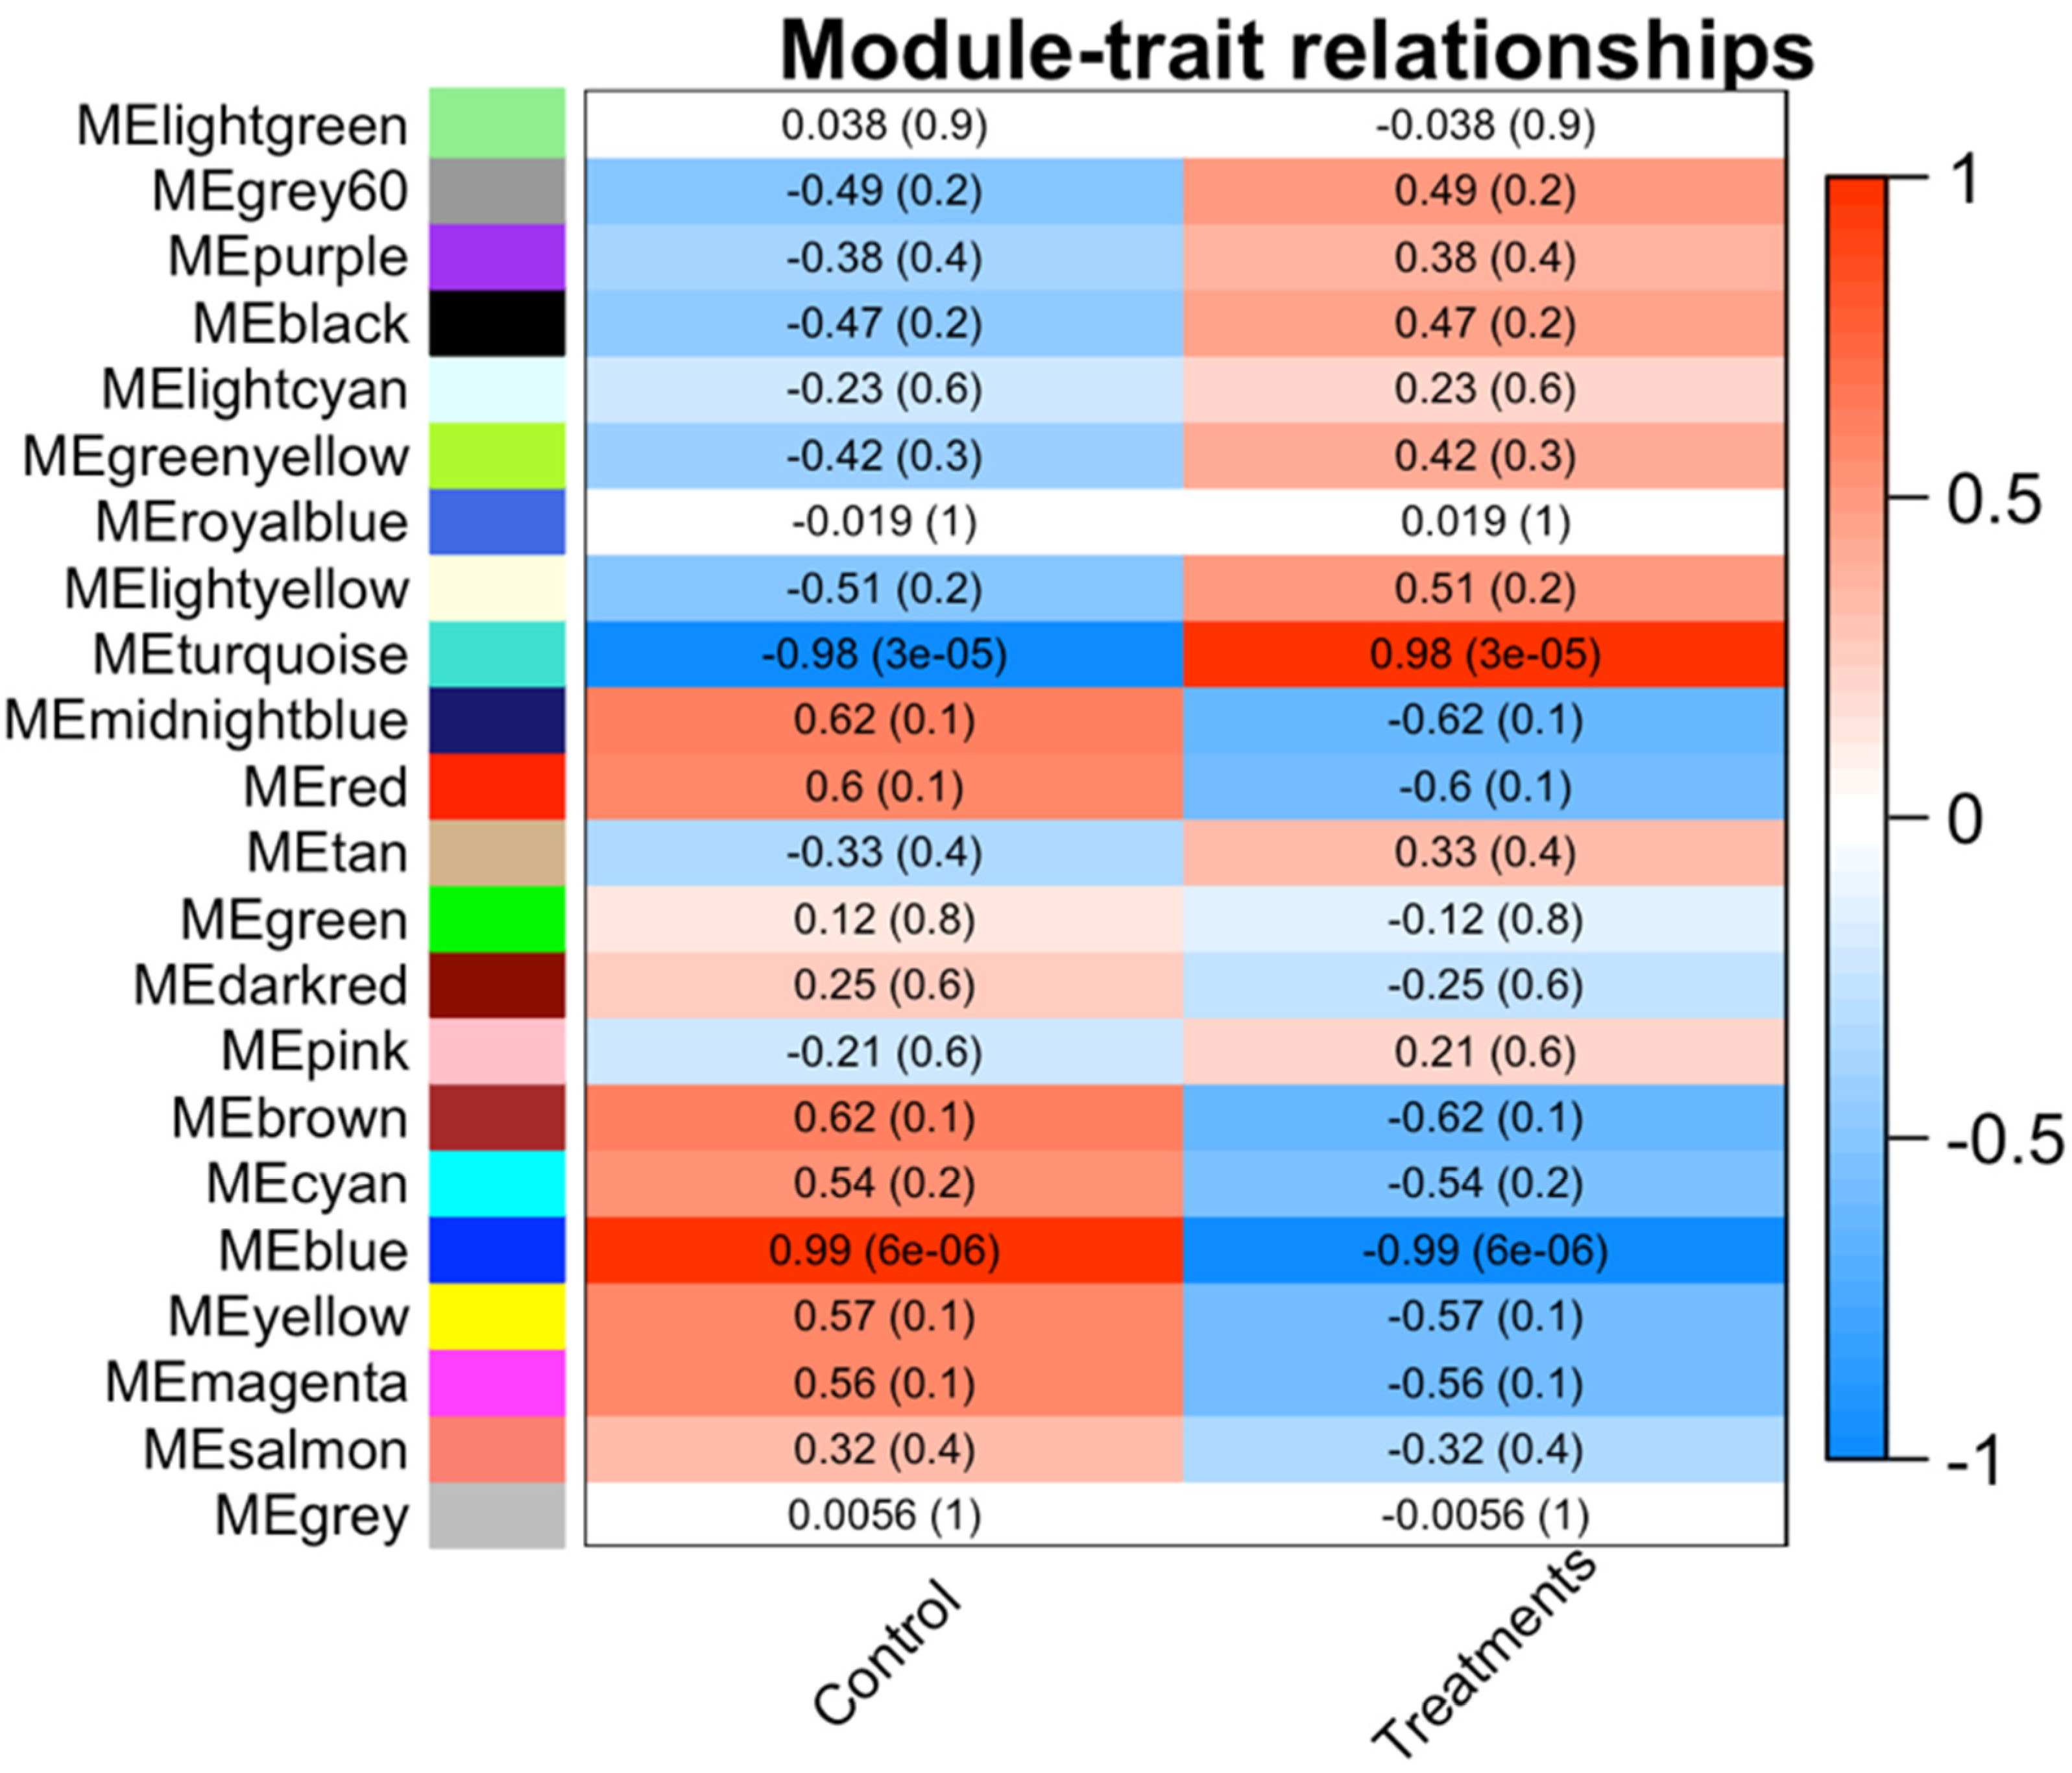
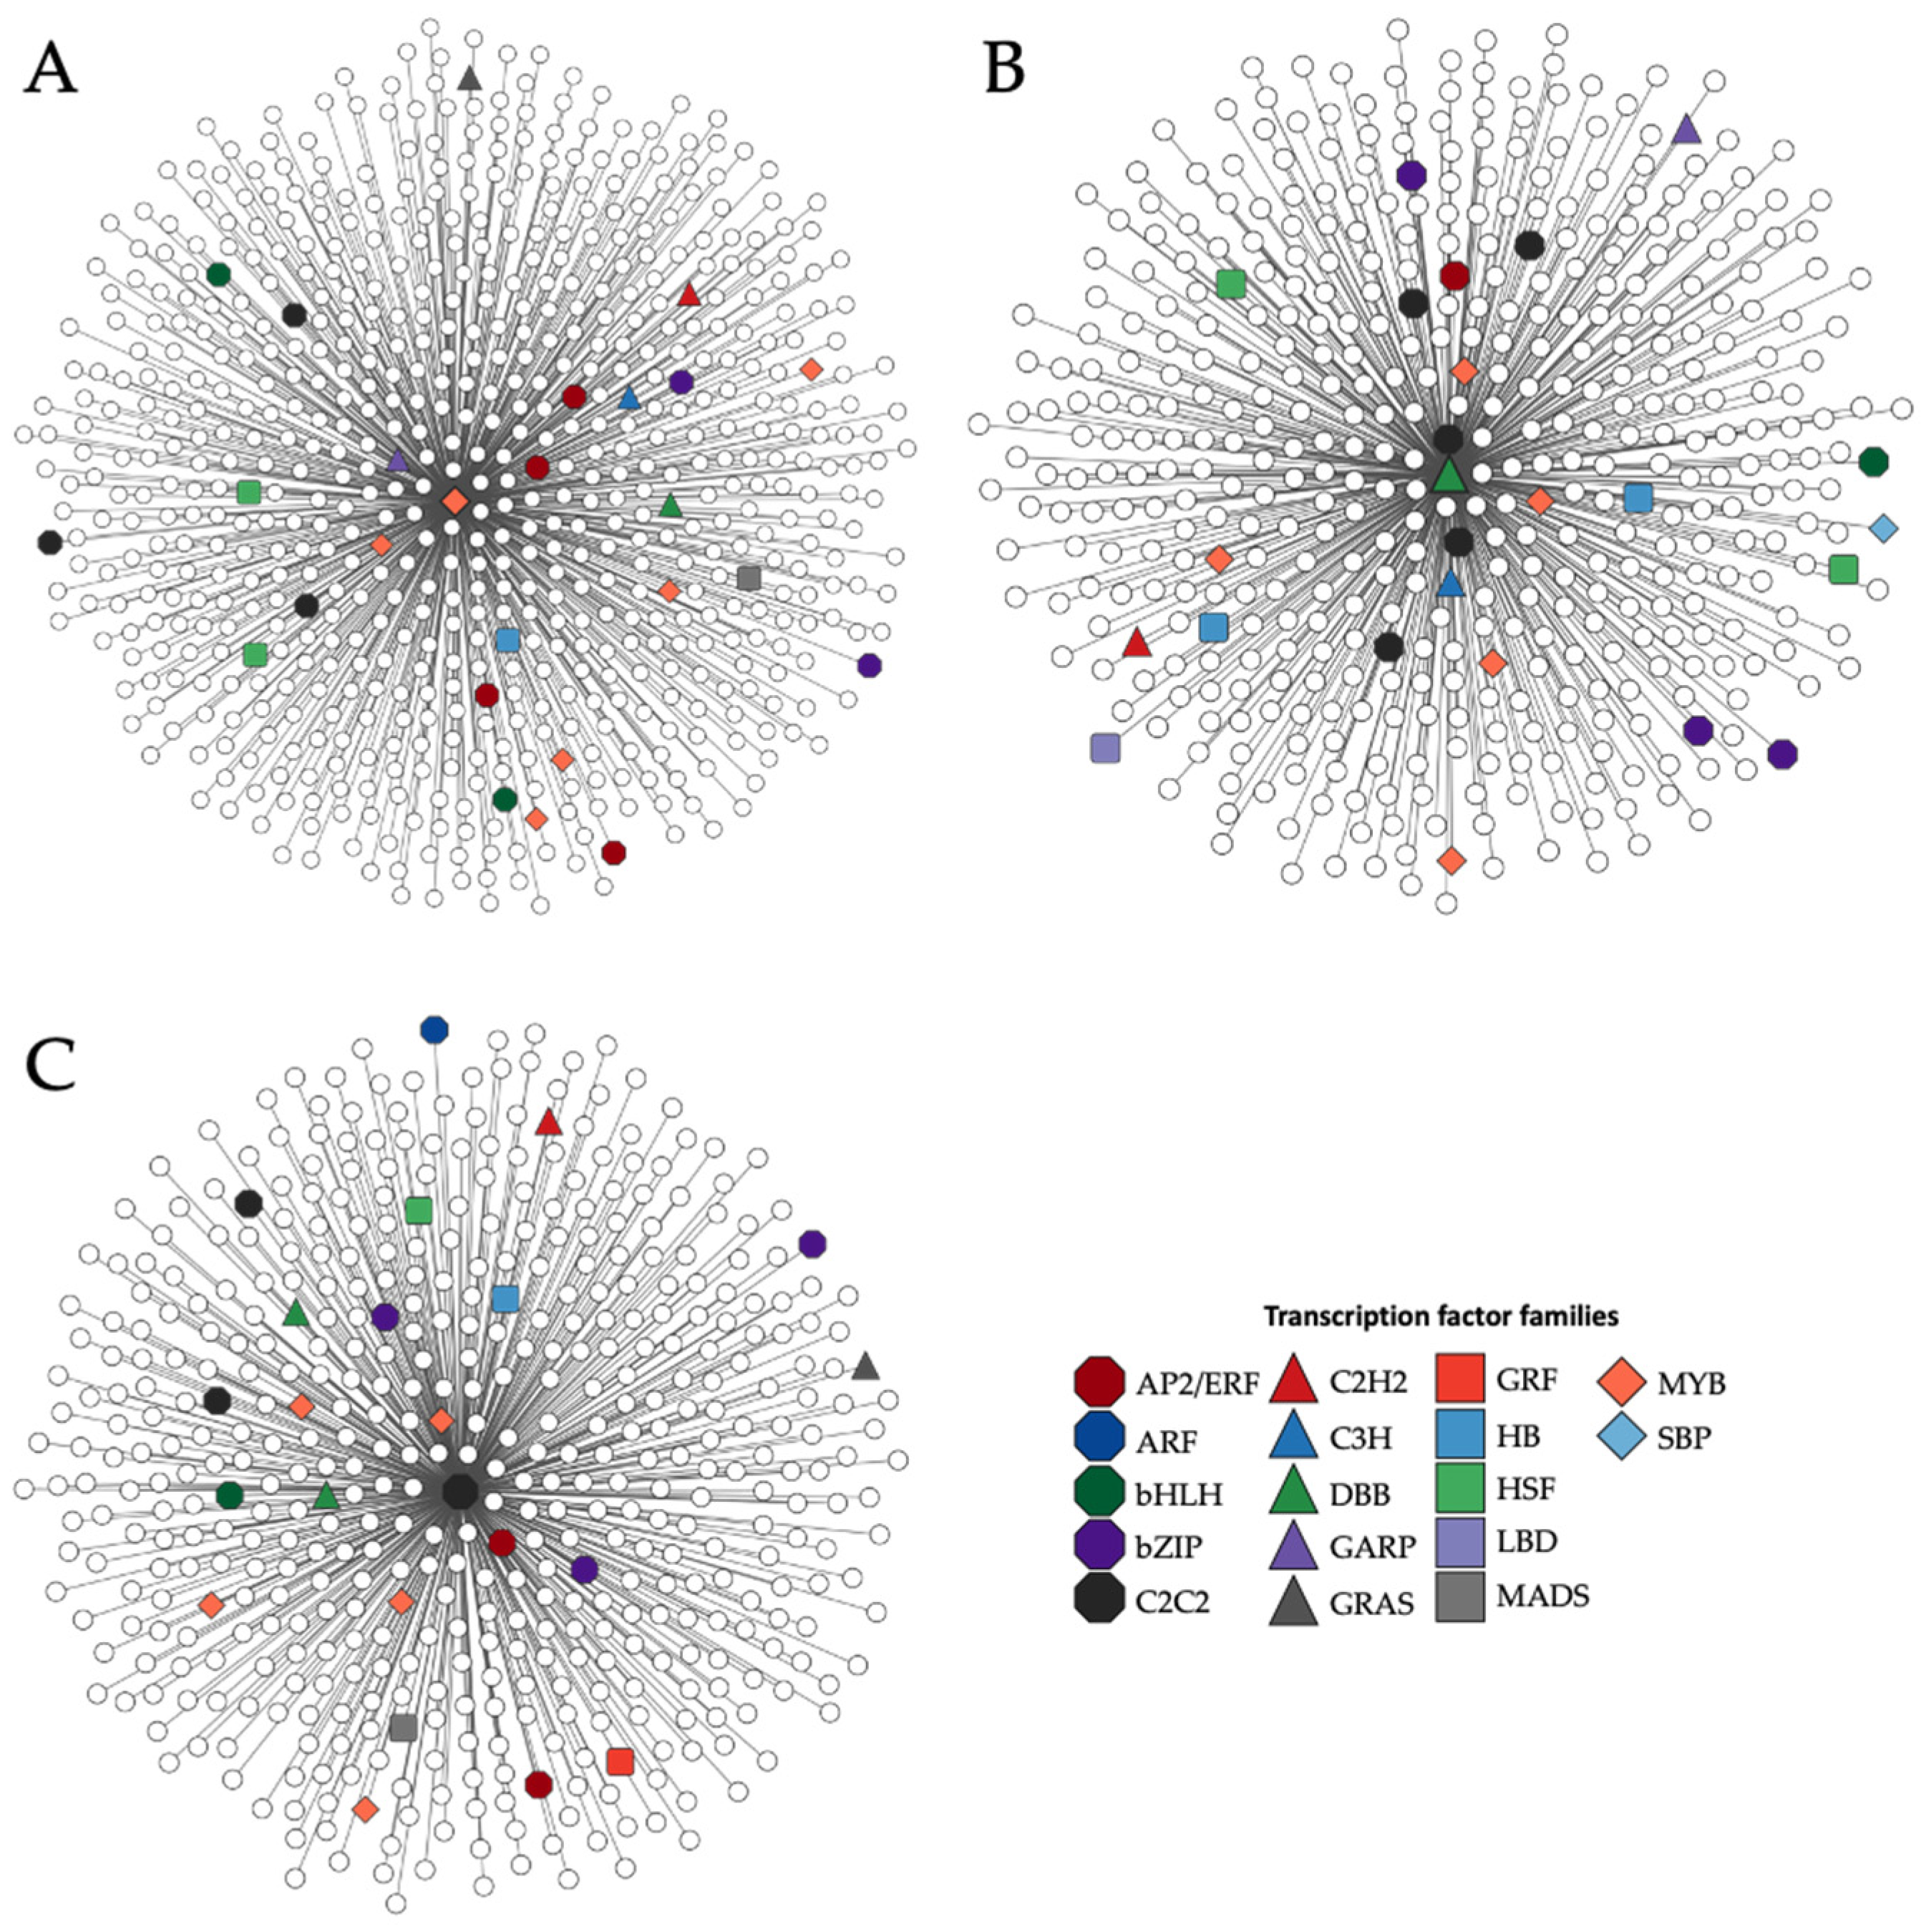
3.3. Co-Expression Network

We used WGCNA to find the hub TFs involved in the combined stress response. In addition, 21 module eigengenes (ME) were identified, and the genes not assigned to any module were placed in the grey module (Figure 5).
The number of genes in different modules ranged from 6 to 1972, and the MEturquoise, MEblue, MEbrown, MEyellow, and MEgreen modules contained more genes. The MEturquoise (0.98) and MEblue (0.99) modules had higher correlation coefficients at treatments and control, respectively. The number of genes in the turquoise module was 1972, while the blue module contained 1343 genes.
The MEblue and MEturquoise modules were selected because we observed 12 TF genes of the 13 common TFs across time points (Figure 4). RVE1 (MYB), COL2 (CO-like), and DBB1b (DBB) were identified as candidate hub genes due to the high number of direct neighbors from the gene co-expression network, with 684, 497, and 466 genes, respectively (Figure 6; Table S4). Additionally, RVE1 has direct connections to 25 TFs, including four AP2/ERF, one ARR-B, two bHLH, two bZIP, three C2C2, one C2H2, one C3H, one DBB, one GRAS, one HB, two HSF, one MADS, and five MYB (Figure 6A). Further, DBB (DBB1b) transcription factor was connected to 24 TFs, including one AP2/ERF, one bHLH, three bZIP, five C2C2, one C2H2, one C3H, one G2-like, two HB, two HSF, one LBD, five MYB, and one SBP (Figure 6B). Finally, C2C2-CO-like transcription factor (COL2) was related to twenty-two TFs, including two AP2/ERF, one ARF, one bHLH, three bZIP, two C2C2, one C2H2, two DBB, one GRAS, one GRF, one HB, one HSF, one MADS, and five MYB (Figure 6C).

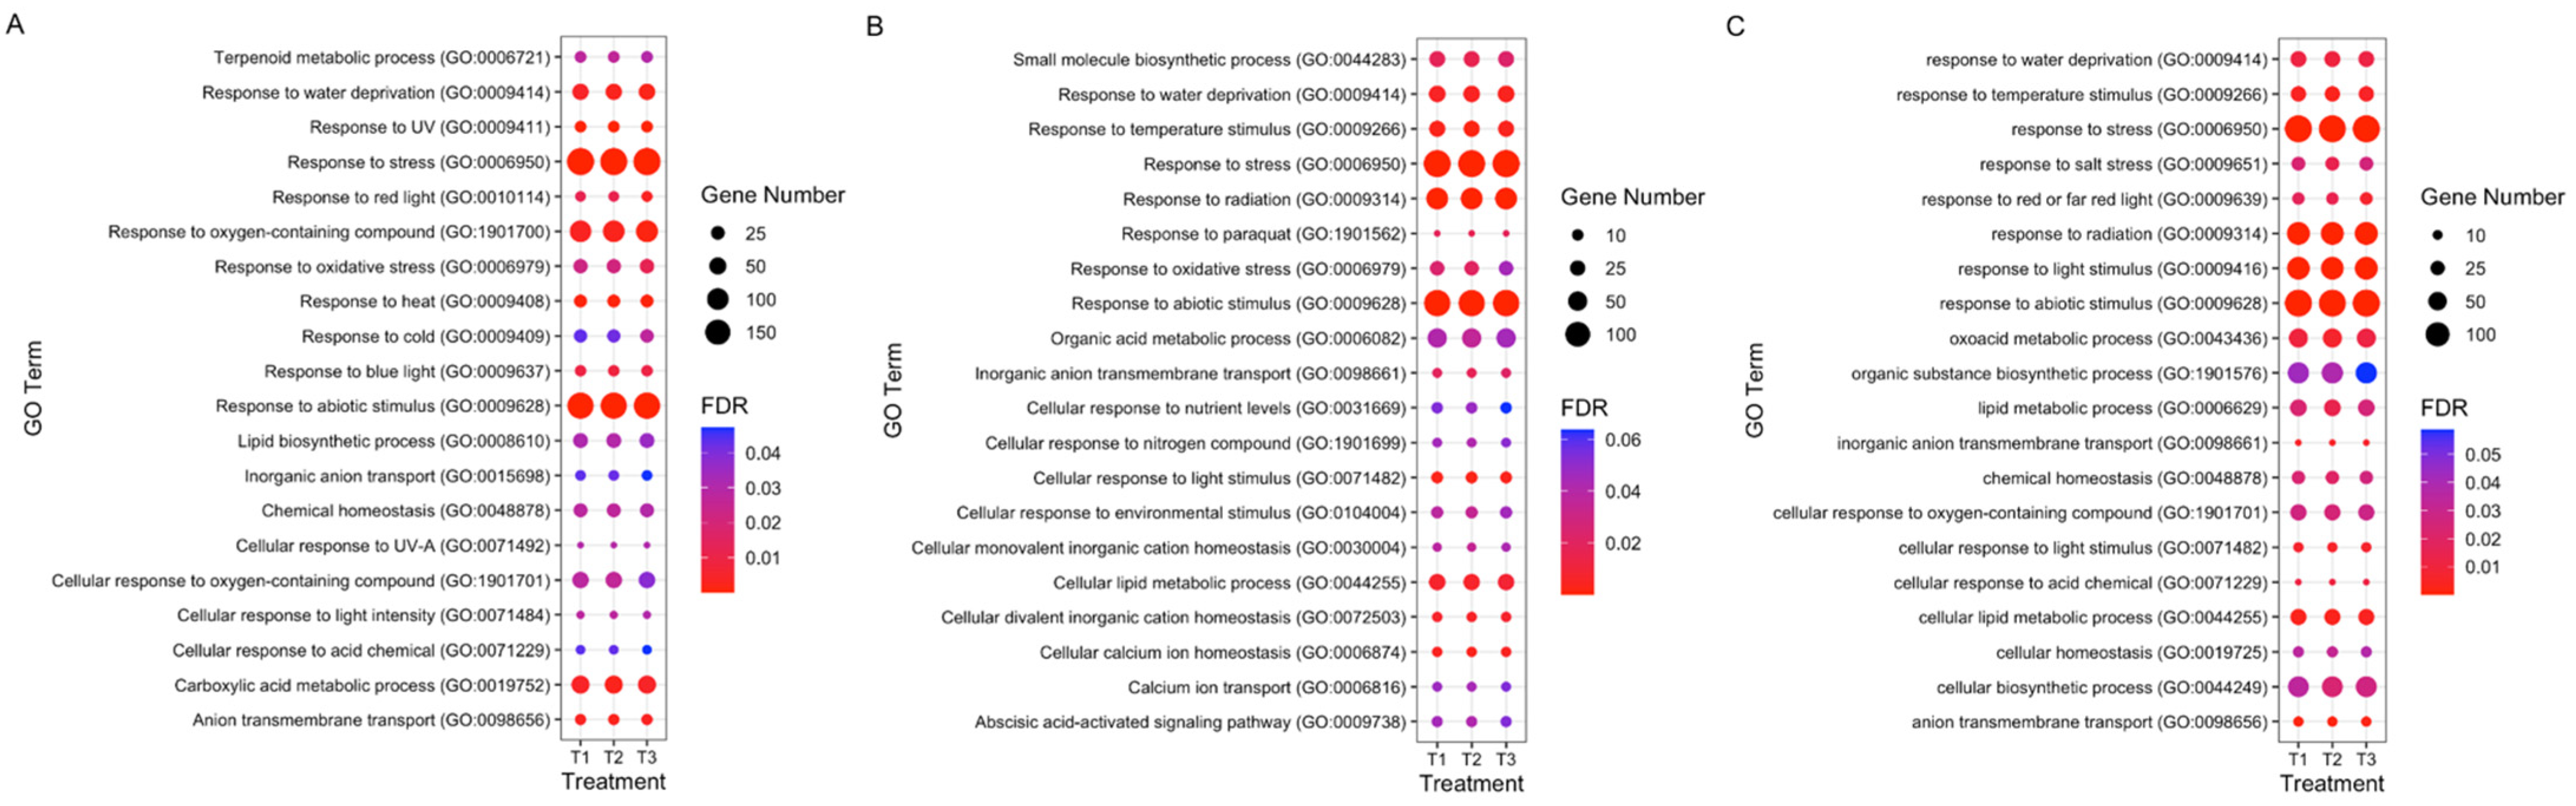
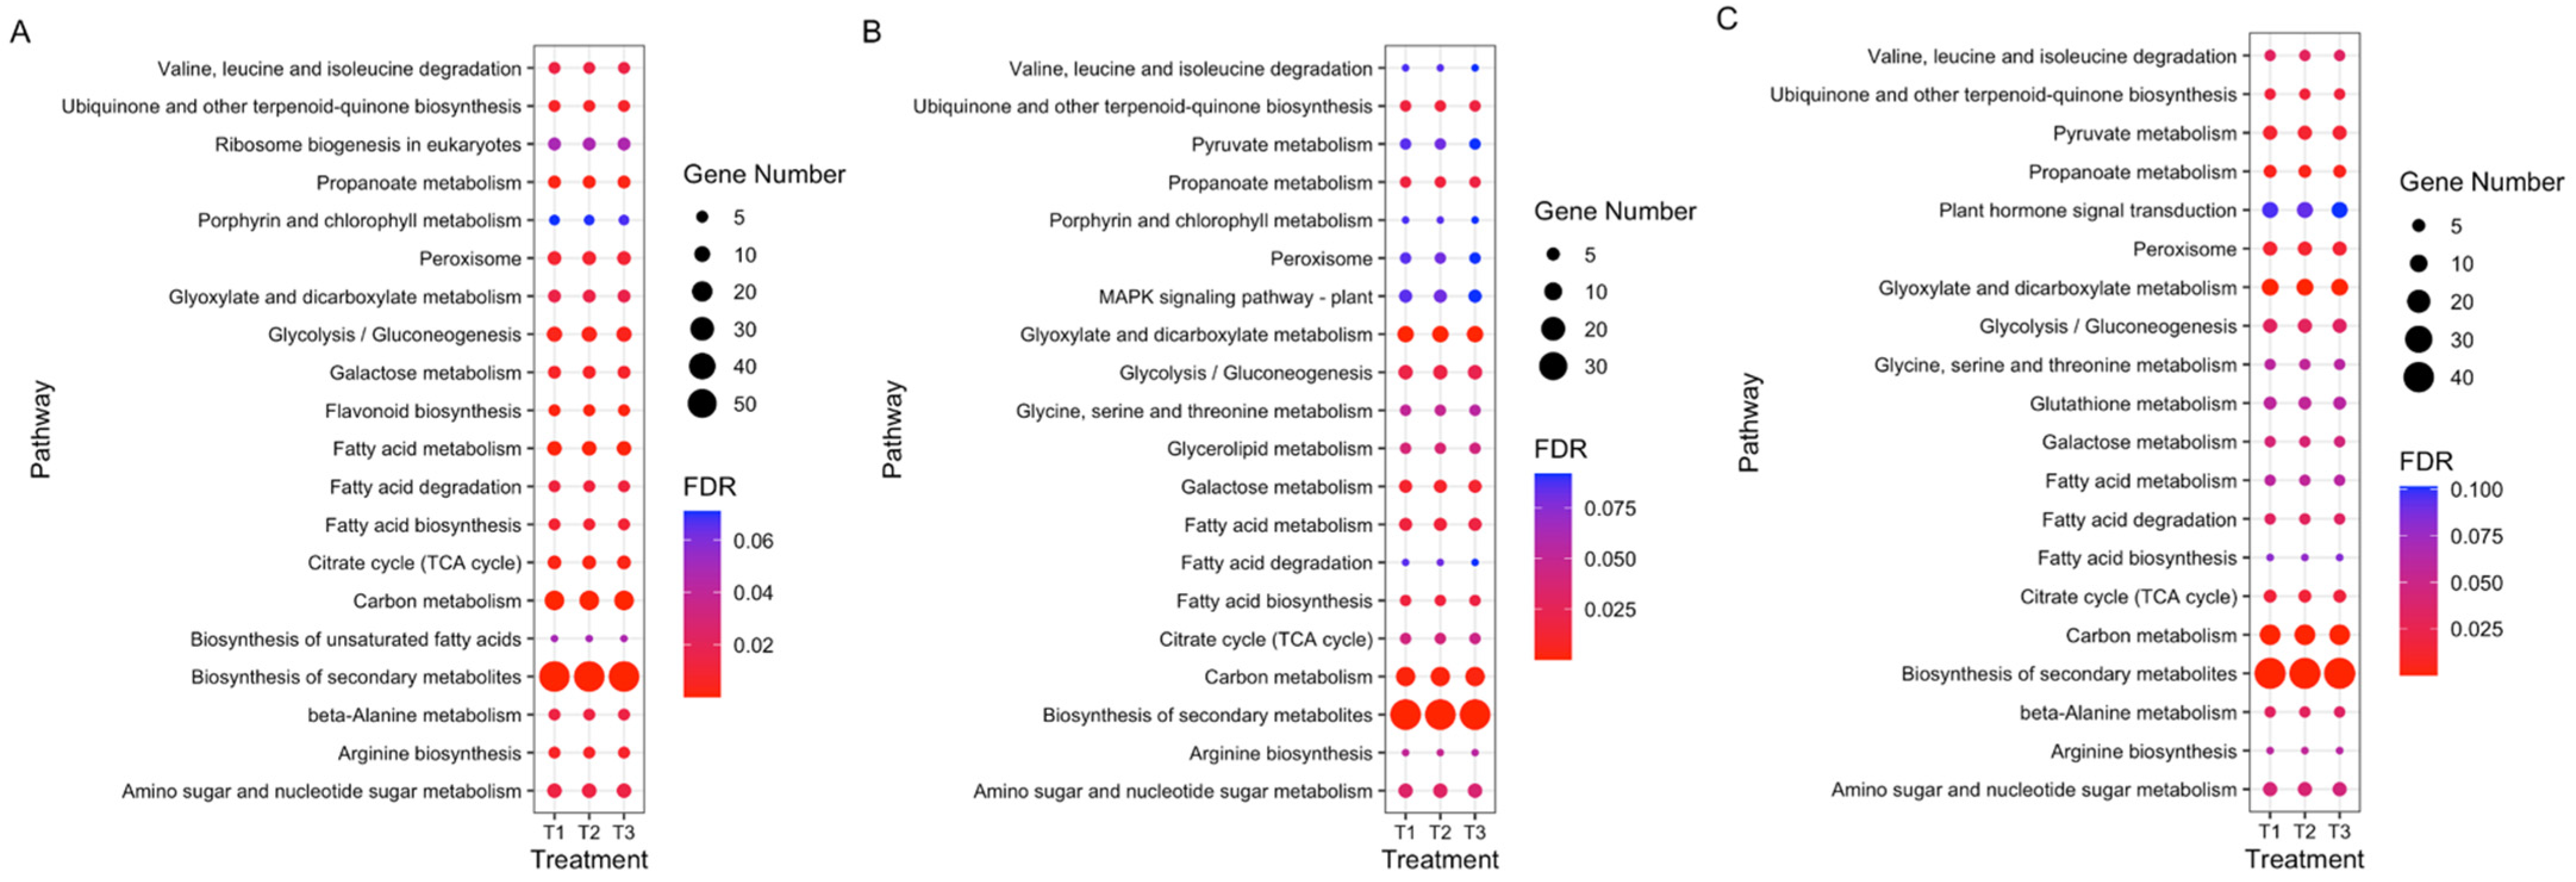
3.4. GO and KEGG Enrichment Analyses

We performed gene ontology and pathway analyses of these gene networks related to RVE1, COL2, and DBB1b TFs.
GO enrichment analysis significantly displayed 22, 24, and 23 GO Terms (FDR < 0.05) for genes connected to RVE1 in T1, T2, and T3, respectively (Table S5). The main GO-enriched terms were response to abiotic stimulus (GO:0009628), response to stress (GO:0006950), response to UV (GO:0009411), response to heat (GO:0009408), and anion transmembrane transport (GO:0098656). Additionally, the same GO terms are maintained over time (Figure 7A).
The DBB1b network had 20, 22, and 22 significant GO terms (FDR < 0.05) for T1, T2, and T3, respectively (Table S5). Response to abiotic stimulus (GO:0009628), response to radiation (GO:0009314), response to stress (GO:0006950), cellular response to light stimulus (GO:0071482), and response to temperature stimulus (GO:0009266) were enriched. These GO terms were present at all time points (Figure 7B).
Genes associated with COL2 displayed 20, 21, and 22 significant GO terms (FDR < 0.05) at T1, T2, and T3, respectively (Table S5). The main GO-enriched terms included response to radiation (GO:0009314), response to abiotic stimulus (GO:0009628), response to light stimulus (GO:0009416), response to stress (GO:0006950), and anion transmembrane transport (GO:0098656). The same enrichment profiles were identified at T1, T2, and T3 (Figure 7C).
Interestingly, by comparing the GO term enrichment among the three transcription factors (RVE1, COL2, and DBB1b), the response to abiotic stimulus (GO:0009628), response to stress (GO:0006950), and response to water deprivation (GO:0009414) were shared.
For RVE1, we found cellular response to UV (GO:0009411), response to heat (GO:0009408), response to oxygen-containing compound (GO:1901700), carboxylic acid metabolic process (GO:0019752), response to blue light (GO:0009637), response to red light (GO:0010114), terpenoid metabolic process (GO:0006721), cellular response to light intensity (GO:0071484), cellular response to UV-A (GO:0071492), lipid biosynthetic process (GO:0008610), response to cold (GO:0009409), and inorganic anion transport (GO:0015698) as unique GO terms.
On the other hand, the following terms were uniquely enriched for DBB1b: cellular calcium ion homeostasis (GO:0006874), cellular divalent inorganic cation homeostasis (GO:0072503), small molecule biosynthetic process (GO:0044283), response to paraquat (GO:1901562), cellular response to an environmental stimulus (GO:0104004), cellular monovalent inorganic cation homeostasis (GO:0030004), organic acid metabolic process (GO:0006082), abscisic acid-activated signaling pathway (GO:0009738), cellular response to nitrogen compound (GO:1901699), calcium ion transport (GO:0006816), and cellular response to nutrient levels (GO:0031669).
The unique terms enriched for COL2 were response to light stimulus (GO:0009416), oxoacid metabolic process (GO:0043436), response to red or far-red light (GO:0009639), lipid metabolic process (GO:0006629), response to salt stress (GO:0009651), cellular biosynthetic process (GO:0044249), cellular homeostasis (GO:0019725), and organic substance biosynthetic process (GO:1901576).
The KEGG pathway analysis revealed 19 significant pathways to T1, T2, and T3 (Table S6). Additionally, the genes that joined RVE1 were similar among the three time points, mainly focusing on ‘biosynthesis of secondary metabolites’, ‘carbon metabolism’, ‘fatty acid metabolism’, ‘flavonoid biosynthesis’, and ‘propanoate metabolism’ (Figure 8A).
Meanwhile, 12, 14, and 12 pathways were significantly identified for DBB1b (Table S6). The genes connected to DBB1B were enriched mainly in ‘biosynthesis of secondary metabolites’, ‘glyoxylate and dicarboxylate metabolism’, ‘carbon metabolism’, ‘galactose metabolism’, and ‘ubiquinone and another terpenoid-quinone biosynthesis’. These pathways were present at all time points (Figure 8B).
In addition, 14 pathways were identified for each time point of genes associated with COL2 (Table S6). The main pathways included ‘biosynthesis of secondary metabolites’, ‘glyoxylate and dicarboxylate metabolism’, ‘carbon metabolism’, ‘propanoate metabolism’, and ‘pyruvate metabolism’. Further, these pathways were found across all time points (Figure 8C).
Interestingly, ‘biosynthesis of secondary metabolites’, ‘carbon metabolism’, ‘Citrate cycle (TCA cycle)’, ‘propanoate metabolism’, ‘glycolysis/gluconeogenesis’, ‘galactose metabolism’, ‘ubiquinone and another terpenoid-quinone biosynthesis’, ‘amino sugar and nucleotide sugar metabolism’, and ‘glyoxylate and dicarboxylate metabolism’ were found as enriched pathways shared for genes related to RVE1, COL2, and DBB1b.
Additionally, pathways such as ‘flavonoid biosynthesis’, ‘ribosome biogenesis in eukaryotes’, and ‘biosynthesis of unsaturated fatty acids’ were only enriched terms to direct neighbors of RVE1, while ‘glycerolipid metabolism’ and ‘glycine, serine, and threonine metabolism’ were only identified to DBB1b, and ‘pyruvate metabolism’ was only assigned to genes connected to COL2.

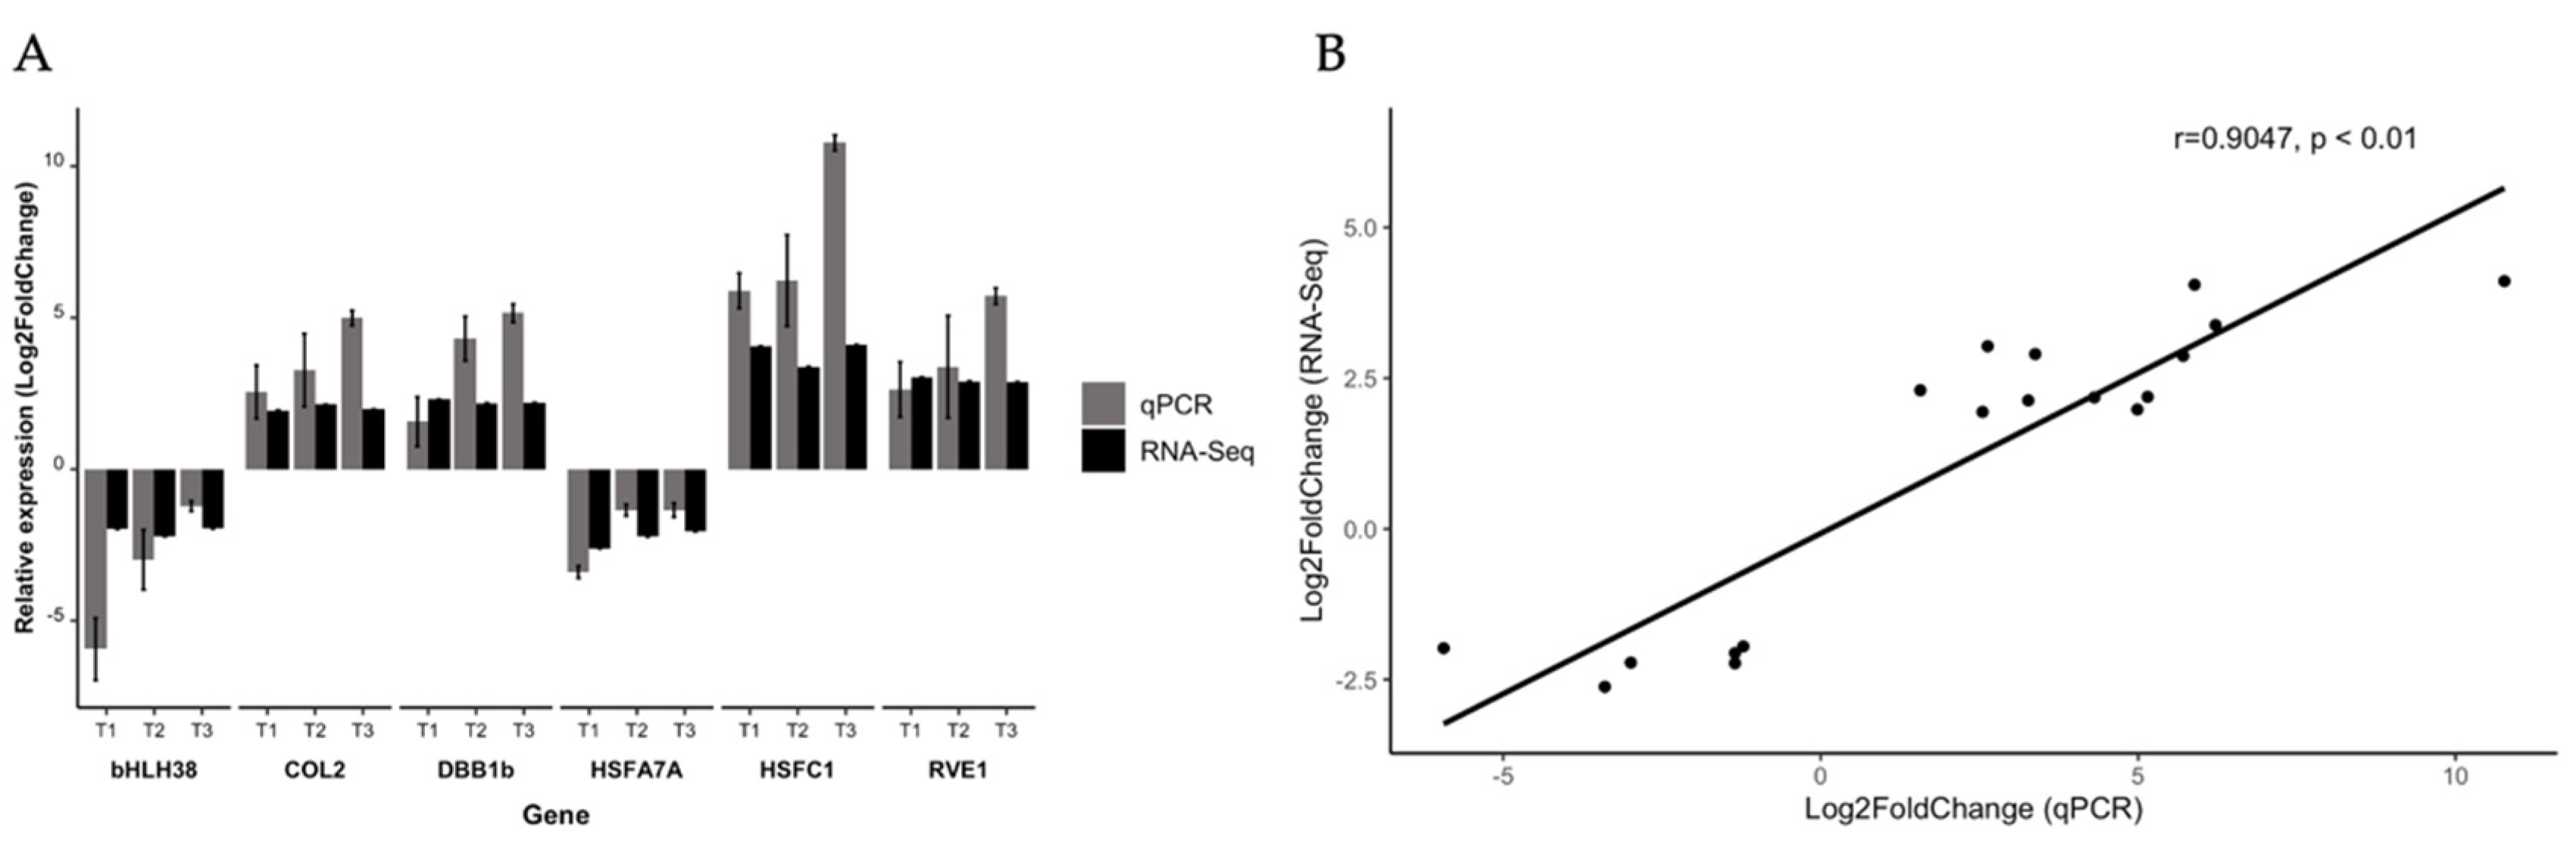
3.5. Transcription Factors Validation by RT-qPCR

The RT-qPCR was used to validate the expression profiles of six putative hub TFs (bHLH38, COL2, DBB1b, HSFA7A, HSFC1, and RVE1) responsive to combined stress (UV-B radiation and cold) (Figure 9A). Further, a positive correlation (r = 0.9047 and p < 0.01) between RNA-Seq and RT-qPCR expression values were observed for stress-responsive hub genes (Figure 9B).

4. Discussion

In this study, we determined the expression profiles of TF genes in bell pepper stems in response to separated and combined stress factors (UV-B radiation and cold) at different time points (T1, T2, and T3).
WGCNA analysis was used to show the interaction relationship among genes and detect hub genes in the regulatory network [55]. As a result, three TFs (RVE1, DBB1b, and COL2) were identified as hub genes of co-expression networks. When we compared the GO terms enrichment for three candidate hub genes, response to water deprivation, response to stress, and response to abiotic stimulus were determined as similar GO terms. This suggests that these three TFs can mediate responses to combined stress. Babitha et al. reported that transgenic Arabidopsis co-expressing two TFs (AtbHLH17 and AtWRKY28) exhibited enhanced tolerance to NaCl, mannitol, oxidative stress, and drought [56]. Further, KEGG pathway analysis revealed that the three candidate hub genes might regulate pathways such as the ‘biosynthesis of secondary metabolites’. Likewise, pathways related to carbohydrate and carbon metabolism were identified, such as ‘citrate cycle’, ‘glycolysis/gluconeogenesis’, ‘propanoate metabolism’, ‘galactose metabolism’, ‘glyoxylate and dicarboxylate metabolism’, and ‘amino sugar and nucleotide sugar metabolism’. These results suggest that these changes allowed provision of intermediates for nitrogen metabolism, amino acid metabolism, fatty acid metabolism, secondary metabolites, and hormone metabolism [57]. These pathways regulate ATP synthesis to satisfy the need for energy for stress protection and maintaining a functional state [58]. Finally, ‘ubiquinone and another terpenoid-quinone biosynthesis’ were found in KEGG pathway analysis for RVE1, DBB1b, and COL2. Previous studies have identified ubiquinone and other terpenoid quinone biosynthesis in transcriptome, proteome, and metabolome levels involved in abiotic stress tolerance [59,60,61]. Ubiquinone is a prenylquinone that participates in electron transporters in oxygenic photosynthesis and the aerobic respiratory chain [62]. Furthermore, it has been reported that ubiquinone accumulation reduces reactive oxygen species in bean plants [63].
In this study, RVE1 was identified as a hub TF to cope with abiotic stress (UV radiation, cold, heat, light intensity, and oxygen-containing compound). RVE genes have been reported to control photoperiod flowering, the circadian clock, hormone signaling, anthocyanin biosynthesis, and stress responses [64,65,66,67]. RVE1 belongs to the MYB family; it is a regulator of auxin levels and coordinates auxin and circadian signaling networks [64]. Additionally, in Arabidopsis, RVE1 was detected as a quantitative trait locus (QTL) candidate for cold acclimation [68]. While ‘response to oxygen-containing compound’ term is linked to oxidative stress. Oxidative stress is a resulting major stress in plants caused by the intracellular accumulation of reactive oxygen species (ROS), which are harmful to plant development by causing damage to cellular components and triggering programmed cell death [69]. As a response, the plants have developed an elaborate system to scavenge ROS [70]. Mainly, some enzymes such as ascorbate peroxidase (APX), peroxidase (POX), catalase (CAT), glutathione S-transferases (GST), glutathione peroxidase (GPX), monodehydroascorbate reductase (MDHAR), and dehydroascorbate reductase (DHAR) form an enzymatic complex set that plays a crucial role as an antioxidant defense system in abiotic stress [71]. Referring to this, ascorbate peroxidase 2, peroxidase 17, catalase isozyme 1, glutathione S-transferase, and glutathione peroxidase 6 were identified as antioxidant enzymatic defense regulated by RVE1. For example, UV-B radiation increased POX, CAT, APX, and GR activity in C. annuum [72], while overexpression of RVE1 in Arabidopsis plants reduces reactive oxygen species (ROS) accumulation and cell death compared to wild-type plants [73]. Additionally, overexpression of APX in Arabidopsis reduces H2O2 accumulation while increasing chilling and flooding tolerance [74]. In Oryza sativa, silencing of OsGPX1 showed an increased H2O2 content compared to wild-type plants [75]. Moreover, in transgenic plants overexpressing PtGSTF1, malondialdehyde accumulation was significantly lower, and GST, SOD, and CAT activity were higher than in wild-type plants. [76]. These results suggest that RVE1 may have a principal role in regulating the enzymatic antioxidant defense in coping with UV-B radiation and cold. Interestingly, the ‘flavonoid biosynthesis’ pathway was detected in the RVE1 enrichment; it was suggested that RVE1 was possibly part of a regulatory expression of five genes (PAL, C4H, CHS, CHI, and DFR) associated with flavonoid biosynthesis. Li et al. discovered that RVE1 TF is directly bound to DFR and ANS promoters [77]. Additionally, MYBs have been identified as regulatory genes in anthocyanin biosynthesis under UV-B radiation and cold [44,78]. Further, in Brassica rapa L. several flavonoid biosynthesis genes (BrPAL, BrC4H, Br4CL, BrCHS, BrF3H, BrF3′H, BrFLS, BrDFR, BrANS, and BrLDOX) were up–regulated in response to UV-B radiation [79]. In such a way, the regulation of genes related to flavonoids by RVE1 helps in response to combined stress.
DBBs are implicated in light signal transduction during photomorphogenesis in transgenic Arabidopsis lines (DBB1b-ox); hyposensitive to red and far-red light was observed, resulting in the highest hypocotyl length [80]. Further, DBBs have been identified in response to cold and drought [81,82]. In C. annuum, 24 CaBBX TFs have been reported, expressed in the root, stem, leaf, flower, fruit, and seed. Further, they are regulated by high temperature, low temperature, NaCl, and osmotic treatment at 3, 6, and 12 h [20]. Our findings indicated that the DBB1b might modulate genes implicated in response to light stimulus, calcium homeostasis, and the abscisic acid-activated signaling pathway. It is known that Ca2+ is a second messenger in response to cold and UV-B radiation stress [83,84]. In Arabidopsis thaliana and Nicotiana plumbaginifolia, cold stress increases cytosolic free calcium concentration and vacuolar release of Ca2+. This suggests that plant calcium signaling takes part in response to cold [85]. Chen et al. also found that adding extra Ca2+ to Triticum aestivum L. under UV-B radiation reduces membrane lipid peroxidation, boosts the activity of antioxidant enzymes (SOD, APX, and CAT), and raises the amount of ferulic and p-coumaric acid [86], whereas abscisic acid is a key endogenous messenger in response to abiotic stress [87]. Here, nine genes (RGLG2, OST1, ZFP4, PYL4, PYR1, ARAC1, ABI5, MPK9, and HAB1) were identified as connected to DBB1b in the abscisic acid-activated signaling pathway. In rice under drought and cold, overexpression of OsPYL3 and OsPYL9 generated stress tolerance [88]. Further, the exogenous application of abscisic acid (ABA) improved the defense system against UV-B radiation, increased carotenoids, hydroxycinnamic, caffeic, and ferulic acids content, and activities of CAT, APX, and POX [89]. The findings imply that DBB1b regulates genes involved in light, ABA, and Ca2+ signaling, all of which are required to cope with combined stress. Similarly, glycerolipid, glycine, serine, and threonine metabolism were enriched with neighbor genes linked to DBB1b. The glycerolipid metabolism pathway is related to the molecular regulation of membrane lipid remodeling as a strategy to cope with low temperatures [90,91]. Furthermore, UV-B radiation produces lipoperoxidation affecting photosynthetic structures, which activates expression genes involved in lipid synthesis and changes in the lipid membranes matrix [92,93]. Additionally, glycine, serine, and threonine metabolism have been identified in plants exposed to cold and UV-B radiation [94,95]. These amino acids can act as osmolytes, altering enzymatic activity, modulating stomatal opening, and regulating ion transport [96]. This finding proved that in C. annuum exposed to combined stress, membrane lipid remodeling is useful for maintaining normal development in an adverse environment.
Our results showed that COL2 might regulate cellular homeostasis genes and respond to red or far-red light, light stimulus, and salt stress. In C. annuum, ten genes that encode CO-like TFs have been identified. Moreover, they were regulated under cold, heat, salt, and osmotic stress [23]. CO-like TFs have been reported in the regulation of the circadian rhythm, light signal transduction, and abiotic stress responses, e.g., ABA, salt, and osmotic stress [97,98,99]. Hannah et al. identified that the CO-like family was the most significantly overrepresented in Arabidopsis under cold stress [100], but the specific role in the stress response is unknown. Additionally, the overexpression of MiCOL2 in transgenic Arabidopsis enhanced tolerance to salt and drought stresses [101].
Our present analysis supports the positive role of RVE1, DBB1b, and COL2 in response to combined (cold and UV-B radiation) stress by regulating several stress-related genes.

5. Conclusions

Here, we identified three TFs (RVE1, DBB1b, and COL2) as candidate hub genes of the bell pepper in response to combined stress (cold and UV-B radiation) at different time points (T1, T2, and T3). Our present analysis provided information about the possible role that RVE1, DBB1b, and COL2 play in multiple pathways to cope with abiotic stresses. These three TFs were mainly connected to energy production for stress protection and maintaining a functional state. Further, RVE1 might activate the antioxidant system as much as enzymatic and not enzymatic (flavonoids biosynthesis). At the same time, DBB1b may participate in stress signaling through molecules such as ABA and CA2+. Finally, COL2 was related to light stimulus and cellular homeostasis. These results suggest future works of functional validation; for instance, the overexpression and knockout of these TFs in the bell pepper.

Supplementary Materials

The following supporting information can be downloaded at: https://www.mdpi.com/article/10.3390/horticulturae9060699/s1, Figure S1: The total number of transcription factors (log2FoldChange < 0 and > 0) observed during the combined stress (cold + UV-B) treatment in bell pepper stems, Table S1: Total transcription factors identified in combined stress, Table S2: Differentially expressed transcription factors; Table S3: Common TFs identified in combined stress; Table S4: Co-expression analysis of common TFs; Table S5: GO enrichment for genes related to RVE1, DBB1b, and COL2; Table S6: KEGG enrichment for genes related to RVE1, DBB1b, and COL2.

Author Contributions

Conceptualization, C.V., R.L.-C., L.A.L.-R. and J.L.-F.; Methodology, B.E.M.-M., A.C.-M., R.L.-C. and J.L.-F.; Software, B.E.M.-M.; Validation, B.E.M.-M. and J.B.H.; Formal analysis, A.C.-M., C.V., J.B.V.-T. and J.L.-F.; Investigation, B.E.M.-M., C.V. and J.L.-F.; Resources, L.A.L.-R. and J.L.-F.; Data curation, B.E.M.-M., J.C.G.-O., A.C.-M., C.V. and J.B.V.-T.; Writing—original draft, B.E.M.-M.; Writing—review and editing, B.E.M.-M., A.C.-M., C.V., J.B.V.-T., J.B.H., R.L.-C., L.A.L.-R. and J.L.-F.; Visualization, B.E.M.-M.; Supervision, A.C.-M., C.V., J.B.V.-T., J.B.H., R.L.-C. and J.L.-F.; Project administration, J.L.-F.; Funding acquisition, J.L.-F. All authors have read and agreed to the published version of the manuscript.

Funding

This research was funded by FOSEC SEP-INVESTIGACIÓN BÁSICA, grand number CB 2017–2018 A1-S-8466; Cátedras CONACYT: grand number 784; Lightbourn Research. Grand number 589683.

Data Availability Statement

Not applicable.

Acknowledgments

The authors thank Q.F.B. Jesús Héctor Carrillo Yáñez for critical technical assistance.

Conflicts of Interest

The authors declare no conflict of interest.

References

  1. Koyro, H.-W.; Ahmad, P.; Geissler, N. Abiotic Stress Responses in Plants: An Overview. In Environmental Adaptations and Stress Tolerance of Plants in the Era of Climate Change; Ahmad, P., Prasad, M.N.V., Eds.; Springer Science + Business Media: Berlin/Heidelberg, Germany, 2012; pp. 1–28. [Google Scholar]
  2. Imran, Q.M.; Falak, N.; Hussain, A.; Mun, B.-G.; Yun, B.-W. Abiotic Stress in Plants; Stress Perception to Molecular Response and Role of Biotechnological Tools in Stress Resistance. Agronomy 2021, 11, 1579. [Google Scholar] [CrossRef]
  3. Borghi, M.; de Souza, L.P.; Yoshida, T.; Fernie, A.R. Flowers and climate change: A metabolic perspective. New Phytol. 2019, 224, 1425–1441. [Google Scholar] [CrossRef] [Green Version]
  4. Ding, Y.; Shi, Y.; Yang, S. Molecular Regulation of Plant Responses to Environmental Temperatures. Mol. Plant 2020, 13, 544–564. [Google Scholar] [CrossRef]
  5. Nurhasanah Ritonga, F.; Chen, S. Physiological and molecular mechanism involved in cold stress tolerance in plants. Plants 2020, 9, 560. [Google Scholar] [CrossRef]
  6. Yadav, A.; Singh, D.; Lingwan, M.; Yadukrishnan, P.; Masakapalli, S.K.; Datta, S. Light signaling and UV-B-mediated plant growth regulation. J. Integr. Plant Biol. 2020, 62, 1270–1292. [Google Scholar] [CrossRef]
  7. United Nations Environment Programme, Environmental Effects Assessment Panel. Environmental effects of ozone depletion and its interactions with climate change: Progress report, 2004. Photochem. Photobiol. Sci. 2005, 15, 141–174. [Google Scholar] [CrossRef] [Green Version]
  8. Shi, C.; Liu, H. How plants protect themselves from ultraviolet-B radiation stress. Plant Physiol. 2021, 187, 1096–1103. [Google Scholar] [CrossRef]
  9. Agarwal, P.K.; Agarwal, P.; Reddy, M.K.; Sopory, S.K. Role of DREB transcription factors in abiotic and biotic stress tolerance in plants. Plant Cell Rep. 2006, 25, 1263–1274. [Google Scholar] [CrossRef]
  10. Wang, H.; Wang, H.; Shao, H.; Tang, X. Recent advances in utilizing transcription factors to improve plant abiotic stress tolerance by transgenic technology. Front. Plant Sci. 2016, 7, 67. [Google Scholar] [CrossRef] [Green Version]
  11. Baillo, E.H.; Kimotho, R.N.; Zhang, Z.; Xu, P. Transcription factors associated with abiotic and biotic stress tolerance and their potential for crops improvement. Genes 2019, 10, 771. [Google Scholar] [CrossRef] [Green Version]
  12. Knight, H.; Knight, M.R. Abiotic stress signalling pathways: Specificity and cross-talk. Trends Plant Sci. 2001, 6, 262–267. [Google Scholar] [CrossRef]
  13. Mehrotra, S.; Verma, S.; Kumar, S.; Kumari, S.; Mishra, B.N. Transcriptional regulation and signalling of cold stress response in plants: An overview of current understanding. Environ. Exp. Bot. 2020, 180, 104243. [Google Scholar] [CrossRef]
  14. Podolec, R.; Demarsy, E.; Ulm, R. Perception and Signaling of Ultraviolet-B Radiation in Plants. Annu. Rev. Plant Biol. 2021, 72, 793–822. [Google Scholar] [CrossRef]
  15. Revalska, M.; Radkova, M.; Iantcheva, A. GRAS7, a member of the GRAS family transcription factors, in response to abiotic stress. Biotechnol. Biotechnol. Equip. 2022, 36, 317–326. [Google Scholar] [CrossRef]
  16. Li, J.; Han, G.; Sun, C.; Sui, N. Research advances of MYB transcription factors in plant stress resistance and breeding. Plant Signal. Behav. 2019, 14, 1613131. [Google Scholar] [CrossRef] [PubMed]
  17. Jin, H.; Martin, C. Multifunctionality and diversity within the plant MYB-gene family. Plant Mol. Biol. 1999, 41, 577–585. [Google Scholar] [CrossRef] [PubMed]
  18. Liu, Y.; Zhang, Z.; Fang, K.; Shan, Q.; He, L.; Dai, X.; Zou, X.; Liu, F. Genome-Wide Analysis of the MYB-Related Transcription Factor Family in Pepper and Functional Studies of CaMYB37 Involvement in Capsaicin Biosynthesis. Int. J. Mol. Sci. 2022, 23, 11667. [Google Scholar] [CrossRef] [PubMed]
  19. Khanna, R.; Kronmiller, B.; Maszle, D.R.; Coupland, G.; Holm, M.; Mizuno, T.S. The Arabidopsis B-Box Zinc Finger Family. Plant Cell 2009, 21, 3416–3420. [Google Scholar] [CrossRef] [Green Version]
  20. Ma, J.; Dai, J.X.; Liu, X.W.; Lin, D. Genome-wide and expression analysis of B-box gene family in pepper. BMC Genom. 2021, 22, 883. [Google Scholar] [CrossRef]
  21. Robson, F.; Costa, M.; Hepworth, S.R.; Vizir, I.; Piñeiro, M.; Reeves, P.; Putterill, J.; Coupland, G. Functional importance of conserved domains in the flowering-time gene CONSTANS demonstrated by analysis of mutant alleles and transgenic plants. Plant J. 2001, 28, 619–631. [Google Scholar] [CrossRef]
  22. Valverde, F.; Mouradov, A.; Soppe, W.; Ravenscroft, D.; Samach, A.; Coupland, G. Photoreceptor Regulation of CONSTANS Protein in Photoperiodic Flowering. Science 2004, 303, 1003–1006. [Google Scholar] [CrossRef] [PubMed] [Green Version]
  23. Huang, Z.; Bai, X.; Duan, W.; Chen, B.; Chen, G.; Xu, B.; Cheng, R.; Wang, J. Genome-Wide Identification and Expression Profiling of CONSTANS-Like Genes in Pepper (Capsicum annuum): Gaining an Insight to Their Phylogenetic Evolution and Stress-Specific Roles. Front. Plant Sci. 2022, 13, 828209. [Google Scholar] [CrossRef] [PubMed]
  24. Langfelder, P.; Horvath, S. WGCNA: An R package for weighted correlation network analysis. BMC Bioinform. 2008, 9, 559. [Google Scholar] [CrossRef] [PubMed] [Green Version]
  25. Zeng, Z.; Zhang, S.; Li, W.; Chen, B.; Li, W. Gene-coexpression network analysis identifies specific modules and hub genes related to cold stress in rice. BMC Genom. 2022, 23, 251. [Google Scholar] [CrossRef] [PubMed]
  26. Pan, Y.; Liang, H.; Gao, L.; Dai, G.; Chen, W.; Yang, X.; Qing, D.; Gao, J.; Wu, H.; Huang, J.; et al. Transcriptomic profiling of germinating seeds under cold stress and characterization of the cold-tolerant gene LTG5 in rice. BMC Plant Biol. 2020, 20, 371. [Google Scholar] [CrossRef] [PubMed]
  27. Ma, T.; Gao, H.; Zhang, D.; Shi, Y.; Zhang, T.; Shen, X.; Wu, L.; Xiang, L.; Chen, S. Transcriptome analyses revealed the ultraviolet B irradiation and phytohormone gibberellins coordinately promoted the accumulation of artemisinin in Artemisia annua L. Chin. Med. 2020, 15, 67. [Google Scholar] [CrossRef]
  28. Liu, S.; Zenda, T.; Dong, A.; Yang, Y.; Wang, N.; Duan, H. Global Transcriptome and Weighted Gene Co-expression Network Analyses of Growth-Stage-Specific Drought Stress Responses in Maize. Front. Genet. 2021, 12, 645443. [Google Scholar] [CrossRef]
  29. Zhu, M.; Xie, H.; Wei, X.; Dossa, K.; Yu, Y.; Hui, S.; Tang, G.; Zeng, X.; Yu, Y.; Hu, P.; et al. WGCNA Analysis of Salt-Responsive Core Transcriptome Identifies Novel Hub Genes in Rice. Genes 2019, 10, 719. [Google Scholar] [CrossRef] [Green Version]
  30. Ye, X.; Tie, W.; Xu, J.; Ding, Z.; Hu, W. Comparative Transcriptional Analysis of Two Contrasting Rice Genotypes in Response to Salt Stress. Agronomy 2022, 12, 1163. [Google Scholar] [CrossRef]
  31. Long, Y.; Qin, Q.; Zhang, J.; Zhu, Z.; Liu, Y.; Gu, L.; Jiang, H.; Si, W. Transcriptomic and weighted gene co-expression network analysis of tropic and temperate maize inbred lines recovering from heat stress. Plant Sci. 2023, 327, 111538. [Google Scholar] [CrossRef]
  32. Pan, R.; Buitrago, S.; Feng, Z.; Abou-Elwafa, S.F.; Xu, L.; Li, C.; Zhang, W. HvbZIP21, a Novel Transcription Factor From Wild Barley Confers Drought Tolerance by Modulating ROS Scavenging. Front. Plant Sci. 2022, 13, 92–106. [Google Scholar] [CrossRef] [PubMed]
  33. Mehari, T.G.; Hou, Y.; Xu, Y.; Umer, M.J.; Shiraku, M.; Wang, Y.; Wang, H.; Peng, R.; Wei, Y.; Cai, X.; et al. Overexpression of cotton GhNAC072 gene enhances drought and salt stress tolerance in transgenic Arabidopsis. BMC Genom. 2022, 23, 648. [Google Scholar] [CrossRef]
  34. Haak, D.C.; Fukao, T.; Grene, R.; Hua, Z.; Ivanov, R.; Perrella, G.; Li, S. Multilevel regulation of abiotic stress responses in plants. Front. Plant Sci. 2017, 8, 1564. [Google Scholar] [CrossRef]
  35. Aidoo, M.K.; Sherman, T.; Lazarovitch, N.; Fait, A.; Rachmilevitch, S. A bell pepper cultivar tolerant to chilling enhanced nitrogen allocation and stress-related metabolite accumulation in the roots in response to low root-zone temperature. Physiol. Plant. 2017, 161, 196–210. [Google Scholar] [CrossRef] [PubMed]
  36. Miao, W.; Song, J.; Huang, Y.; Liu, R.; Zou, G.; Ou, L.; Liu, Z. Comparative Transcriptomics for Pepper (Capsicum annuum L.) under Cold Stress and after Rewarming. Appl. Sci. 2021, 11, 10204. [Google Scholar] [CrossRef]
  37. Ou, L.J.; Wei, G.; Zhang, Z.Q.; Dai, X.Z.; Zou, X.X. Effects of low temperature and low irradiance on the physiological characteristics and related gene expression of different pepper species. Photosynthetica 2015, 53, 85–94. [Google Scholar] [CrossRef]
  38. Lai, Y.; Xu, B.; He, L.; Lin, M.; Cao, L.; Mou, S.; Wu, Y.; He, S. Differential gene expression in pepper (Capsicum annuum) exposed to UV-B. Indian J. Exp. Biol. 2011, 49, 429–437. [Google Scholar]
  39. Arce-Rodríguez, M.L.; Martínez, O.; Ochoa-Alejo, N. Genome-wide identification and analysis of the myb transcription factor gene family in chili pepper (Capsicum spp.). Int. J. Mol. Sci. 2021, 22, 2229. [Google Scholar] [CrossRef] [PubMed]
  40. Brand, D.; Wijewardana, C.; Gao, W.; Reddy, K.R. Interactive effects of carbon dioxide, low temperature, and ultraviolet-B radiation on cotton seedling root and shoot morphology and growth. Front. Earth Sci. 2016, 10, 607–620. [Google Scholar] [CrossRef]
  41. Chalker-Scott, L.; Scott, J.D. Elevated Ultraviolet-B Radiation Induces Cross-protection to Cold in Leaves of Rhododendron Under Field Conditions. Photochem. Photobiol. 2004, 79, 199. [Google Scholar] [CrossRef]
  42. Schulz, E.; Tohge, T.; Winkler, J.B.; Albert, A.; Ffner, A.R.S.; Fernie, A.R.; Zuther, E.; Hincha, D. Natural variation among Arabidopsis accessions in the regulation of flavonoid metabolism and stress gene expression by combined uv radiation and cold. Plant Cell Physiol. 2021, 62, 502–514. [Google Scholar] [CrossRef] [PubMed]
  43. León-Chan, R.G.; López-Meyer, M.; Osuna-Enciso, T.; Sañudo-Barajas, J.A.; Heredia, J.B.; León-Félix, J. Low temperature and ultraviolet-B radiation affect chlorophyll content and induce the accumulation of UV-B-absorbing and antioxidant compounds in bell pepper (Capsicum annuum) plants. Environ. Exp. Bot. 2017, 139, 143–151. [Google Scholar] [CrossRef]
  44. León-Chan, R.G.; Lightbourn-Rojas, L.A.; López-Meyer, M.; Amarillas, L.; Heredia, J.B.; Martínez-Bastidas, T.F.; Villicaña, C.; León-Félix, J. Differential gene expression of anthocyanin biosynthetic genes under low temperature and ultraviolet-B radiation in bell pepper (Capsicum annuum). Int. J. Agric. Biol. 2020, 23, 501–508. [Google Scholar]
  45. Morales-Merida, B.E.; Villicaña, C.; Perales-Torres, A.L.; Martínez-Montoya, H.; Castillo-Ruiz, O.; León-Chan, R.G.; Lightbourn-Rojas, L.A.; Heredia, J.B.; León-Félix, J. Transcriptomic Analysis in Response to Combined Stress by UV-B Radiation and Cold in Belle Pepper (Capsicum annuum). Int. J. Agric. Biol. 2021, 25, 969–980. [Google Scholar] [CrossRef]
  46. Bolger, A.M.; Lohse, M.; Usadel, B. Trimmomatic: A flexible trimmer for Illumina sequence data. Bioinformatics 2014, 30, 2114–2120. [Google Scholar] [CrossRef] [Green Version]
  47. Kim, D.; Langmead, B.; Salzberg, S.L. HISAT: A fast spliced aligner with low memory requirements. Nat. Methods 2015, 12, 357–360. [Google Scholar] [CrossRef] [Green Version]
  48. Anders, S.; Pyl, P.T.; Huber, W. HTSeq-A Python framework to work with high-throughput sequencing data. Bioinformatics 2015, 31, 166–169. [Google Scholar] [CrossRef] [PubMed] [Green Version]
  49. Love, M.I.; Huber, W.; Anders, S. Moderated estimation of fold change and dispersion for RNA-seq data with DESeq2. Genome Biol. 2014, 15, 550. [Google Scholar] [CrossRef] [Green Version]
  50. Filiz, E.; Kurt, F. Expression and Co-expression Analyses of WRKY, MYB, bHLH and bZIP Transcription Factor Genes in Potato (Solanum tuberosum) Under Abiotic Stress Conditions: RNA-seq Data Analysis. Potato Res. 2021, 64, 721–741. [Google Scholar] [CrossRef]
  51. Shannon, P.; Markiel, A.; Ozier, O.; Baliga, N.S.; Wang, J.; Ramage, D.; Amin, N.; Schwikowski, B.; Ideker, T. Cytoscape: A Software Environment for Integrated Models of Biomolecular Interaction Networks. Genome Res. 2003, 13, 426. [Google Scholar] [CrossRef]
  52. Wan, H.; Yuan, W.; Ruan, M.; Ye, Q.; Wang, R.; Li, Z.; Zhou, G.; Yao, Z.; Zhao, J.; Liu, S.; et al. Identification of reference genes for reverse transcription quantitative real-time PCR normalization in pepper (Capsicum annuum L.). Biochem. Biophys. Res. Commun. 2011, 416, 24–30. [Google Scholar] [CrossRef] [PubMed]
  53. Guo, M.; Lu, J.P.; Zhai, Y.F.; Chai, W.G.; Gong, Z.H.; Lu, M.H. Genome-wide analysis, expression profile of heat shock factor gene family (CaHsfs) and characterisation of CaHsfA2 in pepper (Capsicum annuum L.). BMC Plant Biol. 2015, 15, 151. [Google Scholar] [CrossRef] [PubMed] [Green Version]
  54. Zhang, J.; Liang, L.; Xie, Y.; Zhao, Z.; Su, L.; Tang, Y.; Sun, B.; Lai, Y.; Li, H. Transcriptome and Metabolome Analyses Reveal Molecular Responses of Two Pepper (Capsicum annuum L.) Cultivars to Cold Stress. Front. Plant Sci. 2022, 13, 819630. [Google Scholar] [CrossRef] [PubMed]
  55. Jia, X.; Feng, H.; Bu, Y.; Ji, N.; Lyu, Y.; Zhao, S. Comparative Transcriptome and Weighted Gene Co-expression Network Analysis Identify Key Transcription Factors of Rosa chinensis ‘Old Blush’ After Exposure to a Gradual Drought Stress Followed by Recovery. Front. Genet. 2021, 12, 690264. [Google Scholar] [CrossRef]
  56. Babitha, K.C.; Ramu, S.V.; Pruthvi, V.; Mahesh, P.; Nataraja, K.N.; Udayakumar, M. Co-expression of AtbHLH17 and AtWRKY28 confers resistance to abiotic stress in Arabidopsis. Transgenic Res. 2013, 22, 327–341. [Google Scholar] [CrossRef]
  57. Zhu, W.; Han, H.; Liu, A.; Guan, Q.; Kang, J.; David, L.; Dufresne, C.; Chen, S.; Tian, J. Combined ultraviolet and darkness regulation of medicinal metabolites in Mahonia bealei revealed by proteomics and metabolomics. J. Proteom. 2020, 233, 104081. [Google Scholar] [CrossRef]
  58. Simova-Stoilova, L.P.; Romero-Rodríguez, M.C.; Sánchez-Lucas, R.; Navarro-Cerrillo, R.M.; Medina-Aunon, J.A.; Jorrín-Novo, J.V. 2-DE proteomics analysis of drought treated seedlings of Quercus ilex supports a root active strategy for metabolic adaptation in response to water shortage. Front. Plant Sci. 2015, 6, 627. [Google Scholar] [CrossRef] [Green Version]
  59. Mi, W.; Liu, Z.; Jin, J.; Dong, X.; Xu, C.; Zou, Y.; Xu, M.; Zheng, G.; Cao, X.; Fang, X.; et al. Comparative proteomics analysis reveals the molecular mechanism of enhanced cold tolerance through ROS scavenging in winter rapeseed (Brassica napus L.). PLoS ONE 2021, 16, e0243292. [Google Scholar] [CrossRef]
  60. Chen, Y.; Zhi, J.; Zhang, H.; Li, J.; Zhao, Q.; Xu, J. Transcriptome analysis of Phytolacca americana L. in response to cadmium. PLoS ONE 2018, 13, e0199721. [Google Scholar] [CrossRef]
  61. Adolf, A.; Liu, L.; Ackah, M.; Li, Y.; Du, Q.; Zheng, D.; Guo, P.; Shi, Y.; Lin, Q.; Qiu, C.; et al. Transcriptome profiling reveals candidate genes associated with cold stress in mulberry. Rev. Bras. Bot. 2021, 44, 125–137. [Google Scholar] [CrossRef]
  62. Liu, M.; Lu, S. Plastoquinone and ubiquinone in plants: Biosynthesis, physiological function and metabolic engineering. Front. Plant Sci. 2016, 7, 1898. [Google Scholar] [CrossRef] [Green Version]
  63. Juszczuk, I.; Malusà, E.; Rychter, A.M. Oxidative stress during phosphate deficiency in roots of bean plants (Phaseolus vulgaris L.). J. Plant Physiol. 2001, 158, 1299–1305. [Google Scholar] [CrossRef]
  64. Rawat, R.; Schwartz, J.; Jones, M.A.; Sairanen, I.; Cheng, Y.; Andersson, C.R.; Zhao, Y.; Ljung, K.; Harmer, S.L. REVEILLE1, a Myb-like transcription factor, integrates the circadian clock and auxin pathways. Proc. Natl. Acad. Sci. USA 2009, 106, 16883–16888. [Google Scholar] [CrossRef] [PubMed] [Green Version]
  65. Li, B.; Gao, Z.; Liu, X.; Sun, D.; Tang, W. Transcriptional profiling reveals a time-of-day-specific role of REVEILLE 4/8 in regulating the first wave of heat shock–induced gene expression in Arabidopsis. Plant Cell 2019, 31, 2353–2369. [Google Scholar] [CrossRef] [PubMed]
  66. Mizoguchi, T.; Wheatley, K.; Hanzawa, Y.; Wright, L.; Mizoguchi, M.; Song, H.R.; Carré, I.A.; Coupland, G. LHY and CCA1 are partially redundant genes required to maintain circadian rhythms in Arabidopsis. Dev. Cell 2002, 2, 629–641. [Google Scholar] [CrossRef] [Green Version]
  67. Pérez-García, P.; Ma, Y.; Yanovsky, M.J.; Mas, P. Time-dependent sequestration of RVE8 by LNK proteins shapes the diurnal oscillation of anthocyanin biosynthesis. Proc. Natl. Acad. Sci. USA 2015, 112, 5249–5253. [Google Scholar] [CrossRef] [Green Version]
  68. Meissner, M.; Orsini, E.; Ruschhaupt, M.; Melchinger, A.E.; Hincha, D.K.; Heyer, A.G. Mapping quantitative trait loci for freezing tolerance in a recombinant inbred line population of Arabidopsis thaliana accessions Tenela and C24 reveals REVEILLE1 as negative regulator of cold acclimation. Plant Cell Environ. 2013, 36, 1256–1267. [Google Scholar] [CrossRef]
  69. Sewelam, N.; Kazan, K.; Schenk, P.M. Global plant stress signaling: Reactive oxygen species at the cross-road. Front. Plant Sci. 2016, 7, 187. [Google Scholar] [CrossRef] [Green Version]
  70. Das, K.; Roychoudhury, A. Reactive oxygen species (ROS) and response of antioxidants as ROS-scavengers during environmental stress in plants. Front. Environ. Sci. 2014, 2, 53. [Google Scholar] [CrossRef] [Green Version]
  71. Rajput, V.D.; Harish; Singh, R.K.; Verma, K.K.; Sharma, L.; Quiroz-Figueroa, F.R.; Meena, M.; Gour, V.S.; Minkina, T.; Sushkova, S.; et al. Recent developments in enzymatic antioxidant defence mechanism in plants with special reference to abiotic stress. Biology 2021, 10, 267. [Google Scholar] [CrossRef]
  72. Mahdavian, K.; Ghorbanli, M.; Kalantari, K.M. The effects of ultraviolet radiation on some antioxidant compounds and enzymes in Capsicum annuum L. Turk. J. Botany 2008, 32, 129–134. [Google Scholar]
  73. Xu, G.; Guo, H.; Zhang, D.; Chen, D.; Jiang, Z.; Lin, R. REVEILLE1 promotes NADPH: Protochlorophyllide oxidoreductase A expression and seedling greening in Arabidopsis. Photosynth. Res. 2015, 126, 331–340. [Google Scholar] [CrossRef] [PubMed]
  74. Chen, Z.; Lu, H.H.; Hua, S.; Lin, K.H.; Chen, N.; Zhang, Y.; You, Z.; Kuo, Y.W.; Chen, S.P. Cloning and overexpression of the ascorbate peroxidase gene from the yam (Dioscorea alata) enhances chilling and flood tolerance in transgenic Arabidopsis. J. Plant Res. 2019, 132, 857–866. [Google Scholar] [CrossRef] [PubMed]
  75. Lima-Melo, Y.; Carvalho, F.E.; Martins, M.O.; Passaia, G.; Sousa, R.H.; Neto, M.C.; Margis-Pinheiro, M.; Silveira, J.A. Mitochondrial GPX1 silencing triggers differential photosynthesis impairment in response to salinity in rice plants. J. Integr. Plant Biol. 2016, 58, 737–748. [Google Scholar] [CrossRef]
  76. Gao, H.; Yu, C.; Liu, R.; Li, X.; Huang, H.; Wang, X.; Zhang, C.; Jiang, N.; Li, X.; Cheng, S.; et al. The Glutathione S-Transferase PtGSTF1 Improves Biomass Production and Salt Tolerance through Regulating Xylem Cell Proliferation, Ion Homeostasis and Reactive Oxygen Species Scavenging in Poplar. Int. J. Mol. Sci. 2022, 23, 11288. [Google Scholar] [CrossRef] [PubMed]
  77. Li, X.; Wu, T.; Liu, H.; Zhai, R.; Wen, Y.; Shi, Q.; Yang, C.; Wang, Z.; Ma, F.; Xu, L. REVEILLE transcription factors contribute to the nighttime accumulation of anthocyanins in ‘red zaosu’ (Pyrus bretschneideri rehd.) pear fruit skin. Int. J. Mol. Sci 2020, 21, 1634. [Google Scholar] [CrossRef] [PubMed] [Green Version]
  78. Wang, Y.; Liu, S.; Wang, H.; Zhang, Y.; Li, W.; Liu, J.; Cheng, Q.; Sun, L.; Shen, H. Identification of the Regulatory Genes of UV-B-Induced Anthocyanin Biosynthesis in Pepper Fruit. Int. J. Mol. Sci. 2022, 23, 1960. [Google Scholar] [CrossRef]
  79. Hao, J.; Lou, P.; Han, Y.; Zheng, L.; Lu, J.; Chen, Z.; Ni, J.; Yang, Y.; Xu, M. Ultraviolet-B Irradiation Increases Antioxidant Capacity of Pakchoi (Brassica rapa L.) by Inducing Flavonoid Biosynthesis. Plants 2022, 11, 766. [Google Scholar] [CrossRef]
  80. Kumagai, T.; Ito, S.; Nakamichi, N.; Niwa, Y.; Murakami, M.; Yamashino, T.; Mizuno, T. The common function of a novel subfamily of B-box zinc finger proteins with reference to circadian-associated events in Arabidopsis thaliana. Biosci. Biotechnol. Biochem. 2008, 72, 1539–1549. [Google Scholar] [CrossRef] [Green Version]
  81. Sazegari, S.; Zinati, Z.; Tahmasebi, A. Dynamic transcriptomic analysis uncovers key genes and mechanisms involved in seed priming-induced tolerance to drought in barley. Gene Rep. 2020, 21, 100941. [Google Scholar] [CrossRef]
  82. Peng, X.; Wu, Q.; Teng, L.; Tang, F.; Pi, Z.; Shen, S. Transcriptional regulation of the paper mulberry under cold stress as revealed by a comprehensive analysis of transcription factors. BMC Plant Biol. 2015, 15, 108. [Google Scholar] [CrossRef] [PubMed] [Green Version]
  83. Miura, K.; Furumoto, T. Cold signaling and cold response in plants. Int. J. Mol. Sci. 2013, 14, 5312–5337. [Google Scholar] [CrossRef] [PubMed] [Green Version]
  84. Li, Y.; Liu, Y.; Jin, L.; Peng, R. Crosstalk between Ca2+ and Other Regulators Assists Plants in Responding to Abiotic Stress. Plants 2022, 11, 1351. [Google Scholar] [CrossRef] [PubMed]
  85. Knight, H.; Trewavas, A.J.; Knighta, M.R. Cold Calcium Signaling in Arabidopsis lnvolves Two Cellular Pools and a Change in Calcium Signature after Acclimation. Plant Cell 1996, 8, 489–503. [Google Scholar] [PubMed] [Green Version]
  86. Chen, Z.; Ma, Y.; Yang, R.; Gu, Z.; Wang, P. Effects of exogenous Ca2+ on phenolic accumulation and physiological changes in germinated wheat (Triticum aestivum L.) under UV-B radiation. Food Chem. 2019, 288, 368–376. [Google Scholar] [CrossRef]
  87. Raghavendra, A.S.; Gonugunta, V.K.; Christmann, A.; Grill, E. ABA perception and signalling. Trends Plant Sci. 2010, 15, 395–401. [Google Scholar] [CrossRef]
  88. Tian, X.; Wang, Z.; Li, X.; Lv, T.; Liu, H.; Wang, L.; Niu, H.; Bu, Q. Characterization and Functional Analysis of Pyrabactin Resistance-Like Abscisic Acid Receptor Family in Rice. Rice 2015, 8, 28. [Google Scholar] [CrossRef] [Green Version]
  89. Berli, F.J.; Moreno, D.; Piccoli, P.; Hespanhol-Viana, L.; Silva, M.F.; Bressan-Smith, R.; Cavagnaro, J.B.; Bottini, R. Abscisic acid is involved in the response of grape (Vitis vinifera L.) cv. Malbec leaf tissues to ultraviolet-B radiation by enhancing ultraviolet- absorbing compounds, antioxidant enzymes and membrane sterols. Plant Cell Environ. 2010, 33, 1–10. [Google Scholar] [CrossRef]
  90. Zhao, X.; Wei, Y.; Zhang, J.; Yang, L.; Liu, X.; Zhang, H.; Shao, W.; He, L.; Li, Z.; Zhang, Y.; et al. Membrane Lipids’ Metabolism and Transcriptional Regulation in Maize Roots Under Cold Stress. Front. Plant Sci. 2021, 12, 639132. [Google Scholar] [CrossRef]
  91. Kong, X.M.; Zhou, Q.; Luo, F.; Wei, B.D.; Wang, Y.J.; Sun, H.J.; Zhao, Y.B.; Ji, S.J. Transcriptome analysis of harvested bell peppers (Capsicum annuum L.) in response to cold stress. Plant Physiol. Biochem. 2019, 139, 314–324. [Google Scholar] [CrossRef]
  92. Lidon, F.C.; Ramalho, J.C. Impact of UV-B irradiation on photosynthetic performance and chloroplast membrane components in Oryza sativa L. J. Photochem. Photobiol. B Biol. 2011, 104, 457–466. [Google Scholar] [CrossRef] [PubMed]
  93. Li, W.; Tan, L.; Zou, Y.; Tan, X.; Huang, J.; Chen, W.; Tang, Q. The Effects of Ultraviolet A/B Treatments on Anthocyanin Accumulation and Gene Expression in Dark-Purple Tea Cultivar ‘Ziyan’ (Camellia sinensis). Molecules 2020, 25, 354. [Google Scholar] [CrossRef] [PubMed] [Green Version]
  94. Shamala, L.F.; Zhou, H.; Han, Z.X.; Wei, S. UV-B Induces Distinct Transcriptional Re-programing in UVR8-Signal Transduction, Flavonoid, and Terpenoids Pathways in Camellia sinensis. Front. Plant Sci. 2020, 11, 234. [Google Scholar] [CrossRef] [Green Version]
  95. Jin, J.; Zhang, H.; Zhang, J.; Liu, P.; Chen, X.; Li, Z.; Xu, Y.; Lu, P.; Cao, P. Integrated transcriptomics and metabolomics analysis to characterize cold stress responses in Nicotiana tabacum. BMC Genom. 2017, 18, 496. [Google Scholar] [CrossRef] [Green Version]
  96. Khan, N.; Ali, S.; Zandi, P.; Mehmood, A.; Ullah, S.; Ikram, M.; Ismail; Shadid, M. A.; Babar, A.M. Role of sugars, amino acids and organic acids in improving plant abiotic stress tolerance. Pakistan J. Bot. 2020, 52, 355–363. [Google Scholar] [CrossRef]
  97. Min, J.H.; Chung, J.; Lee, K.H.; Kim, C.S. The CONSTANS-like 4 transcription factor, AtCOL4, positively regulates abiotic stress tolerance through an abscisic acid-dependent manner in Arabidopsis. J. Integr. Plant Biol. 2015, 57, 313–324. [Google Scholar] [CrossRef] [PubMed]
  98. Salomé, P.A.; To, J.P.C.; Kieber, J.J.; McClung, C.R. Arabidopsis response regulators ARR3 and ARR4 play cytokinin-independent roles in the control of circadian period. Plant Cell 2006, 18, 55–69. [Google Scholar] [CrossRef] [PubMed] [Green Version]
  99. Zobell, O.; Coupland, G.; Reiss, B. The family of CONSTANS-like genes in Physcomitrella patens. Plant Biol. 2005, 7, 266–275. [Google Scholar] [CrossRef]
  100. Hannah, M.A.; Heyer, A.G.; Hincha, D.K. A global survey of gene regulation during cold acclimation in Arabidopsis thaliana. PLoS Genet. 2005, 1, e26. [Google Scholar] [CrossRef] [PubMed]
  101. Liang, R.Z.; Luo, C.; Liu, Y.; Hu, W.L.; Guo, Y.H.; Yu, H.X.; Lu, T.T.; Chen, S.Q.; Zhang, X.J.; He, X.H. Overexpression of two CONSTANS-like 2 (MiCOL2) genes from mango delays flowering and enhances tolerance to abiotic stress in transgenic Arabidopsis. Plant Sci. 2023, 327, 111541. [Google Scholar] [CrossRef]
Figure 1. Schematic representation of the samples under control and stress treatments. On the timeline, violet and yellow represent UV-B radiation and PAR radiation, respectively. Green arrows show the time of stem samples for each treatment. The black arrow shows the time of the control samples [44].
Horticulturae 09 00699 g001
Figure 2. Number of differentially expressed transcription factors up-regulated and down-regulated during the combined stress (cold + UV-B) treatment in bell pepper stems.
Horticulturae 09 00699 g002
Figure 3. Venn diagram of the TFs identified during combined stress: (A) up-regulated TFs, and (B) down-regulated TFs. The number of common TFs is represented in the center of each diagram.
Horticulturae 09 00699 g003
Figure 4. Expression patterns of transcription factors identified as common genes across time points in combined stress. Values represent log2FoldChange.
Horticulturae 09 00699 g004
Figure 5. Module–trait relationship among samples. The number shows the correlation coefficient between modules with samples. The number between the parenthesis shows the p-value. Red depicts positive correlation coefficients; blue depicts negative correlation coefficients.
Horticulturae 09 00699 g005
Figure 6. The co-expression networks of RVE1 (A), DBB1b (B), and COL2 (C). The central nodes of the plot are the transcription factors. Each node represents a gene in each network. The color represents the type of transcription factor identified in each network.
Horticulturae 09 00699 g006
Figure 7. Top 20 enriched GO terms of genes identified in co-expression network related to RVE1 (A), DBB1B (B), and COL2 (C). Dot size is the number of genes enriched in each GO term, and the color scale represents the FDR value (<0.05).
Horticulturae 09 00699 g007
Figure 8. Top 20 enriched KEGG pathways of genes identified in co-expression network related to RVE1 (A), DBB1b (B), and COL2 (C). Dot size is the number of genes enriched in each KEGG pathway, and the color scale represents the FDR value (<0.05).
Horticulturae 09 00699 g008
Figure 9. The confirmation of the expression pattern of key hub TFs in C. annuum. (A) RT-qPCR expression pattern of six putative genes in T1, T2, and T3 of combined stress. The data are plotted as means ± SD. (B) Correlation between the log2FoldChange expression determined by RNA-Seq versus RT-qPCR data in combined stress conditions. The r represents the Pearson correlation coefficient.
Horticulturae 09 00699 g009
Table 1. Primer sequences were used in this study.
NamePrimer SequenceTa (°C)Amplicon Size (bp)Reference
bHLH38F(5′-3′)TGAGGTAGGGGTAGAAAGGTC58117This study
R(5′-3′)GGAGGAAGCAAAGAACGAAGAG
COL2F(5′-3′)GTGAGGAAGTAGTGGATGA53.298[23]
R(5′-3′)GTAATGTAGTTGCTGCTGAT
DBB1bF(5′-3′)TGATTGTTGCCACTACGC58166[20]
R(5′-3′)ACCAACCAAACAGGGAGA
HSFA7AF(5′-3′)CGGGGTCAAGTTCAGGAGGT62211This study
R(5′-3′)ATAGTGGAGAAGGCGTGAGGA
HSFC1F(5′-3′)GTGTAAAGTTGTTGATGACCCTG58.5231[53]
R(5′-3′)GACGACGGCGAAGACTGAC
RVE1F(5′-3′)TCCTCCTCGGCCTAAAAGAA58.6178[54]
R(5′-3′)TGCAAAAGAACCTAGGGCAG
β-TUBF(5′-3′)GAGGGTGAGTGAGCAGTTC56.5167[52]
R(5′-3′)CTTCATCGTCATCTGCTGTC
Note: F, forward; R, reverse; Ta, annealing temperature.
Disclaimer/Publisher’s Note: The statements, opinions and data contained in all publications are solely those of the individual author(s) and contributor(s) and not of MDPI and/or the editor(s). MDPI and/or the editor(s) disclaim responsibility for any injury to people or property resulting from any ideas, methods, instructions or products referred to in the content.

