Article

Metabolomic and Transcriptomic Analysis Reveals the Mechanisms Underlying the Difference in Anthocyanin Accumulation in Apple Fruits at Different Altitudes

Zhengzhou Fruit Research Institute, Chinese Academy of Agricultural Sciences, Zhengzhou 450009, China
*
Author to whom correspondence should be addressed.
Horticulturae 2023, 9(4), 475; https://doi.org/10.3390/horticulturae9040475
Submission received: 24 February 2023 / Revised: 31 March 2023 / Accepted: 9 April 2023 / Published: 11 April 2023

Abstract

:
The red color of apple peel is an important phenotypic and economic trait mainly attributed to anthocyanin accumulation. Apples show a deeper red color at higher altitudes than at lower ones; however, the molecular regulatory network underlying color variation along altitudinal gradients has not been investigated. In this study, the effects of environmental conditions associated with low (124 m) and high (1901 m) altitudes on peel color were assessed through physiological, metabolomic, transcriptomic, and qRT-PCR analyses in Huashuo apple and its sister line, Huarui apple. The content of cyanidin-3-O-galactoside, cyanidin-3-O-arabinoside, and cyanidin-3-O-xyloside was abundant in the high-altitude environment and may contribute to the deeper red color. Transcript levels of structural genes in the anthocyanin synthesis pathway, especially MdCHI, MdCHS, MdANS, and MdDFR, in apple peel were significantly higher at high altitude than at low altitude. Based on the protein interaction prediction and correlation analyses, four transcription factors (MDP0000127691, MDP0000284922, MDP0000758053, and MDP0000074681) could interact with anthocyanin synthesis-related proteins, showing high correlation with anthocyanin accumulation. Therefore, the abovementioned four genes and four transcription factors were predicted to account for the color differences between high and low altitudes. These results provide genetic resources and a theoretical basis for color-oriented fruit improvement.

1. Introduction

Anthocyanins are important plant secondary metabolites that are commonly stored in the fruit, seed coat, leaves, bark, and flowers. They belong to the flavonoid family and are responsible for the blue, purple, and red colors of plant tissues. Anthocyanins play many important roles in plants, such as reducing damage due to cold, drought, and UV irradiation [1,2,3]. Anthocyanins also protect plants from infection caused by viruses, bacteria, and fungi [4], and promote pollination and seed dispersal by attracting insects and animals [4,5]. Additionally, anthocyanins as food materials, are of great importance to human health because of their antioxidant, antiaging, antitumor, and anticancer activities [6,7,8,9,10]. Hence, there has been significant interest in the development of healthy food products based on anthocyanin-rich fruits. Anthocyanins have also become a key area of research in efforts to understand the mechanisms underlying color traits in horticultural crops. Apple (Malus domestica), one of the most widely produced and economically important fruit crops in temperate regions, providing a significant source of anthocyanins for the human diet [11,12]. For red apple varieties, a thick and full red appearance is an important indicator of phenotypic quality, and is more marketable than speckled red and light red apple varieties. However, differences in environmental conditions, such as altitude, lead to differences in fruit color, and the underlying metabolic changes and molecular mechanisms are not well-established.
Anthocyanins are synthesized via the phenylalanine metabolic pathway and under the action of a series of catalytic enzymes, including phenylalanine ammonia lyase (PAL), cinnamate-4-hydroxylase (4CH), 4-coumaroyl-coA synthase (4CL), chalcone synthase (CHS), chalcone isomerase (CHI), flavanone 3-hydroxylase (F3H), dihydroflavonol 4-reductase (DFR), anthocyanin synthase (ANS), and glycosyltransferase (UFGT) [13]. Previous research has shown that CHS, F3H, DFR, ANS, and UFGT are positively correlated with anthocyanin accumulation [14,15]. However, the expression profiles of these genes in apples vary across tissues, growing stages, and varieties [16].
In addition to the role of anthocyanin structural genes, many transcription factors (TFs) have been reported to play a crucial role in the regulation of anthocyanins accumulation. Furthermore, gene expression is jointly regulated by internal genetics and external environmental factors, the latter mainly referring to light and temperature [17,18,19,20]. Some TFs respond to light; and example is the key protein, HY5, in the optical signaling pathway, which reportedly boosts anthocyanin accumulation in apples by binding directly to the MYB10 promoter and activating its expression [21]. Similarly, UV-B induces the expression of the B-box (BBX) gene MdCOL11 in apples, while the promoter of MdCOL11 is targeted by MdHY5 to promote anthocyanin synthesis [22]. The transcript level of another B-box gene, MdCOL4, is reduced by UV-B, thereby promoting anthocyanin accumulation; however, it is increased with high temperature, inhibiting such accumulation [23]. Moreover, MdMYB16, MdMYB1, and other genes jointly regulate homeostasis between anthocyanin and lignin biosynthesis during light induction in apples [19]. Hu et al. [18] report that MdWRKY72 responds to UV by promoting anthocyanin accumulation in the apple callus by regulating the expression of MdMYB1. Temperature plays an important role in apple coloring, and studies have shown that some TFs are involved in the accumulation of anthocyanin at different temperatures [24,25]. Lin-Wang et al. [17] found that MYB10 contributes to the response to temperature changes; thus, a single night of low temperature can induce high MYB10 expression, thereby promoting anthocyanin biosynthesis. Conversely, high temperatures rapidly reduce the expression of MYB10 in the red pericarp of fruit. Moreover, recent studies have shown that the B-box zinc finger-protein MdBBX20 in apples can interact with MdBHLH3, MdMYB1, MdDFR, and MdANS to regulate anthocyanin synthesis; it can also can interact with HY5 to co-regulate the two signaling pathways related to UV radiation and low temperature [26]. The above study not only revealed the critical role of TFs, but also emphasized the importance of two environmental factors, i.e., light and temperature. Indeed, theses studies firmly concluded that temperature and light are the most important environmental factors that influence the appearance and development of red color in apples. Moreover, it is now widely accepted that light and temperature are closely associated with altitude, which affects UV radiation, diurnal temperature, and light intensity, or even all of these parameters. Thus, altitude may be a crucial factor in the regulation of the metabolism in the final ripening of the apple peel [22,27]. Apples growing at different points along an altitudinal gradient are an excellent resource to research the influence of the environment on the process of peel coloration.
Huashuo and Huarui apples are sister lines obtained by hybridizing Huaguan and American No. 8 apples. They are mid-early maturing varieties with favorable properties, such as large fruits, high yield, and strong disease resistance; hence, they are widely cultivated in China [28]. Huashuo and Huarui apples show a darker red color when grown in Zhaotong city in Yunnan Province at an altitude of 1901 m than when they are grown in Zhengzhou city in Henan Province at an altitude of 124 m. Although this phenotypic variation is well-characterized, systematic studies of the underlying mechanisms are lacking. In this study, we focused on the metabolic and genetic basis of color phenotypes by using Huashuo and Huarui as experimental materials. We aimed to provide new insights into the physiological processes that link changes in apple peel color to the prevailing environmental conditions. The study of anthocyanin synthesis in apples can also provide theoretical support to guide cultivation and breed new varieties.

2. Materials and Methods

2.1. Plant Materials

Two apple cultivars, Huashuo and Huarui, from two orchards in different regions were collected. The first orchard is located at the Zhaotong Apple Industry Research Institute (Zhaotong, China) at an altitude of approximately 1901 m (high altitude), while the second orchard is located at the Zhengzhou Fruit Research Institute (Zhengzhou, China) at an altitude of approximately 124 m (low altitude). The mean air temperature and UV intensity on a sunny day during the apple peel color transition period in both orchards are shown in Figure S1. Both orchards have 5-year-old trees planted between and within row distances of 3.5 and 1.5 m, respectively, and grafted onto M26 interstock. Nine trees of each of the two varieties showing uniform and healthy growth were selected for sampling. Three trees comprised a biological replicate, with six fruits per replicate. Samples were collected at 105, 110, 120, and 130 days after full bloom (DAFB). YS and YR represent Huashuo and Huarui apples collected from the high-altitude orchard, respectively. HS and HR represent Huashuo and Huarui apples collected from the low-altitude orchard, respectively. Specifically, YS1, YS2, YS3, and YS4 represent the above four color transition periods of YS, and the same rationale was applied to the other samples. After 1 mm thick peels were separated from the cortex, some of the mixed peel samples were used for anthocyanin measurements, while others were quickly frozen in liquid nitrogen and stored at −80 °C for subsequent analyses.

2.2. Determination of Total Anthocyanin Content

Total anthocyanin concentration was measured as previously described [29]. Briefly, five-gram samples were extracted with 20 mL 1% HCl in methanol (v/v) for 24 h at 4 °C in darkness. Subsequently, the extract absorbance was measured at 530 nm with an ultraviolet spectrophotometer (UV-2450; Shimadzu, Kyoto, Japan). The relative anthocyanin concentration was calculated using the following formula: N = 10 × A530nm/m, where A530nm refers to the sample absorbance at 530 nm, m represents the sample mass, and N is the relative anthocyanin concentration per gram of fresh weight (Unit/g FW) [30,31].

2.3. RNA Sequencing and Analysis

The total RNA from each sample was obtained using a Plant Column RNA Extraction Kit (Sangon Biotech Company, Shanghai, China). The quality and concentration of RNA samples were detected as described previously [29]. One microgram (μg) of high-quality total RNA was used for first-strand cDNA synthesis by using the Prime Script RT Reagent Kit with a gDNA Eraser (TaKaRa, Dalian, China).
The raw RNA-Seq data were analyzed according to previous studies [32]. The adaptor and low-quality sequences were filtered using Trimmomatic-0.38 [33]. The clean reads were mapped to the Malus domestica v1.1 genome (https://phytozome-next.jgi.doe.gov/info/Mdomestica_v1_1, accessed on 16 December 2022) using hisat2 for assembly. Gene transcriptional levels were calculated using HTseq [34]. The Pearson correlation coefficients between biological replicates were calculated using the R package corrplot [35]. Correlations between gene expression levels and anthocyanin content were evaluated to identify genes for function annotation using Mercator sequence annotation software (https://www.plabipd.de/portal/web/guest/home1, accessed on 15 February 2022). A heatmap was constructed using TBtools [36].

2.4. Measurement of Anthocyanin Metabolites Using HPLC-ESI-MS/MS

Anthocyanin metabolites were measured using Metware Biotechnology Co., Ltd. (Wuhan, China). Detailed operation was conducted as previously described [29]. All of the standards were purchased from isoReag (Shanghai, China). Anthocyanins were analyzed using scheduled multiple reaction monitoring (MRM). Data acquisitions were performed using Analyst 1.6.3 software (Sciex). Multiquant 3.0.3 software (Sciex) was used to quantify all metabolites. The stock solutions of standards were prepared at a concentration of 1 mg/mL in 50% methanol and stored at −20 °C. The stock solutions were diluted with 50% methanol to working solutions before analysis. Freeze-dried peel samples were ground into powder and 50 mg of the powder was extracted using 0.5 mL methanol/water/hydrochloric acid (500:500:1, v/v/v). Then, vortex, ultrasonic, and centrifuge were conducted for 5 min each, and the supernatants were isolated. The supernatants were filtered through a membrane filter (0.22 μm, Anpel) prior to analysis using an LC-ESI-MS/MS system (UPLC, ExionLC™ AD, https://sciex.com.cn/; MS, Applied Biosystems 6500 Triple Quadrupole, https://sciex.com.cn/). The experimental conditions were as follows: chromatographic column, WatersACQUITY BEH C18 (1.7 µm, 2.1 mm × 100 mm); the mobile phases used acidified water (0.1% formic acid) and acidified methanol (0.1% formic acid); the gradient program was used to separate the compounds, 95:5 (v/v) at 0 min, 50:50 (v/v) at 6 min, 5:95 (v/v) at 12 min and kept for 2 min, 95:5 (v/v) at 14 min and kept for 2 min; flow rate, 0.35 mL/min; temperature, 40 °C; injection volume, 2 µL. The effluent for analysis was alternatively connected to an ESI-triple quadrupole-linear ion trap (QTRAP)-MS. Mass spectrometry conditions were set as follows: ESI source temperature 550 °C; ion spray voltage 5500 V; curtain gas 35 psi. Instrument tuning and mass calibration were performed with 10 and 100 μmol/L polypropylene glycol solutions in triple quadrupole and linear ion trap modes, respectively. Triple quadrupole scans were acquired during MRM experiments with collision gas (nitrogen) set to 5 psi. Mass spectrometer parameters, including the declustering potentials (DP) and collision energies (CE) for individual MRM transitions, were conducted with further DP and CE optimization. The monitoring mode was set to MRM.

2.5. WGCNA and Visualization of Gene Networks

A weighted co-expression network was constructed using WGCNA packages in R to obtain specific co-expressed gene modules, along with the anthocyanin accumulation trend [37]. Nine anthocyanins and the total content at four time points (105, 110, 120, 130 DAFB) were selected for joint analysis with gene expression profiles. Co-expression networks were generated using a soft threshold power (16) to distinguish modules with diverse expression patterns. The modules were constructed based on their correlation coefficients to determine the expression modules, with a minimum module gene number of 100. The merging threshold for similar modules was 0.3, and the remaining parameters were the default parameters. Modules with higher correlation were selected based on Pearson’s correlation coefficient (PCC) ≥ 0.7 or ≤−0.7.

2.6. Quantitative Real-Time PCR (qRT-PCR)

RNA extraction and cDNA synthesis were the same as mentioned above. qRT-PCR was performed on a Quant Studio 7 Flex Real-Time System (ABI 7500) using SYBR Premix Ex Taq (TaKaRa, Dalian, China) according to the manufacturer’s protocol. The primer sequences used in this study are listed in Table S1. Actin was used as the reference gene according to a previous report [29]. The reaction started with an initial incubation at 50 °C for 2 min, 95 °C for 2 min, and 30 cycles of 95 °C for 15 s, 58 °C for 15 s and 72 °C for 20 s. Data analysis was performed according to the 2−∆∆Ct method [38].

2.7. Function Prediction of Candidate Genes

To predict the interaction network, the STRING database (v11.5) was used. This is an online server containing information on over 14,000 species, over 60 million proteins, and over 20 billion interactions (https://cn.string-db.org/cgi/input.pl, accessed on 25 March 2022) [39]. The single protein by sequence was used to search the database; Malus domestica was selected as the organism; to ensure clarity of the figure, no more than 10 interacting proteins were shown.

2.8. Statistical Analyses

Anthocyanin content and gene expression levels were analyzed using the IBM SPSS Statistics version 19.0 software (IBM Corporation, Chicago, IL, USA) to determine significant differences (p < 0.05) according to Duncan multiple range tests in the ANOVA (analysis of variance) program. SigmaPlot v14.0 software was used to create figures.

3. Results

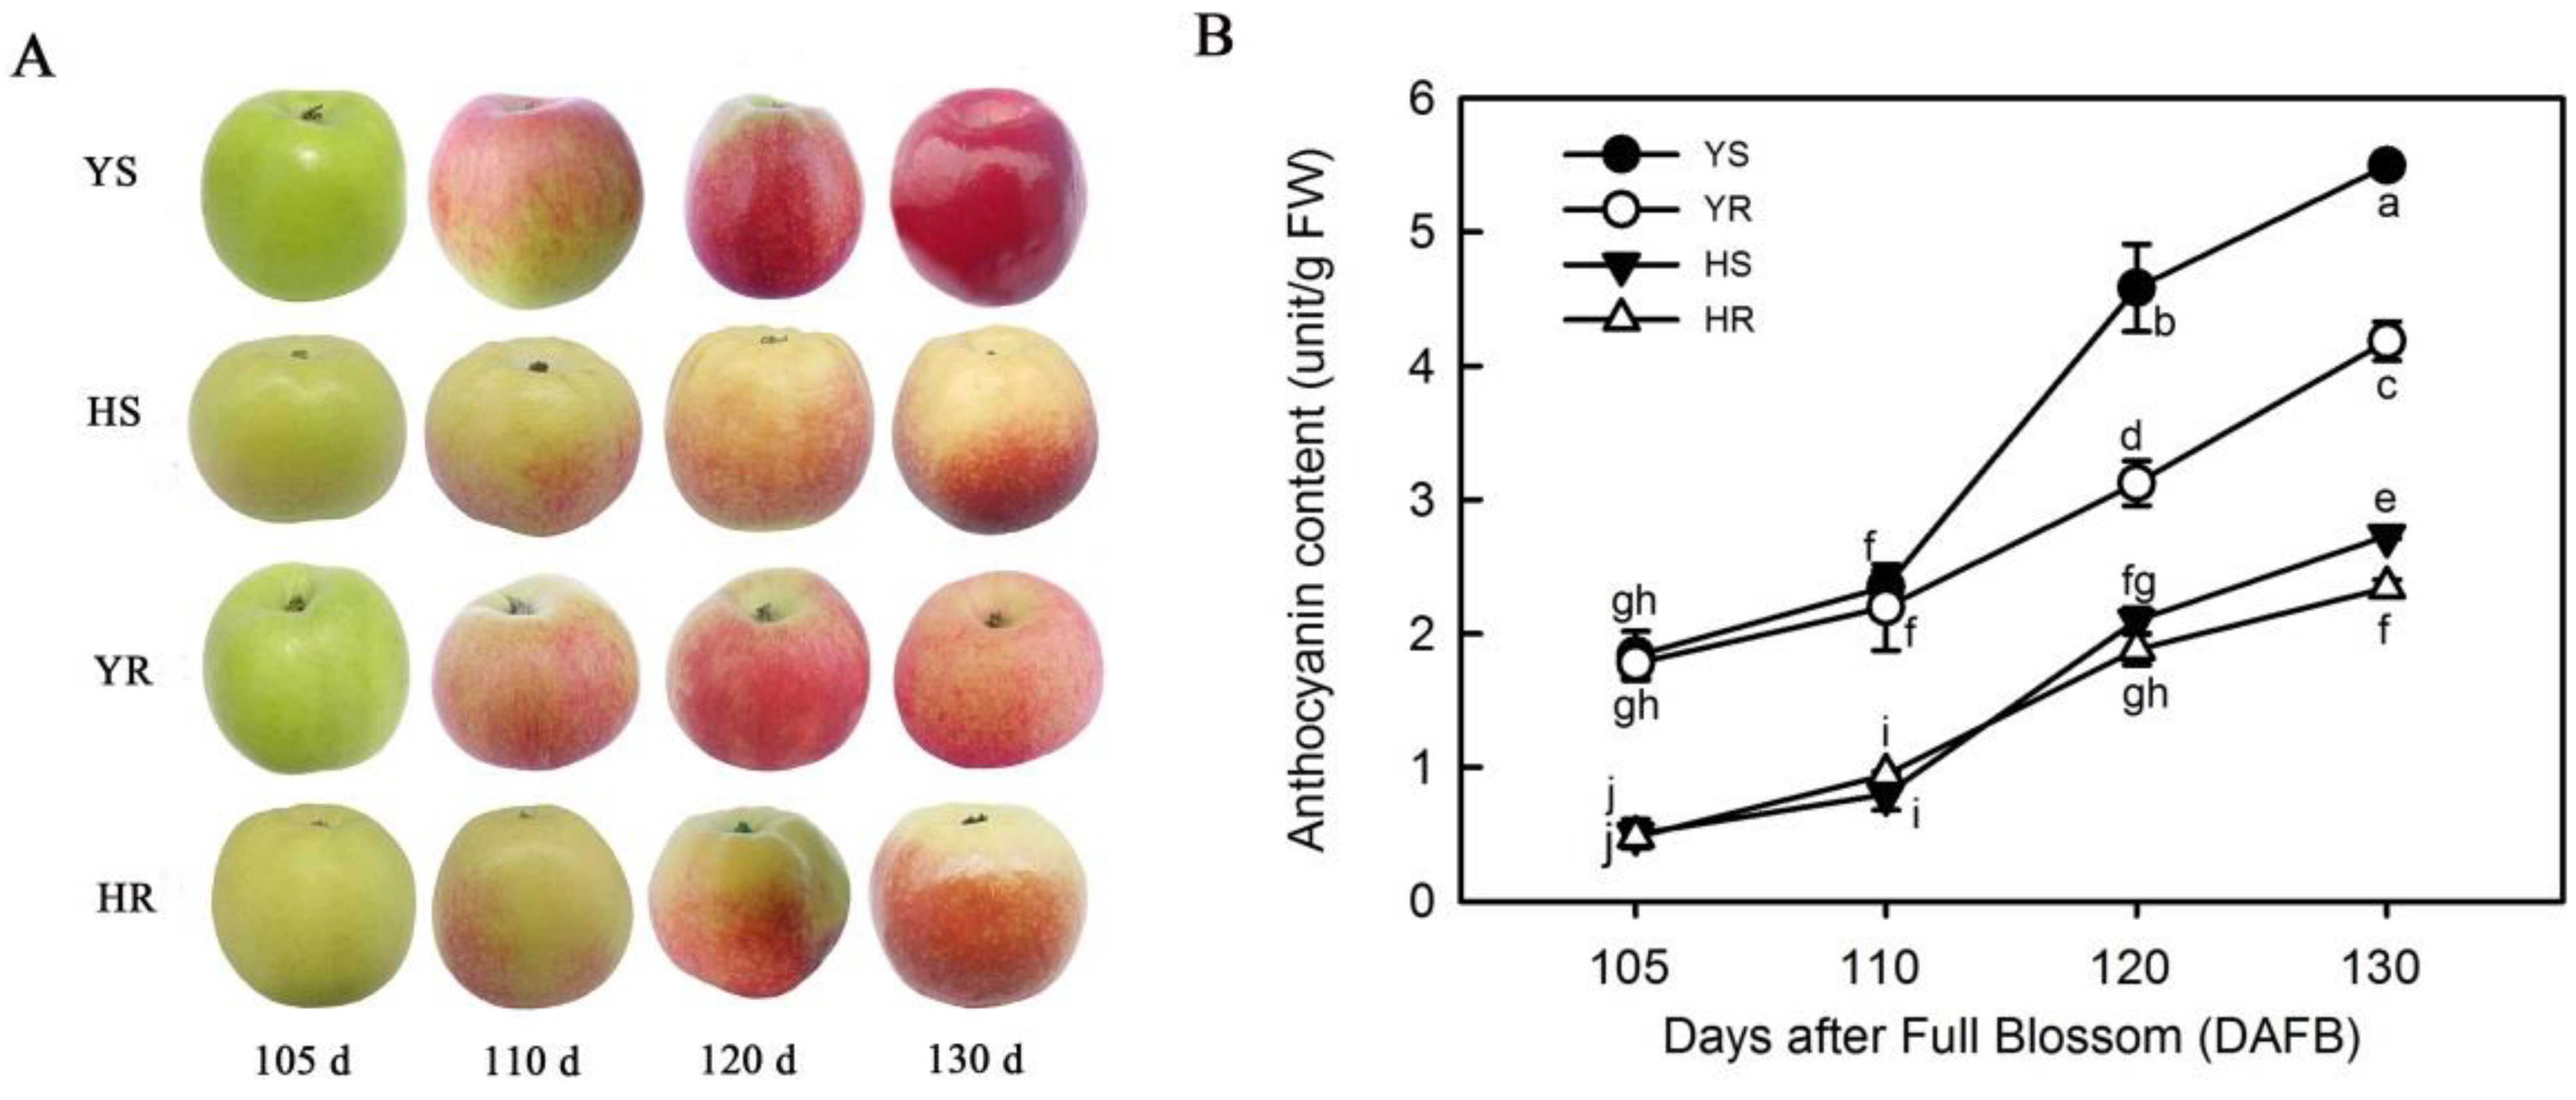
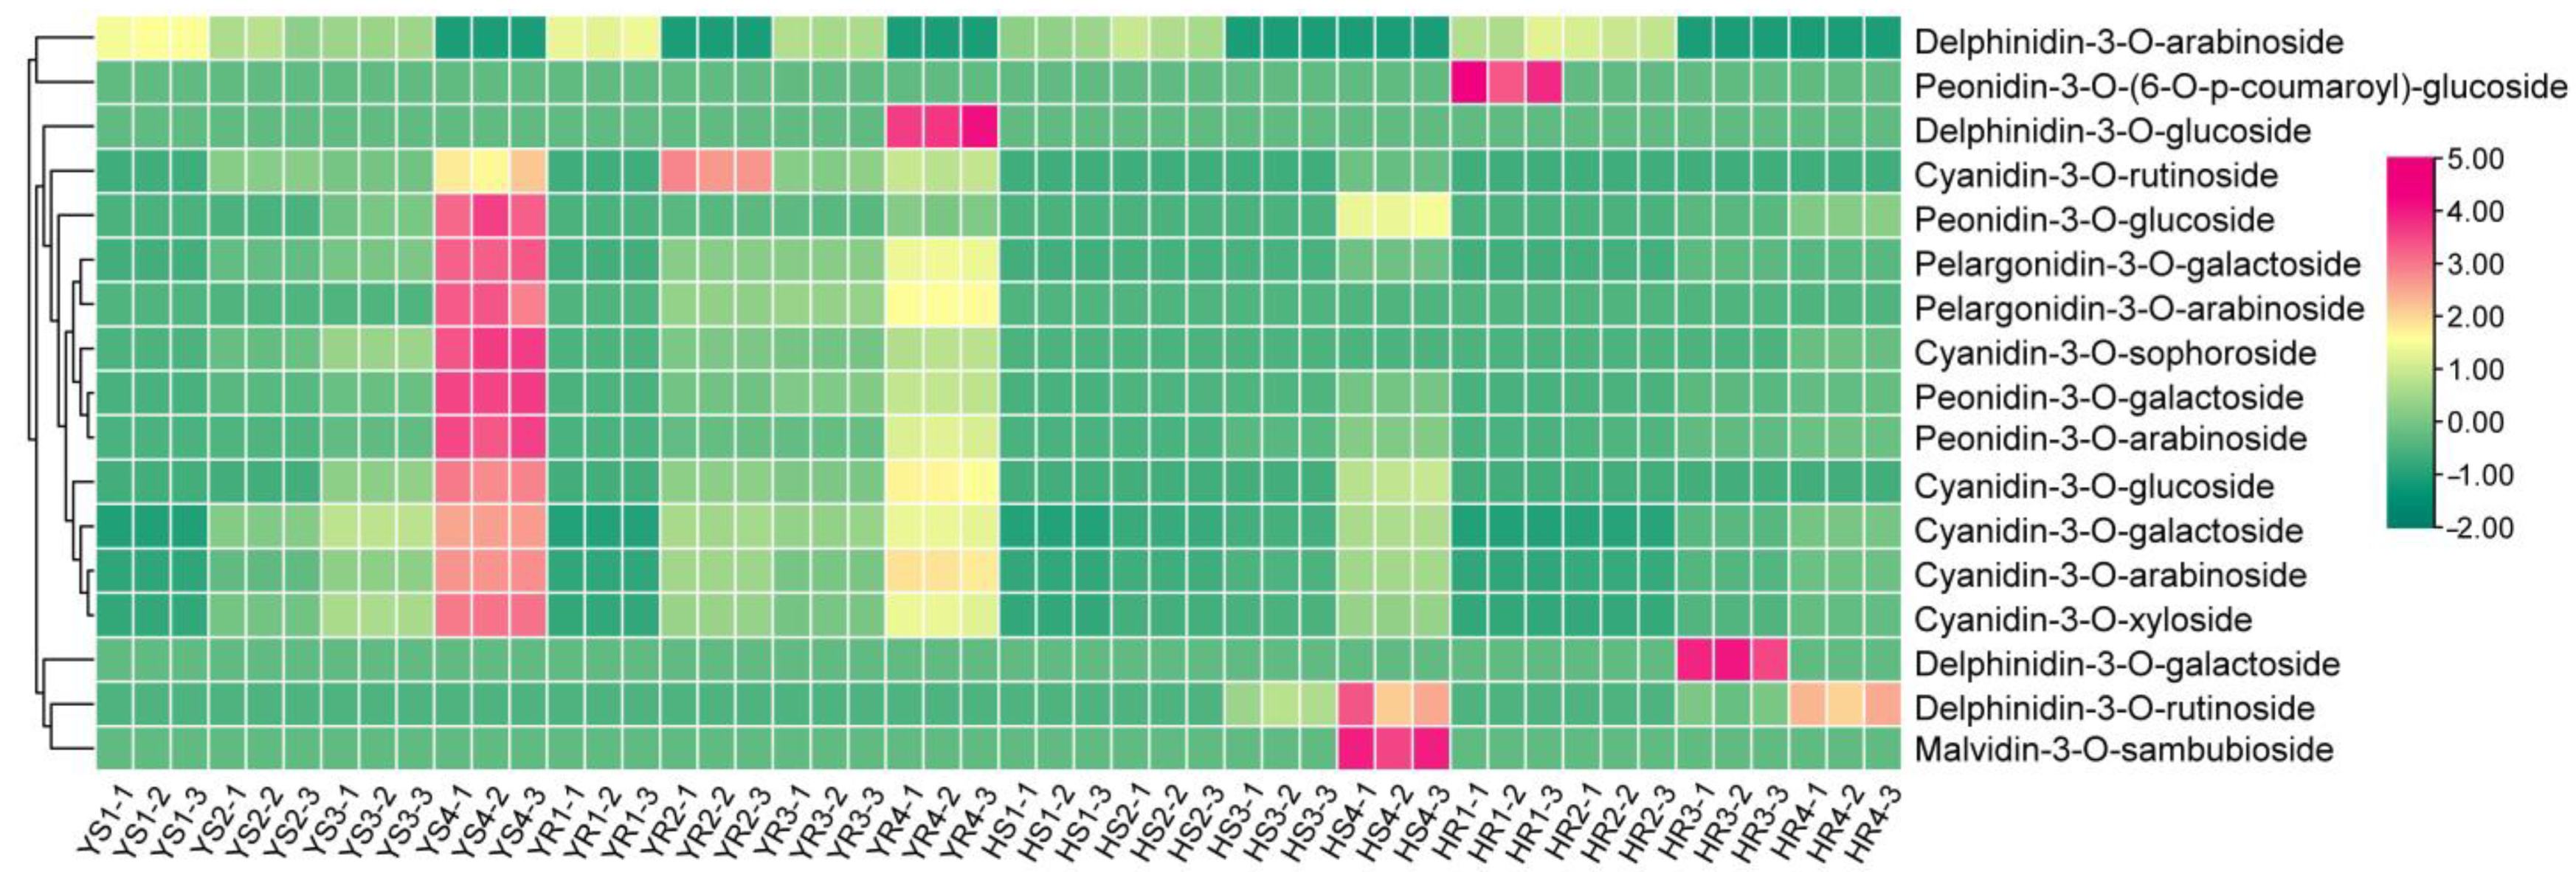
3.1. Relative Content of Anthocyanin in Different Varieties

The total anthocyanin content of Huashuo and Huarui apples in the two regions was determined using ultraviolet spectrophotometry. Figure 1A shows the phenotypes of apples at different color transition periods (130 d is the time for commercial maturation of YS). YS and YR exhibited a deep red color across the whole surface at 130 DAFB; however, HS and HR showed much lighter red color or were only partially colored (Figure 1A). The anthocyanin content of YS was the highest among all samples at each sampling time point, followed by that of YR. The anthocyanin content in YS and YR was much higher than that in either HS or HR over the entire color transition period (Figure 1B).
The anthocyanin components and content in different samples were also determined through HPLC-ESI-MS/MS (Table S2). Figure S2 shows representative MS chromatograms, indicating the reliability of the determination results. A heat map of anthocyanin content in all samples is shown in Figure 2. Seventeen anthocyanins were detected: six cyanidins, four peonidins, four delphinidins, two pelargonidins, and one malvidin. The change trends of these anthocyanins over the color transition period were not consistent. Overall, the content of nine anthocyanins (cyanidin-3-O-galactoside, cyanidin-3-O-arabinoside, cyanidin-3-O-xyloside, cyanidin-3-O-glucoside, peonidin-3-O-galactoside, pelargonidin-3-O-galactoside, cyanidin-3-O-sophoroside, peonidin-3-O-arabinoside, and pelargonidin-3-O-arabinoside) gradually increased, concomitant with peel color change, and their content in high-altitude samples (YS and YR) was significantly higher than in low-altitude samples (HS and HR) (Figure 2). In particular, cyanidin-3-O-rutinoside content was significantly higher in YS and YR than in HS and HR, with the highest being in YR2. The change trend of delphinidin-3-O-arabinoside in each cultivar was irregular, and could not be detected in the last color transition period of all samples. Delphinidin-3-O-galactoside was detected only in HR3, delphinidin-3-O-glucoside was detected only in YR4, and delphinidin-3-O-rutinoside was detected only in the last two periods of color change in the low-altitude samples (HS3, HS4, HR3, and HR4). Malvidin-3-O-sambubioside was detected only in HS4. Peonidin-3-O-(6-O-p-coumaroyl)-glucoside was detected only in HR1. Peonidin-3-O-glucoside was detected in both high- and low-altitude samples; however, the highest content among these samples only reached 0.15 μg/g in YS4, followed by 0.07 μg/g in HS4.
As the peel color gradually deepened, we selected the nine abovementioned anthocyanins, whose content gradually increased over time (Figure S3). Among these, the content of cyanidin-3-O-galactoside was the highest in all samples, followed by cyanidin-3-O-arabinoside and cyanidin-3-O-xyloside. Each anthocyanin showed the highest content in YS4, followed by YR4. In general, anthocyanin content in high-altitude samples (YS and YR) was much higher than in low-altitude samples (HS and HR).

3.2. Transcriptome Sequencing and Analysis

The two varieties in the two regions and four periods were evaluated through transcriptome sequencing. Quality control data for all samples are shown in Table S3, including total read counts, total base counts, average read length, Q20 and Q30 base ratios, and GC base ratio. Q20 ratios were all over 97%, and Q30 ratios also exceeded 90%. In each sample, most genes were 1–10 bp or 10–100 bp in length, while genes of 0.5–1 bp or >100 bp accounted for a small proportion (Figure S4). Average gene expression levels in YS and YR fluctuated slightly, but showed an evident downward trend in HS. Larger fluctuations occurred in HR in the four color transition periods (Figure S4). To further confirm the RNA-seq results, we randomly selected six genes for verification through qRT-PCR. The results were basically consistent with the transcriptome data, indicating that these data were reliable (Figure S5).

3.3. WGCNA of Anthocyanin Content and Transcriptome Data

As the apple peel color gradually deepened, we selected anthocyanins whose content increased gradually over the four periods for WGCNA (Figure 3). The specific content of each anthocyanin is shown in Table S2. Genes with highly correlated expression levels were mainly distributed in six modules (skyblue, darkorange2, pink, darkolivegreen, brown, and magenta) (Figure 3). We screened 823 genes using correlation coefficients ≥ 0.7 or ≤−0.7 as thresholds, and annotated gene functions using the plaBi database (https://www.plabipd.de/portal/web/guest/mercator-sequence-annotation, accessed on 15 February 2022). This is summarized in Figure S6. Except for unassigned genes, the most frequent annotation was proteins (11.18%), followed by RNA (8.38%). Secondary metabolism, including the phenylpropanoid pathway related to anthocyanin, flavonoid, and lignin production, accounted for 7.05% of all annotated genes. Finally, signaling and hormones accounted for 8.38% and 5.47%, respectively.

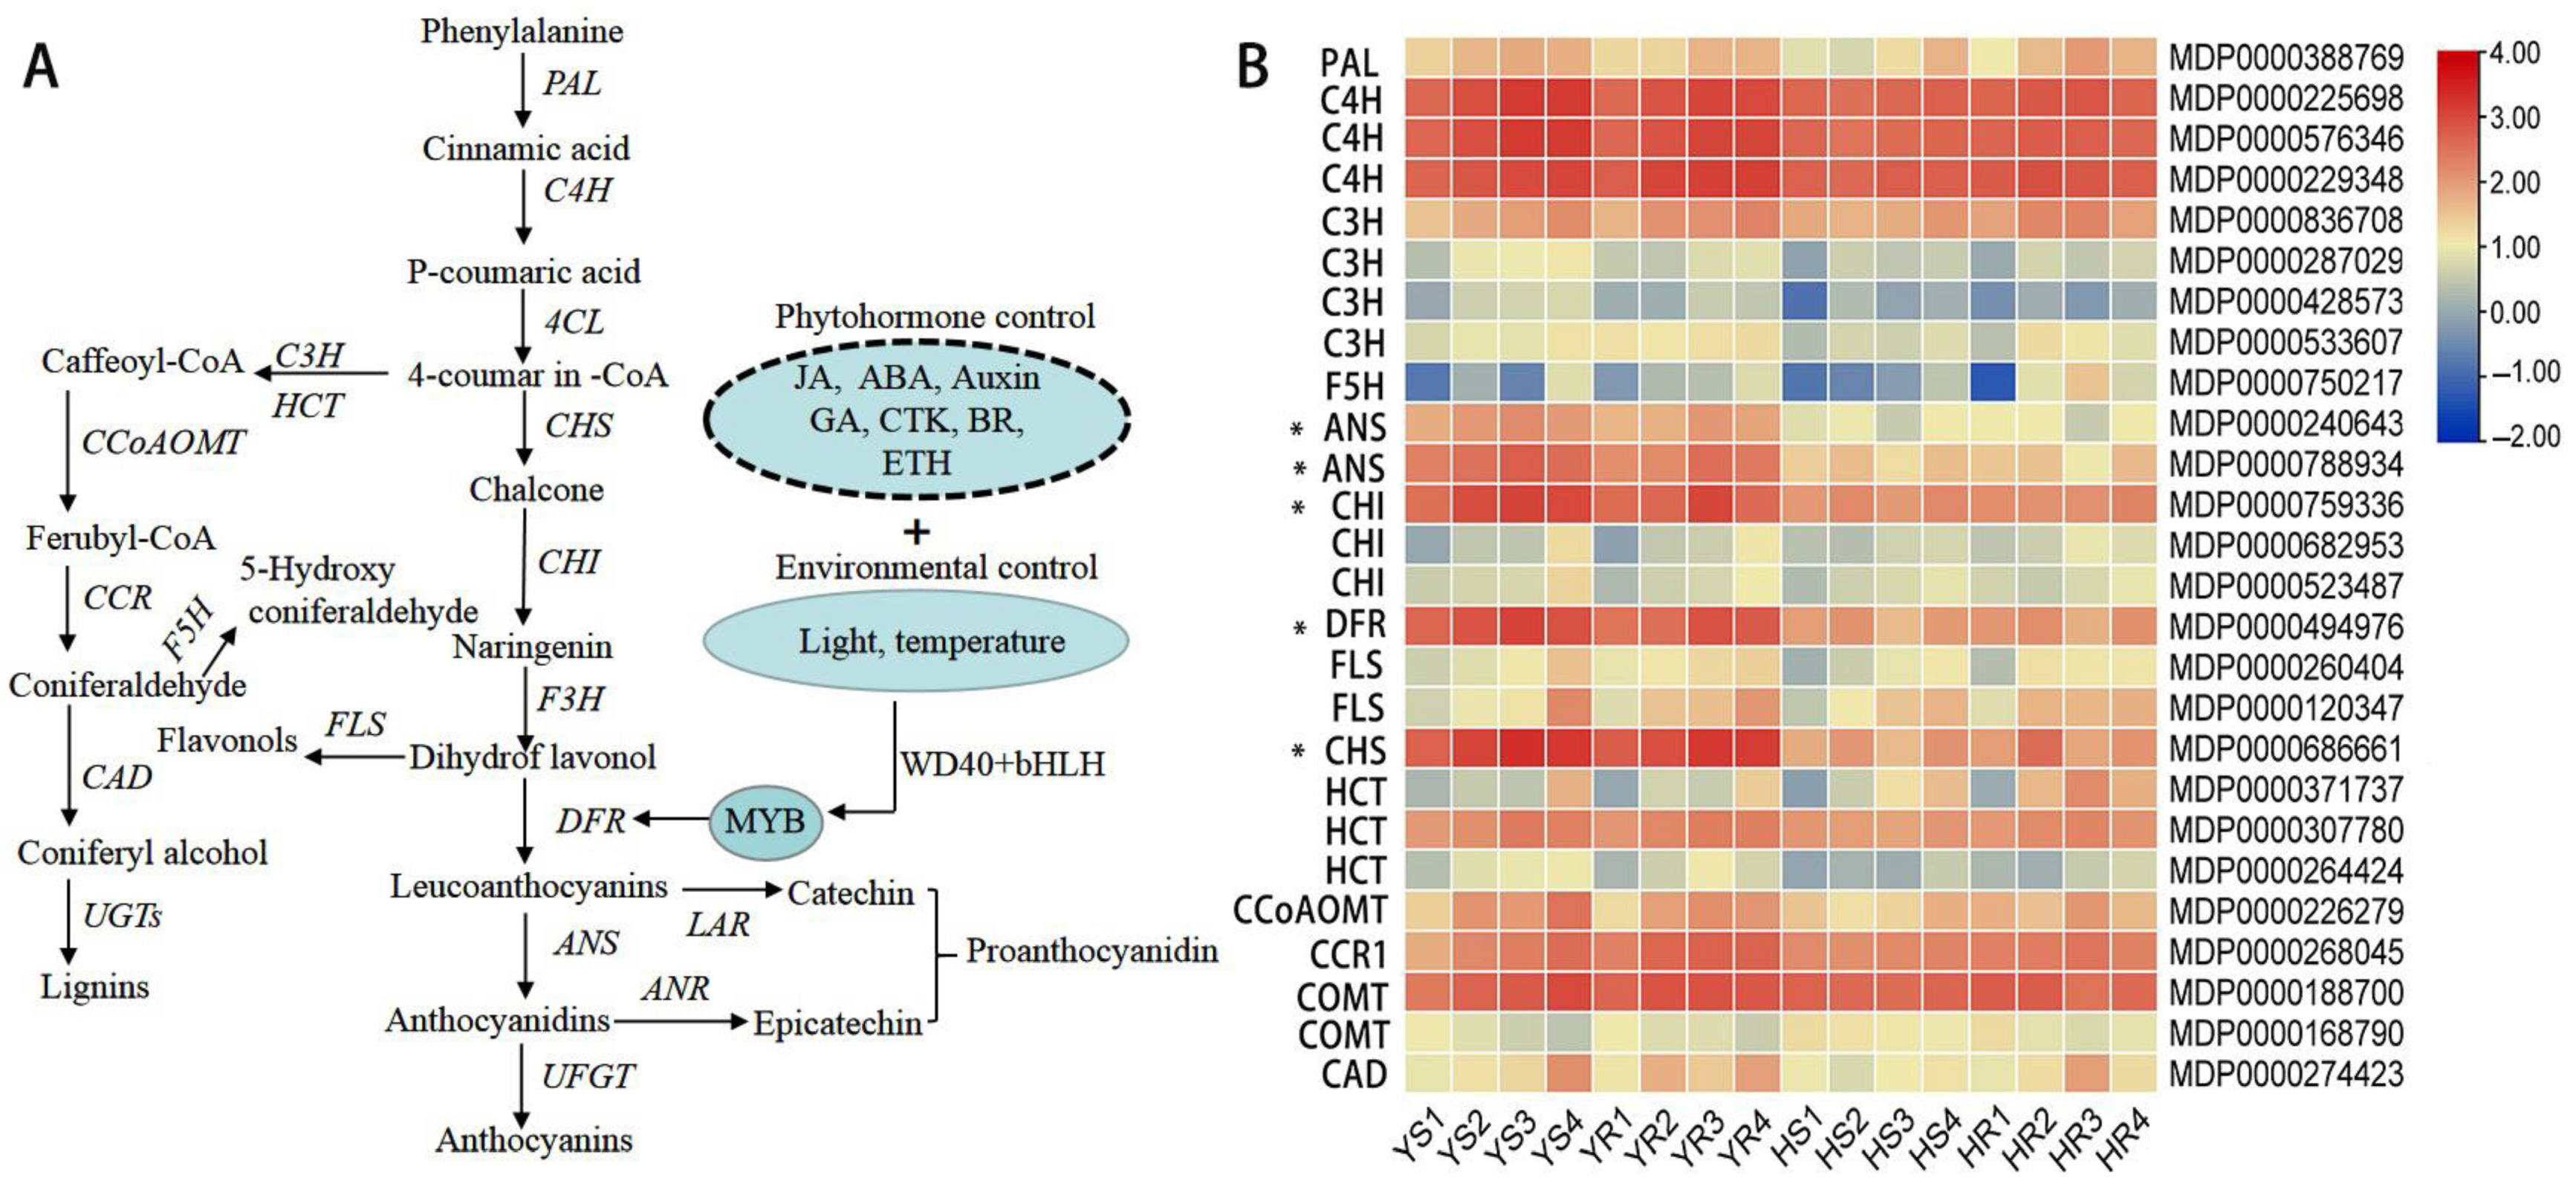
3.4. Expression of Genes Associated with the Regulation of Anthocyanin and Phenylpropanoid Metabolism

Among the genes screened by WGCNA, we found several that were related to the phenylpropanoid pathway (Figure 4A). The transcript levels of structural genes upstream of anthocyanin synthesis, including C4H, CHS, CHI, DFR, and ANS, were higher in the samples from the high-altitude orchard (YS and YR) than from the low-altitude orchard (HS and HR), especially CHI, DFR, ANS, and CHS. Moreover, transcript levels of the genes involved in flavonol and lignin synthesis, such as FLS, C3H, HCT, CCoAOMT, CCR, and CAD, increased gradually as peel color intensity increased, and were higher in YS and YR than in HS and HR (Figure 4B). Specifically, ANS had two copies with higher expression in YS and YR than in HS and HR. C4H had three copies with similar transcript levels throughout the whole color transition period. CHI had three copies, one of which showed significantly higher expression than the other two during the color transition period. FLS had two copies with different expression levels, but both of them gradually increased over the color transition period. Among lignin synthesis-related genes, C3H and HCT each had more than one copy, with one showing much higher transcript levels than the others (Figure 4B).
Hormones may also contribute to differences in anthocyanin accumulation. Eight hormone-related genes were found using WGCNA. The absolute value of the correlation coefficients between the levels of these genes and anthocyanin content was >0.7 (Table S4). Among these, transcripts of ETH (ethylene), CTK (cytokinin), JA (Jasmonic acid), and SA (salicylic acid) were all positively correlated with anthocyanin content. Regarding the correlation between other hormones and anthocyanin content, BR (brassinolide) had five positively and two negatively correlated transcripts, ABA had four positively and one negatively correlated transcript, GA had three positively and one negatively correlated transcript, and auxin had seven positively and five negatively correlated transcripts (Table S4).

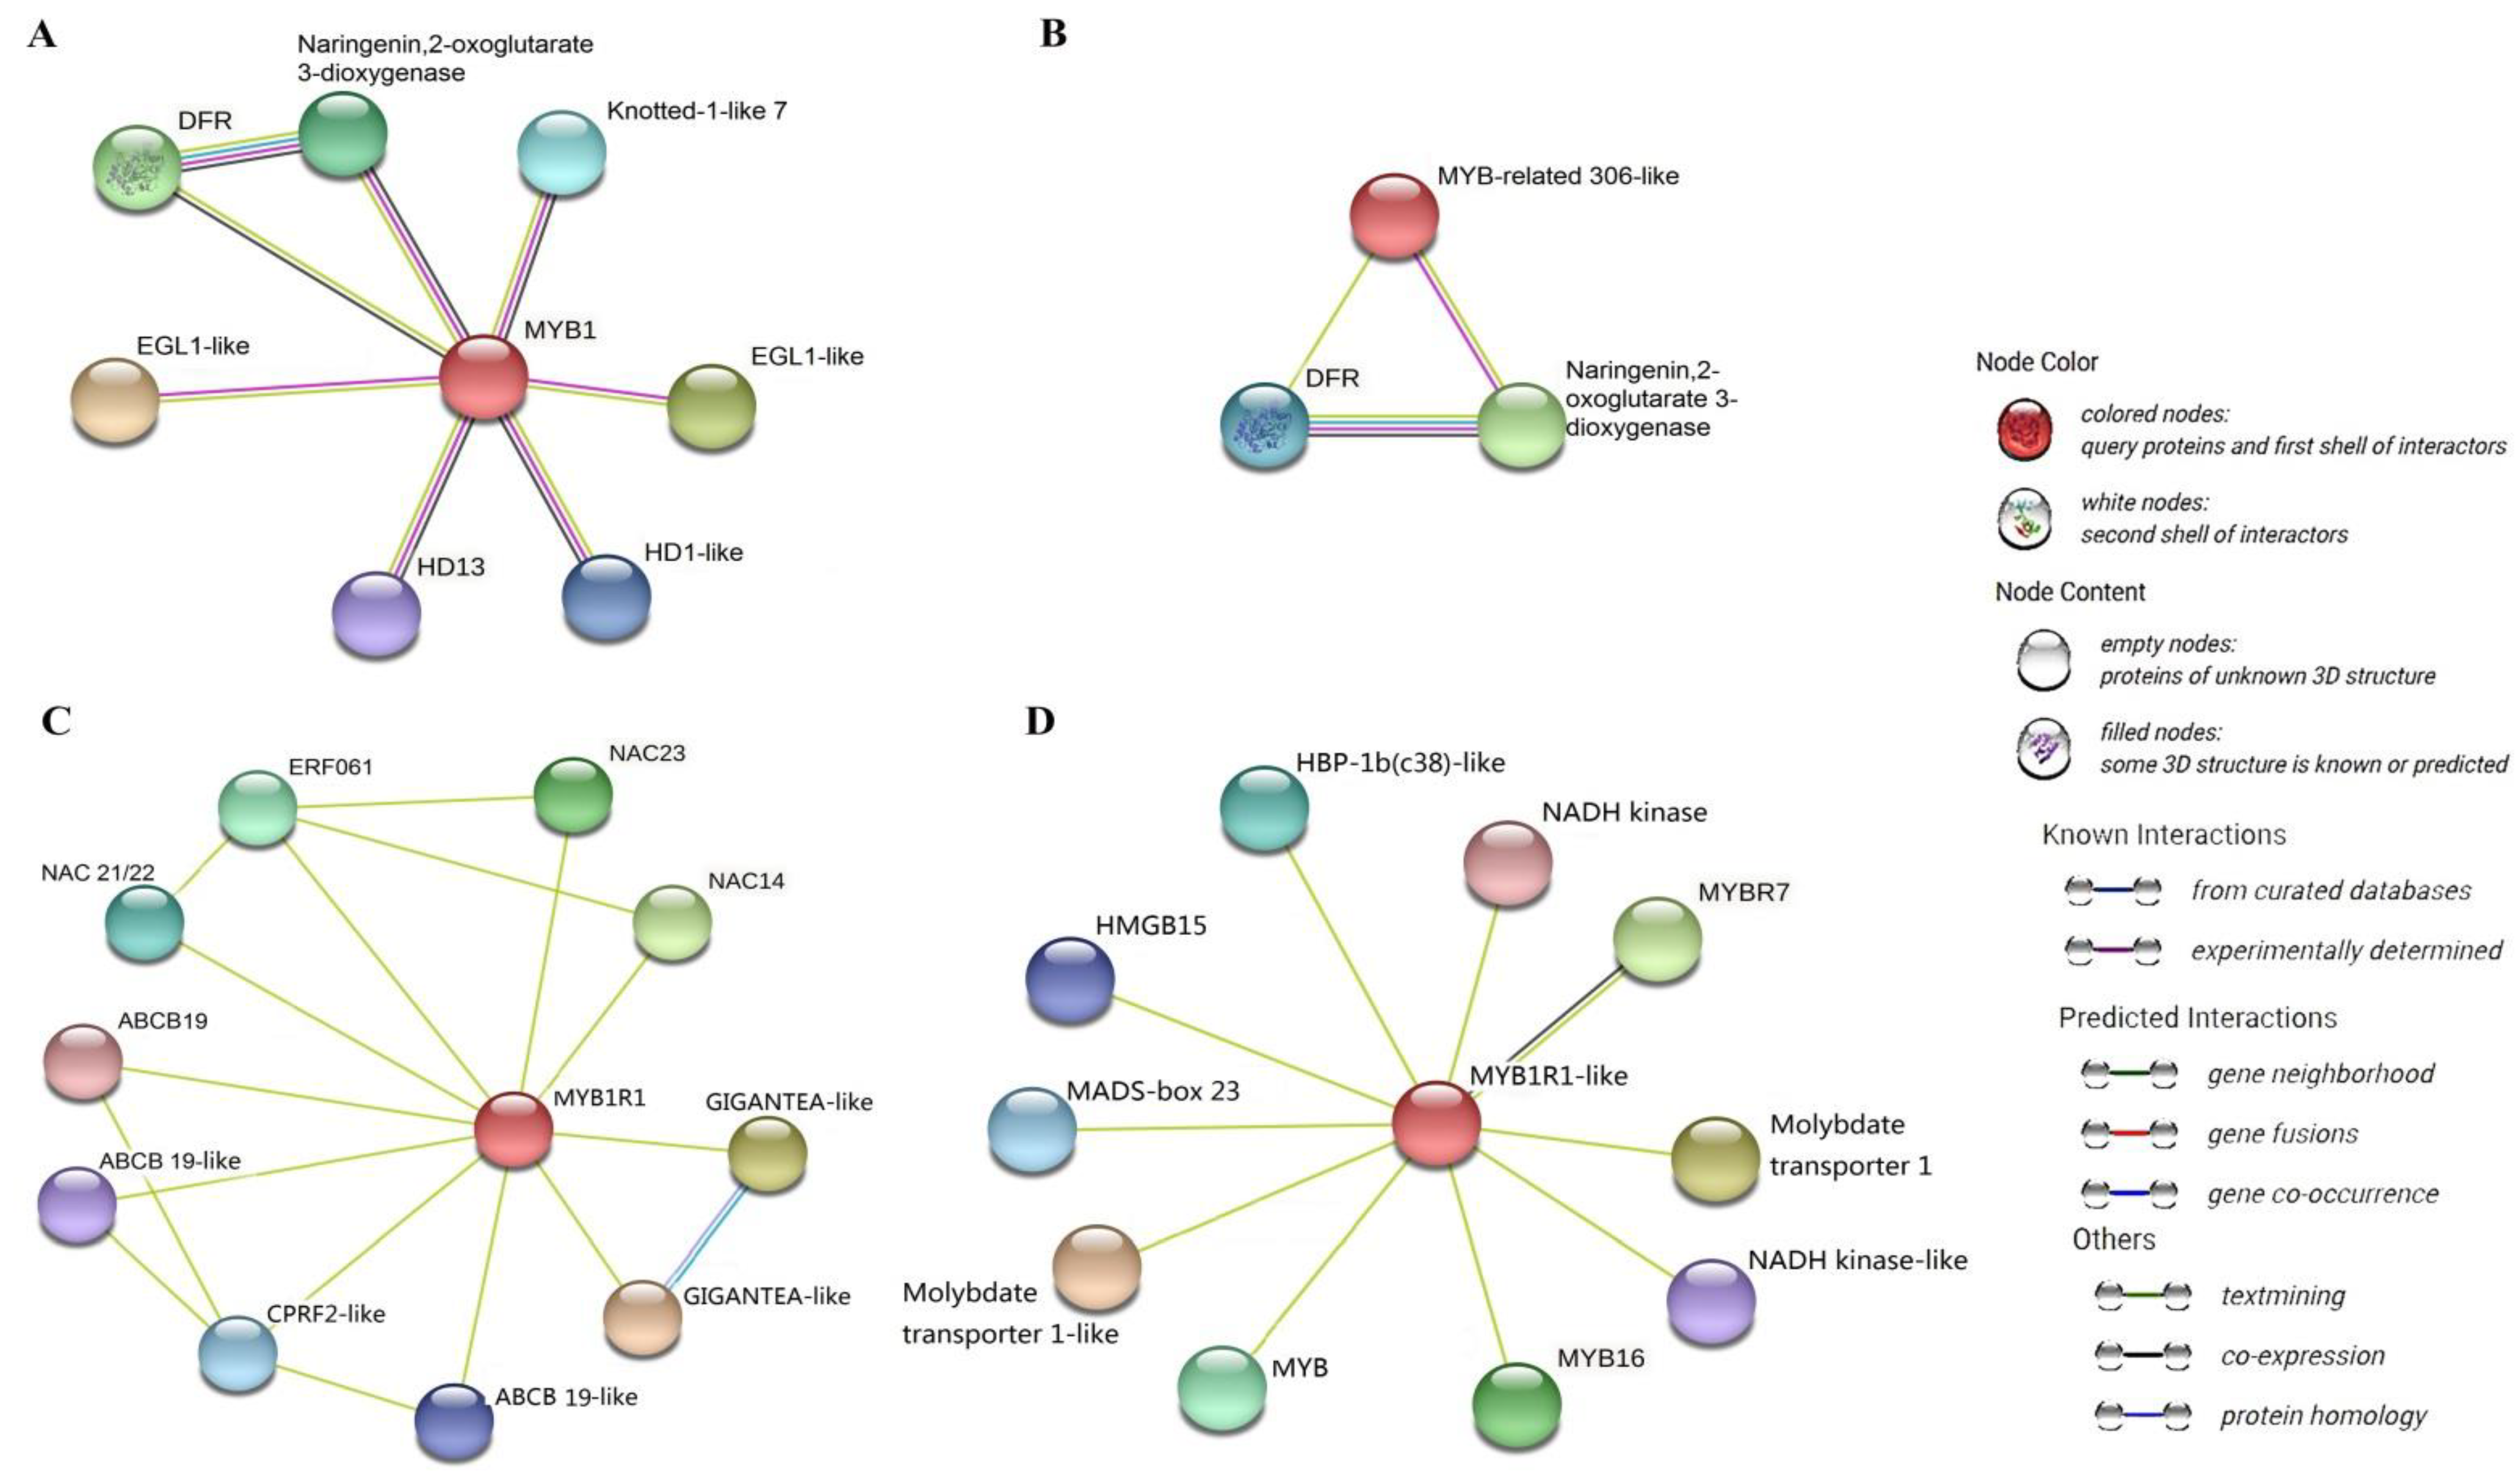
3.5. Key Transcription Factors and Structural Genes Associated with Anthocyanin Accumulation and Their Interaction Network

The main TFs associated with specific anthocyanins according to the above gene annotation results are shown in Table S5. Among all the TFs, four of these genes were predicted to interact with anthocyanin-related genes (Figure 5). MDP0000127691, annotated as MYB1, can interact with DFR, homeobox protein knotted-1-like 7, naringenin,2-oxoglutarate 3-dioxygenase, EGL1-like (endoglucanase 1-like), HD13 (homeodomain-containing protein 13), and HD1-like (Figure 5A). MDP0000284922 was predicted to be similar to the MYB-related 306-like protein in the string database, which was predicted to interact with DFR, and experimentally determined to interact with Naringenin,2-oxoglutarate 3-dioxygenase (Figure 5B). As for MDP0000758053, which is an MYB-related gene, the correlation coefficient between its transcript level and the accumulation of peonidin-3-O-galactoside was close to 0.70 (Table S2). It also interacted with three genes: one ABCB 19 (ATP-binding cassette transporter b family member 19); two ABCB 19-like genes related to anthocyanin accumulation in response to UV light; and some other proteins, such as NAC TFs, ERF061, GIGANTEA-like, and CPRF2-like (Figure 5C). Lastly, MDP0000074681, a MYB-like TF, can interact with MYB16 and another unnamed MYB, both of which were described as being able to respond to UV-A and flavonol 3-O-glucosyltransferase activity (Figure 5D).
According to the prediction results, some TFs can interact with DFR, which is a structure gene of anthocyanin biosynthesis. Moreover, we selected other structural genes, namely, DFR, CHS, CHI, and ANS. According to the interaction analysis, the transcription levels of these genes over the whole color transient period in high-altitude samples were much higher than those in low-altitude samples. DFR (MDP0000607969) can interact with FLS, ANS, F3H, and other proteins related to anthocyanin biosynthesis (Figure S7A). CHS (MDP0000686661) can interact with ANS, C4H, and some other enzymes (chalcone--flavonone isomerase 3 isoform, trans-cinnamate 4-monooxygenase-like, cinnamoyl-CoA reductase 1-like, and cinnamoyl-coa reductase 1-like) (Figure S7B). CHI (MDP0000205890) can interact with ANS, F3H, 4CL, CHI isoform, anthocyanin synthesis-related proteins, and other enzymes (Figure S7C). ANS (MDP0000240643) can interact with DFR, F3H, and some other enzymes, including flavonoid 3′-monooxygenase-like, leucoanthocyanidin reductase-like, naringenin,2-oxoglutarate 3-dioxygenase, anthocyanidin 3-O-glucosyltransferase 7-like, and anthocyanidin reductase isoform X1 (Figure S7D).

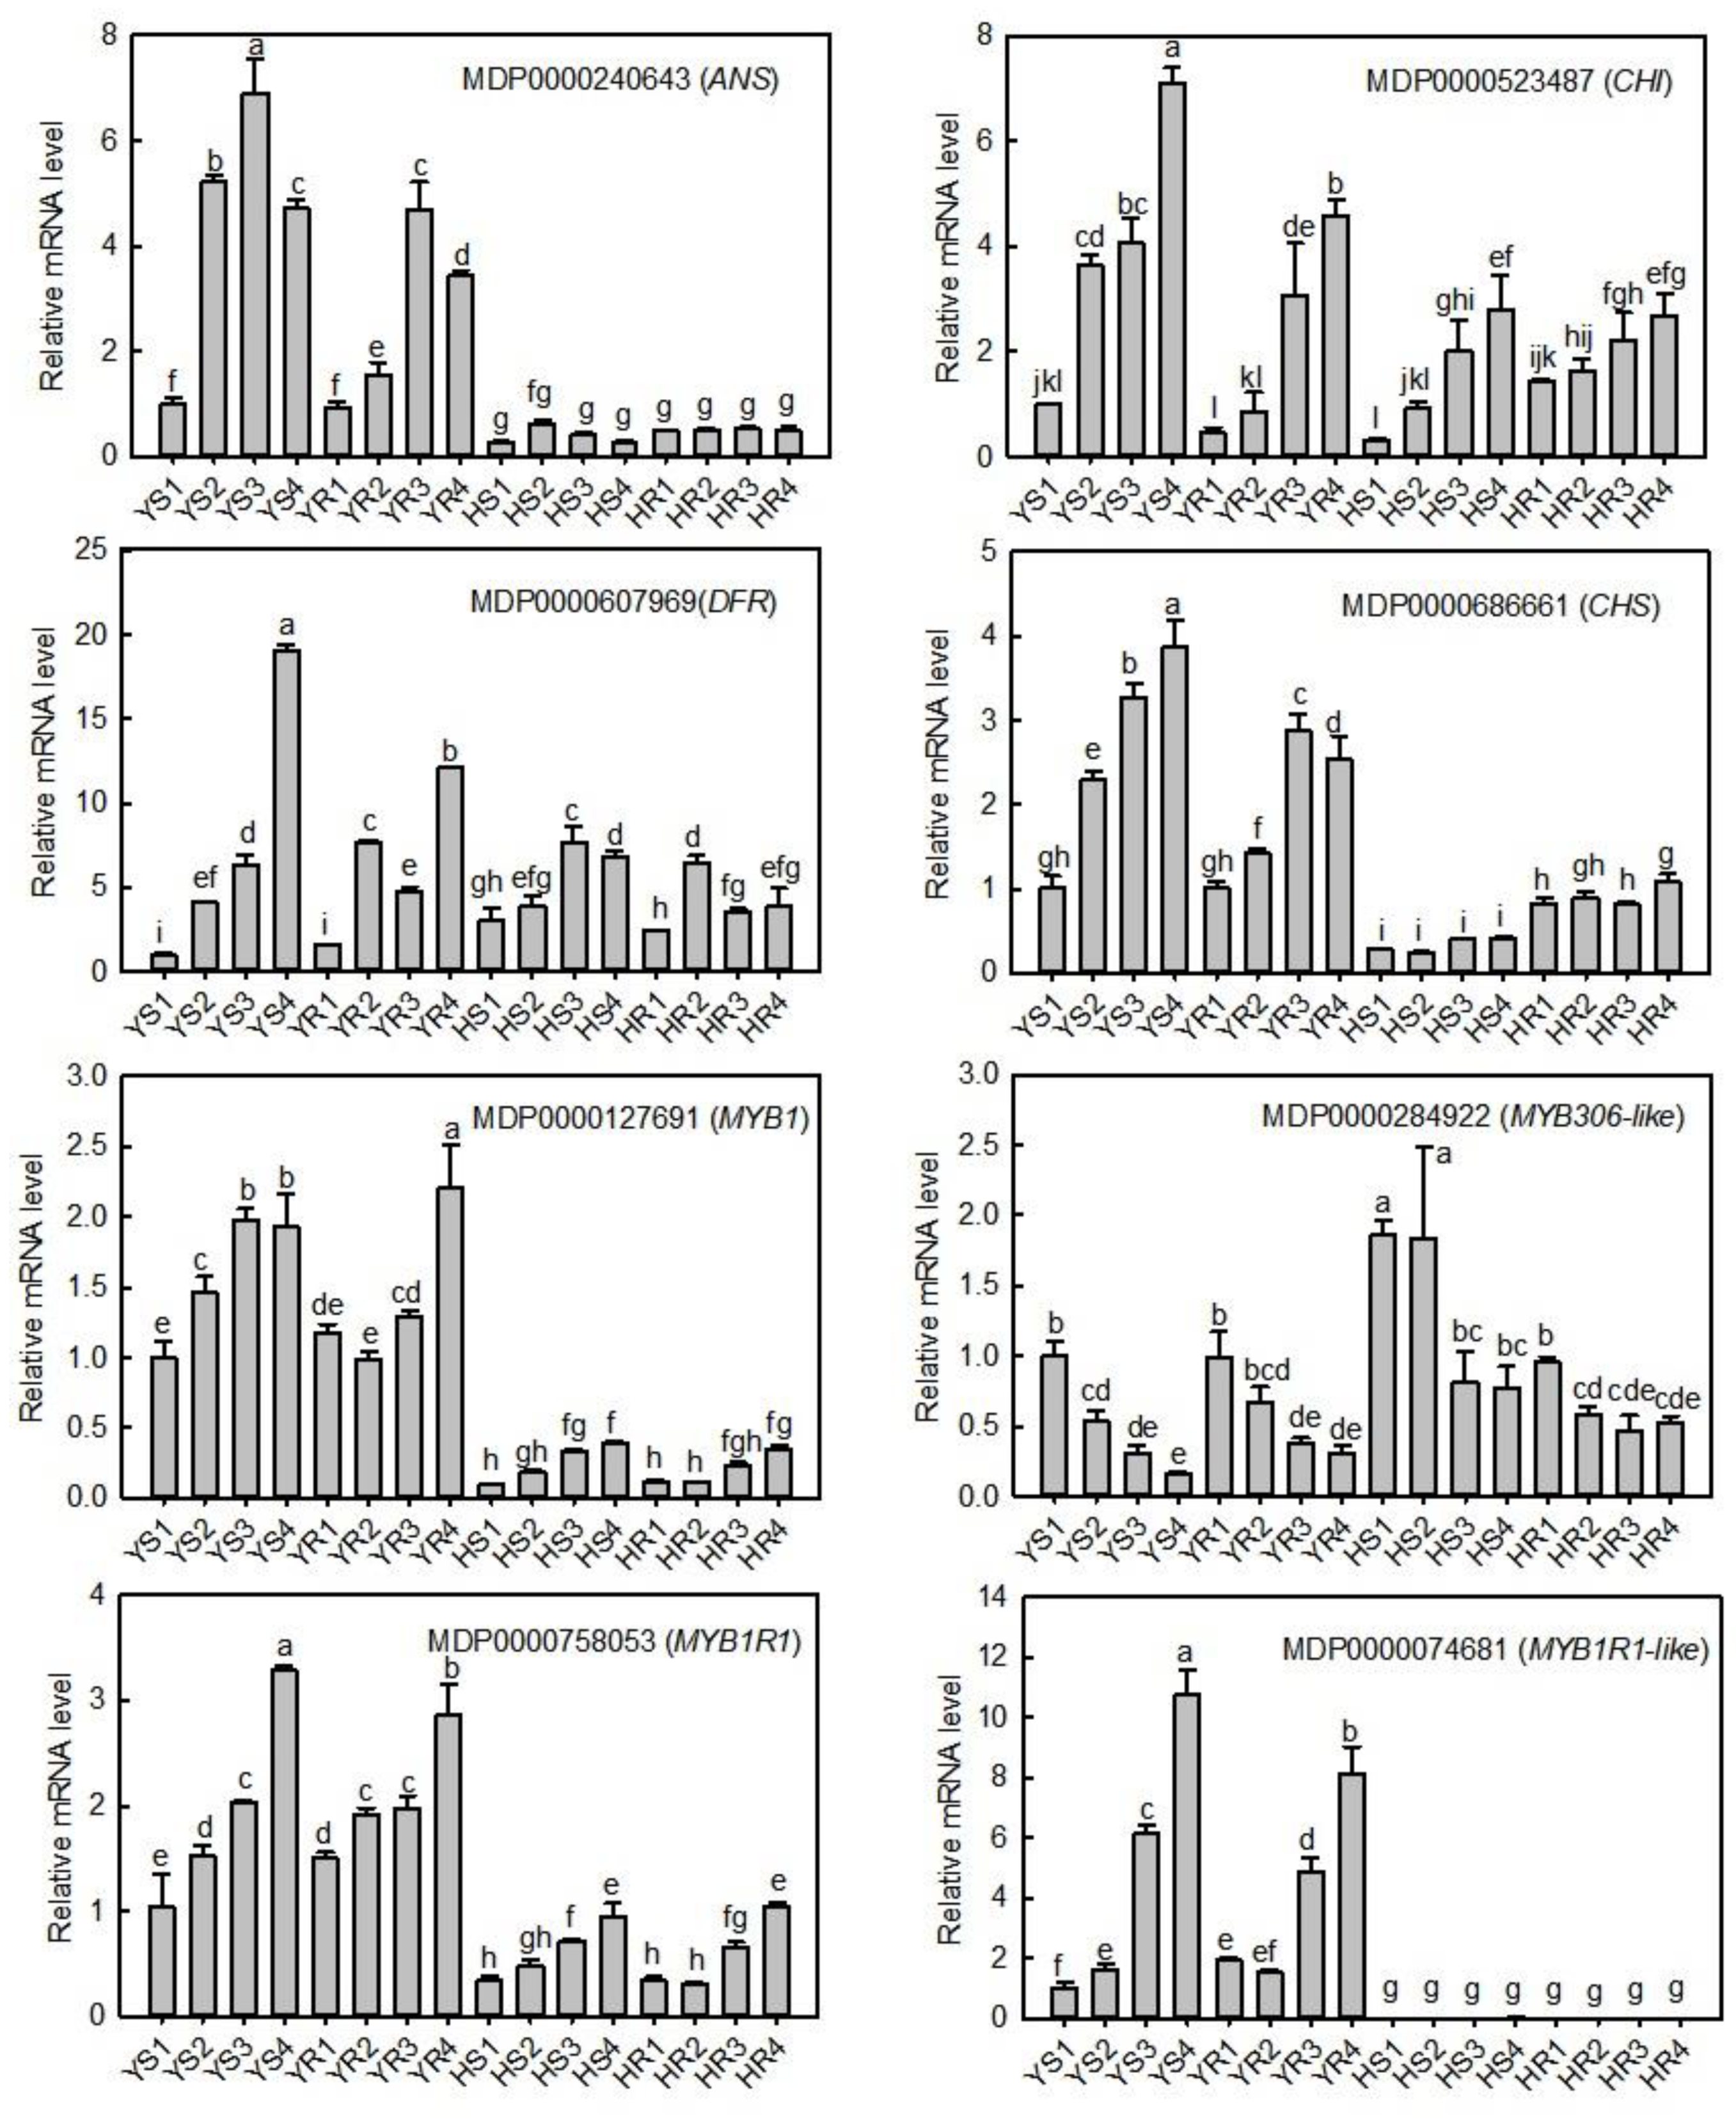
3.6. qRT-PCR Verification of the Expression Levels of Candidate Structural Genes and TFs

According to the above results, we found that the four structural genes (ANS, CHI, DFR, and CHS) and four TFs (MYB1, MYB306-like, MYB1R1, and MYB1R1-like) were possible candidate key genes for apple coloration at different altitudes. Furthermore, these eight genes (four structural genes and four genes encoding the TFs) were identified through qRT-PCR (Figure 6). The other genes were not selected as candidate genes because of their small difference multiples. The expression of these four structural genes was significantly higher at high altitude than at low altitude, and was basically increased along the four sampling periods, especially at high altitude. Among these four TFs, MYB306-like was negatively correlated with anthocyanin synthesis, and its expression level gradually decreased with the accumulation of anthocyanin content. The other three were positively correlated, and their expression was significantly higher at high altitude than at low altitude. Their expression patterns were consistent with those indicated by RNA-seq data and phenotypic changes observed in this study. Therefore, the above candidate genes may be the key to the apple’s reddening at different altitudes, but further research is needed to verify this.

4. Discussion

Anthocyanins are important pigments, and their accumulation is responsible for the red color of apple skins. In this study, 17 metabolites were identified and divided into five groups: pelargonidin, cyanidin, delphinidin, peonidin, and malvidin. We found that cyanidin 3-galactoside content was highest among all the metabolites analyzed throughout the color transition period (Figure 2 and Figure S2), a finding that is consistent with previously reported results [24,40]. According to our results, most anthocyanins, especially those present in abundance, were detected in both Huashuo and Huarui apples in the two regions at different altitudes. Therefore, we inferred that the difference in peel color between apples at the two altitudes was mainly related to differences in relative anthocyanin content rather than differences in the kinds of anthocyanins. Furthermore, some anthocyanins were not detected at some stages in either the HS or HR samples, suggesting that the content was too low.
Anthocyanins are synthesized by the phenylpropanoid pathway, which produces structurally diverse plant secondary metabolites, such as anthocyanins, flavonoids, lignins, and proanthocyanidins [41]. In the present study, the levels of lignins and flavonol-related genes were also shown because their correlation coefficients with anthocyanin accumulation were >0.7. Honda et al. [42] reported that the expression of structural genes related to anthocyanin biosynthesis, including CHS, F3H, DFR, ANS, and UFGT, was up-regulated concomitant with increased anthocyanin accumulation in the skin of Jonathan and Fuji apples. Consistently, Ubi et al. [24] reported that increases in the expression of CHS, F3H, DFR, ANS, and UFGT in the fruit skin coincided with increased anthocyanin concentration. In the present study, of the five genes mentioned above, we only screened CHI, CHS, DFR, and ANS as being highly correlated with differential anthocyanin accumulation. Other studies have shown that anthocyanin accumulation in plants is not always correlated with the expression of CHS and CHI [43,44]; however, we detected high correlations between the expression of these genes and the accumulation of anthocyanins in both tested varieties, suggesting that there are interspecific differences. Thus, DFR was highly expressed in apple peel, especially in the high-altitude samples (YS and YR). Its expression was also highly correlated with anthocyanin accumulation, suggesting that it is a key gene promoting anthocyanin accumulation. Although not every transcript has the same expression level, such as CHI, it may play a major role (Figure 4). Therefore, we speculate that these four structural genes (CHI, CHS, DFR, and ANS) may be the key genes contributing to color differences caused by altitudes. CHS and ANS were enhanced by UV-B and low temperature treatments with the accumulation of anthocyanins [24]. Blue light irradiation improved total anthocyanin content in strawberry fruit during storage by increasing the activity of DFR, CHS, ANS, etc. [45]. MdBBX20 integrates anthocyanin accumulation in response to UV radiation and low temperature by increasing the expression levels of CHI, ANS, and DFR [26]. UV-B irradiation can promote the accumulation of anthocyanin in apple peel and the transcription levels of CHS, ANS, and DFR [18]. Thus, it can be seen that altitude may affect the expression levels of these structural genes by changing the temperature, light, and light quality, thereby causing phenotypic differences.
Some lignin and flavonoid biosynthesis genes were also annotated; these are also co-regulated by some TFs with anthocyanin biosynthesis [19,46,47]. The expression levels of these genes gradually increased as fruit ripening and color transformation increased (Figure 4). Anthocyanin and lignin are both derived from the phenylalanine pathway, with divergence at the central metabolite, 4-coumaroyl CoA. Another gene, C4H, reportedly plays a vital role in lignin biosynthesis [48]. In particularly, Ring et al. [49] suggest that the down-regulation of the CHS gene diverts the flux from anthocyanins to lignin. In the present study, the expression of CHS, DFR, and ANS was much higher than that of genes in the lignin (C3H and HCT) and flavonol (FLS) synthesis pathways over the color change period in the two varieties. Therefore, many substrates for the synthesis of anthocyanin were identified. The results emphasize the competition among different phenolic pathways for common precursors.
Differences in environmental conditions related to altitude also stimulate changes in plant hormones. Hormone changes may directly affect structural genes or TFs involved in anthocyanin synthesis, eventually leading to apple peel color changes [13]. In the present study, some genes screened based on the correlation with anthocyanin content were hormone-related genes. Previous research has shown the different roles of hormones in regulating the formation of anthocyanins [13]. Endogenous ABA and ETH are important induction factors for sugars and, together, promote anthocyanin accumulation in blueberry fruits; IAA (indoleacetic acid) restrains sugar accumulation and anthocyanin synthesis, but the regulatory function of GA3 is not evident [50]. Li et al. [51] report that ABA and IAA can promote the synthesis of anthocyanins, while GA has inhibitory effects. A study has shown that the application of ETH at the large green developmental stage of Fragaria chiloensis fruit represses anthocyanin biosynthesis, resulting in the downregulation of essential anthocyanin biosynthesis genes during ripening. However, ETH stimulates lignin biosynthesis and considerably upregulates the expression of FcPOD27 [52]. Thus, it is clear that hormones act differently depending on the developmental stage or variety, and can regulate both anthocyanin and lignin synthesis pathways. We identified a variety of hormones that were closely related with anthocyanin accumulation (Table S4). It was found that different transcripts of the same hormone may promote or inhibit anthocyanin accumulation through various mechanisms, such as interactions with MYB. Moreover, they may function at different stages of fruit maturation. PacMYBA plays an important role in ABA-regulated anthocyanin biosynthesis in sweet cherry fruits [53]. We believe that there is a clear relationship between hormones and TFs in the regulation of anthocyanin synthesis.
An important role in anthocyanin biosynthesis is played not only by structural genes but also by TFs, such as MYB, WRKY, WD40, bZIP, MADS-box, and bHLH [54,55]. Specifically, R2R3-MYB is a core TF in anthocyanin biosynthesis in plants, and has been evaluated extensively in apples. In our study, many TFs, including AP2/EREBP, MYB, bHLH, C2C2, WRKY, C2H2, HAP, HB, and AS2, were screened by correlation analysis based on transcriptome data and anthocyanin levels (Table S5). Among these TFs, only two MYB and two MYB-like were predicted to interact with anthocyanin-related proteins (Figure 5). It is worth mentioning that one of the positive regulatory proteins was MYB1 (MDP0000127691), which could interact with DFR, a key protein related to anthocyanin synthesis (Figure 5A). MYB1 is a key gene regulating apple peel color, and it responds to UV-B [18]. In the present study, this gene was found to be closely related to anthocyanin accumulation in apple peel in both high- and low-altitudes regions, whereby it was predicted to play a key role in the coloring difference associated with altitude. Other proteins, such as naringenin,2-oxoglutarate 3-dioxygenase, are intermediates in the biosynthesis of plant flavonoids; EGL1 is a kind of cellulase that can hydrolyze soluble cellulose into reducing oligosaccharides; HD13, HD1-like, and Knotted-1-like 7 belong to the homeodomain family. Whether these proteins have a function in anthocyanin synthesis has not been reported yet. With respect to protein MDP0000284922, it was predicted as the name of the MYB-related 306-like protein in the string database, while MYB109 protein in the plabi database. In any case, we can confirm that it is a new MYB protein and, to the best of our knowledge, it has not been reported previously (Figure 5B). The only two proteins that it seemingly interacts with (i.e., DFR and naringenin,2-oxoglutarate 3-dioxygenase) are both related to coloring. Therefore, this gene may also play a role in color development because it is related to altitude effects. Of the two other MYB-like TFs, one was predicted to be the MYB1R1 protein (Figure 5C), which can interact with ABCB 19 and ABCB 19-like proteins to respond to UV, thereby promoting anthocyanin accumulation [56]. Altitude can cause differences in UV radiation intensity; therefore, MYB1R1 may be the key TF in the response to UV radiation at different altitudes, which eventually leads to differential accumulation of anthocyanins. The other protein was MYB1R1-like, which, as the name suggests, acts similarly to MYB1R1 (Figure 5D). Both proteins may play a vital role in anthocyanin accumulation. Transcriptome and qRT-PCR data revealed that three of the four TFs identified were positive regulatory factors, while the other was a negative regulatory factor (Figure 6 and Figure S5). Numerous studies have evaluated the role of MYB in the regulation of anthocyanin accumulation. MdMYB1, MdMYBA, and MdMYB10 are responsible for anthocyanin accumulation in apple peel, flesh, and leaves [15,57,58], and MdMYB110a is a homolog of MdMYB10 [59]. The overexpression of MdMYB9 and MdMYB11 promoted JA-induced biosynthesis of anthocyanin and proanthocyanidin in apples [60]. In turn, MdMYB90-like plays a key role in the regulation of anthocyanin biosynthesis in the Fuji apple mutant [61]. Some MYB TFs negatively regulate anthocyanin synthesis. For example, the overexpression of MdMYB16 [62] or MdMYB306-like [63] in the apple callus significantly reduces anthocyanin content. Based on the results of the present study, we believe that the four TFs we screened may play an important role in the accumulation of anthocyanins in apple peel at different altitudes. These TFs may respond to one or more of the environmental factors caused by altitude, such as UV or temperature. The difference in these environmental factors causes expression difference in TFs, which ultimately leads to the difference in apple skin coloration at different altitudes.
The importance of transcription factors is well known. In the present study, we speculate that the differential expression of the four TFs induces changes in the expression of anthocyanin synthesis-related structural genes, resulting in phenotypic differences between different altitudes. Of course, this complicated process warrants further investigation. Most proteins predicted to interact with CHI, CHS, ANS, and DFR were the anthocyanin-associated structural genes or intermediate enzymes (Figure S7). In addition to TFs, protein interactions of structural genes may also influence phenotype; therefore, it is a complex process, and further research is needed.

5. Conclusions

Several kinds of anthocyanins, mainly cyanidin-3-O-galactoside, cyanidin-3-O-arabinoside, and cyanidin-3-O-xyloside, showed substantial accumulation and contributed to the deeper color of apples at high altitude compared with color at low altitude. The structural genes in the anthocyanin synthesis-related pathway, especially MdCHI, MdCHS, MdANS, and MdDFR, were significantly upregulated at high altitude compared with the levels at low altitude and may contribute to the observed differences in peel color. Based on correlations between gene expression and anthocyanin accumulation, and predicted interactions, four MYBs (MDP0000127691, MDP0000284922, MDP0000758053, and MDP0000074681) were concluded to be related to color differences due to altitude. These results provide genetic resources with potential applications in breeding for the development of anthocyanin-rich varieties. However, the detailed mechanism underlying color differences associated with altitude certainly warrants further study.

Supplementary Materials

The following supporting information can be downloaded at https://www.mdpi.com/article/10.3390/horticulturae9040475/s1, Figure S1: Temperature and UV differences between the two regions. (A) The highest and lowest temperature changes in the two regions during the whole color transition period. (B) UV difference between two regions on a sunny day during the color transition period. Figure S2. Representative MS chromatograms. (A) Total ion current chromatogram. (B) Extraction ion current chromatogram. (C) Integral correction chart. The quantitative analysis integral correction results of a randomly selected substance in different samples are displayed. The abscissa is the retention time (Time, min) and the ordinate is the ion current intensity (Intensity, cps). Figure S3: Contents of gradually increasing anthocyanins in each sample. Different lowercase letters on the bar in each graph indicate significant differences at p < 0.05 according to Duncan’s multiple range test. YS, Huashuo in Zhaotong city; YR, Huarui in Zhaotong city; HS, Huashuo in Zhengzhou city; HR, Huarui in Zhengzhou city. Figure S4: Gene length distribution and average expression level of each sample. YS, Huashuo in Zhaotong city; YR, Huarui in Zhaotong city; HS, Huashuo in Zhengzhou city; HR, Huarui in Zhengzhou city. Figure S5: qRT-PCR validation of gene expression level in the transcriptome. YS, Huashuo in Zhaotong city; YR, Huarui in Zhaotong city; HS, Huashuo in Zhengzhou city; HR, Huarui in Zhengzhou city. Figure S6: Functional annotation of genes with correlation values of ≥0.7 or ≤−0.7. Figure S7: Interaction network analysis for MdDFR, MdCHS and MdCHI. Node content, empty nodes represent proteins of unknown 3D structure; filled nodes represent proteins with known or predicted 3D structure. Lines of different colors between nodes represent different relationships of proteins. Table S1: The primer sequences used in qRT-PCR. Table S2: Type and number of anthocyanins tested in this project. Table S3: Statistics of all sample quality control data. Table S4: Hormones related to anthocyanin accumulation. Table S5: Main transcription factor information.

Author Contributions

Project design, D.G. and C.S.; materials collection, Z.W.; scientific experiments, Z.W., L.L. and J.L.; data analysis, C.S.; writing—original draft preparation, C.S.; writing—review and editing, M.L. and D.G.; project administration, C.S. and D.G. All authors have read and agreed to the published version of the manuscript.

Funding

This study was supported by grants from the Key Research and Development Projects in Henan Province (221111111800), Scientific and Technological Research in Henan Province (212102110428), and the Central Public-interest Scientific Institution Basal Research Fund (1610192020104, 1610192023103).

Data Availability Statement

Sequence data from this work can be found in the NCBI database (SRA data: PRJNA857470).

Acknowledgments

We thank Xingkai Lu and Daoping Zhang for their help with the sampling process in Yunnan.

Conflicts of Interest

The authors declare no conflict of interest.

References

  1. Tsurunaga, Y.; Takahashi, T.; Katsube, T.; Kudo, A.; Kuramitsu, O.; Ishiwata, M.; Matsumoto, S. Effects of UV-B irradiation on the levels of anthocyanin, rutin and radical scavenging activity of buckwheat sprouts. Food Chem. 2013, 141, 552–556. [Google Scholar] [CrossRef] [PubMed]
  2. Sivankalyani, V.; Feygenberg, O.; Diskin, S.; Wright, B.; Alkan, N. Increased anthocyanin and flavonoids in mango fruit peel are associated with cold and pathogen resistance. Postharvest Biol. Technol. 2016, 111, 132–139. [Google Scholar] [CrossRef]
  3. An, J.P.; Zhang, X.W.; Bi, S.Q.; You, C.X.; Wang, X.F.; Hao, Y.J. The ERF transcription factor MdERF38 promotes drought stress-induced anthocyanin biosynthesis in apple. Plant J. 2020, 101, 573–589. [Google Scholar] [CrossRef] [PubMed]
  4. Lev-Yadun, S.; Gould, K.S. Role of anthocyanins in plant defence. In Anthocyanins; Springer: New York, NY, USA, 2008; pp. 22–28. [Google Scholar]
  5. Zhang, Y.; Butelli, E.; Martin, C. Engineering anthocyanin biosynthesis in plants. Curr. Opin. Plant Biol. 2014, 19, 81–90. [Google Scholar] [CrossRef]
  6. Shang, Y.; Wang, W.; Zhu, P.; Ye, Y.; Dai, P.; Zhao, W.; Wang, Y. Anthocyanins: Novel antioxidants in diseases prevention and human health. In Flavonoids—A Coloring Model for Cheering Up Life; IntechOpen: London, UK, 2019; pp. 1–16. [Google Scholar]
  7. Cakar, U.D.; Petrovic, A.V.; Živković, M.; Vajs, V.; Milovanovic, M.M.; Zeravik, J.; Djordjević, B. Phenolic profile of some fruit wines and their antioxidant properties. Hem. Ind. 2016, 70, 661–672. [Google Scholar] [CrossRef] [Green Version]
  8. Butelli, E.; Titta, L.; Giorgio, M.; Mock, H.P.; Matros, A.; Peterek, S.; Schijlen, E.G.; Hall, R.D.; Bovy, A.G.; Luo, J. Enrichment of tomato fruit with health-promoting anthocyanins by expression of select transcription factors. Nat. Biotechnol. 2008, 26, 1301–1308. [Google Scholar] [CrossRef]
  9. Pojer, E.; Mattivi, F.; Johnson, D.; Stockley, C.S. The case for anthocyanin consumption to promote human health: A review. Compr. Rev. Food Sci. Food Saf. 2013, 12, 483–508. [Google Scholar] [CrossRef]
  10. Fragoso, M.F.; Romualdo, G.R.; Vanderveer, L.A.; Franco-Barraza, J.; Cukierman, E.; Clapper, M.L.; Carvalho, R.F.; Barbisan, L.F. Lyophilized açaí pulp (Euterpe oleracea Mart) attenuates colitis-associated colon carcinogenesis while its main anthocyanin has the potential to affect the motility of colon cancer cells. Food Chem. Toxicol. 2018, 121, 237–245. [Google Scholar] [CrossRef] [Green Version]
  11. Boyer, J.; Liu, R.H. Apple phytochemicals and their health benefits. Nutr. J. 2004, 3, 5. [Google Scholar] [CrossRef] [Green Version]
  12. Duan, W.; Sun, P.; Li, J. Expression of genes involved in the anthocyanin biosynthesis pathway in white and red fruits of fragaria pentaphylla and genetic variation in the dihydroflavonol-4-reductase gene. Biochem. Syst. Ecol. 2017, 72, 40–46. [Google Scholar] [CrossRef]
  13. Gao, H.N.; Jiang, H.; Cui, J.Y.; You, C.X.; Li, Y.Y. Review: The effects of hormones and environmental factors on anthocyanin biosynthesis in apple. Plant Sci. Int. J. Exp. Plant Biol. 2021, 312, 111024. [Google Scholar] [CrossRef] [PubMed]
  14. Kondo, S.; Hiraoka, K.; Kobayashi, S.; Honda, C.; Terahara, N. Changes in the expression of anthocyanin biosynthetic genes during apple development. J. Am. Soc. Hortic. Sci. Jashs 2002, 127, 971–976. [Google Scholar] [CrossRef]
  15. Takos, A.M.; Jaffe, F.W.; Jacob, S.R.; Bogs, J.; Robinson, S.P.; Walker, A.R. Light-induced expression of a MYB gene regulates anthocyanin biosynthesis in red apples. Plant Physiol. 2006, 142, 1216–1232. [Google Scholar] [CrossRef] [Green Version]
  16. Ma, C.; Liang, B.; Chang, B.; Yan, J.; Liu, L.; Wang, Y.; Yang, Y.; Zhao, Z. Transcriptome profiling of anthocyanin biosynthesis in the peel of ‘granny smith’ apples (Malus domestica) after bag removal. BMC Genom. 2019, 20, 353. [Google Scholar] [CrossRef] [Green Version]
  17. Lin-Wang, K.; Micheletti, D.; Palmer, J.; Volz, R.; Lozano, L.; Espley, R.; Hellens, R.P.; Chagne, D.; Rowan, D.D.; Troggio, M.; et al. High temperature reduces apple fruit colour via modulation of the anthocyanin regulatory complex. Plant Cell Environ. 2011, 34, 1176–1190. [Google Scholar] [CrossRef] [PubMed]
  18. Hu, J.; Fang, H.; Wang, J.; Yue, X.; Su, M.; Mao, Z.; Zou, Q.; Jiang, H.; Guo, Z.; Yu, L.; et al. Ultraviolet b-induced MdWRKY72 expression promotes anthocyanin synthesis in apple. Plant Sci. Int. J. Exp. Plant Biol. 2020, 292, 110377. [Google Scholar] [CrossRef]
  19. Hu, Y.; Cheng, H.; Zhang, Y.; Zhang, J.; Niu, S.; Wang, X.; Li, W.; Zhang, J.; Yao, Y. The MdMYB16/MdMYB1-miR7125-MdCCR module regulates the homeostasis between anthocyanin and lignin biosynthesis during light induction in apple. New Phytol. 2021, 231, 1105–1122. [Google Scholar] [CrossRef]
  20. Yu, J.; Qiu, K.; Sun, W.; Yang, T.; Wu, T.; Song, T.; Zhang, J.; Yao, Y.; Tian, J. A long non-coding RNA functions in high-light-induced anthocyanin accumulation in apple by activating ethylene synthesis. Plant Physiol. 2022, 189, 66–83. [Google Scholar] [CrossRef]
  21. An, J.P.; Qu, F.J.; Yao, J.F.; Wang, X.N.; You, C.X.; Wang, X.F.; Hao, Y.J. The bZIP transcription factor MdHY5 regulates anthocyanin accumulation and nitrate assimilation in apple. Hortic. Res. 2017, 4, 17023. [Google Scholar] [CrossRef] [Green Version]
  22. Bai, S.; Saito, T.; Honda, C.; Hatsuyama, Y.; Ito, A.; Moriguchi, T. An apple B-BOX protein, MdCOL11, is involved in UV-B- and temperature-induced anthocyanin biosynthesis. Planta 2014, 240, 1051–1062. [Google Scholar] [CrossRef]
  23. Fang, H.; Dong, Y.; Yue, X.; Chen, X.; He, N.; Hu, J.; Jiang, S.; Xu, H.; Wang, Y.; Su, M.; et al. MdCOL4 interaction mediates crosstalk between UV-B and high temperature to control fruit coloration in apple. Plant Cell Physiol. 2019, 60, 1055–1066. [Google Scholar] [CrossRef] [PubMed]
  24. Ubi, B.E.; Honda, C.; Bessho, H.; Kondo, S.; Wada, M.; Kobayashi, S.; Moriguchi, T. Expression analysis of anthocyanin biosynthetic genes in apple skin: Effect of UV-B and temperature. Plant Sci. 2006, 170, 571–578. [Google Scholar] [CrossRef]
  25. Wang, N.; Zhang, Z.Y.; Jiang, S.H.; Xu, H.F.; Wang, Y.C.; Feng, S.Q.; Chen, X.S. Synergistic effects of light and temperature on anthocyanin biosynthesis in callus cultures of red-fleshed apple (Malus sieversii f. niedzwetzkyana). Plant Cell Tissue Org. 2016, 127, 217–227. [Google Scholar] [CrossRef] [Green Version]
  26. Fang, H.; Dong, Y.; Yue, X.; Hu, J.; Jiang, S.; Xu, H.; Wang, Y.; Su, M.; Zhang, J.; Zhang, Z.; et al. The B-box zinc finger protein MdBBX20 integrates anthocyanin accumulation in response to ultraviolet radiation and low temperature. Plant Cell Environ. 2019, 42, 2090–2104. [Google Scholar] [CrossRef]
  27. Charles, M.; Corollaro, M.L.; Manfrini, L.; Endrizzi, I.; Aprea, E.; Zanella, A.; Corelli Grappadelli, L.; Gasperi, F. Application of a sensory–instrumental tool to study apple texture characteristics shaped by altitude and time of harvest. J. Sci. Food Agric. 2018, 98, 1095–1104. [Google Scholar] [CrossRef]
  28. Yan, Z.; Zhang, H.; Zhang, R.; Liu, Z.; Guo, G. Performance of new apple variety ‘huashuo’ in 14 producing areas in China. China Fruits 2016, 90–94. [Google Scholar] [CrossRef]
  29. Shi, C.; Liu, L.; Wei, Z.; Liu, J.; Li, M.; Yan, Z.; Gao, D. Anthocyanin accumulation and molecular analysis of correlated genes by metabolomics and transcriptomics in sister line apple cultivars. Life 2022, 12, 1246. [Google Scholar] [CrossRef]
  30. Pirie, A.; Mullins, M.G. Changes in anthocyanin and phenolics content of grapevine leaf and fruit tissues treated with sucrose, nitrate, and abscisic acid. Plant Physiol. 1976, 58, 468–472. [Google Scholar] [CrossRef] [Green Version]
  31. Xu, H.; Zou, Q.; Yang, G.; Jiang, S.; Fang, H.; Wang, Y.; Zhang, J.; Zhang, Z.; Wang, N.; Chen, X. MdMYB6 regulates anthocyanin formation in apple both through direct inhibition of the biosynthesis pathway and through substrate removal. Hortic. Res. 2020, 7, 72. [Google Scholar] [CrossRef]
  32. Zhang, H.; Chen, J.; Peng, Z.; Shi, M.; Liu, X.; Wen, H.; Jiang, Y.; Cheng, Y.; Xu, J.; Zhang, H. Integrated transcriptomic and metabolomic analysis reveals a transcriptional regulation network for the biosynthesis of carotenoids and flavonoids in ’cara cara’ navel orange. BMC Plant Biol 2021, 21, 29. [Google Scholar] [CrossRef]
  33. Bolger, A.M.; Lohse, M.; Usadel, B. Trimmomatic: A flexible trimmer for illumina sequence data. Bioinformatics 2014, 30, 2114–2120. [Google Scholar] [CrossRef] [Green Version]
  34. Anders, S.; Pyl, P.T.; Huber, W. Htseq—A python framework to work with high-throughput sequencing data. Bioinformatics 2015, 31, 166–169. [Google Scholar] [CrossRef] [Green Version]
  35. Wei, T.; Simko, V. R Package “Corrplot”: Visualization of a Correlation Matrix, Version 0.84. 2017. Available online: https://github.com/taiyun/corrplot (accessed on 15 February 2022).
  36. Chen, C.; Chen, H.; He, Y.; Xia, R. TBtools, a toolkit for biologists integrating various biological data handling tools with a user-friendly interface. bioRxiv 2018, bioRxiv:289660. [Google Scholar]
  37. Langfelder, P.; Mehrabian, M.; Schadt, E.E.; Lusis, A.J.; Horvath, S. Weighted gene co-expression network analysis of adipose and liver reveals gene modules related to plasma HDL levels and containing candidate genes at loci identified in genome wide association studies. Am. Heart Assoc. 2008, 118, 327. [Google Scholar]
  38. Schmittgen, T.D.; Livak, K.J. Analyzing real-time PCR data by the comparative CT method. Nat. Protoc. 2008, 3, 1101–1108. [Google Scholar] [CrossRef] [PubMed]
  39. Franceschini, A.; Szklarczyk, D.; Frankild, S.; Kuhn, M.; Simonovic, M.; Roth, A.; Lin, J.; Minguez, P.; Bork, P.; Von Mering, C. String v9. 1: Protein-protein interaction networks, with increased coverage and integration. Nucleic Acids Res. 2012, 41, D808–D815. [Google Scholar] [CrossRef] [Green Version]
  40. Honda, C.; Moriya, S. Anthocyanin biosynthesis in apple fruit. Hortic. J. 2018, 87, 305–314. [Google Scholar] [CrossRef] [Green Version]
  41. Wu, B.H.; Cao, Y.G.; Guan, L.; Xin, H.P.; Li, J.H.; Li, S.H. Genome-wide transcriptional profiles of the berry skin of two red grape cultivars (Vitis vinifera) in which anthocyanin synthesis is sunlight-dependent or -independent. PLoS ONE 2014, 9, e105959. [Google Scholar] [CrossRef] [PubMed]
  42. Honda, C.; Kotoda, N.; Wada, M.; Kondo, S.; Kobayashi, S.; Soejima, J.; Zhang, Z.; Tsuda, T.; Moriguchi, T. Anthocyanin biosynthetic genes are coordinately expressed during red coloration in apple skin. Plant Physiol. Biochem. 2002, 40, 955–962. [Google Scholar] [CrossRef]
  43. Gleitz, J.; Seitz, H.U. Induction of chalcone synthase in cell suspension cultures of carrot (Daucus carota L. spp. Sativus) by ultraviolet light: Evidence for two different forms of chalcone synthase. Planta 1989, 179, 323–330. [Google Scholar] [PubMed]
  44. Lancaster, J.; Dougall, D.K. Regulation of skin color in apples. Crit. Rev. Plant Sci. 1992, 10, 487–502. [Google Scholar] [CrossRef]
  45. Xu, F.; Cao, S.; Shi, L.; Chen, W.; Su, X.; Yang, Z. Blue light irradiation affects anthocyanin content and enzyme activities involved in postharvest strawberry fruit. J. Agric. Food Chem. 2014, 62, 4778–4783. [Google Scholar] [CrossRef] [PubMed]
  46. Wang, Y.; Zhang, X.; Yang, S.; Yuan, Y. Lignin involvement in programmed changes in peach-fruit texture indicated by metabolite and transcriptome analyses. J. Agric. Food Chem. 2018, 66, 12627–12640. [Google Scholar] [CrossRef] [PubMed]
  47. Kim, M.H.; Cho, J.S.; Bae, E.K.; Choi, Y.I.; Eom, S.H.; Lim, Y.J.; Lee, H.; Park, E.J.; Ko, J.H. PtrMYB120 functions as a positive regulator of both anthocyanin and lignin biosynthetic pathway in a hybrid poplar. Tree Physiol. 2021, 41, 2409–2423. [Google Scholar] [CrossRef]
  48. Huang, L.N.; Wu, G.B.; Zhang, S.; Kuang, F.Y.; Chen, F.H. The identification and functional verification of the cinnamate 4-hydroxylase gene from wax apple fruit and its role in lignin biosynthesis during nitric oxide-delayed postharvest cottony softening. Postharvest Biol. Technol. 2019, 158, 110964. [Google Scholar] [CrossRef]
  49. Ring, L.; Yeh, S.Y.; Hucherig, S.; Hoffmann, T.; Blanco-Portales, R.; Fouche, M.; Villatoro, C.; Denoyes, B.; Monfort, A.; Caballero, J.L.; et al. Metabolic interaction between anthocyanin and lignin biosynthesis is associated with peroxidase FaPRX27 in strawberry fruit. Plant Physiol. 2013, 163, 43–60. [Google Scholar] [CrossRef] [Green Version]
  50. Li, Y.; Nie, P.; Zhang, H.; Wang, L.; Wang, H.; Zhang, L. Dynamic changes of anthocyanin accumulation and endogenous hormone contents in blueberry. J. Beijing For. Univ. 2017, 39, 64–71. [Google Scholar]
  51. Li, W.F.; Mao, J.; Yang, S.J.; Guo, Z.G.; Ma, Z.H.; Dawuda, M.M.; Zuo, C.W.; Chu, M.Y.; Chen, B.H. Anthocyanin accumulation correlates with hormones in the fruit skin of ‘red delicious’ and its four generation bud sport mutants. BMC Plant Biol. 2018, 18, 363. [Google Scholar] [CrossRef] [Green Version]
  52. Figueroa, N.E.; Gatica-Meléndez, C.; Figueroa, C.R. Ethylene application at the immature stage of fragaria chiloensis fruit represses the anthocyanin biosynthesis with a concomitant accumulation of lignin. Food Chem. 2021, 358, 129913. [Google Scholar] [CrossRef]
  53. Shen, X.; Zhao, K.; Liu, L.; Zhang, K.; Yuan, H.; Liao, X.; Wang, Q.; Guo, X.; Li, F.; Li, T. A role for PacMYBA in ABA-regulated anthocyanin biosynthesis in red-colored sweet cherry cv. Hong deng (Prunus avium L.). Plant Cell Physiol. 2014, 55, 862–880. [Google Scholar] [CrossRef]
  54. Cheng, J.; Yu, K.; Shi, Y.; Wang, J.; Duan, C. Transcription factor VviMYB86 oppositely regulates proanthocyanidin and anthocyanin biosynthesis in grape berries. Front. Plant Sci. 2021, 11, 2263. [Google Scholar] [CrossRef]
  55. Wei, X.; Ju, Y.; Ma, T.; Zhang, J.; Fang, Y.; Sun, X. New perspectives on the biosynthesis, transportation, astringency perception and detection methods of grape proanthocyanidins. Crit. Rev. Food Sci. Nutr. 2021, 61, 2372–2398. [Google Scholar] [CrossRef] [PubMed]
  56. Lin, R.; Wang, H. Two homologous ATP-binding cassette transporter proteins, AtMDR1 and AtPGP1, regulate Arabidopsis photomorphogenesis and root development by mediating polar auxin transport. Plant Physiol. 2005, 138, 949–964. [Google Scholar] [CrossRef] [PubMed] [Green Version]
  57. Ban, Y.; Honda, C.; Hatsuyama, Y.; Igarashi, M.; Bessho, H.; Moriguchi, T. Isolation and functional analysis of a MYB transcription factor gene that is a key regulator for the development of red coloration in apple skin. Plant Cell Physiol. 2007, 48, 958–970. [Google Scholar] [CrossRef]
  58. Espley, R.V.; Hellens, R.P.; Putterill, J.; Stevenson, D.E.; Kutty-Amma, S.; Allan, A.C. Red colouration in apple fruit is due to the activity of the MYB transcription factor, MdMYB10. Plant J. 2007, 49, 414–427. [Google Scholar] [CrossRef] [PubMed] [Green Version]
  59. Chagné, D.; Lin-Wang, K.; Espley, R.V.; Volz, R.K.; How, N.M.; Rouse, S.; Brendolise, C.; Carlisle, C.M.; Kumar, S.; De Silva, N. An ancient duplication of apple MYB transcription factors is responsible for novel red fruit-flesh phenotypes. Plant Physiol. 2013, 161, 225–239. [Google Scholar] [CrossRef] [PubMed] [Green Version]
  60. An, X.H.; Tian, Y.; Chen, K.Q.; Liu, X.J.; Liu, D.D.; Xie, X.B.; Cheng, C.G.; Cong, P.H.; Hao, Y.J. MdMYB9 and MdMYB11 are involved in the regulation of the JA-induced biosynthesis of anthocyanin and proanthocyanidin in apples. Plant Cell Physiol. 2015, 56, 650–662. [Google Scholar] [CrossRef] [PubMed] [Green Version]
  61. Sun, C.; Wang, C.; Zhang, W.; Liu, S.; Wang, W.; Yu, X.; Song, T.; Yu, M.; Yu, W.; Qu, S. The R2R3-type MYB transcription factor MdMYB90-like is responsible for the enhanced skin color of an apple bud sport mutant. Hortic. Res. 2021, 8, 156. [Google Scholar] [CrossRef]
  62. Xu, H.; Wang, N.; Liu, J.; Qu, C.; Wang, Y.; Jiang, S.; Lu, N.; Wang, D.; Zhang, Z.; Chen, X. The molecular mechanism underlying anthocyanin metabolism in apple using the MdMYB16 and MdbHLH33 genes. Plant Mol. Biol. 2017, 94, 149–165. [Google Scholar] [CrossRef]
  63. Wang, S.; Zhang, Z.; Li, L.X.; Wang, H.B.; Zhou, H.; Chen, X.S.; Feng, S.Q. Apple MdMYB306-like inhibits anthocyanin synthesis by directly interacting with MdMYB17 and MdbHLH33. Plant J. Cell Mol. Biol. 2022, 110, 1021–1034. [Google Scholar] [CrossRef]
Figure 1. Apple appearance and anthocyanin content. (A) Apple phenotypes. (B) Total anthocyanin content. YS and YR represent Huashuo and Huarui apples in the high-altitude orchard, respectively; HS and HR represent Huashuo and Huarui apples in the low-altitude orchard, respectively. Lowercase letters indicate significant differences at p < 0.05.
Horticulturae 09 00475 g001
Figure 2. Heat map of anthocyanin content measured in each sample. YS and YR represent Huashuo and Huarui apples in the high-altitude orchard, respectively; HS and HR represent Huashuo and Huarui apples in the low-altitude orchard, respectively. YS1, YS2, YS3, and YS4 represent the four color transition periods of YS. The same rationale was applied to the other samples. The sample from each period consisted of three repetitions (e.g., YS1-1, YS1-2, and YS1-3).
Horticulturae 09 00475 g002
Figure 3. WGCNA analysis of gene expression levels and anthocyanin content. Different module colors represent the correlation between the genes of the module and anthocyanins. The brighter the red (value closer to 1), the higher the positive correlation, while the brighter the blue (value closer to −1), the higher the negative correlation. The number in brackets represents significance (p-value); the smaller the value, the stronger the significance. The horizontal axis represents the types of anthocyanins.
Horticulturae 09 00475 g003
Figure 4. Overview of phenylpropanoid pathway modulation and the expression levels of genes with correlation coefficients with anthocyanin accumulation > 0.7. (A) Genes related to the phenylpropanoid pathway. The content in the dashed box represents speculation. (B) Heat map of structure gene expression levels. Different colors represent the expression level of downregulated or upregulated genes under treatments standardized with log10. The asterisk (*) indicates that the expression level of this transcript is significantly higher in YS and YR than in HS and HR.
Horticulturae 09 00475 g004
Figure 5. Interaction network analysis for key TFs. (AD) Sequential representation of the interaction network of four TFs (MYB1, MYB-related 306-like, MYB1R1, MYB1R1-like).
Horticulturae 09 00475 g005
Figure 6. Verification of the expression of candidate structural genes and TFs at different altitudes using qRT-PCR. YS and YR represent Huashuo and Huarui apples, respectively, in the high-altitude orchard; HS and HR represent Huashuo and Huarui apples, respectively, in the low-altitude orchard. YS1, YS2, YS3, and YS4 represent the four color transition periods of YS, and the same rationale was applied to the other samples. Different lowercase letters on the error bar in each graph indicate a significant difference at p < 0.05 according to Duncan’s multiple range test.
Horticulturae 09 00475 g006
Disclaimer/Publisher’s Note: The statements, opinions and data contained in all publications are solely those of the individual author(s) and contributor(s) and not of MDPI and/or the editor(s). MDPI and/or the editor(s) disclaim responsibility for any injury to people or property resulting from any ideas, methods, instructions or products referred to in the content.

