Article

Genetic Diversity and Population Structure Analysis of Hollyhock (Alcea rosea Cavan) Using High-Throughput Sequencing

1
Key Laboratory for Quality Regulation of Tropical Horticultural Crops of Hainan Province, Sanya Nanfan Research Institute of Hainan University, School of Horticulture, Hainan University, Haikou 570228, China
2
Guangdong Laboratory of Lingnan Modern Agriculture, Genome Analysis Laboratory of the Ministry of Agriculture and Rural Affairs, Agricultural Genomics Institute at Shenzhen, Chinese Academy of Agricultural Sciences, Shenzhen 518120, China
3
BGI-Shenzhen, Shenzhen 518083, China
4
China National GeneBank, BGI-Shenzhen, Shenzhen 518120, China
*
Authors to whom correspondence should be addressed.
Horticulturae 2023, 9(6), 662; https://doi.org/10.3390/horticulturae9060662
Submission received: 12 April 2023 / Revised: 20 May 2023 / Accepted: 31 May 2023 / Published: 3 June 2023
(This article belongs to the Section Genetics, Genomics, Breeding, and Biotechnology (G2B2))

Abstract

:
Hollyhock (Alcea rosea (Linn). Cavan) is an herbaceous flowering plant with significant applications in urban greening, soil remediation, and traditional medicine. However, its genetic diversity and molecular characteristics at the population level have not been explored yet. Here, the phenotypic and genetic diversity of 162 hollyhock accessions from China revealed extensive variation among 11 traits and strong correlations between several quantitative traits. Whole-genome re-sequencing of 32 randomly chosen accessions identified 10,468,760 core single-nucleotide polymorphisms (SNPs) distributed evenly across the genome, except for on chromosome 21, and the average nucleotide diversity (π) was calculated to be 0.00397. Principal component analysis showed that these 32 accessions could be divided into four subpopulations, which was in agreement with the population structure analysis, and the subpopulations were strongly correlated with geographic location. A neighbor-joining dendrogram displayed similar clusters, except for accessions HuB25 and HLJ28, which formed two separate clusters. Our findings illuminate the genetic diversity in hollyhock and provide valuable information for hollyhock breeding.

1. Introduction

Hollyhock (Alcea rosea (Linn). Cavan) is an annual or perennial herbaceous ornamental plant that originated from the Sichuan Province in southwestern China [1,2]. It has large leaves and richly colored patterns in flowers similar to hibiscus (Hibiscus spp.) [3]. Hollyhock performs best in growth under full sun in fertile soil and may tolerate light shade but not wet soil [4]. Due to its strong adaptation to drought, cold, and saline environments, hollyhock was one of the earliest flowers introduced into the West from China and is now used as a landscape plant in tropical and warm temperate regions around the world [2]. In ancient China, hollyhock was depicted in murals in the Mogao caves and appears in ancient Buddhist paintings as well [5,6].
Hollyhock can be used in a wide range of industries. For example, pigments extracted from its leaves and flowers are used to dye silk, cotton, and leather [7] and serve as natural food additives in jam, jelly, and sausage products [2]. Hollyhock stems are fibrous and used in papermaking [4]. In traditional Chinese medicine, hollyhock flowers, roots, and seeds are used as antiurolithiatic [8], antimicrobial [9], hemostatic [10], detoxification, and anti-inflammatory agents [2,11]. In agriculture, due to its ability to tolerate and accumulate heavy metals [12,13,14], hollyhock has been used for phytoremediation of cadmium-contaminated soils [1]. Furthermore, hollyhock is used in urban landscaping due to its attractive flowers [15]. Despite its economic, commercial, and aesthetic importance, hollyhock breeding and improvement have significantly lagged behind those of other ornamental plants, such as roses (Rosa × hybrida L.) [16], lilies (Lilium spp.), and tulips (Tulipa gesneriana L.) [17,18,19].
Germplasm resources, including local accessions, bred varieties, wild relatives, artificially created mutants, and near-isogenic lines [20], have played a fundamental role in developing new varieties and crop improvement [21,22,23]. Currently, hollyhock research has focused predominantly on identifying and characterizing its medicinal components and the mechanisms underlying its abiotic stress tolerance [14,24]. However, little is known about the genetic diversity of hollyhock germplasm resources, although understanding this diversity is important for developing new cultivars and conserving germplasm resources. In this study, we investigated phenotypic variation among 11 traits of a hollyhock population and analyzed their genetic structures using high-coverage whole-genome re-sequencing data. Our results provide valuable information for fundamental studies of hollyhock germplasm resources and breeding.

2. Materials and Methods

2.1. Plant Materials

A total of 162 hollyhock (Alcea rosea (Linn). Cavan) accessions were collected from seven provinces in China by the Germplasm Bank of Wild Species (Kunming, China): Jiangsu (JS, 31°56′ N, 119°19′ E), Sichuan (SC, 31°40′ N, 103°51′ E), Hunan (HN, 28°14′ N, 112°55′ E), Shandong (SD, 36°33′ N, 116°44′ E), Hebei (HeB, 38°15′ N, 114°11′ E), Hubei (HuB, 32°19′ N, 109°42′ E), and Heilongjiang (HLJ, 45°12′ N, 127°57′ E) (Figure 1). These accessions were grown at the experimental field of the Agricultural Genomics Institute at Shenzhen, Chinese Academy of Agricultural Sciences, from 2021 to 2022.

2.2. Analysis of Phenotypic Traits

Phenotypic traits were analyzed in April 2022. Six qualitative (petal color, flower type, petal margin, flower center color, petal structure, and leaf shape) and five quantitative (plant height, internode length, petal length, petal width, and corolla diameter) traits were evaluated. Plant height and internode length were recorded at the maturity stage, and the remaining traits were documented at the full-bloom stage. For each of the qualitative traits, numbers from 1 to 5 were used to describe the grading of the specific traits (Table 1). R scripts and Excel were used to calculate the variation parameters, such as maximum, minimum, mean, standard deviation (S.D.), coefficient of variation (C.V.), and Shannon diversity index (H′ = −∑ Pi ln Pi). The phenotypic variation distributions of five quantitative traits and the Pearson’s correlation coefficients were calculated with the R package GGally v2.1.2.

2.3. DNA Extraction, Sequencing, and SNP Genotyping

A subset of 32 accessions from seven provinces of China were randomly selected to have their genetic structure analyzed. The total genomic DNA of each sample was isolated from young leaves using a cetyltrimethylammonium bromide (CTAB)-based method [25]. The DNA purity and quality were checked with 1% (w/v) agarose gel and a Nanodrop 2000 spectrophotometer (Thermo Scientific, Waltham, MA, USA), and the concentration was measured using a Qubit 4.0 fluorometer (Invitrogen, New York, NY, USA). Whole-genome re-sequencing libraries were prepared with Tn5 transposase complexes according to the manufacturer’s protocol (Vazyme, Nanjing, China, Cat. TD502) and sequenced on a DNBSEQ-T1 system as paired-end 150 bp reads.
After obtaining of the sequencing data, FastQC v0.11.9 software was first used to check the quality of the reads (https://www.bioinformatics.babraham.ac.uk/projects/fastqc/ (accessed on 20 November 2022)), followed by filtering of the low-quality reads to obtain clean data according to the quality-filtering parameters reported previously [26]. Then, the high-quality clean reads were mapped to the hollyhock reference genome (unpublished) using the Burrows-Wheeler Aligner v0.7.17 (BWA-mem) [27] with default parameters. PCR duplicates were removed with Picard tools v2.27.4 (http://broadinstitute.github.io/picard/ (accessed on 27 November 2022)), and a merged VCF file comprising all 32 samples was obtained by successively employing the HaplotypeCaller, CombineGVCFs, and GenotypeGVCFs modules embedded in the GATK v4.2.6.1 software [28]. Subsequently, low-quality SNPs meeting the following parameters were filtered out using GATK and VCFtools v0.1.16 [29]: QD < 2.0 || MQ < 40.0 || FS > 60.0 || SOR > 3.0 || MQRankSum < –12.5 || ReadPosRankSum < –8.0. Finally, a core SNP set was obtained using the following strict filter parameters: (1) minor allele frequency (MAF) ≥ 0.05 and (2) missing data ratio <20%. The resulting high-quality SNPs were used for subsequent analysis.

2.4. Genetic Diversity and Population Structure Analysis

The genetic diversity of the 32 hollyhock accessions was analyzed using the core SNP set by calculating nucleotide diversity. The nucleotide diversity was defined as the average number of nucleotide differences per site between two randomly chosen sequences from a population and evaluated as the π value [30], which was calculated with VCFtools v0.1.16 software [29].
The VCF file with the core SNP set of 32 hollyhock accessions was used as the input file, and a pairwise distance matrix was calculated using the software VCF2Dis v1.47 (https://github.com/BGI-shenzhen/VCF2Di (accessed on 15 January 2023)) with the default parameters. The distance matrix was then used as input of FastMe v2.1.6.4 [31] to generate an unrooted neighbor-joining phylogenetic tree with Felsenstein’s bootstrap resampling approach [32]. The exported phylogenetic tree was optimized with the online tool iTOL v6.6 (https://itol.embl.de/ (accessed on 15 January 2023)). After format transformation with VCFtools v0.1.16 [29], principal component analysis (PCA) was performed with PLINK v1.9 software [33] and the first two eigenvectors were plotted in two dimensions. To further understand the genetic compositions of these accessions, population structure analysis was performed using ADMIXTURE v1.3 [34] with the cross-validation procedure for K = 2 to 10. The subpopulation number was determined with the lowest cross-validation error. Additionally, statistics of genetic variation among these subpopulations, such as unbiased expected heterozygosity, observed heterozygosity, and MAF, were mainly calculated with the PLINK v1.9 software [33].

3. Results

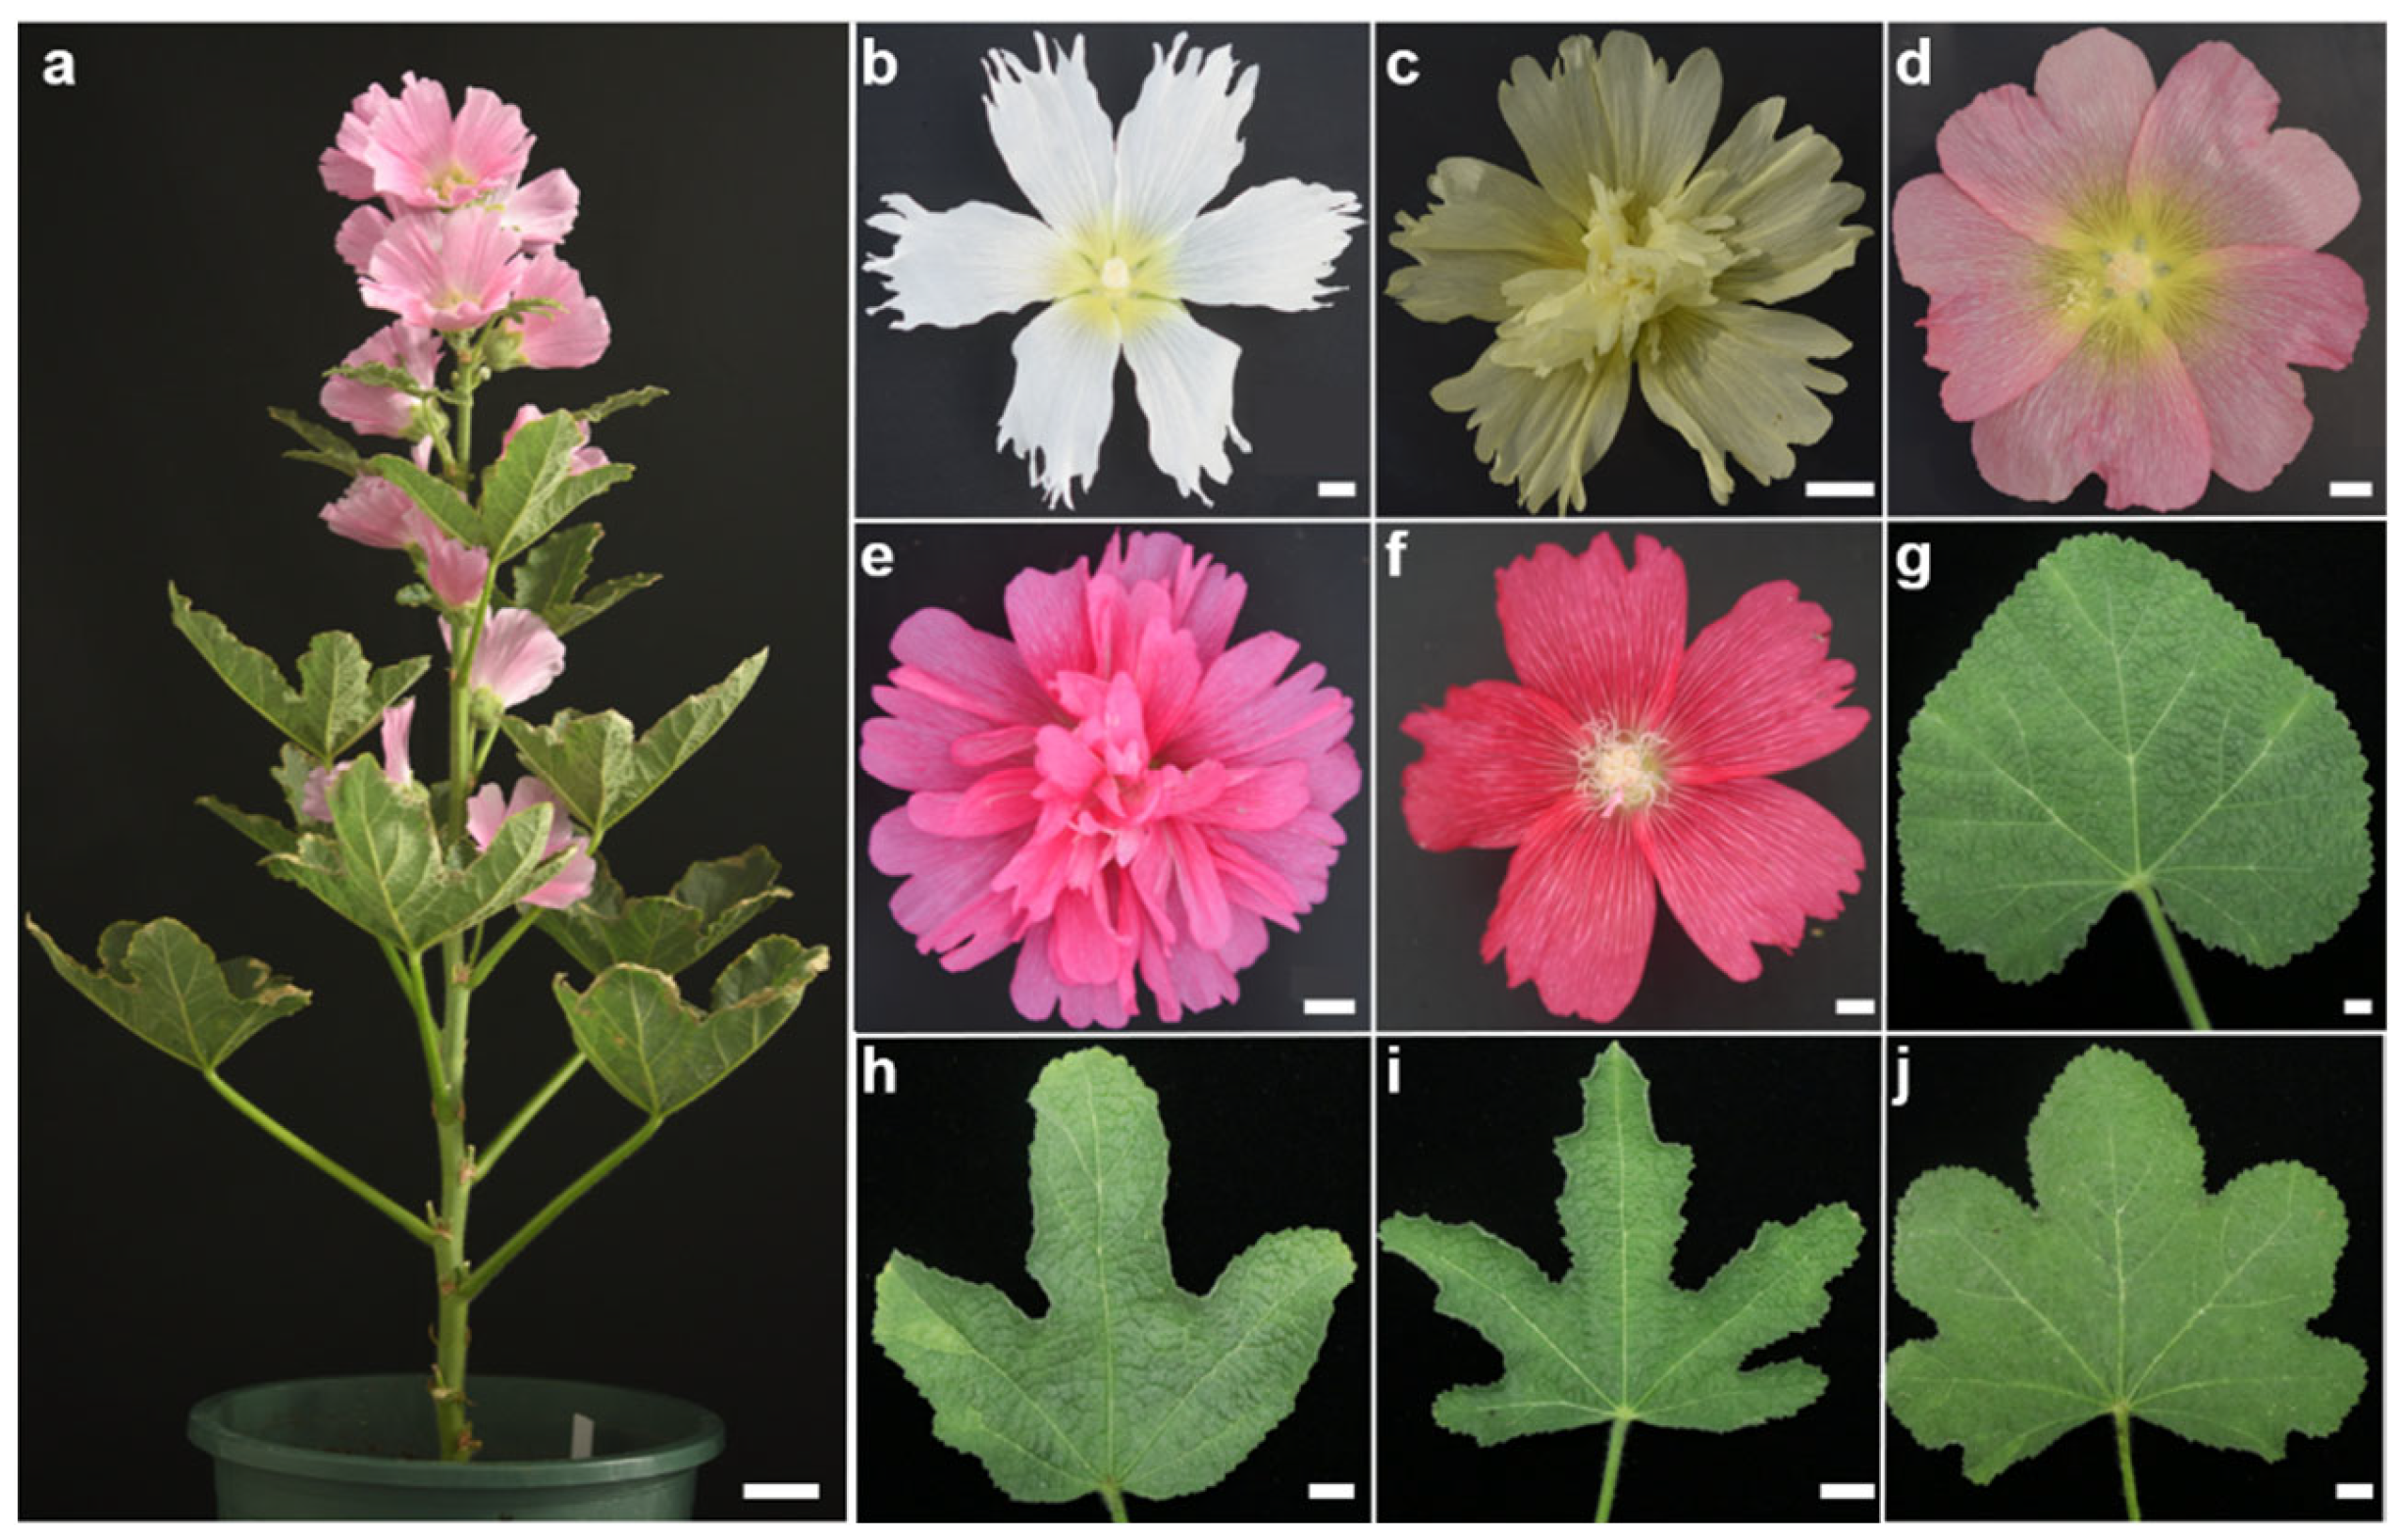
3.1. Phenotypic Variations of Six Qualitative Traits

We investigated the phenotypic variations of six qualitative traits (petal color, flower type, petal margin, flower center color, petal structure, and leaf shape) in a hollyhock population comprising 162 accessions collected from seven provinces of China (Figure 1 and Figure 2). We recorded five types of petal color: crimson (31.5% of the population), pink (29.6%), white (22.2%), red (11.1%), and yellow (5.6%) (Table 1 and Table 2). We identified two flower types (single flowers and double flowers), with roughly equal proportions in the population, and three kinds of petal margins: multilobed (43.8%), bilobed (29.0%), and serrated (27.2%). We observed three types of color at the center of each flower: yellow (67.9%), red (27.8%), and white (4.3%). There were two types of petal structure, fused (80.9%) and unfused (19.1%), and four types of leaf shape: palmate bifurcate (52.5%), palmate trifurcate (40.1%), cordate (3.1%), and palmate trilobed (4.3%). Among these six qualitative traits, an analysis of the Shannon diversity index (H′) revealed that the largest morphological variation was observed in petal color, while flower type and petal structure showed the least variation (Table 2).

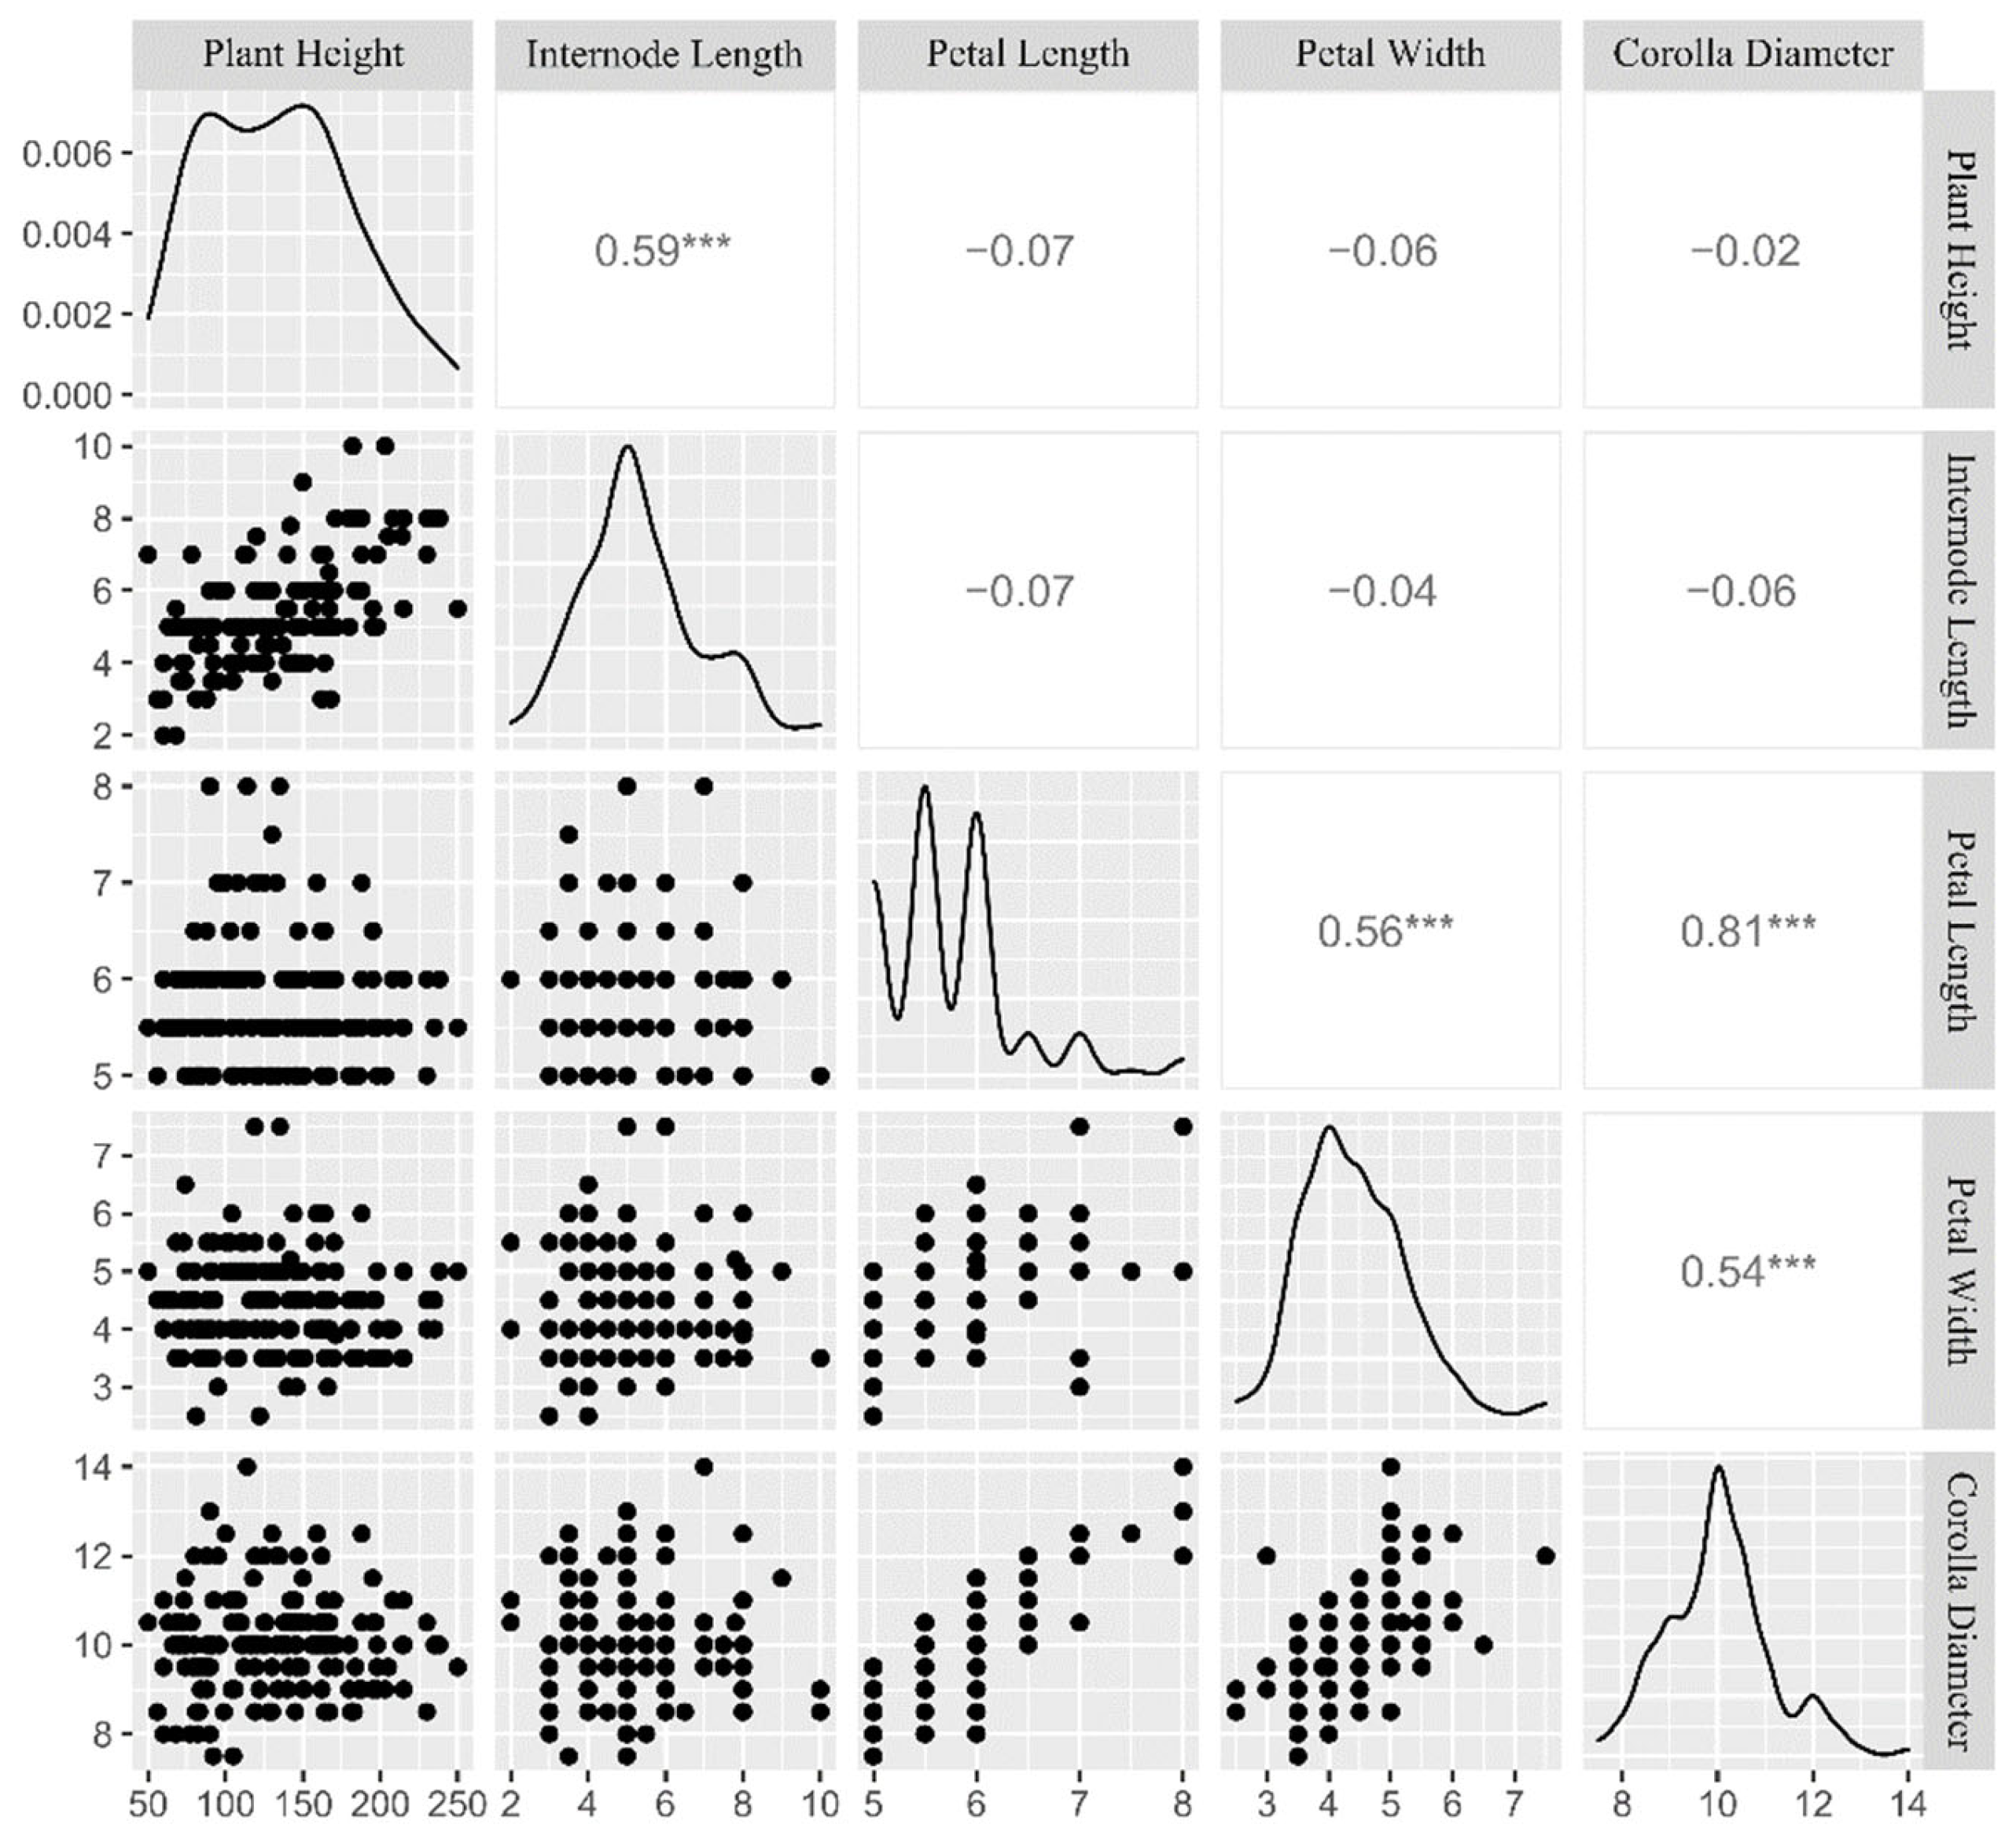
3.2. Phenotypic Variation and Correlation Analyses among Five Quantitative Traits

We evaluated five quantitative traits (plant height, internode length, petal length, petal width, and corolla diameter) in the 162 accessions, all of which showed strong variation. The average plant height was 130.3 ± 49.7 cm (mean ± standard deviation (S.D.)) and ranged from 30.0 to 250.1 cm (Figure 3 and Table 3). The average internode length was 5.3 ± 1.5 cm and ranged from 2.1 to 10.0 cm. Petal length showed the least variation, ranging from 5.0 to 8.0 cm with a mean length of 5.7 ± 0.6 cm. Petal width ranged from 2.5 to 7.6 cm, with a mean of 4.4 ± 0.8 cm. The average corolla diameter was 10.0 ± 1.1 cm and ranged from 7.5 to 14.0 cm. Of these five quantitative traits, plant height displayed the strongest variation, as demonstrated by the C.V. (38.2%) and the Shannon diversity index (H′ = 2.18), followed by internode length and petal width, which had similar Shannon indices, while petal length and corolla diameter showed minimum variation (Table 3).
We assessed the relationships among these quantitative traits by calculating their Pearson’s correlation coefficients. This analysis detected the most significant positive correlation between corolla diameter and petal length (r = 0.81), followed by internode length and plant height (r = 0.59), petal length and width (r = 0.56), and corolla diameter and petal width (r = 0.54). We observed few weak negative correlations, such as petal length and internode length (r = −0.07), although this correlation was not significant (Figure 3).

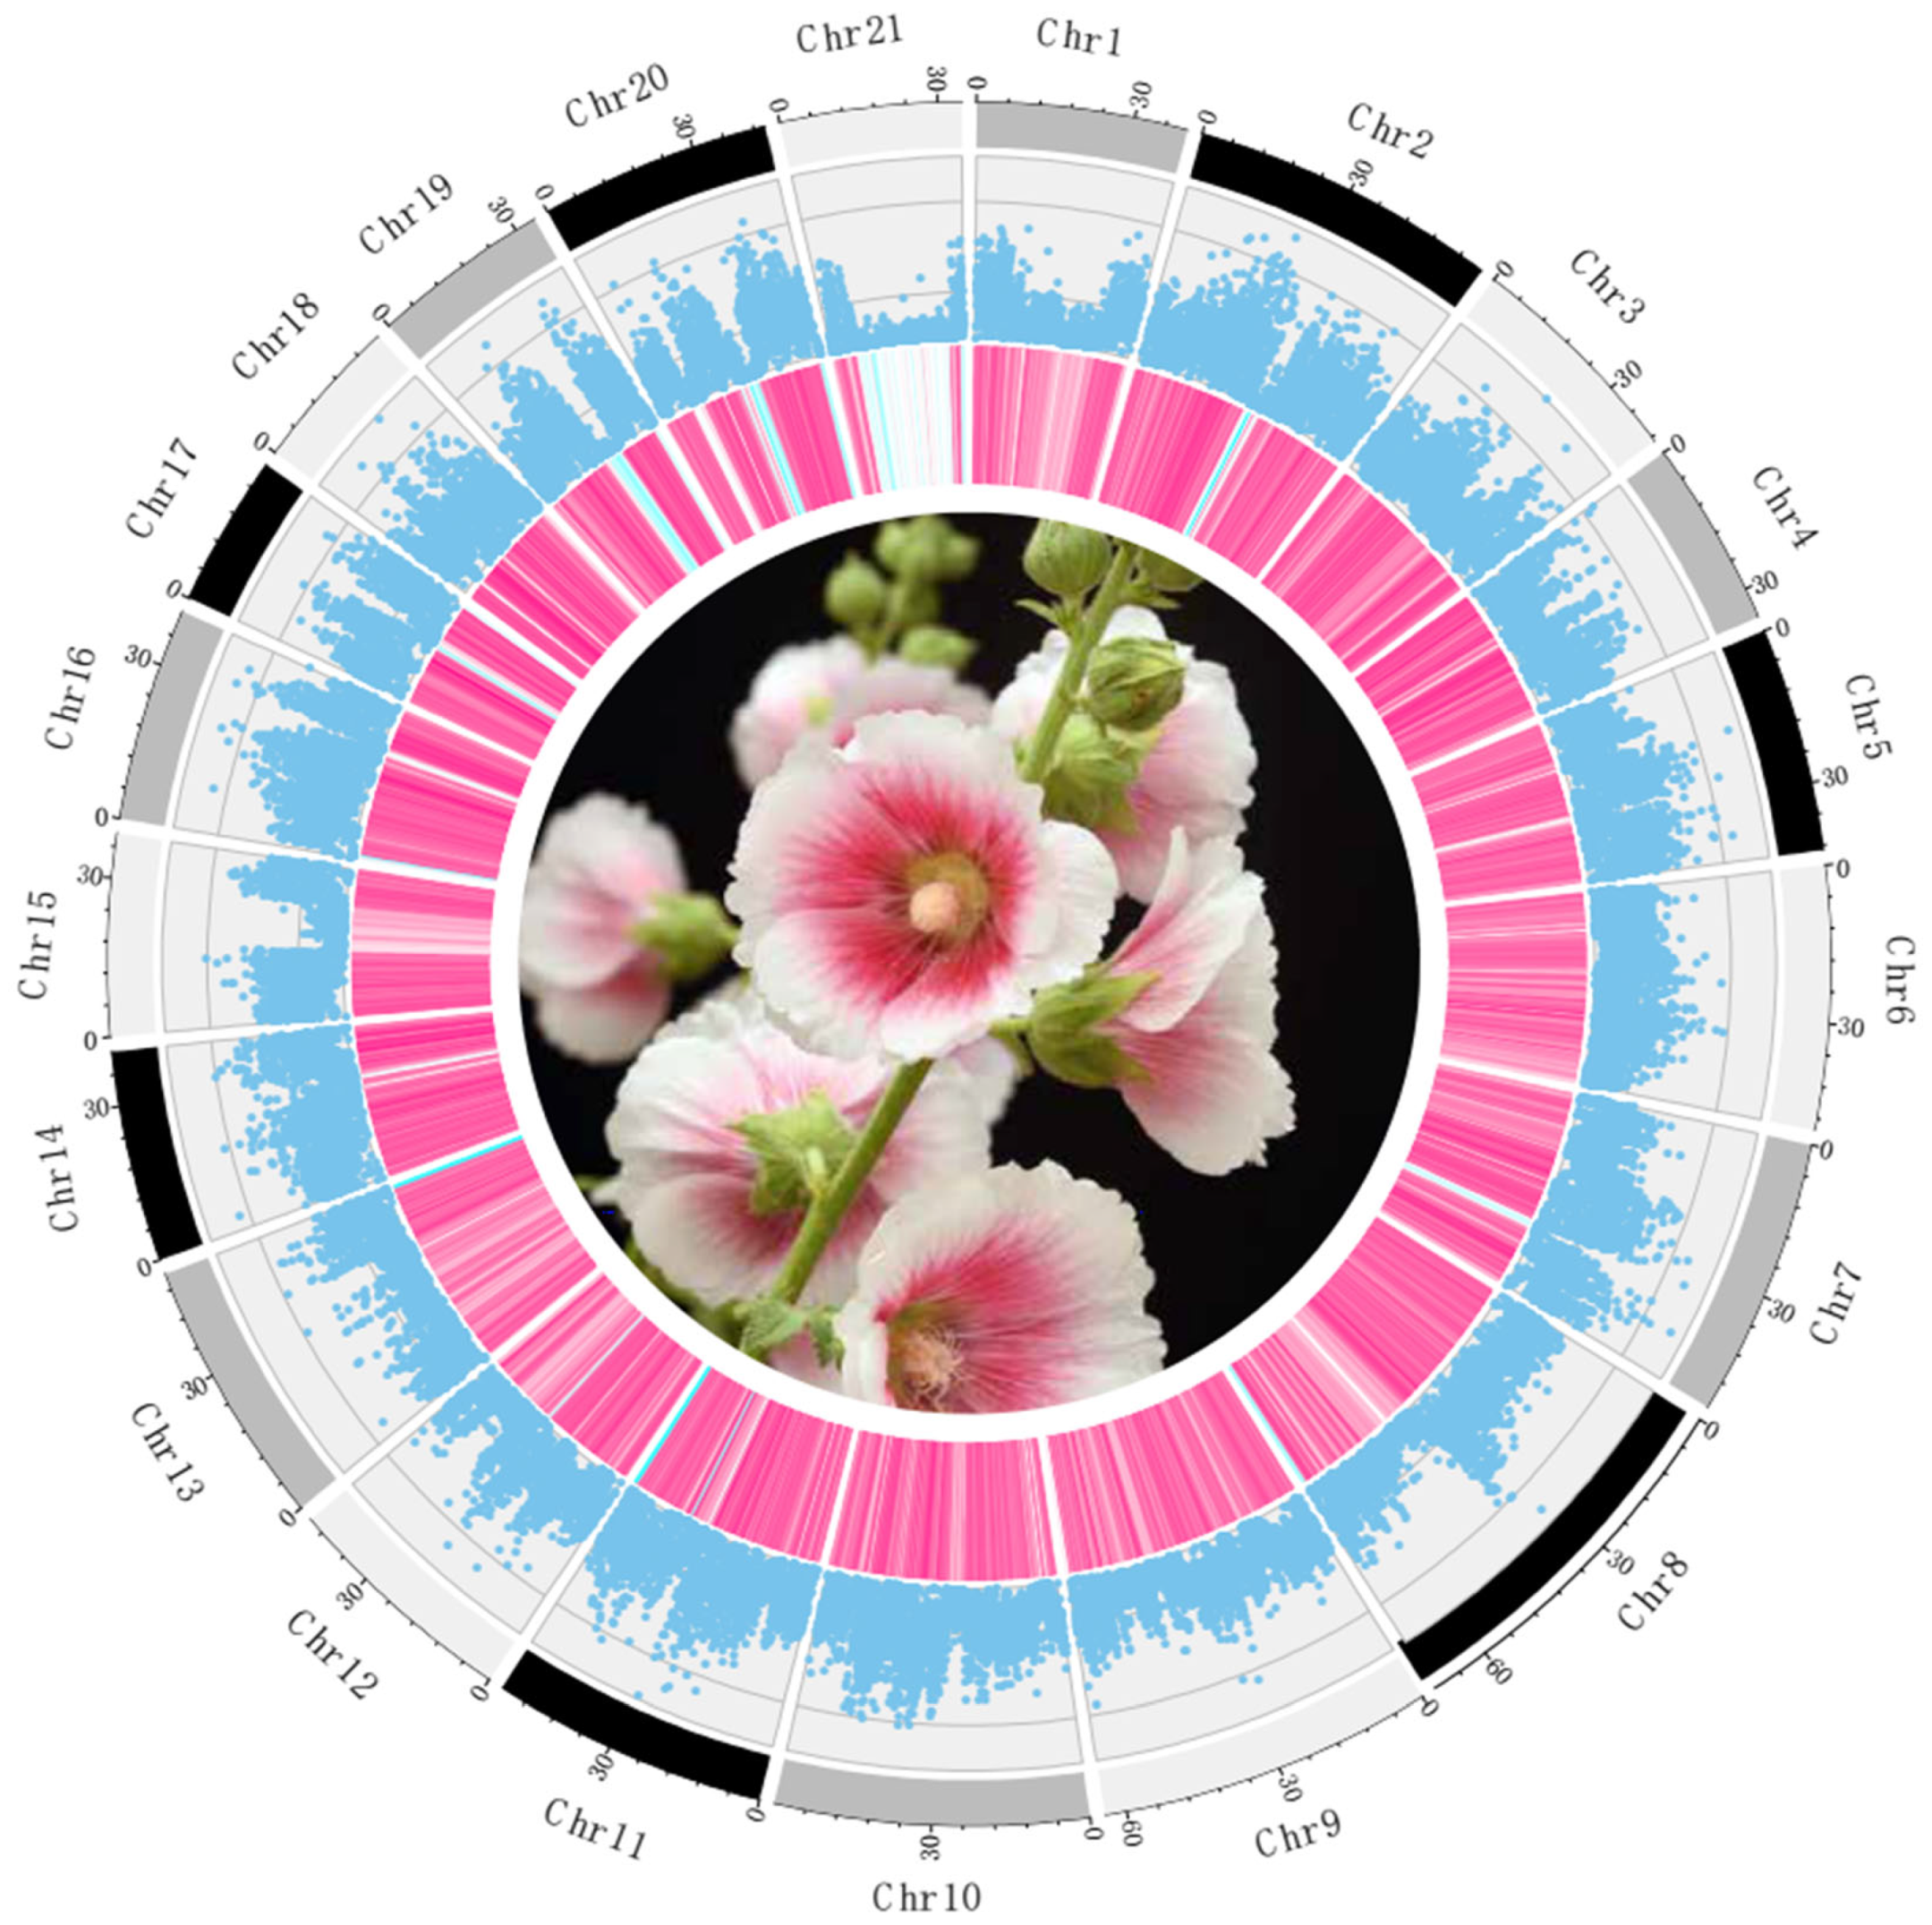
3.3. Single-Nucleotide Polymorphism Detection and Nucleotide Diversity

We totally obtained 1111.68 Gb of re-sequencing data for 32 randomly chosen accessions out of the initial list of 162, ranging from 17.50 Gb (~17.43×) for accession JS79 to 55.64 Gb (~55.43×) for accession JS65, with an average of 35.9 Gb (Table S1). When we aligned the clean sequencing reads to the hollyhock reference genome, we obtained good genome coverage (86.9–98.35%) for each sample (Supplementary Table S1) and further identified 32,112,622 single-nucleotide polymorphisms (SNPs) that were distributed across all 21 chromosomes in these samples. After applying filter steps for the MAF and the missing data ratio, we finally obtained a core set of 10,468,760 SNPs with a density of 1 SNP per 90 bp for follow-up analyses. Chromosome 8 harbored the most SNPs, while chromosome 21 contained the fewest (Table S2). Except for on chromosome 21, these SNP markers were distributed evenly across the remaining 20 chromosomes, with telomeric regions tending to have more SNPs than centromeric regions (Figure 4).
Nucleotide diversity (π) is a commonly used index to measure the nucleotide diversity within a population [30]. Using our core SNP set, we calculated the π value across the whole genome, and the mean values ranged from 0.00133 on chromosome 21 to 0.00489 on chromosome 17 (Figure 4 and Table S3). In general, π varied slightly along the chromosomes, except for on chromosome 21, which showed high nucleotide diversity on the telomeric ends of the chromosome but low diversity in the middle regions.

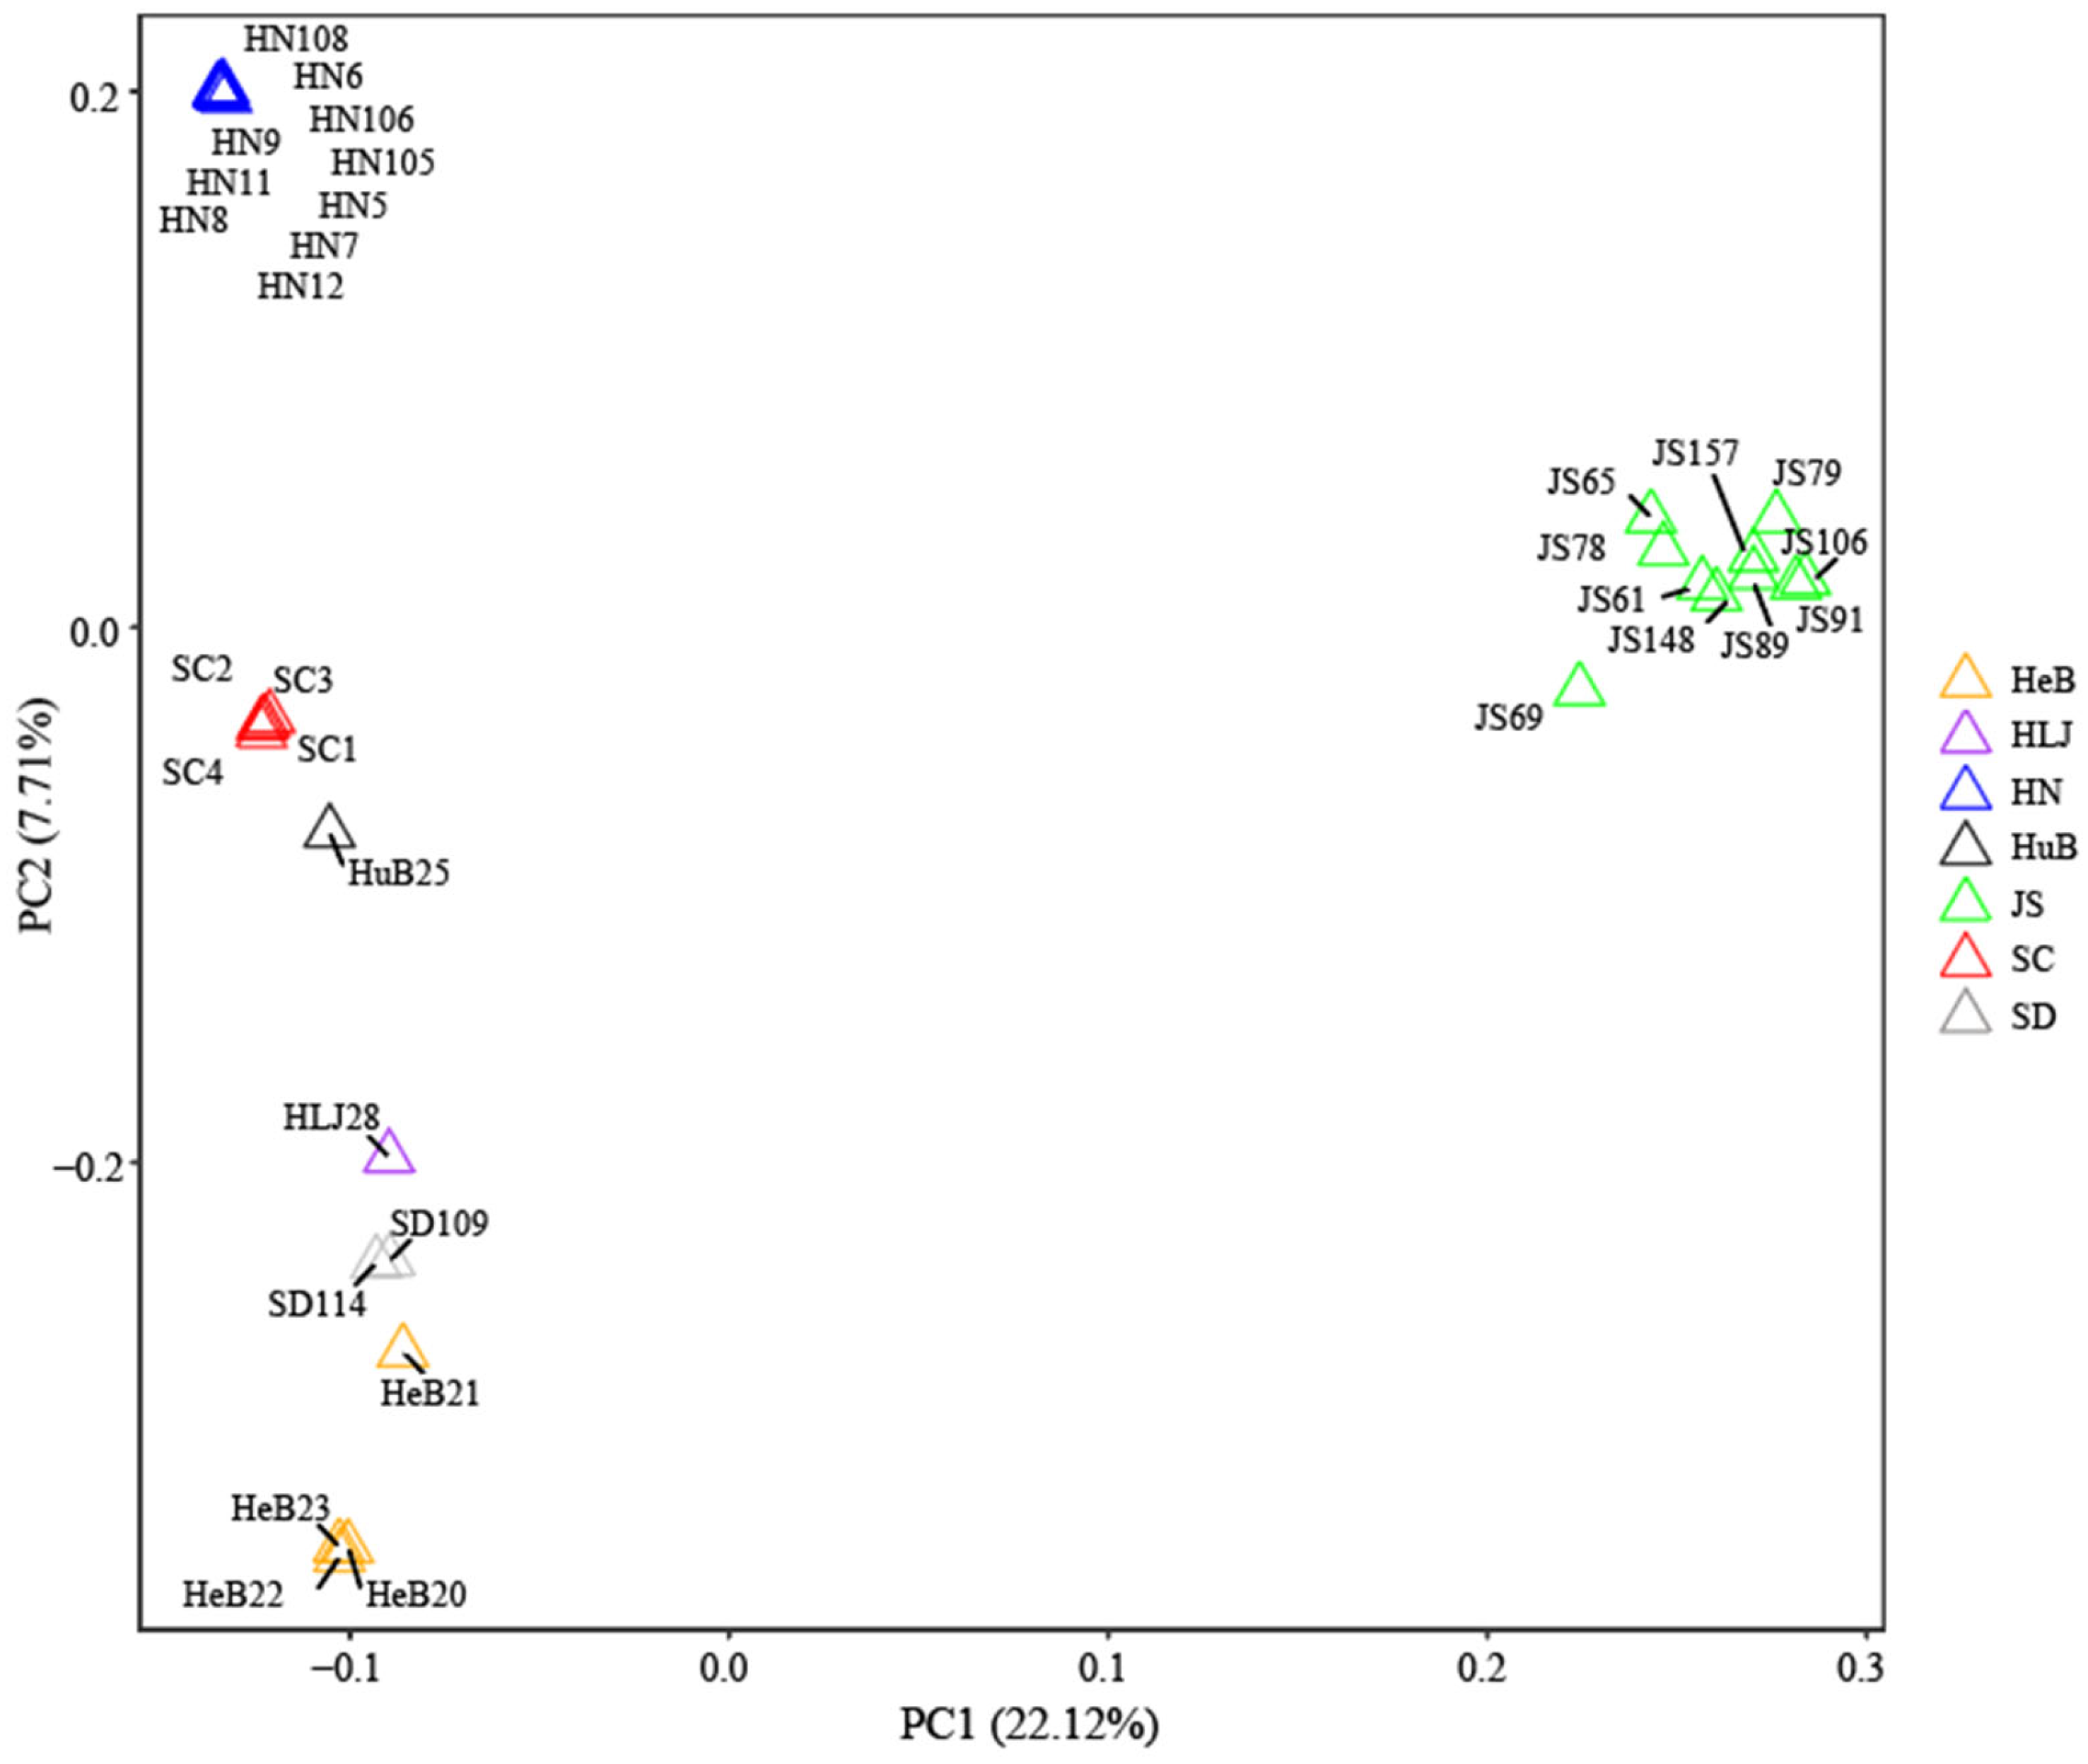
3.4. Principal Component Analysis of Hollyhock Accessions

To explore the relationships of the 32 re-sequenced hollyhock accessions collected from seven provinces of China, we conducted a principal component analysis (PCA) using the genome-wide core SNP set defined above. The first two principal components (PCs) explained the largest portion (29.8%) of the total variation (Figure 5). Specifically, PC1 accounted for 22.1% of the standing variation, separating the Jiangsu accessions from the others. PC2 explained 7.7% of the variation and clearly classified the remaining accessions into three groups. In general, accessions collected from the same location, such as the Hunan, Sichuan, Shandong, and Jiangsu provinces, were tightly clustered into one subgroup, indicating that these clustered accessions had similar genetic compositions. The accessions from the seven locations displayed significant divergence, especially the Hunan and Jiangsu samples, which occupied the upper left corner and the right side of the PCA plot, respectively, with no overlap with the other subgroups (Figure 5).

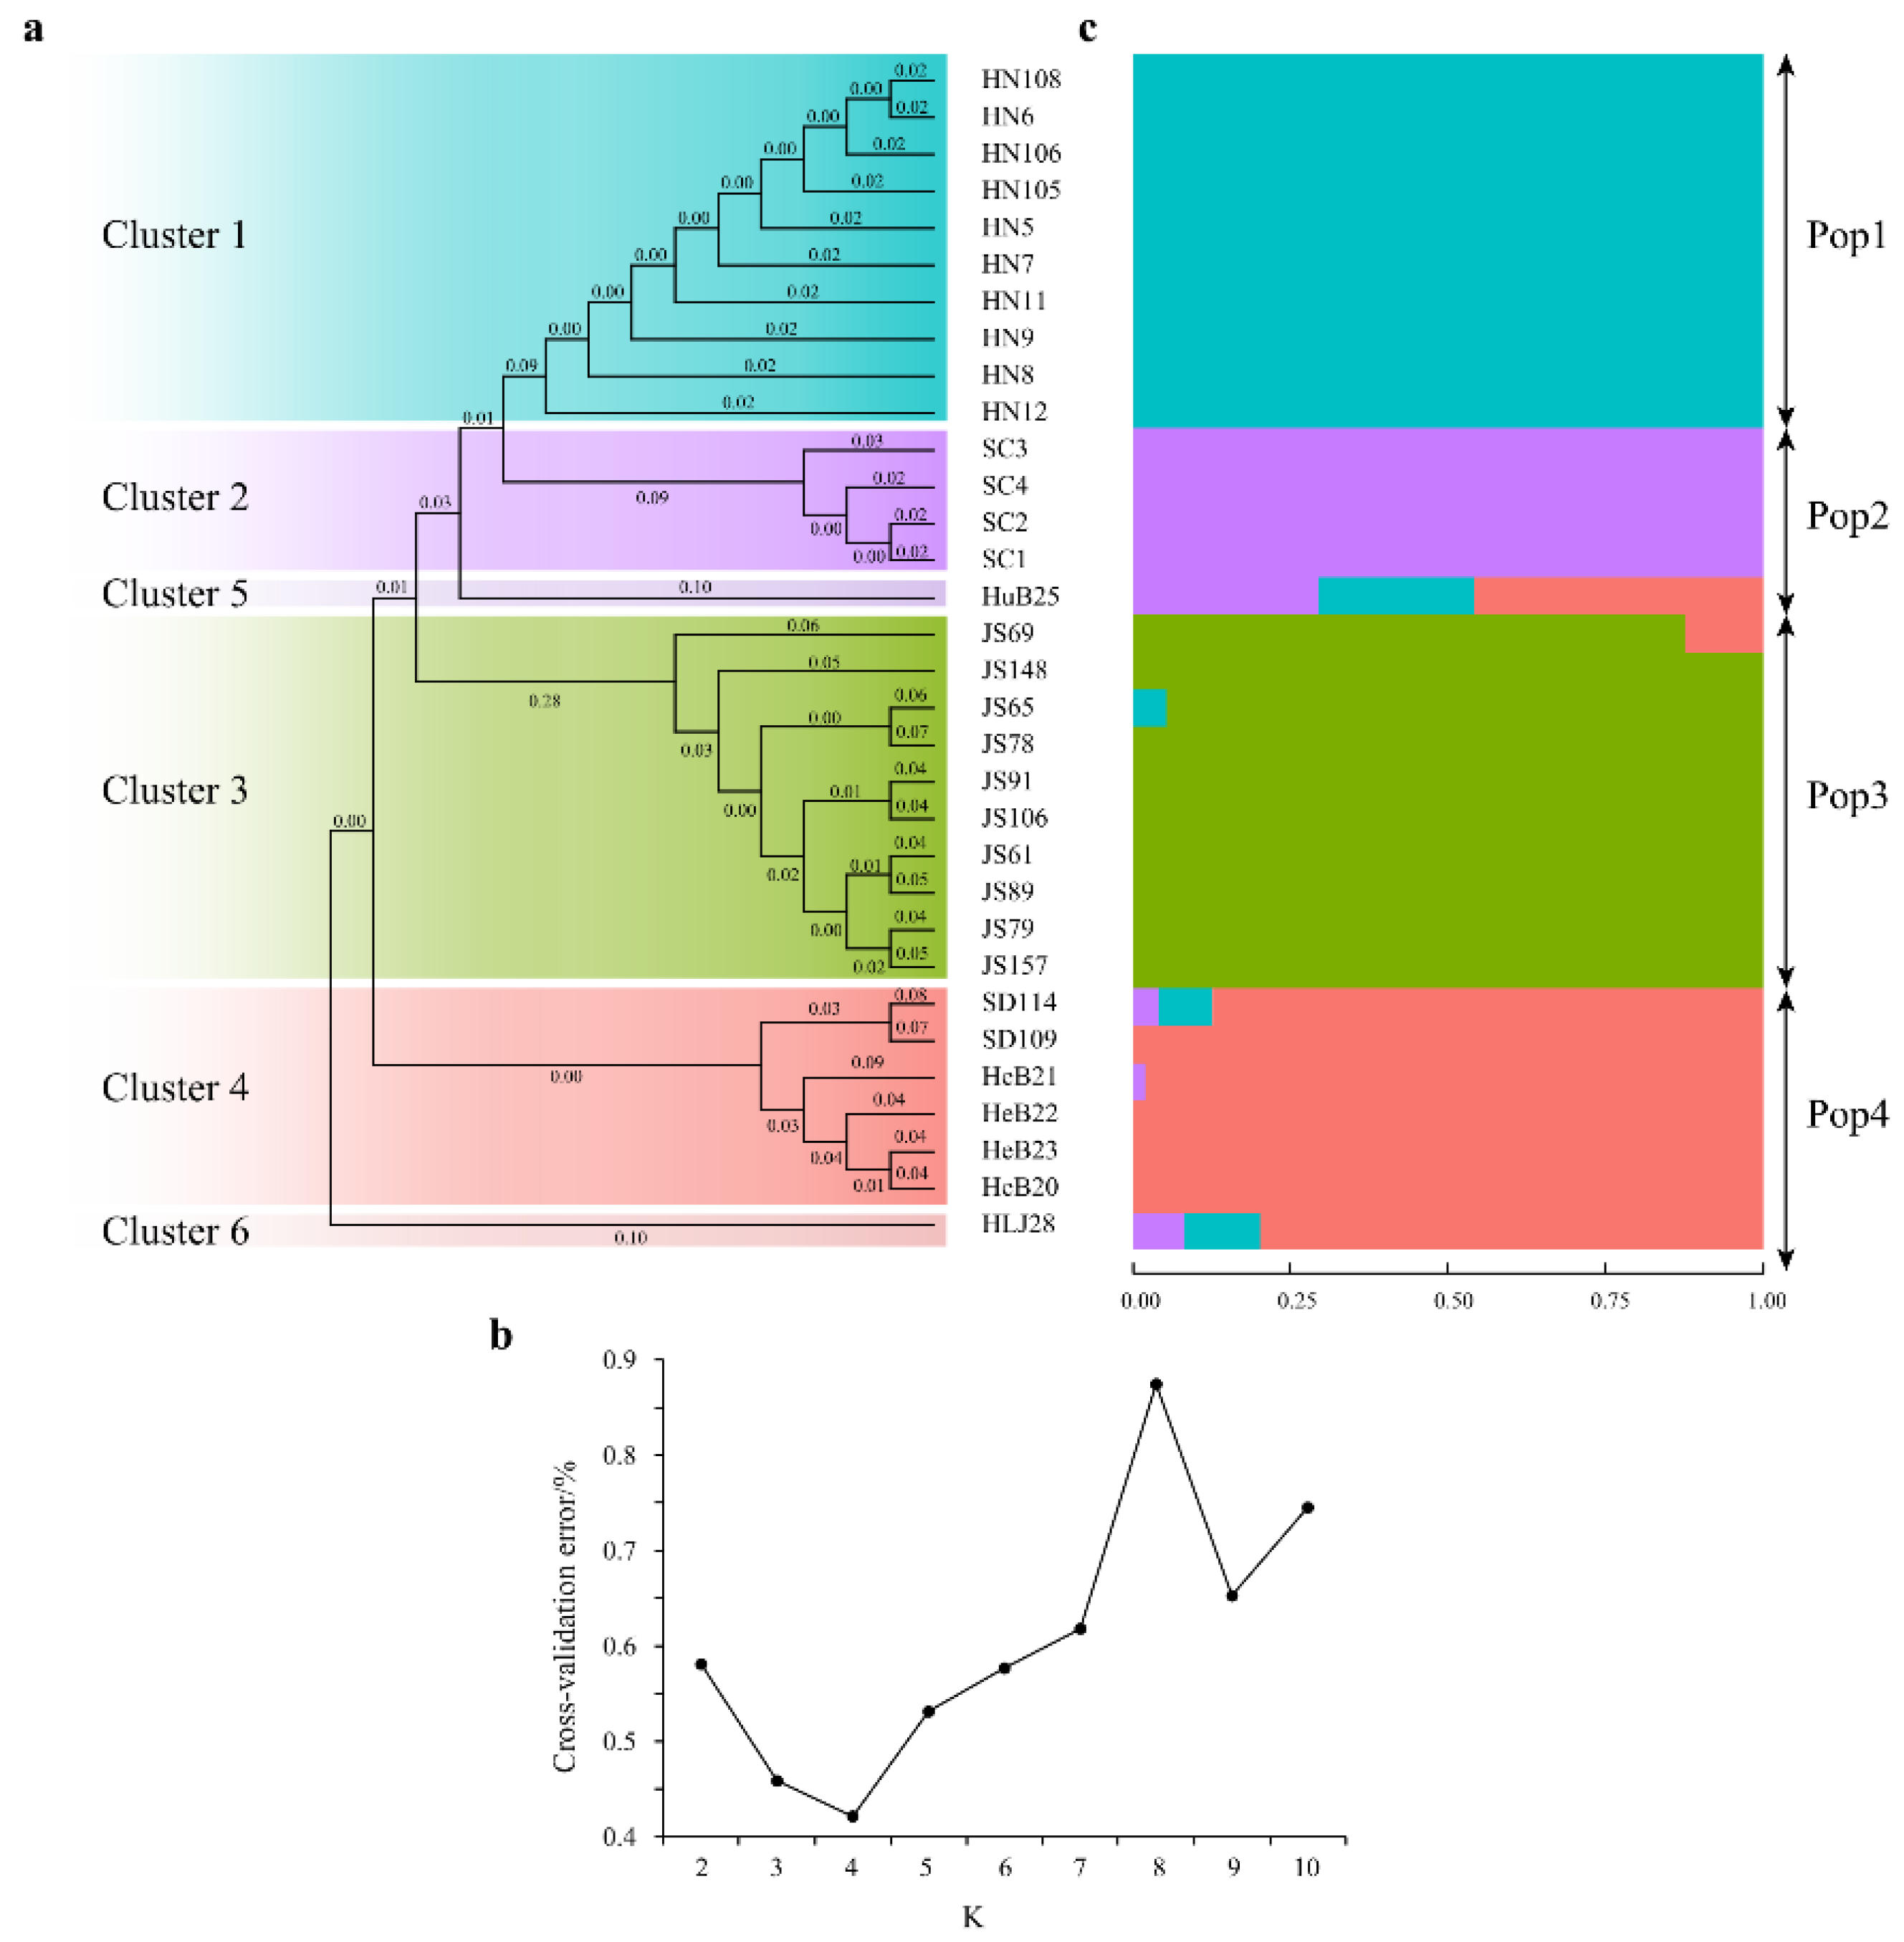
3.5. Phylogenetic Tree and Population Structure Analyses

To investigate the phylogenetic relationships among these 32 hollyhock accessions, we constructed a neighbor-joining (NJ) tree based on the genetic distance matrix generated from the core SNP set. With the exceptions of HuB25 and HLJ28, these accessions mainly formed four clusters (Figure 6a). The accessions collected from Hunan were closely clustered into one branch, denoted as Cluster 1, which was consistent with the PCA plot. The accessions from Sichuan and Jiangsu were clustered into two distinct branches, denoted as Cluster 2 and Cluster 3, respectively; those from Shandong and Hebei were clustered together and denoted as Cluster 4. The evolutionary distances calculated between the 32 samples ranged from 0.000 to 0.550, with an average of 0.321. We detected the largest evolutionary distance between JS79 and HeB22, indicating that these two accessions possessed the greatest genetic variation.
To assess the population genetic structure of these hollyhock accessions, we used ADMIXTURE along with PLINK and tried different K values (from 2 to 10). The K value with the lowest cross-validation error rate was 4 (Figure 6b), indicating that these hollyhock accessions could be divided into four subpopulations (Pop 1–4). Pop 1 consisted of 10 samples from Hunan, which was in good agreement with the results from the NJ tree. Pop 2 contained five hollyhock lines and had the highest level of admixture. Pop 3 and Pop 4 comprised ten and seven accessions, respectively (Figure 6c). The results from the ADMIXTURE grouping analysis roughly conformed to the findings of the NJ tree and the PCA. Genetic diversity parameters were calculated for the four subpopulations (Table S4). Of the four subpopulations, the expected heterozygosity (He) and the effective number of alleles (Ae) of Pop 3 were the highest, though lower than that of the whole population, which means that the genetic diversity of Pop 3 was higher than those of the other subpopulations. Additionally, the He values of Pop 3 and Pop 4 were all higher than the observed heterozygosity (Ho), indicating that there were more homozygous sites in these two subpopulations.

4. Discussion

In this work, we observed a wide range of phenotypic diversity for 11 morphological traits of a hollyhock population comprising 162 accessions and detected a significant positive correlation between some quantitative traits. We randomly chose a subset of 32 samples to analyze the genetic diversity using high-coverage re-sequencing data and obtained over 10 million core SNPs distributed throughout the hollyhock genome. Using these high-quality SNPs, we established that (1) the nucleotide diversity (π value) varied slightly across the genome, except on chromosome 21; (2) the PCA plot clearly classified the 32 hollyhock accessions into four clusters corresponding to four geographic regions, and the samples showed greater variation among clusters than within the same cluster; (3) in the NJ tree, accessions from Hunan, Sichuan, and Jiangsu were clustered into three distinct branches and accessions from Shandong and Hebei were grouped together into one branch; and (4) the population structure analysis divided these samples into four subpopulations, which was roughly consistent with the results of the PCA and the NJ tree. The strong correlation between geographical location and genetic diversity suggests that hollyhock has experienced localized adaptation, giving rise to distinct germplasm resources in each region. Therefore, to expand the genetic variation in breeding resources, hollyhock germplasms will need to be gathered from many regions.
Germplasm resources are the foundation of identifying desirable alleles and breeding elite varieties to cope with adverse environmental conditions [35,36]. Here, we used 162 hollyhock accessions collected from seven provinces of China to examine phenotypic and genotypic diversity, in which 11 morphological traits showed extensive variation. Molecular markers, such as random amplified polymorphic DNA (RAPD), amplified fragment length polymorphisms (AFLPs), simple sequence repeats (SSRs), SNPs, and even insertions/deletions, have been applied in many studies to reveal genetic diversity among diverse populations [37,38,39,40,41]. Among these DNA markers, RAPD and AFLP markers have some obvious disadvantages, including less reproducibility [42,43], failing to detect heterozygotes’ loci [44], etc. As for SSR markers, the main shortcoming is labor-intensive wet experiments where silver staining steps are usually necessary before recording of the DNA polymorphisms [45]. On the other hand, due to the increasingly growing throughput, the decreasing cost [46], and the ability to detect tens of thousands of genome-wide and evenly distributed SNP markers, high-throughput sequencing technology has been extensively applied in population genetics and thus provided us an unprecedented comprehensive spectrum of plant genetic diversity [47,48,49]. Here, using high-throughput whole-genome re-sequencing on 32 hollyhock accessions, we obtained up to ~35.7× depth and ~91.5% genome coverage on average, which helped identify 10,468,760 core SNPs across the hollyhock genome, with a density of 1 SNP every 90 bp. This SNP density is similar to that obtained in maize (Zea mays; 93 bp/SNP, 350 lines [50]) but lower than those in rice (Oryza sativa; 22 bp/SNP, 3010 accessions [47]) and tomatoes (Solanum lycopersicum; 44 bp/SNP, 838 accessions [51]). Chromosome 21 had the fewest SNPs and the lowest nucleotide diversity, which may be attributed to (1) large differences in genome architecture between the 32 accessions and the reference genome and/or (2) fewer polymorphisms on this chromosome among these germplasm resources. Thus, more attention should be paid to this genomic region in future studies.
Population structure analysis is particularly helpful in understanding genetic diversity and the genetic basis underlying phenotypes and involves PCA, phylogenetic analysis, and ancestral population analysis [52,53,54]. Here, the 32 hollyhock accessions were mainly divided into four subpopulations according to PCA, the NJ tree, and the ADMIXTURE analysis, which were significantly correlated with geographical location. The accessions from Hunan and Jiangsu were grouped into two distinct subpopulations, while the samples from Sichuan and Hubei, located in South-Central China, were grouped into one subpopulation. In Pop 4, one accession (HLJ28) from Heilongjiang was grouped closely with the accessions from Shandong and Hebei, all of which are located in Northern China. The population structure in hollyhock is similar to that of jute (Corchorus spp.), another member of the Malvaceae family, which can also be divided into four subgroups based on genetic structure analysis [55]. Considering that accessions within the same subpopulation shared similar geographical locations, it could be inferred that the population structure of hollyhock might be correlative to its geographical regions.
Overall, our study presents the first assessment of genetic diversity within hollyhock germplasm resources at both the molecular and population levels using high-throughput sequencing technology. The extensive whole-genome SNP dataset coupled with the elucidation of distinct genetic structures holds immense value for the advancement of hollyhock breeding research. Furthermore, the advent of advanced whole-genome genotyping techniques, such as all-in-one sequencing [56] and simultaneous foreground and background integrated genotyping by sequencing [57], will further enhance the significance of our current study, marking a pivotal stride toward molecular marker-assisted breeding in hollyhock.

Supplementary Materials

The following supporting information can be downloaded at: https://www.mdpi.com/article/10.3390/horticulturae9060662/s1, Table S1: Summary of sequencing reads and mapping information of 32 hollyhock accessions, Table S2: Distribution of the core SNPs in the hollyhock genome, Table S3: Nucleotide diversity (π value) calculated in the hollyhock genome, Table S4: Genetic diversity parameters calculated for the four subpopulations.

Author Contributions

Methodology, Y.W., S.Z., Z.Z., Z.P., H.L. and Y.C. (Yuxiao Chang); software, Y.W.; formal analysis, Y.W.; investigation, Y.W., S.Z., P.C., Y.L. and Z.M.; visualization, Y.W.; validation, P.C.; writing—original draft, Y.W.; writing—review and editing, S.Z. and W.A.M.; conceptualization, supervision, project administration, and funding acquisition, Y.C. (Yanli Chen) and Y.C. (Yuxiao Chang). All authors have read and agreed to the published version of the manuscript.

Funding

This work was supported by the R&D program of Shenzhen (KCXFZ20211020164207012), the R&D program in key areas of Guangdong Province (2021B0707010006), the Science and Technology Planning Project of Guangdong Province (2022B0202060002), the Hainan Major Science and Technology Project (ZDKJ2021005), and the Hainan Province Science and Technology Special Fund (ZDYF2020050).

Data Availability Statement

The raw sequence data reported in this paper have been deposited in the Genome Sequence Archive in the National Genomics Data Center under accession number CRA009599 and are publicly accessible at https://ngdc.cncb.ac.cn/gsa.

Acknowledgments

We are grateful to the Germplasm Bank of Wild Species for providing the seeds and China National GeneBank (CNGB) for sequencing.

Conflicts of Interest

The authors declare no conflict of interest.

References

  1. Chen, C.; Lan, Y.; Mi, R.; Xu, M.; Liu, Y.; Wu, J.; Zhang, Y.; Long, L.; Yang, G. Effects of intercropping ryegrass with hollyhock and inoculation with Bacillus thuringiensis on enhancing phytoremediation of Cd-contaminated soils. Chemosphere 2023, 311, 136974. [Google Scholar] [CrossRef]
  2. Shehzad, M.R.; Hanif, M.A.; Rehman, R.; Bhatti, I.A. Hollyhock. In Medicinal Plants of South Asia: Novel Sources for Drug Discovery, 1st ed.; Muhammad, A.H., Haq, N., Muhammad, M.K., Hugh, J.B., Eds.; Elsevier: Amsterdam, The Netherlands, 2019; pp. 381–391. [Google Scholar]
  3. Li, S. Compendium of Materia Medica; People’s Medical Publishing House: Beijing, China, 1982. [Google Scholar]
  4. Munir, M.; Hussain, A.; Ul-Haq, I.; Qureshi, R.; Munazir, M.; Arshad, M.N.; Leghari, M.K. Callogenesis potential of cotyledonary explants of Althaea rose L. from Pakistan. Pak. J. Bot. 2012, 44, 271–275. [Google Scholar]
  5. Wang, S. A Study of the Paintings of Xixia Grottoes in Dunhuang on the background of art history. J. Dunhuang Stud. 2019, 104, 153. [Google Scholar]
  6. Yi, C. A study on Xia Hua Tu by Li Song in Song Dynasty. Master’s Thesis, Zhejiang Nnomal University, Zhejiang, China, 2022. [Google Scholar]
  7. Gokhale, S.B.; Tatiya, A.U.; Bakliwal, S.; Fursule, R.A. Natural dye yielding plants. Indian J. Nat. Prod. Resour. 2004, 3, 228–234. [Google Scholar]
  8. Ahmadi, M.; Rad, A.K.; Rajaei, Z.; Hadjzadeh, M.A.; Mohammadian, N.; Tabasi, N.S. Alcea rosea root extract as a preventive and curative agent in ethylene glycol-induced urolithiasis in rats. Indian J. Pharmacol. 2012, 44, 304–307. [Google Scholar] [CrossRef]
  9. Lim, T.K. Edible Medicinal and Non-Medicinal Plants, 1st ed.; Springer: Canberra, Australia, 2012; p. 835. [Google Scholar]
  10. Zhang, Y.; Jin, L.; Chen, Q.; Wu, Z.; Dong, Y.; Han, L.; Wang, T. Hypoglycemic activity evaluation and chemical study on hollyhock flowers. Fitoterapia 2015, 102, 7–14. [Google Scholar] [CrossRef]
  11. Kim, Y.S.; Kim, E.K.; Nawarathna, W.; Dong, X.; Shin, W.B.; Park, J.S.; Moon, S.H.; Park, P.J. Immune-Stimulatory Effects of Althaea rosea Flower Extracts through the MAPK Signaling Pathway in RAW264.7 Cells. Molecules 2017, 22, 679. [Google Scholar] [CrossRef] [Green Version]
  12. Huang, Y.; Zu, L.; Zhang, M.; Yang, T.; Zhou, M.; Shi, C.; Shi, F.; Zhang, W. Tolerance and distribution of cadmium in an ornamental species Althaea rosea Cavan. Int. J. Phytoremediat. 2020, 22, 713–724. [Google Scholar] [CrossRef]
  13. Liu, J.N.; Zhou, Q.X.; Sun, T. Growing responses and hyperaccumulating characteristics of three ornamental plants to Cd-Pb combined pollution. Acta Sci. Circumstantiae 2006, 26, 2039–2044. [Google Scholar]
  14. Liu, J.; Zhou, Q.; Wang, S.; Sun, T. Cadmium tolerance and accumulation of Althaea rosea Cav. and its potential as a hyperaccumulator under chemical enhancement. Environ. Monit. Assess. 2009, 149, 419–427. [Google Scholar] [CrossRef]
  15. Janfaza, S.; Janfaza, E. The study of medicinal plants usage trough urban green space. Ann. Biol. Res. 2012, 3, 1934–1937. [Google Scholar]
  16. Leus, L.; Van Laere, K.; De Riek, J.; Van Huylenbroeck, J. Rose. In Ornamental Crops, 1st ed.; Van Huylenbroeck, J., Ed.; Springer International Publishing: Cham, Switzerland, 2018; pp. 719–767. [Google Scholar]
  17. Marasek-Ciolakowska, A.; Nishikawa, T.; Shea, D.J.; Okazaki, K. Breeding of lilies and tulips—Interspecific hybridization and genetic background. Breed. Sci. 2018, 68, 35–52. [Google Scholar] [CrossRef] [Green Version]
  18. Marasek-Ciolakowska, A.; Sochacki, D.; Marciniak, P. Breeding Aspects of Selected Ornamental Bulbous Crops. Agronomy 2021, 11, 1709. [Google Scholar] [CrossRef]
  19. Xing, G.; Qu, L.; Zhang, W.; Zhang, Y.; Yuan, X.; Lei, J. Study on interspecific hybridization between tulip cultivars and wild species native to China. Euphytica 2020, 216, 66. [Google Scholar] [CrossRef]
  20. Yu, S.; Sun, W.; Wang, J.; Li, Z. Rice germplasm and its pivotal role in functional genomics research. Chin. Bull. Life Sci. 2016, 28, 1122–1128. [Google Scholar] [CrossRef]
  21. He, T.; Li, C. Harness the power of genomic selection and the potential of germplasm in crop breeding for global food security in the era with rapid climate change. Crop. J. 2020, 8, 688–700. [Google Scholar] [CrossRef]
  22. Yang, Y.; Sun, M.; Li, S.; Chen, Q.; Teixeira da Silva, J.A.; Wang, A.; Yu, X.; Wang, L. Germplasm resources and genetic breeding of Paeonia: A systematic review. Hortic. Res. 2020, 7, 107. [Google Scholar] [CrossRef]
  23. Sharma, S.; Schulthess, A.W.; Bassi, F.M.; Badaeva, E.D.; Neumann, K.; Graner, A.; Özkan, H.; Werner, P.; Knüpffer, H.; Kilian, B. Introducing Beneficial Alleles from Plant Genetic Resources into the Wheat Germplasm. Biology 2021, 10, 982. [Google Scholar] [CrossRef]
  24. Roy, R.; Sultana, S.; Begum, N.; Fornara, D.; Barmon, M.; Zhang, R.; Sarker, T.; Rabbany, M.G. Exogenous melatonin reduces water deficit-induced oxidative stress and improves growth performance of Althaea rosea grown on coal mine spoils. Environ. Sci. Pollut. Res. 2022, 29, 61550–61560. [Google Scholar] [CrossRef]
  25. Murray, M.G.; Thompson, W.F. Rapid isolation of high molecular weight plant DNA. Nucleic Acids. Res. 1980, 8, 4321–4325. [Google Scholar] [CrossRef] [Green Version]
  26. Yan, L.; Yang, M.; Guo, H.; Yang, L.; Wu, J.; Li, R.; Liu, P.; Lian, Y.; Zheng, X.; Yan, J.; et al. Single-cell RNA-Seq profiling of human preimplantation embryos and embryonic stem cells. Nat. Struct. Mol. Biol. 2013, 20, 1131–1139. [Google Scholar] [CrossRef]
  27. Li, H.; Durbin, R. Fast and accurate short read alignment with Burrows-Wheeler transform. Bioinformatics 2009, 25, 1754–1760. [Google Scholar] [CrossRef] [Green Version]
  28. McKenna, A.; Hanna, M.; Banks, E.; Sivachenko, A.; Cibulskis, K.; Kernytsky, A.; Garimella, K.; Altshuler, D.; Gabriel, S.; Daly, M.; et al. The Genome Analysis Toolkit: A MapReduce framework for analyzing next-generation DNA sequencing data. Genome Res. 2010, 20, 1297–1303. [Google Scholar] [CrossRef] [Green Version]
  29. Danecek, P.; Auton, A.; Abecasis, G.; Albers, C.A.; Banks, E.; DePristo, M.A.; Handsaker, R.E.; Lunter, G.; Marth, G.T.; Sherry, S.T.; et al. The variant call format and VCFtools. Bioinformatics 2011, 27, 2156–2158. [Google Scholar] [CrossRef] [Green Version]
  30. Nei, M.; Li, W.H. Mathematical model for studying genetic variation in terms of restriction endonucleases. Proc. Natl. Acad. Sci. USA 1979, 76, 5269–5273. [Google Scholar] [CrossRef] [Green Version]
  31. Lefort, V.; Desper, R.; Gascuel, O. FastME 2.0: A Comprehensive, Accurate, and Fast Distance-Based Phylogeny Inference Program. Mol. Biol. Evol. 2015, 32, 2798–2800. [Google Scholar] [CrossRef] [Green Version]
  32. Felsenstein, J. Confidence limits on phylogenies: An approach using the bootstrap. Evolution 1985, 39, 783–791. [Google Scholar] [CrossRef]
  33. Purcell, S.; Neale, B.; Todd-Brown, K.; Thomas, L.; Ferreira, M.A.R.; Bender, D.; Maller, J.; Sklar, P.; de Bakker, P.I.W.; Daly, M.J.; et al. PLINK: A tool set for whole-genome association and population-based linkage analyses. Am. J. Hum. Genet. 2007, 81, 559–575. [Google Scholar] [CrossRef] [Green Version]
  34. Alexander, D.H.; Novembre, J.; Lange, K. Fast model-based estimation of ancestry in unrelated individuals. Genome Res. 2009, 19, 1655–1664. [Google Scholar] [CrossRef] [Green Version]
  35. Cooper, M.; Messina, C.D. Breeding crops for drought-affected environments and improved climate resilience. Plant Cell 2023, 35, 162–186. [Google Scholar] [CrossRef]
  36. Dwivedi, S.L.; Ceccarelli, S.; Blair, M.W.; Upadhyaya, H.D.; Are, A.K.; Ortiz, R. Landrace Germplasm for Improving Yield and Abiotic Stress Adaptation. Trends Plant Sci. 2016, 21, 31–42. [Google Scholar] [CrossRef]
  37. Eltaher, S.; Sallam, A.; Belamkar, V.; Emara, H.A.; Nower, A.A.; Salem, K.F.M.; Poland, J.; Baenziger, P.S. Genetic Diversity and Population Structure of F3:6 Nebraska Winter Wheat Genotypes Using Genotyping-By-Sequencing. Front. Genet. 2018, 9, 76. [Google Scholar] [CrossRef] [Green Version]
  38. Alemu, A.; Feyissa, T.; Letta, T.; Abeyo, B. Genetic diversity and population structure analysis based on the high density SNP markers in Ethiopian durum wheat (Triticum turgidum ssp. durum). BMC Genet. 2020, 21, 18. [Google Scholar] [CrossRef] [Green Version]
  39. Motahari, B.; Shabanian, N.; Rahmani, M.S.; Mohammad, H.F. Genetic diversity and genetic structure of Acer monspessulanum L. across Zagros forests of Iran using molecular markers. Gene 2021, 769, 145245. [Google Scholar] [CrossRef]
  40. Hao, C.Y.; Zhang, X.Y.; Wang, L.F.; Dong, Y.S.; Shang, X.W.; Jia, J.Z. Genetic Diversity and Core Collection Evaluations in Common Wheat Germplasm from the Northwestern Spring Wheat Region in China. Mol. Breed. 2006, 17, 69–77. [Google Scholar] [CrossRef]
  41. Wang, H.; Khera, P.; Huang, B.; Yuan, M.; Katam, R.; Zhuang, W.; Harris, S.K.; Moore, K.M.; Culbreath, A.K.; Zhang, X.; et al. Analysis of genetic diversity and population structure of peanut cultivars and breeding lines from China, India and the US using simple sequence repeat markers. J. Integr. Plant Biol. 2016, 58, 452–465. [Google Scholar] [CrossRef] [Green Version]
  42. Garcia, M.J.; Oliver, M.; Gómez, P.H.; Vicente, M.C. Comparing AFLP, RAPD and RFLP markers for measuring genetic diversity in melon. Theor. Appl. Genet. 2000, 101, 860–864. [Google Scholar] [CrossRef]
  43. Pandey, A.; Khan, M.K.; Isik, R.; Turkmen, O.; Ramazan, A.; Musa, S.; Hakki, E.E. Genetic diversity and population structure of watermelon (Citrullus sp.) genotypes. 3 Biotech 2019, 9, 210. [Google Scholar] [CrossRef]
  44. Loera, S.M.; Studer, B.; Kölliker, R. DNA-Based Assessment of Genetic Diversity in Grassland Plant Species: Challenges, Approaches, and Applications. Agronomy 2019, 9, 881. [Google Scholar] [CrossRef] [Green Version]
  45. Brant, J.B.; Gustavo, C.A.; Peter, M.G. Fast and sensitive silver staining of DNA in polyacrylamide gels. Anal. Biochem. 1991, 196, 80–83. [Google Scholar] [CrossRef]
  46. DNA Sequencing Costs: Data from the NHGRI Genome Sequencing Program (GSP). Available online: www.genome.gov/sequencingcostsdata (accessed on 17 May 2023).
  47. Wang, W.; Mauleon, R.; Hu, Z.; Chebotarov, D.; Tai, S.; Wu, Z.; Li, M.; Zheng, T.; Fuentes, R.R.; Zhang, F.; et al. Genomic variation in 3,010 diverse accessions of Asian cultivated rice. Nature 2018, 557, 43–49. [Google Scholar] [CrossRef] [Green Version]
  48. Kelly, S.; Rafal, M.G.; Bruce, B.; Michael, B.; Robert, B.; James, H.; Melissa, K.; Nicholas, L.; Lynda, P.; Romay, M.C.; et al. Genomic estimation of complex traits reveals ancient maize adaptation to temperate North America. Science 2017, 357, 512–515. [Google Scholar] [CrossRef] [Green Version]
  49. Lam, H.M.; Xu, X.; Liu, X.; Chen, W.B.; Yang, G.H.; Wong, F.L.; Li, M.W.; He, W.M.; Qin, N.; Wang, B.; et al. Resequencing of 31 wild and cultivated soybean genomes identifies patterns of genetic diversity and selection. Nat. Genet. 2010, 42, 1053–1059. [Google Scholar] [CrossRef]
  50. Wang, B.; Lin, Z.; Li, X.; Zhao, Y.; Zhao, B.; Wu, G.; Ma, X.; Wang, H.; Xie, Y.; Li, Q.; et al. Genome-wide selection and genetic improvement during modern maize breeding. Nat. Genet. 2020, 52, 565–571. [Google Scholar] [CrossRef]
  51. Zhou, Y.; Zhang, Z.; Bao, Z.; Li, H.; Lyu, Y.; Zan, Y.; Wu, Y.; Cheng, L.; Fang, Y.; Wu, K.; et al. Graph pangenome captures missing heritability and empowers tomato breeding. Nature 2022, 606, 527–534. [Google Scholar] [CrossRef]
  52. Edea, Z.; Dadi, H.; Kim, S.W.; Dessie, T.; Lee, T.; Kim, H.; Kim, J.J.; Kim, K.S. Genetic diversity, population structure and relationships in indigenous cattle populations of Ethiopia and Korean Hanwoo breeds using SNP markers. Front. Genet. 2013, 4, 35. [Google Scholar] [CrossRef] [Green Version]
  53. Meisner, J.; Albrechtsen, A. Inferring Population Structure and Admixture Proportions in Low-Depth NGS Data. Genetics 2018, 210, 719–731. [Google Scholar] [CrossRef] [Green Version]
  54. Mohammadi, S.A.; Prasanna, B.M. Analysis of Genetic Diversity in Crop Plants—Salient Statistical Tools and Considerations. Crop. Sci. 2003, 43, 1235–1248. [Google Scholar] [CrossRef] [Green Version]
  55. Zhang, L.; Yuan, M.; Tao, A.; Xu, J.; Lin, L.; Fang, P.; Qi, J. Genetic Structure and Relationship Analysis of an Association Population in Jute (Corchorus spp.) Evaluated by SSR Markers. PLoS ONE 2015, 10, e0128195. [Google Scholar] [CrossRef] [Green Version]
  56. Zhao, S.; Zhang, C.; Mu, J.; Zhang, H.; Yao, W.; Ding, X.; Ding, J.; Chang, Y. All-in-one sequencing: An improved library preparation method for cost-effective and high-throughput next-generation sequencing. Plant Methods 2020, 16, 74. [Google Scholar] [CrossRef]
  57. Zhao, S.; Zhang, C.; Wang, L.; Luo, M.; Zhang, P.; Wang, Y.; Malik, W.A.; Wang, Y.; Chen, P.; Qiu, X.; et al. A prolific and robust whole-genome genotyping method using PCR amplification via primer-template mismatched annealing. J. Integr. Plant Biol. 2023, 65, 633–645. [Google Scholar] [CrossRef]
Figure 1. Geographical distribution of 162 hollyhock germplasm resources. Different colors indicate different provinces, and the dot size shows the number of accessions.
Horticulturae 09 00662 g001
Figure 2. The phenotypes of hollyhock. (a) The whole plant. Scale bars: 5.0 cm. (bf) Different types of flowers. Scale bars: 7 mm. (gj) Different shapes of leaves. Scale bars: 15 mm.
Horticulturae 09 00662 g002
Figure 3. Correlation analysis among quantitative traits of hollyhock germplasm resources. The curves on the diagonal show the phenotypic distribution of each trait. The plots below the diagonal are scatterplots of pairwise comparisons between traits, and the values above the diagonal are the corresponding pairwise Pearson’s correlation coefficients between the traits. * p < 0.05; ** p < 0.01; *** p < 0.001.
Horticulturae 09 00662 g003
Figure 4. Genetic diversity of SNP markers among 32 hollyhock accessions. Tracks, from inside to outside, are representative of hollyhock flowers, SNP density (pink and blue colors indicate high and low SNP density, respectively, and white color indicates no SNPs were detected in this region), π values (blue points), and chromosomes (in Mb).
Horticulturae 09 00662 g004
Figure 5. Principal component analysis of 32 hollyhock accessions based on the core SNP set. The triangles with different colors indicate the different provinces of China. JS, Jiangsu; SC, Sichuan; HN, Hunan; SD, Shandong; HeB, Hebei; HuB, Hubei; HLJ, Heilongjiang.
Horticulturae 09 00662 g005
Figure 6. Phylogenetic relationships and population structure analysis of 32 hollyhock germplasm resources. (a) Neighbor-joining (NJ) tree constructed based on core SNP markers. Different colors indicate different clusters inferred from the NJ tree. (b) Cross-validation error rates corresponding to different K values. (c) Ancestral population analysis based on ADMIXTURE at K = 4. Individuals are represented by horizontal bars shaded in proportion to their estimated ancestry within each subpopulation. JS, Jiangsu; SC, Sichuan; HN, Hunan; SD, Shandong; HeB, Hebei; HuB, Hubei; HLJ, Heilongjiang.
Horticulturae 09 00662 g006
Table 1. Descriptions and coding of six qualitative traits in hollyhock accessions.
TraitTrait Description (Grade) and Coding
Petal Color1 = white, 2 = yellow, 3 = pink, 4 = red, 5 = crimson
Flower Type1 = single flower, 2 = double flower
Petal Margin1 = bilobed, 2 = multilobed, 3 = serrated
Flower Center Color1 = white, 2 = red, 3 = yellow
Petal Structure1 = fused, 2 = unfused
Leaf Shape1 = cordate, 2 = palmate trilobed, 3 = palmate bifurcate, 4 = palmate trifurcate
Table 2. Phenotypic variations of six qualitative traits in hollyhock accessions.
TraitDistribution of Frequency (%)H′
12345
Petal Color22.25.629.611.131.51.46
Flower Type54.345.7---0.70
Petal Margin29.043.827.2--1.08
Flower Center Color4.327.867.9--0.75
Petal Structure80.919.1---0.49
Leaf Shape3.14.352.540.1-0.95
Table 3. Phenotypic variations of five quantitative traits in hollyhock accessions.
TraitMax.Min.MeanS.D.C.V. (%)H′
Plant Height (cm)250.130.0130.349.738.22.18
Internode Length (cm)10.02.15.31.527.91.88
Petal Length (cm)8.05.05.70.610.91.47
Petal Width (cm)7.62.54.40.818.91.85
Corolla Diameter (cm)14.07.510.01.111.21.52
Disclaimer/Publisher’s Note: The statements, opinions and data contained in all publications are solely those of the individual author(s) and contributor(s) and not of MDPI and/or the editor(s). MDPI and/or the editor(s) disclaim responsibility for any injury to people or property resulting from any ideas, methods, instructions or products referred to in the content.

