Article

Variability in Productive and Biochemical Traits of Vicia faba L. Landraces from Apulia Region (South Italy)

Department of Soil, Plant and Food Sciences, University of Bari “Aldo Moro”, Via G. Amendola 165/a, 70126 Bari, Italy
*
Author to whom correspondence should be addressed.
Horticulturae 2023, 9(5), 601; https://doi.org/10.3390/horticulturae9050601
Submission received: 28 February 2023 / Revised: 4 May 2023 / Accepted: 16 May 2023 / Published: 19 May 2023
(This article belongs to the Special Issue Bioactive Compounds in Horticultural Plants)

Abstract

:
The faba bean (Vicia faba L. var. major) is a pulse that is garnering attention for its chemical composition, which makes it suitable for a healthy diet. The Apulian germplasm is rich in local accessions at risk of genetic erosion, which need evaluating and promoting. Thirteen Vicia faba local Landraces have been analyzed in relation to their productivity and their chemical and biochemical characteristics: their protein, total phenol, total flavonoid, condensate tannin and L-DOPA levels. The results showed great variability—above all in the thousand-seeds weight and in their content of proteins and L-DOPA. Among the accessions evaluated, the two collected from the most southern area of the region (FV12-FV10) were particularly promising—both for their good biochemical traits and, especially, for the higher L-DOPA content (0.46 and 0.49 g 100 g−1 d.m., respectively), even when expressed in terms of yield per plant (116.3 and 153.0 mg plant−1 d.m., respectively).

1. Introduction

The faba bean (Vicia faba L.), belonging to the Fabaceae family, has been used since the prehistoric period in the Middle East both for food and for feed. However, while it is one of the most widely produced pulses on the global market, the faba bean occupies a smaller market share (4.84 million tons) in contrast to dry beans (Phaseolus vulgaris L.) (38.14 million tons), for which China is the major producer (1.6 M ha, 36% of the world’s production) [1]. In the European Union, its cultivated area is nearly 0.66 M ha, with a production of 2.0 Tg [2]. However, faba beans deserve to be revaluated as their nutritional value is very high. Faba beans have an excellent concentration of protein (20–36%) and are rich in lysine, complex carbohydrates, dietary fiber [3]—an aspect that is nutritionally convenient for pasta manufacturing [4]—carbohydrates and minerals (such as iron, calcium and magnesium) [5], vitamins (especially B group vitamins) and fibers, which are good for regulating the absorption of sugars and cholesterol. Besides this, many studies have showed the health value of faba beans due to the presence of bioactive compounds, including phenols—natural antioxidants [6] that protect against DNA damage induced by radicals [7]. More than 100 phenolic compounds have been identified in seeds by Abu-Reidah et al. [8]—mainly flavonoids [9,10], catechins [11] and condensed tannins [12]. Tannins are also water-soluble polyphenols with interesting nutraceutical properties, as they protect against low density lipoprotein (LDL), preventing cardiovascular diseases [13]—even if they are generally considered as antinutrients, as they negatively influence the digestibility of food matrix proteins [14,15]. Additionally, V. faba also has therapeutic potential and is recognized as a medicinal plant due to its L-DOPA (Levo-3,4-dihydroxy- phenylalanine) [16,17] levels—a non-proteic amino acid produced during secondary metabolism. L-DOPA is the precursor of the neurotransmitter dopamine, which is useful in the treatment of Parkinson’s disease, hypertension, renal insufficiency and liver cirrhosis.
L-DOPA that is synthesized according to the Monsanto method [18] is expensive and could cause side-effects including nausea, vomiting, low blood pressure, drowsiness and restlessness [19]. In addition, other criticisms concern its poor conversion rate and low enantioselectivity. For this reason, the use of natural sources of L-DOPA may be useful [20,21,22].
L-DOPA is abundant in different legume seeds, such as velvet beans (Mucuna pruriens)—which have a restricted area of cultivation such as tropical places—and faba beans, whose cultivation is widespread in South America, Asia and Europe [23].
The consumption of faba beans has been shown to increase the levels of L-DOPA in the blood with a clear improvement in the motor performance of patients (“ON” period), without side effects [21]. Regarding this aspect, it may be useful to search for varieties rich in L-DOPA to be used for direct human consumption or for the selective extraction of L-DOPA molecules for use in the pharmaceutical industry.
There are numerous scientific investigations regarding L-DOPA’s distribution in different parts of the faba bean plant [17,22,24] and the influence of biotic and abiotic stress on L-DOPA production [17,25,26]. In contrast, genetics’ role in L-DOPA content in the faba bean has not been investigated as much.
Apulia, in South Italy, is a region with a long tradition of cultivating faba bean species [24,27], with great agro-biodiversity of this species, whose seeds have been handed down by local farmers from generation to generation and which need to be preserved and valorized for different uses.
Agrobiodiversity is an essential aspect of preserving the adaptability of cultivated crops, and of avoiding the reduction of genetic variability modern cultivars that demonstrate less resistance to pests and climate change [28]. In addition, old landraces can present with higher quantities of bioactive compounds and could be carefully considered as sources of new food products.
The main objective of this research was to evaluate the performance of thirteen faba bean accessions collected from different locations in Apulia to identify the biochemical profiles and the highest L-Dopa genotypes for suitable applications in the food and drug industry—thus preserving and enhancing their biodiversity.

2. Materials and Methods

2.1. Germplasm and Location of Experiment

Thirteen Landraces of faba bean (Vicia faba L.), coming from different locations of Apulia (South Italy) and selected on the basis of historical bibliographic documents, farmer interviews and morphological aspects of the plants and seeds were collected and cataloged (Table 1) in the SaVeGraINPuglia Project database [27].
Currently, seed samples for each accession are stored in the Seed Bank of the Institute of Biosciences and Bioresources of the National Research Council—Bari, Italy.
The accessions were cultivated during the crop seasons 2016/17 and 2017/18 and were evaluated for their productive and qualitative performance, adopting a randomized block experimental design that was repeated 3 times; each plot was 10 m2. The field was located in Itria Valley (40°45′ N 17°19′ E; 410 m of altitude—Apulia).
Sowing was established using a distance of 70 cm between rows and 7 cm in the rows, obtaining a density of 20 plants m−2.
The sowing was carried out on 10 November 2016 during the first year and 31 October 2017 the second year and the plots were fertilized with triple superphosphate at a dose of 150 kg ha−1 before sowing.
During cultivation, accessions were isolated to avoid cross-pollination using coverage with a nonwoven fabric.
Crop management was carried out according to local agronomical practices. During each cycle, the main phenological phases were measured. Harvests of seed were carried out at the dry seed maturation phase.

2.2. Productive Characterization

The beans were harvested on 14 June 2017 the first year and 12 June 2018 the second year using a Wintersteiger harvesting machine, setting the machine for the faba bean grain.
Grain production was measured across the total plot surface area and the thousand seed weight (TSW) was calculated for each sample.
In a sample of 9 plants for each accession (3 plants per replication), the following measurements were taken: plant height, number of ramifications per plant, number of pods per plant, seeds per pod and total seed weight per plant, measured according to the seed testing laboratories’ protocols [29].

2.3. Chemical Characterization

2.3.1. Sample Preparation

Batches of 500 g of seeds for each replication of each accession were dehulled manually and milled (Cyclone Mill Twister—Retsch, Germany) before analysis. Flour was stored at −20 °C in plastic bags to avoid moisture fluctuations and deterioration in its quality.

2.3.2. Determination of Dry Matter and Crude Protein Content

The dry matter of each sample was determined using ground seed samples, placed in an oven at 105 °C until a constant weight was obtained.
Crude Protein (CP) was determined using the AOAC method [30], with the Kjeldahl method, and the protein value was expressed as dry matter (N × 6.25 as the conversion factor).

2.3.3. Extraction for Phenolic Analyses

All samples of seeds were ground and a 1.5 g of powder was extracted with the method described by Lavelli et al. [31] and Hidalgo et al. [32]: 10 mL of water-saturated butanol [33] was added to plastic tubes with the flour of each sample and placed in an ultrasonic bath for 1 h; additionally, the samples were mixed in a vortex for 1 min every 3 min. After centrifugation at 4000 rpm g for 10 min, the supernatant was filtered through a 0.22 mm nylon membrane.

2.3.4. Determination of Total Phenolic Content

The total phenolic content (TPC) was determined using the colorimetric methods described by Xu and Chang [34] with a Folin Ciocalteu assay [35], using gallic acid (GA) as the standard. The results were expressed as gallic acid equivalents (mg of GAE kg−1 d.m.). According to the method, 50 μL of the extracted sample was added to 3 mL of distilled water, 250 μL of Folin–Ciocalteu’s reagent solution and 750 μL of 7% NaCO3 and was vortexed and incubated for 8 min at room temperature. Then, 950 μL of distilled water was added to the mixture and left for 2 h at room temperature in the dark. The absorbance was measured at 765 nm against distilled water as a blank, using a T60U spectrophotometer (PG Instruments, Leicestershire, UK).

2.3.5. Determination of Total Flavonoid Content

The total flavonoid content (TFC) was determined using a colorimetric method described by Heimler et al. [36]: 0.25 mL of the legume extract was mixed with 1.25 mL of distilled water in a test tube, followed by adding 75 μL of a 5% NaNO2 solution. After 6 min, 150 μL of a 10% AlCl36H2O solution was added and allowed to stand for another 5 min before adding 0.5 mL of 1M NaOH. The mixture was brought to 2.5 mL with distilled water. The absorbance was measured immediately against the blank (the same mixture without the sample) at 510 nm using a T60U spectrophotometer (PG Instruments). The results were calculated and expressed as (+)-catechin equivalents (mg of CE kg−1d.m.) using the calibration curve of the (+)-catechin. The extraction was conducted in triplicate.

2.3.6. Determination of Condensed Tannin Content

An analysis of the condensed tannin content (CTC) was carried out according to the method of Broadhurst and Jones [37], slightly modified by our laboratory: 50 μL of the extract sample, suitably diluted with water, 3 mL of a 4% methanol vanillin solution and 1.5 mL of concentrated hydrochloric acid were mixed. The mixture stood for 15 min and the absorption was measured at 500 nm against methanol as a blank.
The amount of condensed tannin was calculated and expressed as catechin equivalents (mg of CE kg−1) using the calibration curve of the (+)-catechin. For each specific sample, triplicate extractions were performed and used for analyses.

2.3.7. Determination of L-DOPA Content and Yield

The concentration of L-DOPA in the seeds was determined following the protocol of Burbano et al. [22] based on that of Marquardt and Fröhlich [38] with some modifications. The compound was extracted from 5 g of flour by adding 50 mL of 5% perchloric acid and homogenizing the mixture for 5 min at 4 °C. The extract was centrifuged at 4000 rpm and filtered through a 0.22 μm filter (Millipore, Cork, Ireland) to remove any suspended material. The extract was injected into a HPLC chromatograph (Agilent 1100 quaternary pump, Santa Clara, CA, USA) equipped with a UV-visible detector (Agilent 1260) at 280 nm. The chromatographic conditions were as follows: column C18 (Supelcosil LC, 250 × 4.6 mm, 5 microns, Supelco, Bellefonte, PA, USA) with a binary elution gradient of 1.0 mL/min—based on water (A) and acetonitrile (B), both containing 0.1% (v/v) formic acid. The program adopted for the separation was: 0–2 min 0% B; 2–3 min from 0 to 10% B; 3–8 min with 10% B; 8–10 min from 10% to 90% B; 10–15 min at 90% B; and 15–20 min, returning to 0% B. Calibration curves were produced with a pure L-DOPA standard (Sigma-Aldrich-Merck KGaA, Darmstadt, Germany). A stock solution of L-DOPA was prepared by dissolving 500 mg L-DOPA standard in 100 mL of 0.5% perchloric acid in a volumetric flask. Different concentrations of L-DOPA were prepared from the stock solution (0.10, 0.25, 0.5, 1.0, 2.5 and 5 mg mL−1) and the standard curve was drawn.
The L-DOPA productivity per plant of each accession was calculated based on the seed weight per plant and the L-DOPA content (100 g d.m.).

2.4. Statistical Analysis

The data collected were submitted to an analysis of variance (ANOVA) test using version 9 of the statistical analysis system (SAS V9.1.3, SAS Institute, Inc., Cary, NC, USA); the difference between the samples was determined using the Student–Newman–Keuls test with the minimum significance level of 1%.
For a visual analysis of the data, a principal component analysis (PCA; PRINCOMP procedure, SAS software V9.1.3, Cary, NC, USA) was performed on mean-centered and standardized (unit variance-scaled) data.
The data matrix submitted to the PCA was made up of 13 observations (thirteen genotypes) and 11 variables (Ramifications per plat (Ram), Height plat (H), pods per plat (PxP), seeds per pod (S × P), weight of seeds per plant (PSeedsXP), thousand-weight seeds (g; TWS), protein production per plant (g; Prot GP), L Dopa production per plant (g; LDopaGP), phenols production per plant (mg; Phen mGP), flavonoids production per plant (mg) (Flav mGP) and condensed tannins per plant (mg; TANN COND mGP).
The results of the PCA are shown as a biplot (StatistiXL, Broadway–Nedlands, Australia).

3. Results

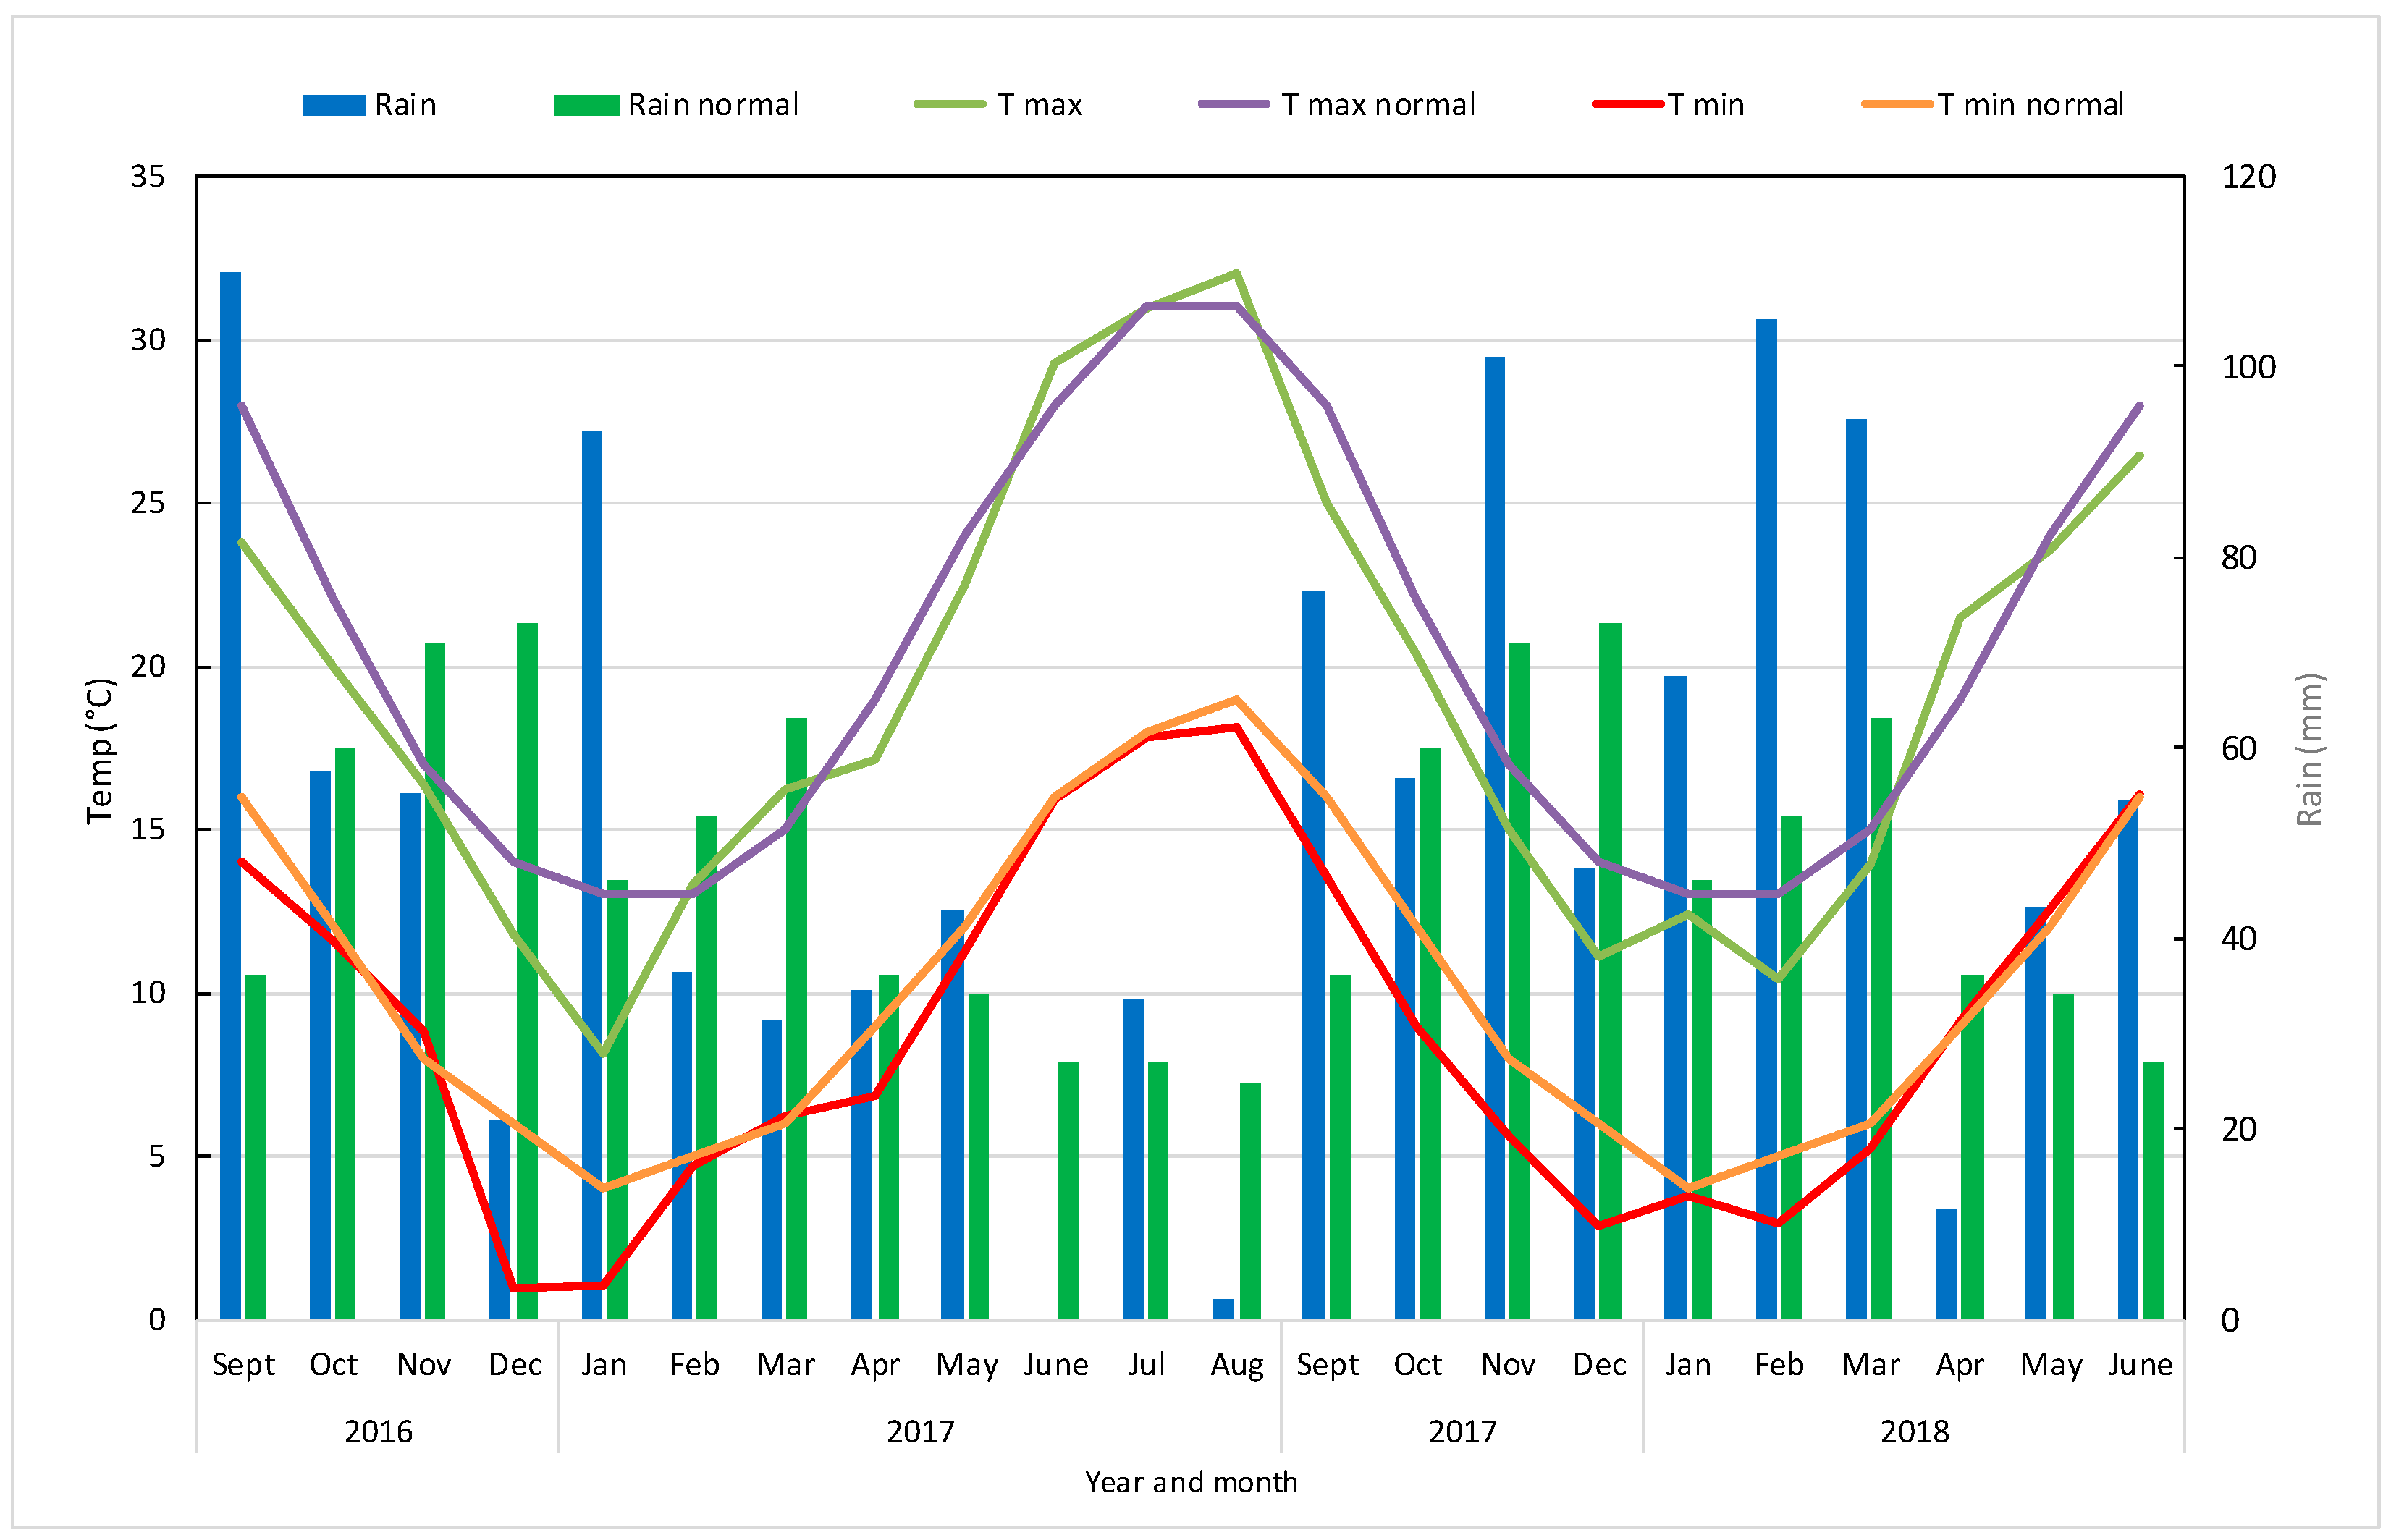
3.1. Meteorological Trend

The temperature and rainfall data for the research period are reported in Figure 1. This showed how, despite normal conditions of 499 mm of precipitation between September and June—with reference to the average for the last 30 years—during the experimental period of the first year, precipitation was 480 mm, while in the second, the total precipitation of the period was 658 mm; there was above-average rain levels during November 2017 and January, March and June 2018.
Regarding temperature, in both years, the minimum and maximum temperature was lower than normal. This condition made it possible to obtain a good cultivation response, showing good grain production levels that were higher than the normal.

3.2. Productive Component Measurements

All the morphological characteristics detected for the 13 landraces of Apulian faba beans are shown in Table 2. For all the parameters, the statistical analysis showed a strong influence of accessions. Only in the density did we find values ranging between 19.2 and 20 plants m−2, and no significative differences between them. Regarding the number of pods per plant, the accessions presented a number ranging between 3.5 and 8.1. FV3 and FV13 yielded the largest number of pods, while for FV2 and FV11, the lowest numbers were recorded. The number of seeds per pod showed less variability than the number of pods and ranged from 2.0 to 4.2 seeds per pod. The lowest number of seeds per pod was found in FV3—2.0 per pod—while in FV10 and FV12, 4.2 and 4.1 seeds per pod were counted.
Very high variability was registered for the number of seeds per plant: FV2 and FV11, with 11.6 and 11.3 seeds per plant, respectively, were the accessions with the lowest values, while FV10 presented the highest with 25.6 seeds.
Relevant differences between the accessions were also found in TSW. The lowest weight was found for F1 (1238.3 g) while the highest weight was found for FV2, FV8 and FV3, with TSW values greater than 2000 g. The highest seed production per m−2 was obtained from the accessions with a number of seeds per plant greater than 20, while it seemed to be less correlated with the TSW. The value ranged between 301.7 to 149.8 g m−2; the highest value was recorded with FV10, while the lowest value was recorded with accession FV11.

3.3. Chemical Characterization

The main chemical characteristics of the faba bean accessions studied are summarized in Table 3. Additionally, in this case, we found a strong influence of the accessions on observed differences. All the parameters studied varied significantly among the accessions, except for the CTC content. The crude protein content varied significantly among all the accessions and ranged from 26.43 (FV5 accession) to 30.10 g 100 g−1 d.m. in FV2. This parameter was influenced by year and was higher in the first year compared to the second.
The total phenolic content (TPC) of Apulian faba beans was, on average, 10.79 mg of GAE g−1 d.m. (Table 2), ranging between 9.41 and 12.67 mg g−1 d.m. The Apulian accessions with the highest phenolic content were FV1 and FV12 (with a mean value of 12.25 mg 100 g−1 d.m.), while FV7 and FV10 presented the lowest content (with a mean value of 9.50 mg 100 g−1 d.m.).
As far as regards the TFC (Table 3), FV5 and FV12 showed a lower flavonoid content (on average 1.210 mg g−1 d.m.)—38% lower than the FV10 accession (1.725 mg CE g−1 d.m.), but not statistically different from the FV2, FV11 and FV13 accessions.
The Content of Condensed Tannins (CTC) varied between 0.965 mg CE g−1 d.m. of FV 4 and 0.742 mg CE g−1 d.m. in FV7. The differences were not significant between the compared landraces.

3.4. L-DOPA Content and L-DOPA Yield

The amount of L-DOPA found in the whole seeds is shown in Figure 2. An analysis of variance revealed highly significant differences for L-DOPA content, ranging between 0.49 and 0.29 g 100 g−1. The year effect was in favor of the first season—with a similar trend in proteins—and in 2016/17, the content was 0.41 g 100 g−1, compared to 0.37 g 100 g−1 in 2017/18.
The L-DOPA content in seeds was significantly higher in FV10 (0.49 g 100 g−1) and FV12 (0.46 g 100 g−1), and lowest in FV3 and FV9 (0.29 g 100 g−1 for both).
The L-DOPA yield of each plant is a product of its concentration in the seeds and its dry weight. The effect of the year was not significant, while the effect of the landrace was very strong. Accordingly, the highest L-DOPA yield was obtained from FV10 (153 mg plant−1 DW), although it was not statistically different from FV7 and FV12—which instead presented an average L-DOPA production of 117 mg plant−1 (Figure 3).

3.5. PCA Analysis

The Principal Component analysis performed showed that the first three principal components (PCs) explained 85.1% of the total variance: principal component 1 (PC1) accounted for 61.7%, while principal component 2 (PC2) accounted for 14.2%.
The PCA biplot (Figure 4) shows the relationships between the parameters considered in this study.
PC1 was correlated with many parameters and strongly correlated between them: weight of seeds per plant (PSeedsXP), protein production per plant (g; Prot GP), L Dopa production per plant (g; LDopaGP), phenol production per plant (mg) (Phen mGP), flavonoid production per plant (mg; Flav mGP) and condensed tannins per plant (mg; TANN COND mGP). PC2 was correlated with plant height (cm; HP) and thousand-seed weight (g; TWS).
Among the accessions, FV10 and FV12 presented a high correlation with seed pods (S × P), while FV2, FV3 and FV8 presented a high correlation with TWS.
FV5, FV6, FV7, FV 10 and FV12 presented a high correlation with LDopa GP, Phen mGP, Flav mGP and TANN COND mGP.

4. Discussion

In this study, a comparison of some properties of faba bean germplasms against their grain productivity and quality provides some interesting information.
Regarding production, the values reported are in line with those of other authors; Karkanis et al. [39] and Mansour et al. [40] report values, in drought conditions, of between 3000 and 4000 kg ha−1. This paper reports a high correlation between the number of pods per plant and productivity, confirming our results that showed higher values in landraces with higher numbers of pods per plants and seeds per pod. Our data reports a lower number of pods per plants with respect to other experiments [24] in similar environments, an aspect influenced by the higher plant density adopted and the better conditions used in terms of the grain yield response.
The chemical composition of the landraces considered and the differences in protein content obtained in this experiment are in line with protein concentrations reported by Almeida et al. [41]—who found values ranging between 26.8 and 27.0 g 100 g−1 d.m.—and with Avola et al. [42], who reported protein quantities in the Sicilian faba accessions ranging between 23.8 and 26.7 g 100 g−1 d.m.
Considering the total flavonoid content (TFC), the results are fully in line with the values found by Siah et al. [43] in Australian faba genotypes, who reported a concentration of TFC of between 10.10 and 18.00 mg CE g−1 d.m.—similar to those reported by Baginsky et al. [44] in immature seeds of faba beans grown in Chile; these were twice the TPCs reported by Borowska et al. [9] in large broad beans (0.530 mg GAE g−1). Data were lower than the values reported by Chaieb et al. [45] in faba bean seeds of Tunisian genotypes and those reported by Almeida et al. [41]. The effect of the germplasm presented differences between landraces that were significant; FV 10 presented higher values of about 1.7 mg CE g−1 d.m.
Unlike TFC, the condensed tannin content (CTC) determined in the 13 accessions of Apulian V. faba did not differ between them. The mean CTC value was 0.871 mg CE g−1 dm., in accordance with the quantity reported by Baginky and others [44], who found CTC values of between 309.28 and 958.77 mg CE kg−1 for Chilean faba varieties. The Apulian genotypes, therefore, may be considered faba beans with a low tannic content (<0.1 mg CE g−1 d.m.), much like European cultivars with white seeds and white flowers [46]—even though the accessions under study are all characterized by flowers with a large black spot on the petals according to our morphological investigation (data not published). Instead, Duc et al. [47] reported that the European cultivars—whose flowers have large black spots on the petals and pale pink, pink or red standards—have a high tannic content (tannin content of 5–10 mg g−1 d.m.).
Regarding studies of L-Dopa content, in similar studies [48,49] on velvet bean seeds (Mucuna pruriens L.) belonging to the same family, a strong influence of genotype on L-DOPA production was detected. Similar results have been reported by Etemadi et al. (2018), while in comparison to those reported by Burbano et al., [22] in samples of V. faba cv Alameda (from Spain) and V. faba cv Diana (from Canada) and by Goyoaga et al. [50], the Apulian accessions presented a content of L-DOPA more than 10 times higher.
The results obtained concerning the content of this functional molecule show significant differences between the compared landraces—both in terms of concentration and yield. This aspect was highlighted in the PCA analysis, where the landraces showing higher L-Dopa content (FV7, FV10 and FV12) showed high correlations between L-Dopa content, phenol content, flavonoid content and condensed tannins content. Significant differences in the L-Dopa content between landraces in a Mediterranean environment have also been confirmed by other studies on fresh broad beans in a Mediterranean environment [24].
The effect of season was reported in some parameters measured—both productive (pods per plants, seed production, TSW) and qualitative (crude proteins, TPC, L Dopa content). Excluding the TSW value, all the parameters were higher during the first season (2016/17)—a fact that can probably be related to the climate, which presented with more regular rainfall during the period from March to May as well as a more regular temperature.

5. Conclusions

In summary, the study carried out and explained in this paper relating to the productive and qualitative components of some Apulian landraces of Vicia faba L. major for dry seed consumption presented interesting results in terms of seed production and qualitative components. The germplasms compared presented differences related to seed production, with FV5, FV6 and FV10 showing higher seed production. Differences were also revealed in terms of seed weight—an interesting aspect for food consumption; FV2, FV3 and FV8 presented a higher value of more than 2000 g.
The genotypes compared also showed a wide variability in terms of their qualitative components, such as protein content, tannin, flavonoid and L-dopa content.
The differences between the landraces were also found across the qualitative parameters studied: protein content, total phenolic compound content and total flavonoid content.
Furthermore, the presence among the seeds of several germplasms with very high quantities of L-DOPA further highlights opportunities for their promotion in suitable applications in the field of foods with functional properties and for obtaining natural extracts.
These latter components, defined as “functional”, open up new scenarios in the enhancement of agro-biodiversity, with the possibility of offering traditional products with local history to consumers that can have a positive effect on human health.
Future research activities could be aimed at studying possibilities for the evaluation of agronomical strategies, i.e., for nutrition, which—combined with the germplasm—could help us obtain seeds rich in active compounds of functional interest.

Author Contributions

Author Contributions: Conceptualization, G.D.M., F.D.C.; methodology, L.T., F.D.C., software, L.T.; validation, L.T., C.R., G.D.M.; investigation, F.D.C.; data curation F.D.C.; writing—original draft preparation, G.D.M., C.R., L.T.; writing—review and editing, L.T., C.R.; funding acquisition, G.D.M., C.P. All authors have read and agreed to the published version of the manuscript.

Funding

This research was funded by the European Union under Measure 10.2.1 PSR Puglia 2014–2020, “Programme for the conservation and the valorization of the genetic resources in agriculture” Project title: Recovery, characterization, preservation and valorisation of legumes and cereals for grain production and forage in Puglia—Acronym: SaVeGraINPu-glia.

Institutional Review Board Statement

Not applicable.

Informed Consent Statement

Not applicable.

Data Availability Statement

Not applicable.

Conflicts of Interest

The authors declare no conflict of interest.

References

  1. FAOSTAT. Statistical Data. Food and Agriculture Organization of the United Nations. 2017. Available online: http://faostat.fao.org (accessed on 4 September 2019).
  2. Eurostat. Database. European Commission. Brussels, Belgium. 2019. Available online: https://ec.europa.eu/eurostat/data/database (accessed on 4 September 2019).
  3. Dhull, S.B.; Kidwai, M.K.; Noor, R.; Chawla, P.; Rose, P.K. A review of nutritional profile and processing of faba bean (Vicia faba L.). Legume Sci. 2021, 4, e129. [Google Scholar] [CrossRef]
  4. Giménez, M.A.; Drago, S.R.; De Greef, D.; Gonzalez, R.J.; Lobo, M.O.; Samman, N.C. Rheological, functional and nutritional properties of wheat/broad bean (Vicia faba) flour blends for pasta formulation. Food Chem. 2012, 134, 200–206. [Google Scholar] [CrossRef]
  5. Lizarazo Torres, C.; Lampi, A.-M.; Liu, J.; Sontag-Strohm, T.; Piironen, V.; Stoddard, F. Nutritive quality and protein production from grain legumes in a boreal climate. J. Sci. Food Agric. 2015, 95, 2053–2064. [Google Scholar] [CrossRef] [PubMed]
  6. Dillard, C.J.; German, J.B. Phytochemicals: Nutraceuticals and human health. J. Sci. Food Agric. 2000, 80, 1744–1756. [Google Scholar] [CrossRef]
  7. Madhujith, T.; Amarowicz, R.; Shahidi, F. Phenolic antioxidants in beans and their effects on inhibition of radical induced DNA damage. J. Am. Oil Chem. Soc. 2004, 81, 691–696. [Google Scholar] [CrossRef]
  8. Abu-Reidah, I.M.; Contreras, M.M.; ArráezRomán, D.; Fernández-Gutiérrez, A. UHPLCESI-QTOF-MS-based metabolic profiling of Vicia faba L. (Fabaceae) seeds as a key strategy for characterization in foodomics. Electrophoresis 2014, 35, 1571–1581. [Google Scholar] [CrossRef]
  9. Borowska, J.; Giczewska, A.; Zadernowski, R. Nutritional value of broad bean seeds. Part 2: Selected biologically active components. Nahr. Food 2003, 47, 98–101. [Google Scholar] [CrossRef]
  10. Merghem, R.; Jay, M.; Brun, N.; Voirin, B. Qualitative analysis and HPLC isolation and identification of procyanidins from Vicia faba. Phytochem. Anal. 2004, 15, 95–99. [Google Scholar] [CrossRef]
  11. Arts, I.C.W.; van de Putte, B.; Hollman, P.C.H. Catechin contents of foods commonly consumed in the Netherlands. 1. Fruits, vegetables, staple foods, and processed foods. J. Agric. Food Chem. 2000, 48, 1746–1751. [Google Scholar] [CrossRef]
  12. Karamac, M.; Kosinska, A.; Rybarczyk, A.; Ryszard, A. Extraction and chromatograhic separation of tannin fractions from tannin-rich plant material. Pol. J. Food Nutr. Sci. 2007, 57, 471–474. [Google Scholar]
  13. J Tebib, K.; Bitri, L.; Besançon, P. Rouanet. Polymeric grape seed tannins prevent plasma cholesterol changes in high-cholesterol-fed rats. Food Chem. 1994, 49, 403–406. [Google Scholar] [CrossRef]
  14. Papadopoulou, A.; Frazier, R.A. Characterization of protein–polyphenol interactions. Trends Food Sci. Technol. 2004, 15, 186–190. [Google Scholar] [CrossRef]
  15. Singh, A.K.; Bharati, R.C.; Manibhushan, N.C.; Pedpati, A. An assessment of faba bean (Vicia faba L.) current status and future prospect. Afr. J. Agric. Res. 2013, 8, 6634–6641. [Google Scholar]
  16. Mohseni-Mehran, S.M.; Golshani, B. Simultaneous determination of Levodopa and Carbidopa from fava bean, green peas and green beans by high per formance liquid gas chromatography. J. Clin. Diagn. Res. 2013, 7, 1004–1007. [Google Scholar]
  17. Etemadi, F.; Masoud, H.; Randhir, R.; ZandVakili, O.; Ebadi, A. Accumulation of L-DOPA in various organs of faba bean and influence of drought, nitrogen stress, and processing methods on L-DOPA yield. Crop J. 2018, 6, 426–434. [Google Scholar] [CrossRef]
  18. Knowles, W.S. Asymmetric Hydrogenations—The Monsanto L-Dopa Process. In Asymmetric Catalysis on Industrial Scale; Blaser, H.-U., Schmidt, E., Eds.; Wiley-VCH Verlag GmbH Co. KGaA: Weinheim, Germany, 2004; pp. 21–38. [Google Scholar]
  19. Parkinson’s Disease Drugs Market. Available online: https://www.fortunebusinessinsights.com/enquiry/request-sample-pdf/parkinson-s-disease-387drugs-market-100655 (accessed on 20 October 2019).
  20. Patil, S.A.; Apine, O.A.; Surwase, S.N.; Jadhav, J.P. Biological sources of L-DOPA: An alternative approach. Adv. Park. Dis. 2013, 2, 81–87. [Google Scholar] [CrossRef]
  21. Apaydin, H.; Ertan, S.; Özekmekçi, S. Broad bean (Vicia faba)—A natural source of L-392 DOPA-prolongs ‘on’ periods in patients with Parkinson’s disease who have ‘on-off’ fluctuations. Mov. Disord. 2000, 15, 164–166. [Google Scholar] [CrossRef] [PubMed]
  22. Burbano, C.; Cuadrado, C.; Muzquiz, M.; Cubero, J.I. Variation of favism-inducing factors (vicine, convicine and L-DOPA) during pod development in Vicia faba L. Plant Foods Hum. Nutr. 1995, 47, 265–275. [Google Scholar] [CrossRef]
  23. Polanowska, K.; Łukasik, R.M.; Kuligowski, M.; Nowak, J. Development of a sustainable, simple, and robust method for efficient L-DOPA extraction. Molecules 2019, 24, 2325. [Google Scholar] [CrossRef]
  24. De Cillis, F.; Leoni, B.; Massaro, M.; Renna, M.; Santamaria, P. Yield and quality of faba bean (Vicia faba L. var. major) genotypes as a vegetable for fresh consumption: A comparison between Italian landraces and commercial varieties. Agriculture 2019, 9, 253. [Google Scholar] [CrossRef]
  25. Randhir, R.; Shetty, P.; Shetty, K. L-DOPA and total phenolic stimulation in dark germinated fava bean in response to peptide and phytochemical elicitors. Process Biochem. 2002, 37, 1247–1256. [Google Scholar] [CrossRef]
  26. Randhir, R.; Shetty, K. Microwave-induced stimulation of L-DOPA, phenolics and antioxidant activity in fava bean (Vicia faba) for Parkinson’s diet. Process Biochem. 2004, 39, 1775–1784. [Google Scholar] [CrossRef]
  27. Database “SaVeGraINPuglia”. Available online: http://bancadati.savegrainpuglia.it/it/signin (accessed on 10 February 2023).
  28. Signore, A.; Renna, M.; Santamaria, P. Agrobiodiversity of vegetable crops: Aspect, needs, and future perspectives. Annu. Plant Rev. Online 2019, 2, 1–24. [Google Scholar] [CrossRef]
  29. ISTA. International Rules for Seed Testing, 2016 ed.; International Seed Testing Association: Basserdorf, Switzerland, 2016. [Google Scholar]
  30. AOAC (Association of Official Agricultural Chemists). Official Methods of Analysis of AOAC International, 17th ed.; AOAC International: Gaitherburg, MD, USA, 2000; Volume I. [Google Scholar]
  31. Lavelli, V.; Hidalgo, A.; Pompei, C.; Brandolini, A. Radical scavenging activity of einkorn (Triticum monococcum L. subsp. monococcum) wholemeal flour and its relationship to soluble phenolic and lipophilic antioxidant content. J. Cereal Sci. 2009, 49, 319–321. [Google Scholar] [CrossRef]
  32. Hidalgo, A.; Brandolini, A.; Pompei, C.; Piscozzi, R. Carotenoids and tocols of einkorn wheat (Triticum monococcum ssp. monococcum L.). J. Cereal Sci. 2006, 44, 182–193. [Google Scholar] [CrossRef]
  33. Roberts, I.M. Iso-butanol saturated water: A simple procedure for increasing staining intensity of resin sections for light and electron microscopy. J. Microsc. 2002, 207, 97–107. [Google Scholar] [CrossRef]
  34. Xu, B.J.; Chang, S.K.C. A Comparative Study on Phenolic Profiles and Antioxidant Activities of Legumes as Affected by Extraction Solvents. J. Food Sci. 2007, 72, 159–166. [Google Scholar] [CrossRef]
  35. Singleton, V.L.; Orthofer, R.; Lamuela-Raventos, R.M. Analysis of total phenols and other oxidation substrates and antioxidants by means of Folin-Ciocalteu reagent. Methods Enzymol. 1999, 299, 152–178. [Google Scholar] [CrossRef]
  36. Heimler, D.; Vignolini, P.; Dini, M.G.; Romani, A. Rapid tests to assess the antioxidant activity of Phaseolus vulgaris L. dry beans. J. Agric. Food Chemestry 2005, 53, 3053–3056. [Google Scholar] [CrossRef]
  37. Broadhurst, R.B.; Jones, W.T. Analysis of condensed tannins using acidified vanillin. J. Sci. Food Agric. 1978, 29, 788–794. [Google Scholar] [CrossRef]
  38. Marquardt, R.R.; Frohlich, A.A. Rapid reversed-phase high-performance liquid chromatography method for the quantitation of vicine, convicine and related compounds. J. Chromatogr. A 1981, 208, 373–379. [Google Scholar] [CrossRef]
  39. Karkanis, A.; Ntatsi, G.; Lepse, L.; Fernández, J.A.; Vågen, I.M.; Rewald, B.; Savvas, D. Faba bean cultivation–revealing novel managing practices for more sustainable and competitive European cropping systems. Front. Plant Sci. 2018, 9, 1115. [Google Scholar] [CrossRef] [PubMed]
  40. Mansour, E.; Desoky, E.S.M.; Ali, M.M.; Abdul-Hamid, M.I.; Ullah, H.; Attia, A.; Datta, A. Identifying drought-tolerant genotypes of faba bean and their agro-physiological responses to different water regimes in an arid Mediterranean environment. Agric. Water Manag. 2021, 247, 106754. [Google Scholar] [CrossRef]
  41. Almeida, D.; Greiner, R.; Furtunado, D.; Trigueiro, I.; Araújo, M. Content of some antinutritional factors in bean cultivars frequently consumed in Brazil. Int. J. Food Sci. Technol. 2008, 43, 243–249. [Google Scholar] [CrossRef]
  42. Avola, G.; Gresta, F.; Abbate, V. Diversity examination based on physical, technological and chemical traits in a locally grown landrace of faba bean (Vicia faba L. var. major). Int. J. Food Sci. Technol. 2009, 44, 2568–2576. [Google Scholar] [CrossRef]
  43. Siah, S.; Wood, A.J.; Agboola, S.; Konczak, I.; Blanchard, C.L. Effects of soaking, boiling and autoclaving on the phenolic contents and antioxidant activities of faba beans (Vicia faba L.) differing in seed coat colours. Food Chem. 2014, 142, 461–468. [Google Scholar] [CrossRef]
  44. Baginsky, C.; Pena-Neira, A.; Cáceres, A.; Hernández, T.; Estrella, I.; Moralesb, H.; Pertuzé, R. Phenolic compound composition in immature seeds of fava bean (Vicia faba L.) varieties cultivated in Chile. J. Food Compos. Anal. 2013, 31, 1–6. [Google Scholar] [CrossRef]
  45. Chaieb, N.; González, J.L.; López-Mesas, M.; Bouslama, M.; Valiente, M. Polyphenols content and antioxidant capacity of thirteen faba bean (Vicia faba L.) genotypes cultivated in Tunisia. Food Res. Int. 2011, 44, 970–977. [Google Scholar] [CrossRef]
  46. Bond, D.A.; Duc, G. Plant breeding as a means of reducing antinutritional factors in grain legumes. In Recent Advances of Research in Antinutritional Factors in Legume Seeds; Van der Poel, A.F.B., Huisman, J., Raini, H.S., Eds.; Wageningen Pers (Pbs.): Wageningen, The Netherlands, 1993; pp. 379–396. [Google Scholar]
  47. Duc, G.; Marget, P.; Esnault, R.; Le Guen, J.; Bastianelli, D. Genetic variability for feeding value of faba bean seeds (Vicia faba L.): Comparative chemical composition of isogenics involving zero-tannin and zero-vicine genes. J. Agric. Sci. 1999, 133, 185–196. [Google Scholar] [CrossRef]
  48. Capo-chichi, E.M.; Carsky, R.J.; Gilbert, R.A.; Maasdorp, B. Effect of genotype and environment on L-DOPA Concentration in Mucunas’s (Mucuna sp.) seeds. Trop. Subtrop. Agroecosyst. 2003, 1, 319–328. [Google Scholar]
  49. Chinapolaiah, A.; Hima Bindu, K.; Manjesh, G.N.; Thondaiman, V.; Keshava, R.V.; Hariprasad, R.N.; Sudheer, K.S. Variability in L-Dopa and other biochemical composition of Mucuna pruriens (L.) an underutilized tropical legume. Ind. Crops Prod. 2019, 138, 111447. [Google Scholar] [CrossRef]
  50. Goyoaga, C.; Burbano, C.; Cuadrado, C.; Alejandro, V.; Guillamón, E.; Pedrosa, M.M.; Muzquiz, M. Content and distribution of vicine, convicine and L-DOPA during germination and seedling growth of two Vicia faba L. Varieties. Eur. Food Res. Technol. 2008, 227, 1537–1542. [Google Scholar] [CrossRef]
Figure 1. Temperature trend (max = maximum; min = minimum; avg = average) and rainfall during the period of the experiment.
Horticulturae 09 00601 g001
Figure 2. L-DOPA content in Apulian faba bean germplasm: the values are the means of three observations in the 2016/17 and 2017/18 seasons. Means followed by the same letter do not differ significantly (p < 0.01) according to the Student-Neuman Keuls-analysis.
Horticulturae 09 00601 g002
Figure 3. L-DOPA productivity of Apulian faba bean germplasm: the values are means of triplicate analyses per year on each landrace. Means followed by the same letter within a column do not differ significantly (p ≤ 0.01) according to the Student-Neuman-Keuls analysis.
Horticulturae 09 00601 g003
Figure 4. Principal component analysis (PCA) describing the relationships between the physical and chemical parameters of thirteen genotypes of faba bean (Vicia faba L. var. major) (a): PC1 vs. PC2 (b): PC1 vs. PC3. Legend: LDopaYP: Yield L-Dopa per plant, Cond Tann YP: Condensed Tannins Yield per plant, ProtYP: Protein Yield per plant, FlavYP Flavonoids Yield per plant, WSeeds × P: Weight seeds per plant, PhenolsYP: Phenols Yield per plant, Pods × Plant; number pods per plant, Ram: Ramifications, H: Plant height, TSW; Thousand seeds weight, Seeds × pods: Number of seeds per pods.
Horticulturae 09 00601 g004
Table 1. Collection sites of the Apulian faba bean accessions.
Accession CodeCollection SitesLatitudeLongitude* Altitude m.a.s.l.
FV1Carpino (FG)41°50′393″ N15°50′284″ E56
FV2Locorotondo (BA)–Battaglini district40°44′368″ N17°19′001″ E365
FV3Locorotondo (BA)–Ritunno district40°44′435″ N17°19′089″ E367
FV4Locorotondo (BA)–San Marco district40°47′235″ N17°19′304″ E370
FV5Locorotondo (BA)–Sant’Elia district40°45′704″ N17°18′164″ E395
FV6Locorotondo (BA)–Spiano district40°45′079″ N17°17′858″ E401
FV7Locorotondo (BA)–Spiano viola district40°45′079″ N17°17′858″ E401
FV8Locorotondo (BA)–Tommasone district40°44′701″ N17°18′715″ E388
FV9Putignano (BA)40°50′167″ N17°00′313″ E310
FV10San Donato (LE)40°08′796″ N18°15′238″ E82
FV11Troia (FG)41°24′552″ N15°23′719″ E211
FV12Zollino (LE)40°08′868″ N18°15′067″ E78
FV13Altamura (BA)40°53′805″ N16°23′678″ E422
* Altitude m.a.s.l.: Altitude meters above sea level.
Table 2. Productive characteristics of the Apulian faba bean accessions.
AccessionsPlant DensityPodsSeedsGrain ProductionTSW
(n m−2)(n. plant−1)(n. pod−1)(n. plant−1)(g. m−2)(g)
FV120.0 a6.1 b–d3.0 b18.2 e,f398.1 b,c1238.3 h
FV219.6 a4.0 e,f2.9 b11.6 h426.3 b,c2089.4 a
FV319.2 a8.6 a2.0 c17.4 f593.0 a–c2002.7 b
FV420.0 a6.0 c,d2.9 b17.2 f582.2 a–c1884.3 c
FV519.2 a6.6 b–d3.5 b22.9 b686.9 a1705.4 e
FV619.4 a7.5 a–c3.1 b22.9 b670.8 a1668.2 e
FV719.6 a6.5 b–d3.0 b19.7 d655.6 a,b1909.1 c
FV819.4 a4.9 d–f3.2 b15.5 g560.5 a–c2063.8 a
FV919.2 a5.5 c–e3.4 b18.7 d572.5 a–c1778.5 d
FV1019.6 a6.25 b–d4.1 a25.6 a666.6 a1498.0 g
FV1120.0 a3.5 f3.2 b11.3 h322.2 c1602.0 f
FV1219.6 a5.0 d–f4.2 a21.0 c554.1 b,c1487.4 g
FV1319.2 a8.1 a,b3.0 b24.5 a,b639.7 a,b1513.0 g
Year effect (Y)ns*nsns***
Accession effect (A)ns*************
A X Ynsnsnsnsns*
Values are the means of triplicate analyses for each sample. Means followed by the same superscript letter within a column do not differ significantly (p < 0.01) according to the Student–Neuman–Keuls analysis. TSW: thousand-seed weight. *, **, ***—non-significant or significant at p ≤ 0.05, 0.01, and 0.001, respectively.
Table 3. Biochemical composition of the Apulian faba bean accessions.
AccessionsCrude ProteinsTPCTFCCTC
g 100 g−1 d.m.mg GAE g−1 d.m.mg CE g−1 d.m.mg CE g−1 d.m.
FV127.94 f–h12.35 a1.681 a,b0.779 a
FV230.10 a10.61 a–c1.381 b,c0.921 a
FV326.68 g,h12.20 a,b1.586 a,b0.822 a
FV427.65 e10.40 b1.503 a,b0.965 a
FV526.43 h11.46 a,b1.300 b,c0.830 a
FV627.40 e,f9.41 c1.661 a,b0.887 a
FV727.03 f,g10.60 a–c1.553 a,b0.742 a
FV828.3 c,d10.35 b,c1.656 a,b0.868 a
FV926.57 g,h11.57 a,b1.572 a,b0.952 a
FV1028.3 c,d9.59 b,c1.725 a0.954 a
FV1127.82 d,e10.88 a–c1.483 a,b,c0.882 a
FV1228.96 b12.67 a1.121 c0.820 a
FV1328.48 c10.52 a,b,c1.472 b,c0.899 a
Year effect (Y)***nsns
Accession effect (A)*********
A X Ynsnsnsns
Values are means of triplicate analyses for each sample. Means followed by the same superscript letter within a column do not differ significantly (p < 0.01) according to the Student–Neuman–Keuls analysis. TPC: total phenolic content. TFC: total flavonoid content. CTC: condensed tannins content. *, **, ***—non-significant or significant at p ≤ 0.05, 0.01, and 0.001, respectively.
Disclaimer/Publisher’s Note: The statements, opinions and data contained in all publications are solely those of the individual author(s) and contributor(s) and not of MDPI and/or the editor(s). MDPI and/or the editor(s) disclaim responsibility for any injury to people or property resulting from any ideas, methods, instructions or products referred to in the content.

