Article

Photosynthesis, Biochemical and Yield Performance of Grapevine Hybrids in Two Rootstock and Trellis Height

by
Francisco José Domingues Neto
1,*,
Adilson Pimentel Junior
1,
Lenon Romano Modesto
2,
Mara Fernandes Moura
3,
Fernando Ferrari Putti
4,
Carmen Silvia Fernandes Boaro
5,
Elizabeth Orika Ono
5,
João Domingos Rodrigues
5 and
Marco Antonio Tecchio
1
1
School of Agriculture, São Paulo State University (UNESP), José Barbosa de Barros Street, Botucatu 18610-307, SP, Brazil
2
Plant Genetic Resources, Federal University of Santa Catarina (UFSC), Road Admar Gonzaga, Florianópolis 88040-900, SC, Brazil
3
Agronomic Institute of Campinas (IAC), Street Luiz Pereira do Santos 1500, Jundiaí 13214-820, SP, Brazil
4
School of Sciences and Engineering, São Paulo State University (UNESP), Tupã 17602-496, SP, Brazil
5
Institute of Biosciences, São Paulo State University (UNESP), Botucatu 18610-307, SP, Brazil
*
Author to whom correspondence should be addressed.
Horticulturae 2023, 9(5), 596; https://doi.org/10.3390/horticulturae9050596
Submission received: 2 May 2023 / Revised: 15 May 2023 / Accepted: 16 May 2023 / Published: 18 May 2023
(This article belongs to the Special Issue Orchard Management under Climate Change)

Abstract

:
The interaction between variety, rootstock, and trellis height is important for grapevine management, mainly for producing new varieties of grapes for juice and wine in new wine-growing regions with high production potential. Then, this study aimed to evaluate the rootstocks and trellis height influence on photosynthesis, biochemical, and yield performance for grapevine hybrids. The experiment was carried out in a randomized block design using two factors, rootstocks (‘IAC 766’ and ‘106-8 Mgt’) and trellis height (until 1.6 and 2.0 m), evaluated for two grapevine hybrids (IAC 138-22 ‘Maximo’ and ‘BRS Violeta’). During grapevine flowering, it was evaluated photosynthesis and biochemical performance, for this, the gaseous exchanges were measured using the open system photosynthesis equipment with a CO2 analyzer and water vapor by infrared radiation, being net assimilation rate of CO2, stomatal conductance, transpiration rate, internal CO2 concentration, water use efficiency, carboxylation efficiency (Rubisco), and the flux density of photosynthetically active photons. At the stages of grapevine flowering and ripening berries were evaluated the antioxidant enzymes (peroxidase (POD), superoxide dismutase (SOD), and catalase (CAT)), total soluble proteins, chlorophylls, and SPAD. The interaction between rootstock and trellis heigh influenced varieties’ photosynthesis, biochemical, and yield performance. In conclusion under subtropical conditions, better photosynthesis, biochemical, and yield performance were observed when both cultivars were grafted on the ‘IAC 766’ rootstock. The ‘IAC 138-22 Maximo’ was trained until 2.0 and grafted on the ‘IAC 766’ rootstock, increasing grape production and photosynthesis efficiency. In addition, this variety was more productive than ‘BRS Violeta’.

1. Introduction

Grapevine hybrids are widely used in viticulture for wine and juice production, looking for adaptation to climate change and disease resistance, resulting in lower environmental impact and food security because of the pesticides reduction [1,2,3]). These grapevine varieties are growing mainly for the juice industry and table grape production [4]. However, in tropical and subtropical regions grapevine hybrids are also destined to make wine [5]. Like in the case of Vitis vinifera (L.) cultivation, grapevine hybrids are grown on rootstocks to get resistance against Phylloxera, soil fungi, and nematodes [6,7]. In addition, the rootstock is chosen based on adaptation to environmental conditions and field management [5,8,9], in this way, new viticultural and promising areas for producing these grapes must be explored. In subtropical regions, the rootstocks are selected to be resistant to phylloxera and adapted to a humid temperate climate with dry winters and hot summers [5,6]. The interaction between cultivars and rootstocks influences photosynthesis efficiency, grapevine physiology, and production [10]. The rootstock changes the production of biochemical compounds linked with physiological stress during grapevine cultivation [11,12], occurring when grapevines suffer from stress are a decrease in photosynthesis efficiency and pigment production, modifying enzymatic activity, such as Rubisco and reactive oxygen species (ROS) [11]. Moreover, the variety decreases the stomatal conductance and increases the leaf resistance to CO2 transport from the atmosphere to the mesophyll cells [12]; resulting in lower ATP availability that affects ribulose-1,5-bisphosphate (RuBP) regeneration, thus limiting the rate of CO2 fixation [12]. Furthermore, the interaction between cultivar and rootstock changes ROS activity, which plays a role in the signaling route, as a key regulator of processes such as growth, development, and plant metabolism [13].
Another factor that influences grapevine adaptation in different regions is the training system [14]. The training system influences grapevine reserves, leaf development, and photosynthesis efficiency, resulting in changes in enzymatic activity [4,11,15]. Vertical shoot positioning (VSP) is the most used trellis system to grow grapevines in Brazil [4,9]. In this trellis system, the grapevine can be trained in different sizes to adapt to vegetative growth [16]. The Vitis vinifera cultivars are trained until 1.35 to 1.60 m from de ground [17]. The Vitis labrusca under subtropical conditions are trained until 1.00 to 1.80 m from the ground [12,18,19]. However, the hybrids can be more vigorous than these two species, then new training high needs to be tested (e.g., 2.00 m). In addition, vegetative growth depends on the interaction between different varieties and rootstocks. This study aimed to evaluate the physiology, fruit production, and quality of two grapevine hybrids trained in two trellis sizes and grafted onto two rootstocks under subtropical conditions looking for better adaption during grapevine cultivation.

2. Materials and Methods

2.1. Localization and Climate Conditions

The experiment was conducted at the Fruits Research Center of the Agronomic Institute (IAC), in Jundiaí, state of São Paulo, Brazil (23°06′ S, 46°55′ W, 745 m above sea level). The climate in this region is classified as Cfb, according to the Köppen, with 1400 mm of annual rainfall, 19.5 °C of average temperature, and 70.6% of relative air humidity. The soil of the experimental area was classified as dystrophic Cambisol haplic, characterized by low amounts of clay, organic matter, aluminum, and iron.
Rootstocks were planted in September 2009, at a spacing of 2.5 m between rows and 1.0 m between plants, and the cultivars were grafted in July 2010. For grape yield, the grapevines were pruned in July 2016 leaving one bud per branch and 5% hydrogen cyanamide was applied direct on the buds to homogenize sprouting. The grape harvest was conducted in December of the same year.

2.2. Treatments

The experiment was laid out in a complete randomized block using two inter-specific crossing of grapevine varieties, the ‘IAC 138-22 Maximo’ (‘Seibel 11342’ × ‘Syrah’) and the ‘BRS Violeta’ (‘Niagara Rosada’ × ‘Bordô’), with five replicates (blocks), consisting of three plants each. The treatments were two rootstocks, ‘IAC 766 Campinas’ (‘Ripária do Traviú’ × Vitis caribaea) and ‘106-8 Mgt’ [Riparia × (Cordifolia × Rupestris)] and two trellis height, until 1.6 m and 2.0 m from the ground, evaluated for each variety. The grapevines were trimmed during vegetative growth to maintain the trellis height, in both varieties.

2.3. Sampling

In the full flowering stage, the photosynthesis and biochemical assay were conducted using four complete leaves (limb and petiole) located on the opposite side of the bunch using three grapevines per block for each treatment with replicate per variety (n = 60 leaves per treatment). In addition, the SPAD index (Soil Plant Analysis Development) and biochemical assay were evaluated again in the same leaves during early berry ripening (grape maturation). The photosynthesis assay was conducted on the field using no detached leaves. For the biochemical assay, leaves were sampled, packed in foil, frozen in liquid nitrogen, and stored in an ultra-freezer at −82 °C until evaluation.

2.3.1. Photosynthesis Assay

The photosynthesis assay was conducted with an open photosynthesis system using the Infrared gas analyzer (IRGA) (model LI-64009, USA). The CO2 assimilation rate (A), transpiration rate (E), the internal concentration of CO2 (Ci), and stomatal conductance (gs), were calculated according to Von Caemmerer and Farquhar [20]. The water efficiency use (WUE) was determined using the ratio between CO2 assimilation and transpiration rate. The carboxylation efficiency of the enzyme ribulose 1,5-bisphosphate carboxylase (Rubisco) (A/Ci) was calculated using the ratio between the CO2 assimilation rate and the internal concentration of CO2 in the leaf. For chlorophyll fluorescence, the leaves were covered with aluminum paper, kept in the dark for 30 min, and treated for 6 s with a saturation pulse of 10,000 μmol m−2 s−1 of photosynthetically active photon flux density (DFFF) to obtain the dark-adapted maximum fluorescence (Fm), the light-adapted maximum fluorescence (Fm’), the dark-adapted minimum fluorescence (Fo) and the light-adapted minimum fluorescence (Fo’). An 1150 μmol m−2 s−1 DFFF actinic light pulse of 15 s of duration was given between each saturation pulse. The maximum quantum yield (Fv/Fm) was calculated according to Kitajima and Butler [21], the effective quantum yield (ϕPSII) was calculated according to Genty et al. [22], the photochemical quenching (qP) was calculated according to Schreiber et al. [23], the non-photochemical quenching (NPQ) was calculated according to Bilger and Björkman [24], The electron transport rate (ETR) and quantum unregulated non-photochemical energy loss in photosystem II (ϕNO) were calculated according to Klughammer and Schreiber [25]. The quantum yield of non-photochemical regulated energy loss in photosystem II (ϕNPQ) was calculated according to Klughammer and Schreiber [25].
The SPAD index was evaluated using the SPAD (Model SPAD-502, Hangzhou Mindfull Technology Co.,Ltd, Tokyo, Japan) to sample three points (left, middle and right size) per leaf (n = 180).

2.3.2. Biochemical Assay

The biochemical assay was conducted using spectrophotometry (model BEL Photonics, SP UV/VIS, Brazil) and all analyses were done using technical triplicate.
The concentration of chlorophylls (a, b, and total) was determined using 100 g of fresh mass according to Sims and Gamon [26]. For protein and enzyme quantification, it was mixed 100 mg of fresh leaf and 2 mL of 0.1 mol L−1 potassium phosphate buffer at pH 6.8 with the addition of 100 mg polyvinylpolypyrrolidone (PVPP). Total soluble proteins were quantified according to the methodology proposed by Bradford [27] and expressed in mg of fresh mass g−1 protein. Superoxide dismutase (SOD) activity was determined according to the methodology proposed by Giannopolitis and Ries [28] and expressed in U/mg protein. Peroxidase (POD) activity was determined according to Teisseire and Guy [29] and expressed as μmol of purpurogaline min−1 mg−1 protein. Catalase activity (CAT) was performed according to the methodology proposed by Peixoto et al. [30] and expressed in μKatμg prot−1. In the case of lipid peroxidation quantification, it was mixed 300 mg of fresh leaves and 5 mL of a solution containing 0.25% thiobarbituric acid (TBA) and trichloroacetic acid (TCA) at 10%. Lipid peroxidation (TBAR) was determined according to Rama Devi and Prasad [31] and expressed in μmol g−1 fresh mass.

2.4. Harvest, Yield, and Must Quality

Harvest was carried out when each grapevine hybrid reached its technological maturity. All bunches per plant were harvested and weighed to determine yield. In order to determine fruit quality, 10 bunches per plant were sampled (n = 1500 bunches per treatment) to evaluate the pH, soluble solids (SS), titratable acidity (TA), SS/TA ratio, and reducing sugar [32].

2.5. Statistical Analyses

The data was checked about normal distribution and homoscedasticity. Then, the data were analyzed using the variance analysis for two factors in randomized blocks. When significant in the variance analysis, the interaction between the two factors (rootstock and trellis height) or each factor separately was evaluated using Tukey’s test (p < 0.05). In addition, principal component analysis was performed to characterize the interaction between the grapevine hybrids with each rootstock and trellis height. The variance and Tukey’s tests were performed using the software SISVAR (Ferreira, 2014). The principal components analysis was performed using the software SAS [33].

3. Results

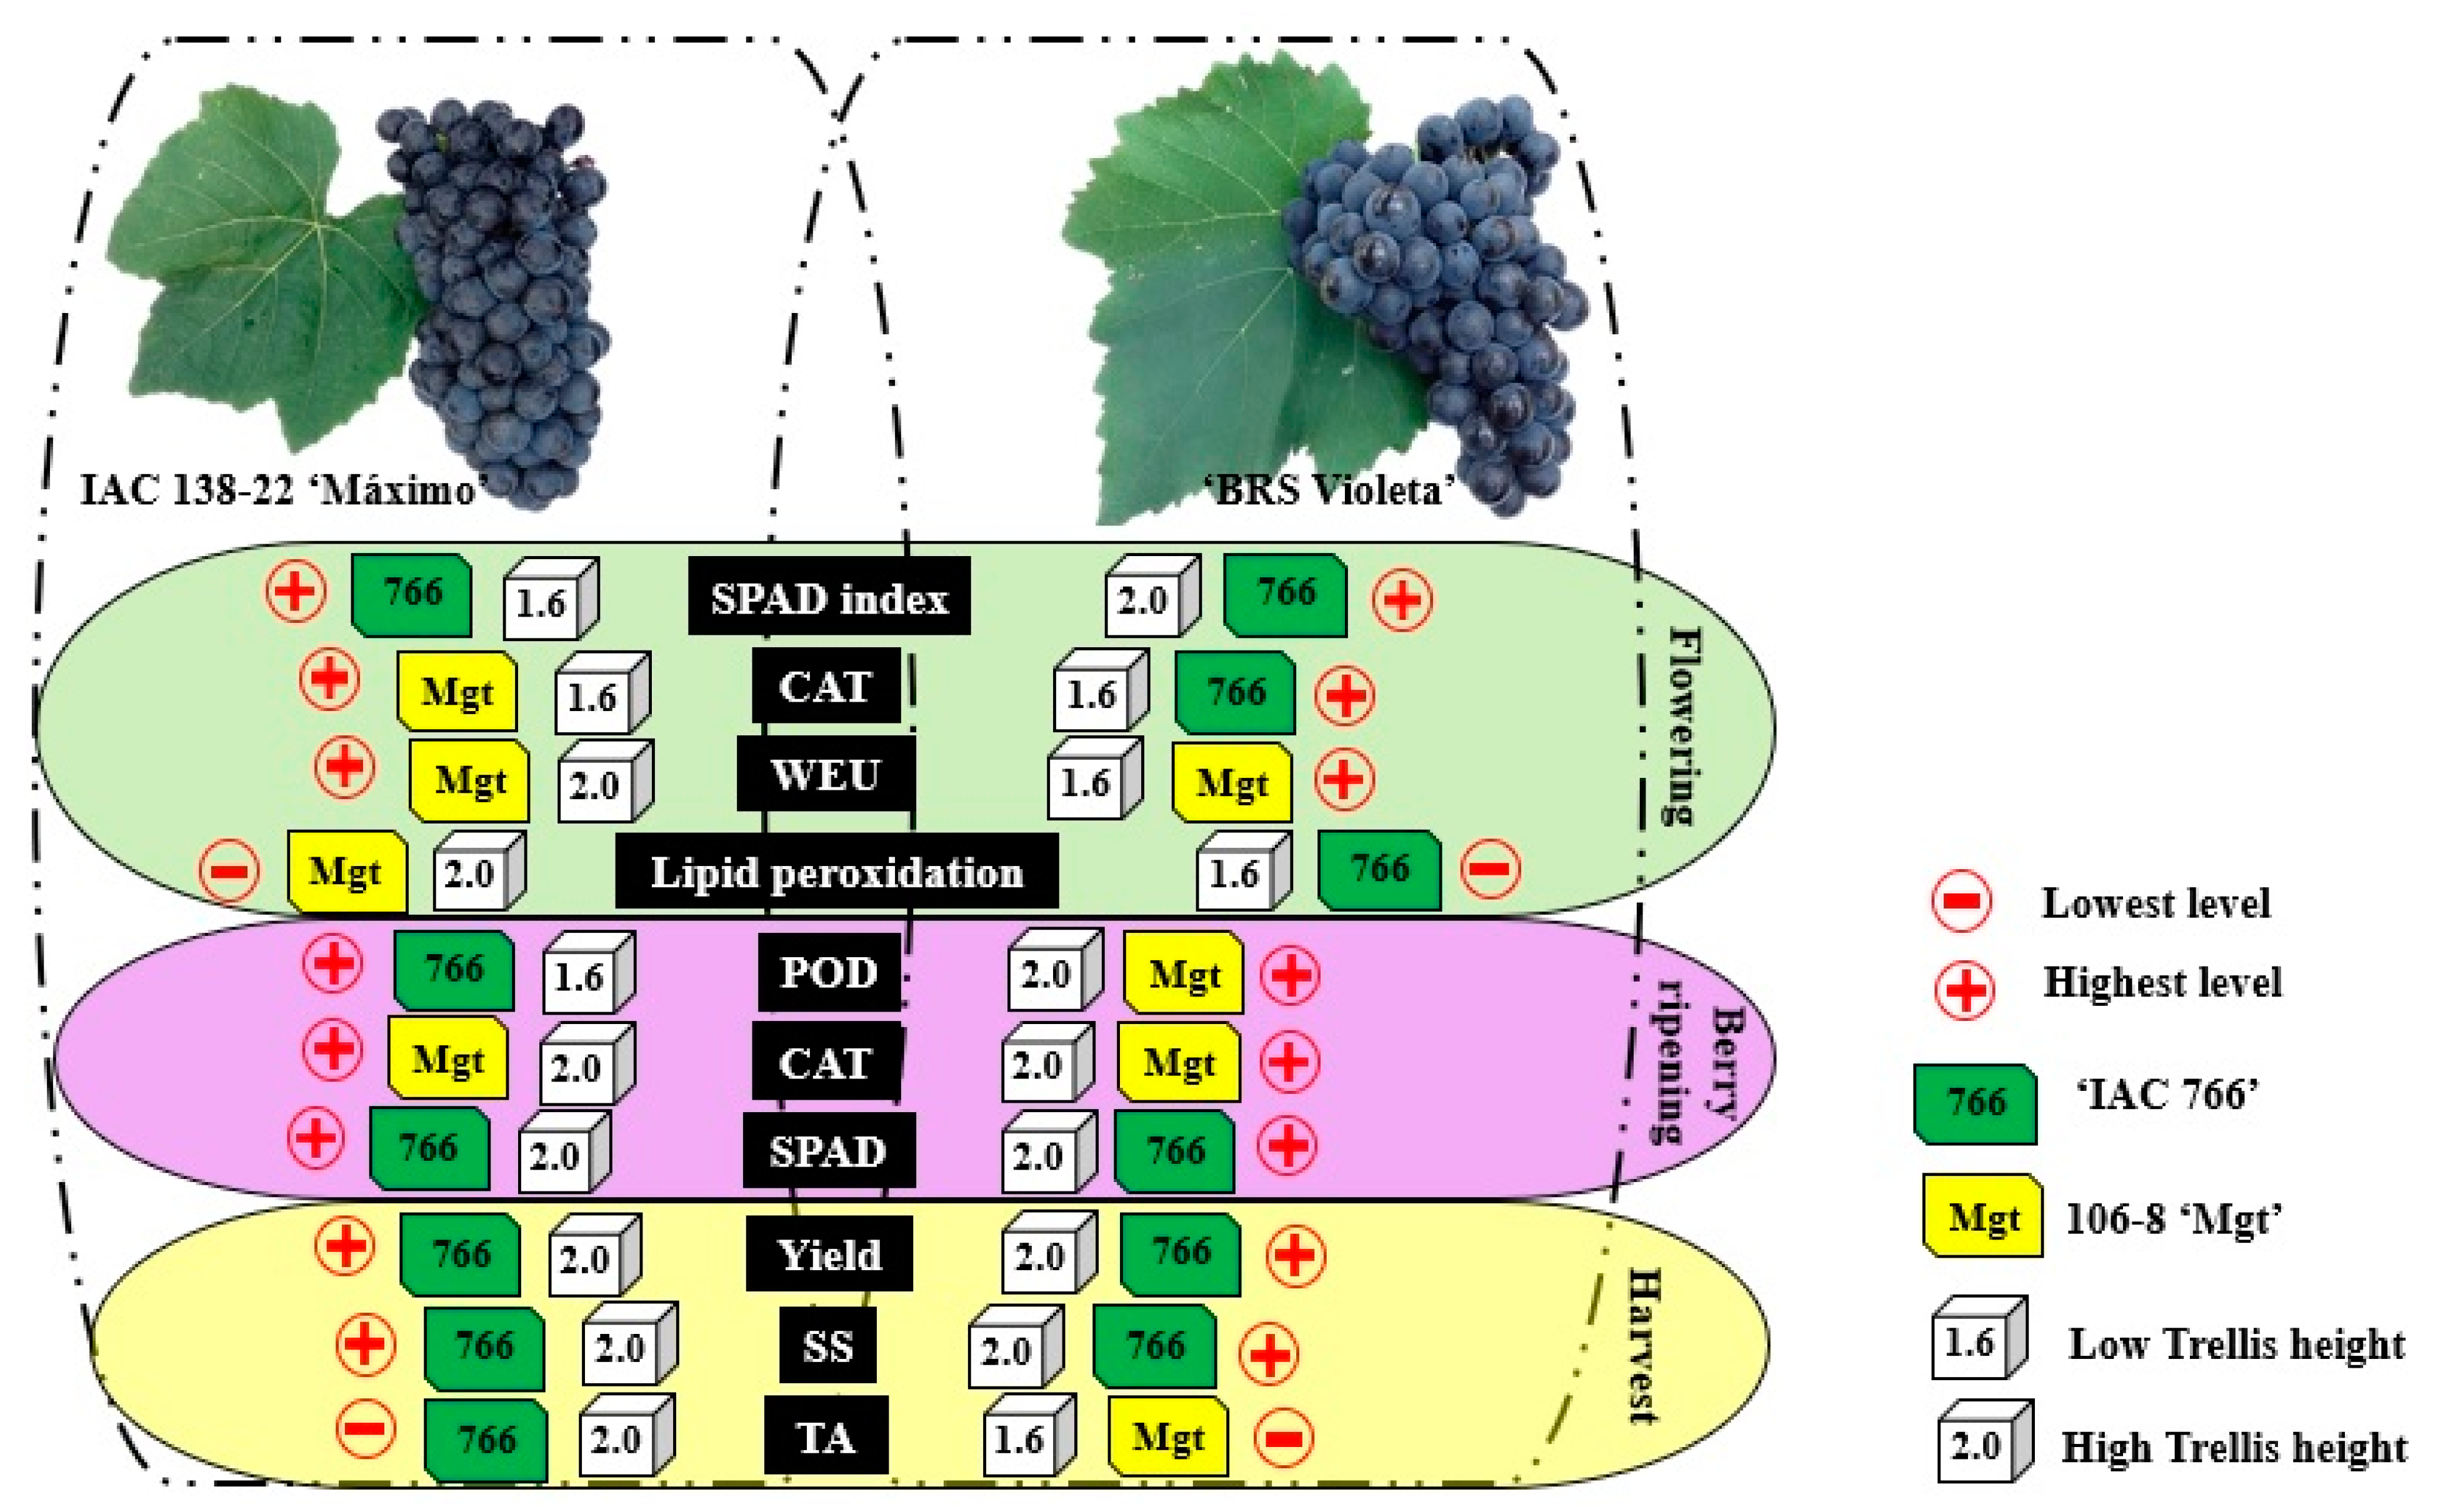
3.1. Impact of Rootstock and Trellis Height on Variety (‘IAC 138-22 Maximo’): Physiological, Biochemical Parameters and Yield

During flowering, the qP increased 0.8 when the ‘IAC 138-22 Maximo’ was trained until 1.6 m onto ‘IAC 766’ and until 2.0 m onto ‘106-8 Mgt’ then until 1.6 m onto ‘106-8 Mgt’ (Table 1). In addition, the same combinations resulted in higher NPQ (plus 0.35) than the variety trained until 1.6 m onto ‘IAC 766’ and until 2.0 m onto the ‘106-8 Mgt’. However, the ETR presented the resulting inversely proportional, the ETR increased 25.5 μmol m−2 s−1 electrons to the ‘IAC 138-22 Maximo’ trained until 1.6 m onto ‘IAC 766’ and until 2.0 m onto the ‘106-8 Mgt’ than the other combinations (Table 1). The ‘IAC 138-22 Maximo’ trained until 2.0 m onto the rootstock ‘IAC 766’, decreased 0.08 mol m−2 s−1 the stomatal conductance (gs) and 5.24 μmol m−2 s−1 CO2 the assimilation (A) then trained until 1.6 m onto the ‘106-8 Mgt’ (Table 1). In addition, the variety trained until 1.6 m onto the ‘106-8 Mgt’ increased 1.1 the WUE compared with the other combinations. The transpiration ration (E) was 1.12 mmol m−2 s−1 water vapor bigger to this combination than the variety trained until 2.0 m onto the same rootstock, ‘106-8 Mgt’. However, the Ci increased 72.1 μmol mol−1 CO2 when the variety was grafted onto ‘IAC 766’ and then trained until 2.0 m onto the ‘106-8 Mgt’. The lowest Fv/Fm, 0.86, was observed when this cultivar was trained until 1.6 m and grafted onto ‘IAC 766’, with no interaction between these two factors (Table 2). The ‘IAC 138-22 Maximo’ increased 9.25 mg the chlorophyll total content in 100 mg of leaves and 4.11 the SPAD index grafted onto the rootstock ‘IAC 766’ and then onto the ‘106-8 Mgt’ (Table 2). During berry ripening the chlorophyll a, b, and total decreased 4.72, 3.32, and 8.05 mg, when the variety was trained until 2 m onto the ‘106-8 Mgt’ then trained until 2.0 m onto ‘IAC 766’ and trained until 1.6 m onto the ‘106-8 Mgt’, respectively (Table 1). In addition, the SPAD index during the same phenological stage increased by 2.99 when the variety ‘IAC 138-22 Maximo’ was grafted onto ‘IAC 766’ and then onto the ‘106-8 Mgt’ (Table 2). Training the variety until 2.0 m onto the ‘IAC 766’ decreased 21.57 mg of CAT activity during the flowering than in other combinations (Table 1). However, the variety grafted onto this rootstock, ‘IAC 766’, increased 4.97 μmol of TBAR activity during flowering, and 366.53 mg of SOD and 4.75 mg of POD during berry ripening (Table 1 and Table 2).
About the yield, the variety ‘IAC 138-22 Maximo’ trained until 2.0 m produced plus 1.6 kg of grape per plant with plus 1.06° Brix of SSC decreasing 0.8 the pH than trained until 1.6 m (Table 2 and Figure 1. Onto the rootstock ‘IAC 766’, the variety showed minus 0.12 percentage of tartaric acidity on must resulting in plus 3.35 to maturation index than onto ‘106-8 Mgt’.

3.2. Impact of Rootstock and Trellis Height on Variety (‘BRS Violeta’): Physiological, Biochemical Parameters and Yield

During flowering, the variety ‘BRS Violeta’ increased 0.14 qP when trained until 1.6 m onto the ‘IAC 766’ than using other combinations (Table 3). In addition, the NPQ decreased by 0.71 using this combination than the variety grafted onto the ‘106-8 Mgt’ in both trellis heights. The variety trained until 1.6 m onto the ‘IAC 766’ increased 10.24 μmol m−2 s−1 electrons the ETR and 4.73 μmol m−2 s−1 CO2 the A than using the other combinations. The ‘IAC 766’ increased by 0.05 the Fv/Fm and 3.37 mmol m−2 s−1 water vapor the E and decreased by 0.94 the WUE on leaves of ‘BRS Violeta’ than the ‘106-8 Mgt’ (Table 4). However, the Ci increased 19.16 μmol m−2 s−1 CO2 when the variety was trained until 2.0 m then until 1.6 m.
The chlorophyll a content on leaves during flowering decreased by 5.53 mg 100 g−1 when the ‘BRS Violeta’ was trained until 1.6 m onto the ‘106-8 Mgt’ than in the other combinations (Table 3). In addition, the SPAD index decreased by 3.59 on leaves from the variety grafted onto the ‘106-8 Mgt’ and then trained until 2.0 m onto the ‘IAC 766’. During berry ripening, the chlorophyll content, a, b, and total, increased 7.05, 3.64, and 11.86 mg 100 g−1 on leaves of ‘BRS Violeta’ trained until 1.6 m onto the ‘IAC 766’ than other combinations, respectively. Contributing to this result, the SPAD index in the same phenological stage increased by 3.02 when the variety was grafted onto the ‘IAC 766’ and then onto the ‘106-8 Mgt’ (Table 4). Moreover, POD and SOD increased, 4.89 µmol and 1947.92 mg, during flowering when this rootstock was used compared with the ‘106-8 Mgt’, respectively (Table 4 and Figure 2). During berry ripening, the POD activity increased by 12.64 µmol on leaves from the variety trained until 2.0 m onto the ‘IAC 766’ and grafted onto the ‘106-8 Mgt’ in both trellis height then trained until 1.6 m onto the ‘IAC 766’ (Table 3). Moreover, the rootstock ‘106-8 Mgt’ increased CAT and SOD activity, plus 19.05 and 682.42 mg, then the ‘IAC 766’ during the same phenological stage (Table 3 and Table 4). However, using trellis heights until 2.0 m decreased SOD activity by 1005.63 mg than using trellis height until 1.6 m (Table 4). The variety ‘BRS Violeta’ produced plus 0,38 kg of grape per plant and increased by 0.1 the pH when it was grafted onto the ‘IAC 766’ and then onto the ‘106-8 Mgt’. However, higher SS contents were observed when this cultivar was trained to a high trellis system.

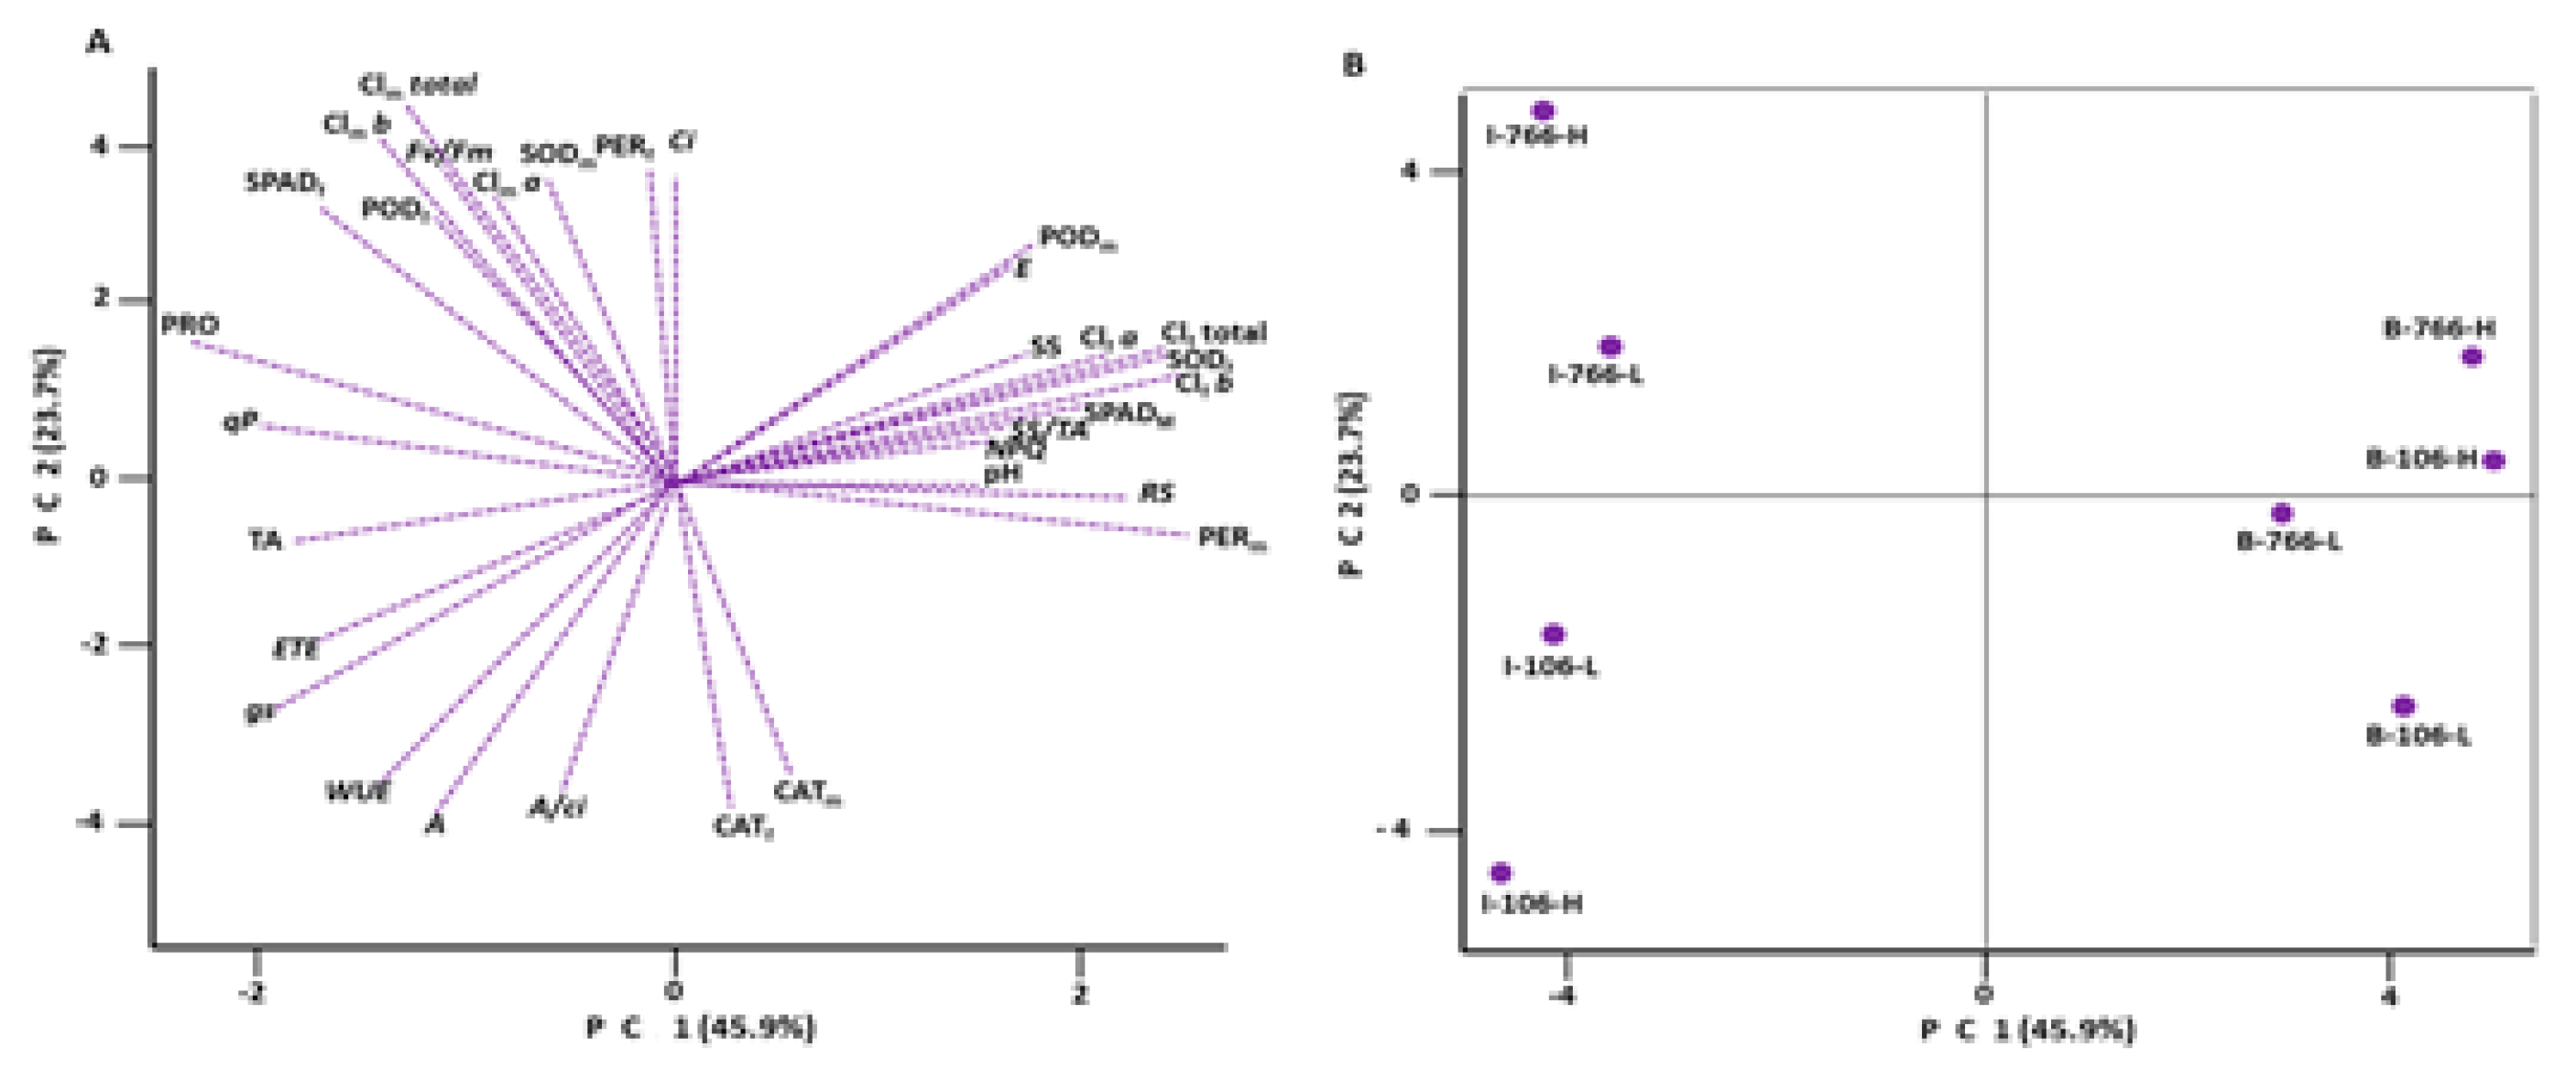
3.3. Principal Component Analysis (PCA)

The first principal component explained 45.9% of the total variation, characterizing the difference between the two grapevine hybrids using photosynthesis, biochemical, and yield performance (Figure 1A,B and Figure 2). The variables NPQ, E, SOD activity, chlorophylls content during flowering, SPAD index, POD and PER during maturation, and SSC, SSC/TA, and RS were positively correlated. However, these variables were negatively correlated with qP, ETR, gs, yield, and TA. The variety ‘IAC 138-22 Maximo’ presented higher qP, ETR, and gs, and lower NPQ and E than ‘BRS Violeta’ (Figure 1A,B and Table 1 and Table 3). However, the ‘BRS Violeta’ showed higher SOD activity and chlorophylls content (a, b, and total) during flowering than the ‘IAC 138-22’ (Figure 1A,B and Table 1 and Table 3). In Addition, ‘BRS Violeta’ showed higher SPAD index, POD, and PER activities during maturation than ‘IAC 138-22 Maximo’. About yield, the variety ‘IAC 138-22 Maximo’ produced more grapes than ‘BRS Violeta’. Despite that, fruit from ‘BRS Violeta’ showed higher SSC and RS, and lower TA on must than ‘IAC 138-22 Maximo’ (Figure 1A,B and Table 2 and Table 4).
The second principal component explained 23.7% of the total variation, characterizing the difference between the rootstocks and trellis height using photosynthesis and biochemical performance (Figure 1A,B). The variables Ci, SPAD index, PER, and POD during flowering and chlorophyll content, SOD, and Fv/Fm during berry ripening were positively correlated. However, these variables were negatively correlated with WUE, A, A/Ci, and CAT activity. The difference between the two rootstocks was observed to be ‘IAC 138-22 Maximo’. When grafted on ‘IAC 766’, this variety showed higher SPAD index, PER, and POD during flowering and chlorophyll content, SOD, and Fv/Fm during berry ripening than onto the ‘106-8 Mgt’. Lower WUE, A, A/Ci, and catalase activity were observed when this genotype was grafted onto the rootstock ‘IAC 766’ than onto the ‘106-8 Mgt’. The trellis height produced less influence on the ‘IAC 138-22 Maximo’ performance than the rootstock. However, the difference between the two-trellis height was observed to be ‘BRS Violeta’. During flowering the trellis height until 1.6 m onto ‘106-8 Mgt’ promoted higher WUE, A, A/Ci, and catalase activity to the cultivar ‘BRS Violet’ than until 2.0 m onto the ‘106-8 Mgt’ and in both trellis height onto the ‘IAC 766’. However, these combinations provided higher Ci, SPAD index, PER, and POD during flowering and chlorophyll content, SOD, and Fv/Fm during berry ripening than ‘BRS Violet’ trained until 1.6 m onto the ‘106-8 Mgt’.

4. Discussion

Maximum quantum yield (Fv/Fm) is used to detect stress during photosynthesis [34]. The varieties such as Touriga National and Chardonnay under no stress presented Fv/Fm between 0.75 and 0.83 [11], values around that were observed to both grapevine varieties in this study, independently of rootstock or trellis height used. However, the cultivar IAC 138-22 ‘Maximo’ reduced Fv/Fm when trained until 1.6 m or grafted on the rootstock ‘IAC 766’. The same was observed in ‘BRS Violet’ when grafted onto ‘106-8 Mgt’. Under unfavorable conditions, plants use absorbed light to other processes, such as thermal dissipation to protect the photosynthetic apparatus [12], decreasing the ratio Fv/Fm and the capacity of the primary acceptor to reduce the QA (quinone A) at photosystem II [11]. In this study, the photosynthesis and biochemical activity on leaves of IAC 138-22 ‘Maximo’ and ‘BRS Violeta’ were highly influenced by the interaction between the rootstock and trellis height.
The use of the rootstock ‘106-8 Mgt’ improve the water efficiency use (WUE) compared to ‘IAC 766’ for both varieties, IAC 138-22 ‘Máximo’ and ‘BRS Violeta’. The rootstock ‘106-8 Mgt’ is recommended for grapevine regions with less water available because this rootstock is more efficient during carbohydrates synthesis [35]. However, for the variety IAC Maximo the highest Ci was observed onto IAC 766. In addition, IAC 138-22 ‘Máximo’ onto this rootstock increased the chlorophyll during flowering and SPAD index during berry ripening to than onto ‘106-8 Mgt’. The ‘IAC 766’ increased the TBAR activity during flowering and SOD and POD during berry to IAC 138-22 ‘Máximo’. In addition, the IAC 766’ increased POD and SOD activity during flowering to ‘BRS Violeta’. However, ‘BRS Violeta’ onto this rootstock decreased CAT and SOD during berry ripening than onto ‘106-8 Mgt’. The increase of ROS production is correlated with abiotic stress [13,36]. The two studies cultivars produced more grapes when grafted onto the rootstock ‘IAC 766’ than onto ‘106-8 MGT’. The ideal interaction between canopy and rootstock results in high photochemical efficiency, gas exchange, and fruit yield with less ROS activity [11,37,38,39]. Under temperate climate conditions, the ‘IAC 766’ provided better yield performance to ‘IAC 138-22 Máximo’, ‘BRS Lorena’, and ‘Bordô’ than the rootstock ‘106-8 Mgt’ [12]. In addition, the rootstock ‘106-8 Mgt’ and ‘IAC 766’ resulted in the same yield and fruit quality as ‘BRS Violeta’ and ‘IAC 21-14 Madalena’ [12].
About the trellis height, the variety IAC 138-22 ‘Máximo’ trained until 1.6 m improved the WUE. Despite that, the ‘BRS Violeta’ trained until 2.0 m increased the assimilation of CO2 (Ci). Both trellis heights did not cause physiologic or biochemical stress to the studied varieties. However, the variety IAC 138-22 ‘Máximo’ trained until 2.0 m increased the CAT activity during berry ripening. On the other hand, ‘BRS Violeta’ trained until 2.0 m decreased CAT activity during flowering and SOD activity during berry ripening. ROS activity increases in response to abiotic stress because cellular protection breaks down H2O2 [13]. The differences in plant morphology trained using different trellis systems or heights influence the microclimate and light interception [40]. The trellis height until 1.6 m decreased the grape yield and SSC of ‘IAC 138-22 Maximo’, increasing pH. Canopy size is correlated with canopy light environment, increasing leaves area, photosynthesis efficiency, and fruit yield [18,41]. For the variety Chardonnay, training until 1.65 m was recommended for low to moderate-sized canopies, and training until 1.35 m was suited for moderate to large canopies [18]. However, under subtropical conditions, the Niagara Rosada was trained until 1.8 m onto the rootstock ‘IAC 766’ [18]. In addition, under temperate conditions, the hybrids ‘BRS Carmem’, ‘BRS Cora’, and IAC 138-22 ‘Máximo’ were trained until 1.0 m onto the ‘IAC 766’ [12].
Productivity and grape quality are the most important factors in selecting grapevine varieties for growing in a given region [5,41]. The cultivar ‘IAC 138-22 Maximo’ yielded more than ‘BRS Violeta’ in the study region (subtropical condition). However, ‘BRS Violeta’ present better photosynthesis and biochemical performance under subtropical condition than ‘IAC 138-22 Maximo’. The better combination between canopy, training system, and rootstock, improves variety performance resulting in climate adaptation, high yield, and fruit quality [35,37,38,39,41,42]. In conclusion, IAC 138-22 ‘Maximo’ presented better photosynthesis, biochemical, and yield performance trained until 2.0 m onto the rootstock ‘IAC 766’. In addition, ‘BRS Violeta’ grafted onto ‘IAC 766’ showed better yield performance.

Author Contributions

F.J.D.N., J.D.R. and M.A.T. planned and designed the experiment. F.J.D.N. and A.P.J. performed plant physiological analyses, chemical, biochemical and enzyme analyses. F.J.D.N., L.R.M. and F.F.P. performed data analyses. F.J.D.N. and L.R.M. created the tables and figures. F.J.D.N., L.R.M., M.F.M., E.O.O., J.D.R. and C.S.F.B. wrote and revised the manuscript. All authors have read and agreed to the published version of the manuscript.

Funding

To Fundação de Amparo à Pesquisa do Estado de São Paulo (FAPESP—Research Support Foundation of the State of São Paulo, process no. 2016/07510-2) for granting the scholarship for the first author, for the programs that supported the study for setting the experimental area (2011/03440-6, 2013/8915-5 and 2015/16440-5) and to CNPq for the Research Productivity Scholarship (process no. 307377/2021-0).

Data Availability Statement

Not applicable.

Conflicts of Interest

The authors declare no conflict of interest.

References

  1. Bellée, A.; Comont, G.; Nivault, A.; Abou-Mansour, E.; Coppin, C.; Dufour, M.C.; Corio-Costet, M.F. Life traits of four Botryosphaeriaceae species and molecular responses of different grapevine cultivars or hybrids. Plant Pathol. 2017, 66, 763–776. [Google Scholar] [CrossRef]
  2. Nikolić, D.; Ranković-Vasić, Z.; Jovanović-Cvetković, T.; Petrović, A.; Radojević, I.; Sivčev, B. Effect of genotype x environment interactions of grapevine hybrids characteristics. BIO Web Conf. 2017, 9, 1018. [Google Scholar] [CrossRef]
  3. Marín, D.; Armengol, J.; Carbonell-Bejerano, P.; Escalona, J.; Gramaje, D.; Hernández-Montes, E.; Intrigliolo, D.; Martínez-Zapater, J.; Medrano, H.; Mirás-Avalos, J.; et al. Challenges of viticulture adaptation to global change: Tackling the issue from the roots. Aust. J. Grape Wine Res. 2021, 27, 8–25. [Google Scholar] [CrossRef]
  4. Júnior, M.J.P.; Hernandes, J.L.; Moura, M.F. Performance of juice and wine grape cultivars in different training systems. Rev. Bras. Frutic. 2018, 40, 1–8. [Google Scholar] [CrossRef]
  5. Mattar, G.S.; Modesto, L.R.; Hernandes, J.L.; Tecchio, M.A.; Moura, M.F. Cycle, physicochemical characterization and climatic adaptation of a white hybrid grape on different rootstocks. Bragantia 2019, 78, 470–478. [Google Scholar] [CrossRef]
  6. Smith, H.M.; Clarke, C.W.; Smith, B.P.; Carmody, B.M.; Thomas, M.R.; Clingeleffer, P.R.; Powell, K.S. Genetic identification of SNP markers linked to a new grape phylloxera resistant locus in Vitis cinerea for marker-assisted selection. BMC Plant Biol. 2018, 18, 360. [Google Scholar] [CrossRef]
  7. Divers, M.; Gomes, C.B.; Menezes-Netto, A.C.; Lima-Medina, I.; Nondillo, A.; Bellé, C.; Filho, J.V.D.A. Diversity of plant-parasitic nematodes parasitising grapes in Southern Brazil. Trop. Plant Pathol. 2019, 44, 401–408. [Google Scholar] [CrossRef]
  8. Zhang, L.; Marguerit, E.; Rossdeutsch, L.; Ollat, N.; Gambetta, G.A. The influence of grapevine rootstocks on scion growth and drought resistance. Theor. Exp. Plant Physiol. 2016, 28, 143–157. [Google Scholar] [CrossRef]
  9. Tecchio, M.A.; da Silva, M.J.R.; Callili, D.; Hernandes, J.L.; Moura, M. Yield of white and red grapes, in terms of quality, from hybrids and Vitis labrusca grafted on different rootstocks. Sci. Hortic. 2020, 259, 108846. [Google Scholar] [CrossRef]
  10. Nowicka, B.; Ciura, J.; Szymańska, R.; Kruk, J. Improving photosynthesis, plant productivity and abiotic stress tolerance—Current trends and future perspectives. J. Plant Physiol. 2018, 231, 415–433. [Google Scholar] [CrossRef]
  11. Dinis, L.T.; Malheiro, A.; Luzio, A.; Fraga, H.; Ferreira, H.; Gonçalves, I.; Pinto, G.; Correia, C.; Moutinho-Pereira, J. Improvement of grapevine physiology and yield under summer stress by kaolin-foliar application: Water relations, photosynthesis and oxidative damage. Photosynthetica 2018, 56, 641–651. [Google Scholar] [CrossRef]
  12. Silva, J.R.; Rodrigues, W.P.; Ferreira, L.S.; de Paula Bernado, W.; Paixão, J.S.; Patterson, A.E.; Poni, S. Deficit irrigation and transparent plastic covers can save water and improve grapevine cultivation in the tropics. Agri. Water Manag. 2018, 202, 66–80. [Google Scholar] [CrossRef]
  13. Tombesi, S.; Cincera, I.; Frioni, T.; Ughini, V.; Gatti, M.; Palliotti, A.; Poni, S. Relationship among night temperature, carbohydrate translocation and inhibition of grapevine leaf photosynthesis. Environ. Exp. Bot. 2019, 157, 293–298. [Google Scholar] [CrossRef]
  14. Noctor, G.; Reichheld, J.-P.; Foyer, C.H. ROS-related redox regulation and signaling in plants. Semin. Cell Dev. Biol. 2018, 80, 3–12. [Google Scholar] [CrossRef]
  15. Jimenes, I.M.; Mayer, N.A.; Dias, C.T.D.S.; Filho, J.A.S.; da Silva, S.R. Influence of clonal rootstocks on leaf nutrient content, vigor and productivity of young ‘Sunraycer’ nectarine trees. Sci. Hortic. 2018, 235, 279–285. [Google Scholar] [CrossRef]
  16. Ferreira, T.D.O.; da Costa, R.R.; Félix, D.T.; Neto, E.R.D.A.; Cruz, M.D.M.; de Lima, M.A.C. Quality and antioxidant potential of ‘BRS Magna’ grapes harvested in the first half of the year under different training systems and rootstocks in a tropical region. Cien. Agrot. 2019, 43, e029518. [Google Scholar] [CrossRef]
  17. Leão, P.C.D.S.; Chaves, A.R.D.M. Training systems and rootstocks on yield and agronomic performance of ‘Syrah’ grapevine in the Brazilian semiarid. Ciência Agrotecnol. 2019, 43, 1–9. [Google Scholar] [CrossRef]
  18. Gladstone, E.A.; Dokoozlian, N.K. Influence of leaf area density and 487 trellis/training system on the light micro-climate within grapevine canopies. Vitis 2003, 42, 123–132. [Google Scholar]
  19. Sanchez-Rodriguez, L.A.; Spósito, M.B. Influence of the trellis/training system on the physiology and production of Vitis labrusca cv. Niagara Rosada in Brazil. Sci. Hortic. 2020, 261, 109043. [Google Scholar] [CrossRef]
  20. Von Caemmerer, S.; Farquhar, G.D. Some relationships between the biochemistry of photosynthesis and the gas exchange of leaves. Planta 1981, 153, 376–387. [Google Scholar] [CrossRef]
  21. Kitajima, M.; Butler, W. Quenching of chlorophyll fluorescence and primary photochemistry in chloroplasts by dibromothymoquinone. Biochim. Biophys. Acta (BBA) Bioenerg. 1975, 376, 105–115. [Google Scholar] [CrossRef]
  22. Genty, B.; Briantais, J.-M.; Baker, N.R. The relationship between the quantum yield of photosynthetic electron transport and quenching of chlorophyll fluorescence. Biochim. Biophys. Acta (BBA) Gen. Subj. 1989, 990, 87–92. [Google Scholar] [CrossRef]
  23. Schreiber, U.; Schliwa, U.; Bilger, W. Continuous recording of photochemical and non-photochemical chlorophyll fluorescence quenching with a new type of modulation fluorometer. Photosynth. Res. 1986, 10, 51–62. [Google Scholar] [CrossRef] [PubMed]
  24. Bilger, W. Role of the xanthophyll cycle in photoprotection elucidated by measurements of light-induced absorbance changes, fluorescence and photosynthesis in leaves of Hedera canariensis. Photosynth. Res. 1990, 25, 173–185. [Google Scholar] [CrossRef]
  25. Klughammer, C.; Schreiber, U. Complementary PS II quantum yields calculated from simple fluorescence parameters measured by PAM fluorometry and the Saturation Pulse method. PAM Appl. Not. 2008, 1, 27–35. [Google Scholar]
  26. Sims, D.A.; Gamon, J.A. Relationships between leaf pigment content and spectral reflectance across a wide range of species, leaf structures and developmental stages. Remote Sens. Environ. 2002, 81, 337–354. [Google Scholar] [CrossRef]
  27. Bradford, M.M. A rapid and sensitive method for the quantitation of microgram quantities of protein utilizing the principle of protein-dye binding. Anal. Biochem. 1976, 72, 248–254. [Google Scholar] [CrossRef]
  28. Giannopolotis, C.N.; Ries, S.K. Superoxide dismutases: I. Occurrence in higher plants. Plant Physiol. 1977, 59, 309–314. [Google Scholar] [CrossRef]
  29. Teisseire, H.; Guy, V. Copper-induced changes in antioxidant enzymes activities in fronds of duckweed (Lemna minor). Plant Sci. 2000, 153, 65–72. [Google Scholar] [CrossRef]
  30. Peixoto, P.H.P.; Cambraia, J.; Sant’anna, R.; Mosquim, P.R.; Moreira, M.A. Aluminium effects on lipid peroxidation and the activities of enzymes of oxidative metabolism in sorghum. Rev. Brasil Fis. Veg. 1999, 11, 37–143. [Google Scholar]
  31. Devi, S.R.; Prasad, M.N.V. Copper toxicity in Ceratophyllum demersum L. (Coontail), a free floating macrophyte: Response of antioxidant enzymes and antioxidants. Plant Sci. 1986, 138, 157–165. [Google Scholar] [CrossRef]
  32. Nelson, N.A. A photometric adaptation of Somogy method for the determination of glucose. J. Biol. Chem. 1944, 135, 136–175. [Google Scholar]
  33. SAS Institute. SAS Version 9 (Vol. 2); SAS Institute Incorporated: Cary, NC, USA, 2000. [Google Scholar]
  34. Bertamini, M.; Grando, M.S.; Zocca, P.; Pedrotti, M.; Lorenzi, S.; Cappellin, L. Linking monoterpenes and abiotic stress resistance in grapevines. BIO Web Conf. 2019, 13, 01003. [Google Scholar] [CrossRef]
  35. Sucu, S.; Yağcı, A.; Yıldırım, K. Changes in Morphological, Physiological Traits and Enzyme Activity of Grafted and Ungrafted Grapevine Rootstocks under Drought Stress. Erwerbs-Obstbau 2018, 60, 127–136. [Google Scholar] [CrossRef]
  36. Miller, G.; Coutu, J.; Shulaev, V.; Mittler, R. Reactive Oxygen Signaling in Plants. In Annual Plant Reviews Online; Wiley: Hoboken, NJ, USA, 2018; pp. 189–201. [Google Scholar] [CrossRef]
  37. Ollat, N.; Bordenave, L.; Tandonnet, J.P.; Boursiquot, J.M.; Marguerit, E. Grapevine rootstocks: Origins and perspectives. Acta Hortic. 2016, 1136, 11–22. [Google Scholar] [CrossRef]
  38. Ollat, N.; Cookson, S.J.; Lauvergeat, V.; Marguerit, E.; Barrieu, F.; Gambetta, G.A.; Goutouly, J.P.; Tandonnet, J.P.; Vivin, P.; Delrot, S. Grapevine roots: The dark side. Acta Hortic. 2017, 1188, 213–226. [Google Scholar] [CrossRef]
  39. Ollat, N.; Cookson, S.; Destrac-Irvine, A.; Lauvergeat, V.; Ouaked-Lecourieux, F.; Marguerit, E.; Barrieu, F.; Dai, Z.; Duchêne, E.; Gambetta, G.; et al. Grapevine adaptation to abiotic stress: An overview. Acta Hortic. 2018, 1248, 497–512. [Google Scholar] [CrossRef]
  40. Kraus, C.; Pennington, T.; Herzog, K.; Hecht, A.; Fischer, M.; Voegele, R.T.; Kicherer, A. Effects of canopy architecture and microclimate on grapevine health in two training systems. Vitis 2018, 57. [Google Scholar] [CrossRef]
  41. Ferreira, D.F. Sisvar: A Guide for its Bootstrap procedures in multiple comparisons. Ciência Agrotecnol. 2014, 38, 109–112. [Google Scholar] [CrossRef]
  42. Reynolds, A.G.; Heuvel, J.E.V. Influence of Grapevine Training Systems on Vine Growth and Fruit Composition: A Review. Am. J. Enol. Vitic. 2009, 60, 251–268. [Google Scholar] [CrossRef]
Figure 1. Photosynthesis, biochemical, and yield performance of interaction between two grapevine hybrids, ‘IAC 138-22 Maximo’ (I) and ‘BRS Violeta’ (B), trained in two trellis heights until 1.6 m (L) and 2.0 m (H) trellis and onto two rootstocks, ‘IAC 766’ (766) and ‘106-8 Mgt’ (106). (A) Plot of the evaluated variables; (B) Plot the of the treatments. Note: Quantum yield (Fv/Fm), photochemical quenching (qP), Non-photochemical quenching (NPQ), electron transport rate (ETR), transpiration rate (E), water use efficiency (WUE), carboxylation efficiency (A/Ci), stomatal conductance (gs), assimilation rate (A) and internal carbon concentration (Ci), SPAD (SPADf), chlorophylls a (Clf a), b (Clf b) and total (Clf total), peroxidase (PODf) and superoxide dismutase (SODf), catalase (CATf) over flowering; SPAD (SPADm), chlorophylls a (Clm a), b (Clmb) and total (Clmtotal), peroxidase (PODm), superoxide dismutase (SODm), catalase (CATm) over-ripening phase, production (PRO), soluble solids content (SS), acidity (pH), titratable acidity (TA), reducing sugars (RA), and SS/TA relation (SS/TA).
Horticulturae 09 00596 g001
Figure 2. Graphical abstract of two grapevine hybrids, ‘IAC 138-22 Maximo’ and ‘BRS Violeta’ and their interaction with two trellis heights (low: 1.6 m and high: 2.0 m) and two rootstocks, ‘IAC 766’ (766) and ‘106-8 Mgt’ (Mgt). Note: Water use efficiency (WUE), peroxidase (POD), catalase (CAT), soluble solids content (SS), and titratable (TA), SPAD index (Soil Plant Analysis Development).
Horticulturae 09 00596 g002
Table 1. Interaction between two trellis heights and rootstock to photosynthesis and biochemical performance of grapevine ‘IAC 138-22 Maximo’ under subtropical conditions during flowering and berry ripening stages.
Trellis HeightRootstock
‘IAC 766’‘106-8 Mgt’
Flowering
qP1.6 m0.57 ± 0.02 aA0.49 ± 0.01 bB
2.0 m0.54 ± 0.02 bA0.56 ± 0.01 aA
NPQ1.6 m2.03 ± 0.07 bB2.38 ± 0.01 aA
2.0 m2.64 ± 0.14 aA2.08 ± 0.04 bB
ETR (μmol m−2 s−1 electrons)1.6 m148.58 ± 7.07 aA133.86 ± 5.51 bB
2.0 m123.03 ± 3.16 bB158.15 ± 9.93 aA
gs (mol m−2 s−1)1.6 m0.23 ± 0.01 aB0.25 ± 0.01 aA
2.0 m0.17 ± 0.001 bB0.22 ± 0.01 bA
E (mmol m−2 s−1 water vapor)1.6 m7.06 ± 0.42 aB7.59 ± 0.30 aA
2.0 m6.82 ± 0.24 aA6.47 ± 0.17 bB
WUE1.6 m4.53 ± 0.25 aA4.42 ± 0.11 bA
2.0 m4.56 ± 0.18 aB5.66 ± 0.15 aA
A (μmol m−2 s−1 CO2)1.6 m34.75 ± 1.38 aA36.17 ± 1.25 aA
2.0 m29.51 ± 1.51 bB38.82 ± 2.48 aA
Ci (μmol mol−1 CO2)1.6 m179.93 ± 3.74 aA148.67 ± 5.70 aB
2.0 m175.31 ± 5.76 aA103.21 ± 6.11 bB
A/Ci1.6 m0.19 ± 0.001 aB0.26 ± 0.02 bA
2.0 m0.17 ± 0.01 bB0.32 ± 0.01 aA
Cl b (mg 100 g−1 leaves)1.6 m16.40 ± 2.01 aA12.22 ± 0.43 aB
2.0 m13.02 ± 0.66 bA12.69 ± 2.14 aA
POD (µmol mg−1 min−1 protein)1.6 m36.52 ± 1.37 aA34.83 ± 1.52 aA
2.0 m39.15 ± 0.83 aA32.97 ± 2.26 aB
CAT (µg mKat−1 protein)1.6 m5.68 ± 1.26 aA6.11 ± 3.20 aA
2.0 m2.12 ± 0.77 bB4.70 ± 1.69 aA
Berry ripening
Cl a (mg 100 g−1 leaves)1.6 m35.18 ± 0.93 bA36.03 ± 3.25 aA
2.0 m55.28 ± 2.60 aA31.31 ± 3.35 bB
Cl b (mg 100 g−1 leaves)1.6 m16.03 ± 0.23 bA17.67 ± 1.71 aA
2.0 m26.57 ± 0.67 aA14.35 ± 1.98 bB
Cl total (mg 100 g−1 leaves)1.6 m51.21 ± 0.84 bA53.71 ± 4.55 aA
2.0 m81.85 ± 3.20 aA45.66 ± 5.32 bB
SOD (mg U−1 protein)1.6 m4665.88 ± 19.91 bA3689.94 ± 34.25 aB
2.0 m5027.41 ± 17.90 aA3463.00 ± 32.14 aB
CAT (µg mKat−1 protein)1.6 m14.61 ± 2.61 bA14.12 ± 0.41 bA
2.0 m54.62 ± 1.58 aB86.19 ± 3.98 aA
±standard deviations. Means followed by the same lower-case letter in the column and upper-case letter in the row are not different from each other according to the Tukey’s test at 5% probability. Photochemical quenching (qP), non-photochemical quenching (NPQ), electron transport rate (ETR), stomatal conductance (gs), transpiration rate (E), water use efficiency (WUE), carboxylation efficiency (A/Ci), CO2 assimilation rate (A), internal carbon concentration (Ci), Chlorophyll b, peroxidase (POD) and catalase (CAT) enzymes activities at flowering and chlorophyll (Cl) a, b and total, activities of the superoxide dismutase (SOD) and catalase (CAT).
Table 2. Photosynthesis, biochemical and yield performance of grapevine ‘IAC 138-22 Maximo’ during flowering and berry ripening stages for two trellis height and rootstock under subtropical conditions.
Trellis HeightRootstock
1.6 m2.0 m‘IAC 766’‘106-8 Mgt’
Flowering
Fv/Fm0.86 ± 0.02 b0.90 ± 0.02 a0.86 ± 0.01 b0.90 ± 0.02 a
SPAD index33.47 ± 2.79 a32.58 ± 2.38 a35.08 ± 1.27 a30.97 ± 1.63 b
Cl a (mg 100 g−1 leaves)33.27 ± 5.69 a30.82 ± 4.34 a35.55 ± 3.41 a28.55 ± 3.88 a
Cl total (mg 100 g−1 leaves)47.59 ± 8.10 a43.68 ± 5.61 a50.26 ± 5.54 a41.01 ± 5.12 b
SOD (mg U−1 protein)4141.42 ± 38.62 a4331.28 ± 51.27 a4561.96 ± 39.92 a3910.74 ± 24.95 b
Lipid peroxidation (μmol g−1 leaves)11.02 ± 1.04 a9.59 ± 0.09 a12.79 ± 1.06 a7.82 ± 0.08 b
Berry ripening
SPAD index35.86 ± 2.93 a37.09 ± 1.88 a37.97 ± 2.25 a34.98 ± 1.66 b
POD (µmol mg−1 min−1 protein)23.45 ± 3.64 a22.64 ± 3.18 a25.37 ± 2.66 a20.72 ± 2.07 b
Yield
Yield (kg−1 plant)4.16 ± 0.08 b5.76 ± 1.04 a5.07 ± 0.09 a4.85 ± 0.08 a
pH3.39 ± 0.09 a3.31 ± 0.08 b3.35 ± 0.08 a3.36 ± 0.11 a
Soluble solids (°Brix)14.19 ± 1.36 b15.25 ± 1.55 a15.13 ± 1.63 a14.31 ± 1.36 a
Titratable acidity (% tartaric acid)0.98 ± 0.16 a0.94 ± 0.16 a0.90 ± 0.18 b1.02 ± 0.11 a
SS/TA ratio14.91 ± 3.15 a16.78 ± 4.31 a17.52 ± 4.40 a14.17 ± 2.25 b
Reducing sugar (%)10.56 ± 1.89 a10.98 ± 1.70 a10.58 ± 1.53 a10.96 ± 2.04 a
±standard deviations. Means followed by the same lower-case letter in the column are not different from each other according to the Tukey test at 5% probability. Quantum yield (Fv/Fm), SPAD index (Soil Plant Analysis Development), the content of chlorophyll (Cl), superoxide dismutase (SOD), peroxidase activity (POD), soluble solids/titratable acidity ratio (SS/TA).
Table 3. Interaction between two trellis heights and rootstock to photosynthesis and biochemical performance of grapevine ‘BRS Violeta’ under subtropical conditions during flowering and berry ripening stages.
Trellis HeightRootstock
‘IAC 766’‘106-8 Mgt’
Flowering
qP1.6 m0.55 ± 0.02 aA0.44 ± 0.02 aA
2.0 m0.45 ± 0.01 bA0.41 ± 0.01 bB
NPQ1.6 m2.53 ± 0.14 bB3.29 ± 0.09 aA
2.0 m3.03 ± 0.08 aB3.24 ± 0.10 aA
ETR (μmol m−2 s−1 electrons)1.6 m124.38 ± 3.50 aA114.14 ± 5.64 aB
2.0 m100.70 ± 5.96 bA100.11 ± 4.87 bA
gs (mol m−2 s−1)1.6 m0.28 ± 0.01 aA0.14 ± 0.001 aB
2.0 m0.26 ± 0.001 bA0.13 ± 0.001 aB
A (μmol m−2 s−1 CO2)1.6 m36.13 ± 1.27 aA31.40 ± 1.06 aB
2.0 m31.00 ± 0.38 bA29.74 ± 1.30 aA
Ci (μmol mol−1 CO2)1.6 m129.29 ± 8.21 bA132.43 ± 3.20 bA
2.0 m162.48 ± 3.37 aA151.59 ± 7.21 aA
SPAD index1.6 m29.11 ± 2.72 aA21.57 ± 0.57 bB
2.0 m30.34 ± 0.83 aA26.75 ± 1.35 aB
Cl a (mg 100 g−1 leaves)1.6 m47.19 ± 7.00 aA39.12 ± 3.54 bB
2.0 m44.65 ± 1.53 aA48.28 ± 4.67 aA
CAT (µg mKat−1 protein)1.6 m35.55 ± 3.33 aA32.65 ± 0.98 aB
2.0 m19.86 ± 0.86 bA9.41 ± 0.95 bB
Berry ripening
Cl a (mg 100 g−1 leaves)1.6 m40.93 ± 3.44 aA23.44 ± 2.00 bB
2.0 m32.98 ± 2.00 bA29.75 ± 2.16 aA
Cl b (mg 100 g−1 leaves)1.6 m17.48 ± 2.58 aA10.30 ± 0.79 aB
2.0 m13.84 ± 1.58 bA12.68 ± 2.02 aA
Cl total (mg 100 g−1 leaves)1.6 m58.42 ± 5.86 aA33.75 ± 2.78 bB
2.0 m46.82 ± 1.60 bA42.43 ± 3.27 aA
POD (µmol mg−1 min−1 protein)1.6 m15.72 ± 3.36 bB28.36 ± 2.67 aA
2.0 m24.68 ± 1.57 aB30.27 ± 1.92 aA
CAT (µg mKat−1 protein)1.6 m24.04 ± 4.03 aB49.40 ± 2.93 bA
2.0 m29.90 ± 1.89 aB82.95 ± 8.44 aA
±standard deviations; Means followed by the same lower-case letter in the column and upper-case letter in the row are not different from each other by Tukey’s test at 5% of probability; Note: Photochemical quenching (qP), non-photochemical quenching (NPQ), electron transport rate (ETR), stomatal conductance (gs), CO2 assimilation rate (A), internal carbon concentration (Ci), SPAD index (Soil Plant Analysis Development), chlorophyll a content and catalase activity (CAT), peroxidase (POD) and catalase (CAT) activity.
Table 4. Photosynthesis, biochemical, and yield performance of grapevine ‘BRS Violeta’ during flowering and berry ripening stages for two trellis heights and rootstock under subtropical conditions.
VariableTrellis HeightRootstock
1.6 m2.0 m‘IAC 766’‘106-8 Mgt’
Flowering
Fv/Fm0.84 ± 0.03 a0.86 ± 0.03 a0.87 ± 0.01 a0.82 ± 0.01 b
E (mmol m−2 s−1 water vapor)7.76 ± 2.00 a8.37 ± 1.66 a9.75 ± 0.38 a6.38 ± 0.56 b
WUE 4.42 ± 0.62 a3.83 ± 0.44 a3.66 ± 0.29 b4.60 ± 0.44 a
A/Ci 0.19 ± 0.01 a0.21 ± 0.01 a0.21 ± 0.03 a0.22 ± 0.02 a
Cl b (mg 100 g−1 leaves)18.35 ± 2.43 a20.03 ± 1.38 a20.05 ± 2.23 a18.33 ± 1.67 a
Cl total (mg 100 g−1 leaves)61.50 ± 8.96 a66.50 ± 4.21 a65.97 ± 6.70 a62.03 ± 4.21 a
POD (µmol mg−1 min−1 protein)31.63 ± 2.20 a32.30 ± 4.07 a34.41 ± 2.20 a29.52 ± 4.07 b
SOD (mg U−1 protein)6685.52 ± 11.71 a6681.96 ± 13.43 a7657.70 ± 26.93 a5709.78 ± 35.43 b
Lipid peroxidation (μmol g−1 leaves)9.76 ± 1.04 a9.63 ± 1.03 a9.17 ± 2.03 a10.22 ± 2.04 a
Berry ripening
SPAD index44.14 ± 1.95 a45.12 ± 2.07 a46.14 ± 1.66 a43.12 ± 0.80 b
SOD (mg U−1 protein)3105.15 ± 29.44 b4110.78 ± 37.90 a3266.75 ± 46.78 b3949.17 ± 37.35 a
Lipid peroxidation (μmol g−1 leaves)8.55 ± 0.90 a9.44 ± 0.94 a8.76 ± 0.94 a9.22 ± 0.93 a
Yield
Yield (kg−1 plant)1.52 ± 0.06 a1.55 ± 0.09 a1.73 ± 0.09 a1.35 ± 0.08 b
pH3.58 ± 0.16 a3.55 ± 0.12 a3.62 ± 0.16 a3.52 ± 0.10 a
Soluble solids (°Brix)15.99 ± 0.49 a16.32 ± 0.53 a16.32 ± 0.51 a15.99 ± 0.52 a
Titratable acidity (% tarctaric acid)0.68 ± 0.09 a0.75 ± 0.15 a0.73 ± 0.15 a0.70 ± 0.11 a
SS/TA23.28 ± 2.86 a24.50 ± 3.09 a23.88 ± 3.46 a23.90 ± 2.56 a
Reducing sugar (%)12.64 ± 1.38 a13.37 ± 1.42 a13.27 ± 1.73 a12.74 ± 1.04 a
±standard deviations; Means followed by the same lower-case letter in the row within the same factor are not different from each other by the test of Tukey at 5% probability. Note: Quantum yield (Fv/Fm), transpiration rate (E), water use efficiency (WUE), carboxylation efficiency (A/Ci), contents of chlorophyll (Cl) b and total, peroxidase (POD), and superoxide dismutase (SOD) activity, lipid peroxidation at flowering and SPAD index (Soil Plant Analysis Development), superoxide dismutase (SOD), soluble solids/titratable acidity ratio (SS/TA).
Disclaimer/Publisher’s Note: The statements, opinions and data contained in all publications are solely those of the individual author(s) and contributor(s) and not of MDPI and/or the editor(s). MDPI and/or the editor(s) disclaim responsibility for any injury to people or property resulting from any ideas, methods, instructions or products referred to in the content.

