Article

Micro-Tom Tomato Response to Fertilization Rates and the Effect of Cultivation Systems on Fruit Yield and Quality

Faculty of International Agriculture and Food Studies, Tokyo University of Agriculture, Sakuragaoka 1-1-1, Setagaya-ku, Tokyo 156-8502, Japan
*
Author to whom correspondence should be addressed.
Horticulturae 2023, 9(3), 367; https://doi.org/10.3390/horticulturae9030367
Submission received: 25 January 2023 / Revised: 9 March 2023 / Accepted: 9 March 2023 / Published: 10 March 2023
(This article belongs to the Special Issue Innovative Horticultural Crop Cultivation and Management)

Abstract

:
Fertilization is essential for the optimal growth and development of crops; however, the amount of fertilizer can cause positive or negative effects depending on its rate. In addition, the cultivation system plays a significant role in determining vegetative growth and fruit quality. Therefore, the objectives of this study were to examine the Micro-Tom response to different fertilization rates (first experiment), and to assess the effect of three different cultivation systems on its growth, yield, and fruit quality (second experiment). The fertilization rates used were (A) no fertilizer application control, (B) 0.026 g L−1, (C) 0.052 g L−1, (D) 0.13 g L−1, (E) 0.26 g L−1 standard, (F) 0.52 g L−1, and (G) 1.3 g L−1, and the cultivation systems were conventional, organic, and hydroponic. The results of the first experiment showed that plant growth and yield of Micro-Tom were highly influenced by the fertilization rate and Micro-Tom recorded the highest yield at 0.52 g L−1. In terms of the second experiment, the hydroponically grown Micro-Tom tended to accumulate amino acid, while organic and conventional systems showed more accumulation of sugars and organic acid; the highest yield was recorded in the hydroponic system. The yield obtained in the hydroponic systems was more than double that of the soil cultivation methods. The findings of this study can contribute to promoting the organic and hydroponic cultivation of tomatoes.

1. Introduction

The conventional agricultural system faces considerable challenges in supplying adequate food along with the population rise. According to the United Nations, the world population could reach nearly 9.7 billion in 2050 [1] and it will need 70 to 100% more food [2]. However, achieving the zero-hunger goal becomes difficult due to environmental degradation and climatic changes.
Tomato (Solanum lycopersicum L.) is the second most-consumed vegetable in the world after potato (S. tuberosum L.) [3], and its production extends from tropical to temperate regions. Global tomato production was 186 million tonnes in 2020, and Japan produced 706,000 tonnes in the same year [4]. Moreover, this fruit is an excellent source of bioactive compounds such as minerals, vitamins, and carotenoids which cannot be synthesized in the human body [5].
In order to achieve maximum yield, excessive fertilization has been practiced despite the severe environmental impacts and negative outcomes on crop growth and quality. Nitrogen (N) is recognized as an essential nutrient for the optimal growth and development of crops; however, a high dose of application causes yield reduction, delays fruit development [6,7,8], reduces sugar content (which causes poor taste), and decreases the concentration of vitamin C [9] and phenolic compounds [10] in tomato. Phosphorus (P) and Potassium (K) are two other essential macronutrients for plants. Maintaining a sufficient level of P in the soil is important for the growth and development of crops as it has been associated with crop yield, soluble solids, and plant metabolites [11,12,13]. An adequate amount of K improved the quality of fruits, particularly in size and shape, and enhanced soluble solids, ascorbic acid, and fruit color [14,15].
In addition to the application rate of fertilizers, cultivation methods and nutrient sources also play an important role in crop growth and fruit quality. The main cultivation methods used for crop production are conventional, organic, and hydroponic. Among them, organic agriculture is recognized as a solution for food production with lesser environmental impacts due to the absence of synthetic pesticides and chemical fertilizers [16,17]. Therefore, consumers recognize that organically-produced vegetables are safe and healthy. Studies showed that organically produced tomatoes are rich in nutritional components that increase fruit quality. For example, tomatoes grown using grass-clover mulch and chicken manure presented higher phenolic and ascorbic acid content than those produced hydroponically with mineral nutrient solution [18].
In the hydroponic method, plants are supplied with water and minerals using nutrient solutions [19]. Higher yield, less labor-intensive, water and nutrient conservation, and fewer or no soil-borne diseases favor hydroponics over conventional and organic systems [20]. Currently, Japan is among the top countries in the world that use the hydroponic system for vegetable cultivation [21]. It has been reported that hydroponically grown tomatoes contain higher lycopene and β-carotene [22], sugar/acid ratio, firmness, and vitamin C than conventionally growing tomatoes [23].
Despite these positive factors, a high possibility of nitrate accumulation in hydroponically produced crops makes us reconsider consuming vegetables cultivated using a hydroponic system. For instance, lettuce cultivated using a hydroponic system showed a significantly higher nitrate concentration (71.5 g/kg) than those grown conventionally [24]. Higher nitrate consumption is not good for human health as it turns to nitrite in the body, which might be carcinogenic [25].
The objectives of this study were to examine the Micro-Tom response to different fertilization rates (first experiment), and to assess the effect of three different cultivation systems on its growth, yield and fruit quality (second experiment).

2. Materials and Methods

The first experiment was carried out to examine the effect of different fertilization rates on the quality and growth of Micro-Tom. The second experiment was carried out to examine the effects of cultivation systems on the quality and growth of Micro-Tom.

2.1. Experiment Site

Both experiments were conducted at the greenhouse and laboratory of Tropical Horticulture of Tokyo University of Agriculture, Tokyo, Japan. The experimental site is located at an altitude of 53 masl, latitude of 35°38″33′, and longitude of 139°37″48′.
The first experiment was conducted from 18 June to 30 September 2020 (temperature 25.8 °C, humidity 41.0%), and the second from 7 August to 19 November (temperature 22.1 °C, humidity 47.5%), in the following year (2021). Weather conditions were recorded using a thermo recorder (Ondotori TR-72wf-H, T&D Corporation, Nihonbashi, Chuo-ku, Tokyo, Japan).

2.2. Plant Material

Tomato cv. Micro-Tom was used for this study. Seeds were sown in an aluminum petri dish with a wetted filter paper and kept in a 25 °C incubator for 48 h until germination. Then, seedlings were carefully transplanted in seedling trays filled with vermiculite. Seedlings were manually irrigated every day until they reached the 4-5 leaf stage. Micro-Tom was used for this study because it has been widely used in laboratories as a fruit model [26].

2.3. Cultivation Systems

2.3.1. Conventional System

Soluble chemical fertilizers were used in the conventional system and seedlings were transplanted into 1-liter volume pots filled with ‘Akadama’ soil. Akadama soil is an inert inorganic granular clay soil with good water retention abilities and almost no nutrients, originating from the loamy layer of the Kanto Region.

2.3.2. Organic System

The same as the conventional system, seedlings were transplanted into 1-liter volume pots filled with ‘Akadama’ soil. Soluble organic fertilizer made from poultry manure (‘Ise green’, Ise farm Co., Ltd., Ibaraki, Japan) was applied to the soil.

2.3.3. Hydroponic System

The hydroponic method was carried out using Rockwool, Gordon R Delta 100 × 100 × 65 mm (Rockwool B.V, Saint-Gobain, Courbevoie, France). A soluble fertilizer was used to prepare the solution to provide nutrients to the Micro-Tom plants.

2.4. Field Preparation and Crop Management

Only the conventional system was used for the first experiment. The seedlings at the 4–5 leaf stage were transplanted into the pots with a 1-liter volume filled with Akadama soil. Plants were manually irrigated once every two days, and axillary shoots were removed weekly.
Conventional, organic, and hydroponic methods were used for the second experiment. In both conventional and organic systems, seedlings at the 4–5 leaf stage were transplanted into 1-liter volume pots filled with ‘Akadama’ soil.
In the hydroponic system, seedlings were removed carefully from the vermiculite medium and washed thoroughly before transplanting to the Rockwool. After seedlings were transplanted into Rockwools, they were placed on a flat tray with holes (eight Rockwools per tray). At the beginning of the experiment, Rockwools were dipped in the nutrient solution for 10 min to soak the solution; thereafter, the dipping time was changed to 5 min and dipped once in every two days throughout the experiment period. The nutrient solution was prepared based on the electrical conductivity (EC), adjusted as 0.8, 1.6 and 2.2 dS m−1 in the transplanting, growth, and harvest stages, respectively.
Sticky aphid and whitefly traps were used as insect catcher traps to minimize the insect population in the greenhouse.

2.5. Fertilization Treatments

The first experiment was carried out by the conventional cultivation system using the chemical fertilizer Kumai-Kasei (N: P: K = 8: 8: 8). Plants were treated with eight different fertilizer rates: (A) no fertilizer application control, (B) 0.026 g L−1, (C) 0.052 g L−1, (D) 0.13 g L−1, (E) 0.26 g L−1 standard, (F) 0.52 g L−1, and (G) 1.3 g L−1. Each treatment included 10 replications. This fertilizer contained the following micronutrients: 0.10% of manganese (Mn), 0.05% of copper (Cu), 0.02% of zinc (Zn), and 0.02% of molybdenum (Mo).
The standard fertilization rate used in Japan for N for tomatoes according to the recommendation of Kanagawa prefecture [27] corresponds to 0.26 g L−1, which was applied in the first experiment. In the second experiment, the same N fertilization rate was calculated for the three cultivation systems, based on the N content of each fertilizer; the P and K proportions varied according to the fertilizer source.
Conventional, organic, and hydroponic systems were used for the second experiment. In the organic system, 8.25 g L−1 of ‘Ise green’ (N: P: K = 3.2: 4.1: 3.0, Ise farm Co., Ltd.) was used as the fertilizer source. In the conventional system, 1.24 g L−1 ammonium sulfate (21% N), 2.06 g L−1 superphosphate of lime (60% P), and 0.12 g L−1 potassium chloride (50% K) were used as chemical fertilizers; this amount of each fertilizer represented the same rate than that used for the organic system. No micronutrients were added to these cultivation systems. In terms of the hydroponic method, OAT House 1 (N: P: K = 10: 8: 27, OAT Agrio Co., Ltd., Tokyo, Japan) fertilizer was used to prepare the nutrient solution using 2.60 g L−1 of the fertilizer. This fertilizer also contained 4% of magnesium, 0.1% of Mn, 0.1% of boron, 0.18% of iron, 0.002% of Cu, 0.006% of Zn, and 0.002% of Mo.

2.6. Growth Parameters

Plant height (cm) and root length (cm) were measured using a vernier caliper (Mitutoyo, CD-15C, Kanagawa, Japan). An analytical balance (A&D GH-252, Tokyo, Japan) was used to measure root weight (g) after drying in an oven (SANYO convection oven MOV-112F, Osaka, Japan) at 70 °C to a constant weight. The number of leaves and fruit sets was counted visually. All fruits were harvested at the red stage, and fruit fresh weight was measured. A digital balance (ASONE Corporation, Osaka, Japan) was used to measure fruit weight.

2.7. Fruit Quality Analysis

The fruit quality analysis was conducted when the fruit was in the red stage (about 90 to 100 days after transplanting).
The a* value of the fruit color was measured with a colorimeter (NR- 3000, Nippon Denshoku Ind. Co., Ltd., Tokyo, Japan).
To measure ascorbic acid (Vitamin C), tomato fruits were homogenized using a pre-cooled mortar and pestle. Then, 1 g of pulp was mixed with a 2 g of 5% metaphosphoric acid solution, and 1 mL from the mixture was taken into a 1.5 mL Eppendorf tube to centrifuge at a speed of 5000 rpm for 5 min at 25 °C (TOMY MX-307 high-speed refrigerated microcentrifuge, Tokyo, Japan). Finally, an ascorbic acid strip (Reflectoquant®, Merck Inc., Darmstadt, Germany) was immersed in the solution and placed in the reflectometer (RQ-flex Plus, Merck Inc., Darmstadt, Germany). The results were expressed in mg 100 g pulp−1.
The squeezed juice of tomato fruits was used to measure the soluble solids content (Brix), using a digital refractometer (POCKET PAL-1, ATAGO, Tokyo, Japan).

2.8. Metabolomic Analysis

Three replicated samples of 6 individual fruit from each treatment were homogenized using pre-cooled mortars and pestles with liquid nitrogen. Hundred grams from the resulting puree was used for the extraction. Methanol (250 µL) and one zirconia bead were added to each sample and mixed well using a tissue layer (Oscillating Mill MM 400, Retsch GmbH, Haan, Germany) at 27 Hz for 2 min. After adding 250 µL of chloroform, samples were put in a thermo mixer (Eppendorf Thermomixer F2.0, Hamburg, Germany) for 3 min at 37 °C, 1200 rppm. The standard solution of 50 µL and 175 µL of ultrapure water were subsequently added to the mixture and centrifuged (TOMY MX-307 high-speed refrigerated microcentrifuge, Tokyo, Japan) at 120 × 100 rpm for 10 min at 25 °C. The standard solution was prepared by diluting 0.2 mg of Ribitol in 1 mL of ultra-pure water. Then carefully 80 µL of supernatant from each sample was added to the 1.5 mL of Eppendorf tube and put them in a centrifugal vaporizer (EYELA CVE-200D, TOKYO RIKAKIKAI Co., LTD., Tokyo, Japan) for 2 h with a cooling trap apparatus (EYELA UT-80, TOKYO RIKAKIKAI Co., LTD., Tokyo, Japan). After that, samples were transferred to a freeze dryer (EYELA FDM-1000, TOKYO RIKAKIKAI Co., LTD., Tokyo, Japan) and kept overnight. The resulting residues were dissolved in 40 µL of methoxyamine hydrochloride solution by putting in the thermo mixer for 90 min at 37 °C followed by adding 50 µL of N-Methyl-N-trimethylsilyl tri fluoroacetamide (MSTFA) with another 30 min incubation in the thermomixer under the same condition. Then 50 µL from the extraction was used to analyze metabolomics components.
The Methoxyamine hydrochloride solution was prepared by diluting 20 mg of Methoxyamine hydrochloride in 1 mL of Pyridine.
Metabolomic analysis was performed using gas chromatography-mass spectrometry (GC-MS-QP2010 plus, SHIMADZU, Tokyo, Japan). The column used was DB-5 (0.25 mm internal diameter, 30 cm length, and 1.00 µm of film thickness, Agilent Technologies Inc., Santa Clara, CA, USA). The GC conditions were as follows: The oven temperature was held for 1 min at 60 °C, raised to 320 °C at a rate of 4 °C min−1, and held at 10 min, with the flow rate of Helium 1.1 mL min−1. The analysis method of mass spectrometry was scan mode and conditions; The transfer line was set at 290 °C, and the ion source was kept at 200 °C. Mass spectra were recorded at a scan s−1 with an m z−1 45–600 scanning range.

2.9. Leaf Analysis

The fully developed leaf area was measured using a leaf area analyzer (AAM-8, HAYASHI DENKOH Co., Ltd., Tokyo, Japan). The software Image J (http://rsb.info.nih.gov/ij/, accessed on 8 October 2022) was used to measure leaf length. Both parameters were measured at the beginning of November. The number of leaves per plant was counted visually. The SPAD value of the third leaf from the top was measured with a chlorophyll meter (SPAD-502 Plus, Konica, Minolta, Japan); these data were recorded once a week from September to November.
Nitrate-nitrogen (NO3-N) was measured at the beginning of November. The third leaf from the top was ground using a mortar and pestle with 25 mL of pure water. The resulting sample was centrifuged at a speed of 5000 rpm for 5 min (TOMY MX-307 high-speed refrigerated microcentrifuge, Tokyo, Japan), and the supernatant was used to measure NO3-N using a reflectometer (RQ-flex Plus, Merck Inc., Darmstadt, Germany). The amount of NO3-N was expressed in mg 100 g−1.

2.10. Experimental Design and Statistical Analysis

A completely randomized block design was used. In the first experiment, each treatment had 10 replications while in the second experiment there were 20 replications per cultivation system. The significant differences among treatments were determined through One-way ANOVA. The R statistical program (version 1.4.1106, accessed on 3 January 2023) was used to carry out the data analysis.
Principal component analysis (PCA) and Hierarchical Cluster Analysis (HCA)—Heatmap were used to analyze metabolome data to visualize the relationship among primary metabolites of tomato fruits and their association with three cultivation systems. The multivariate analysis software Pirouette (Informetrix, Inc., Washington, DC, USA) and MetaboAnalyst were used to carry out PCA and HCA-Heatmap, respectively.

3. Results

3.1. Effect of Different Fertilization Rates on Plant Growth and Fruit Quality
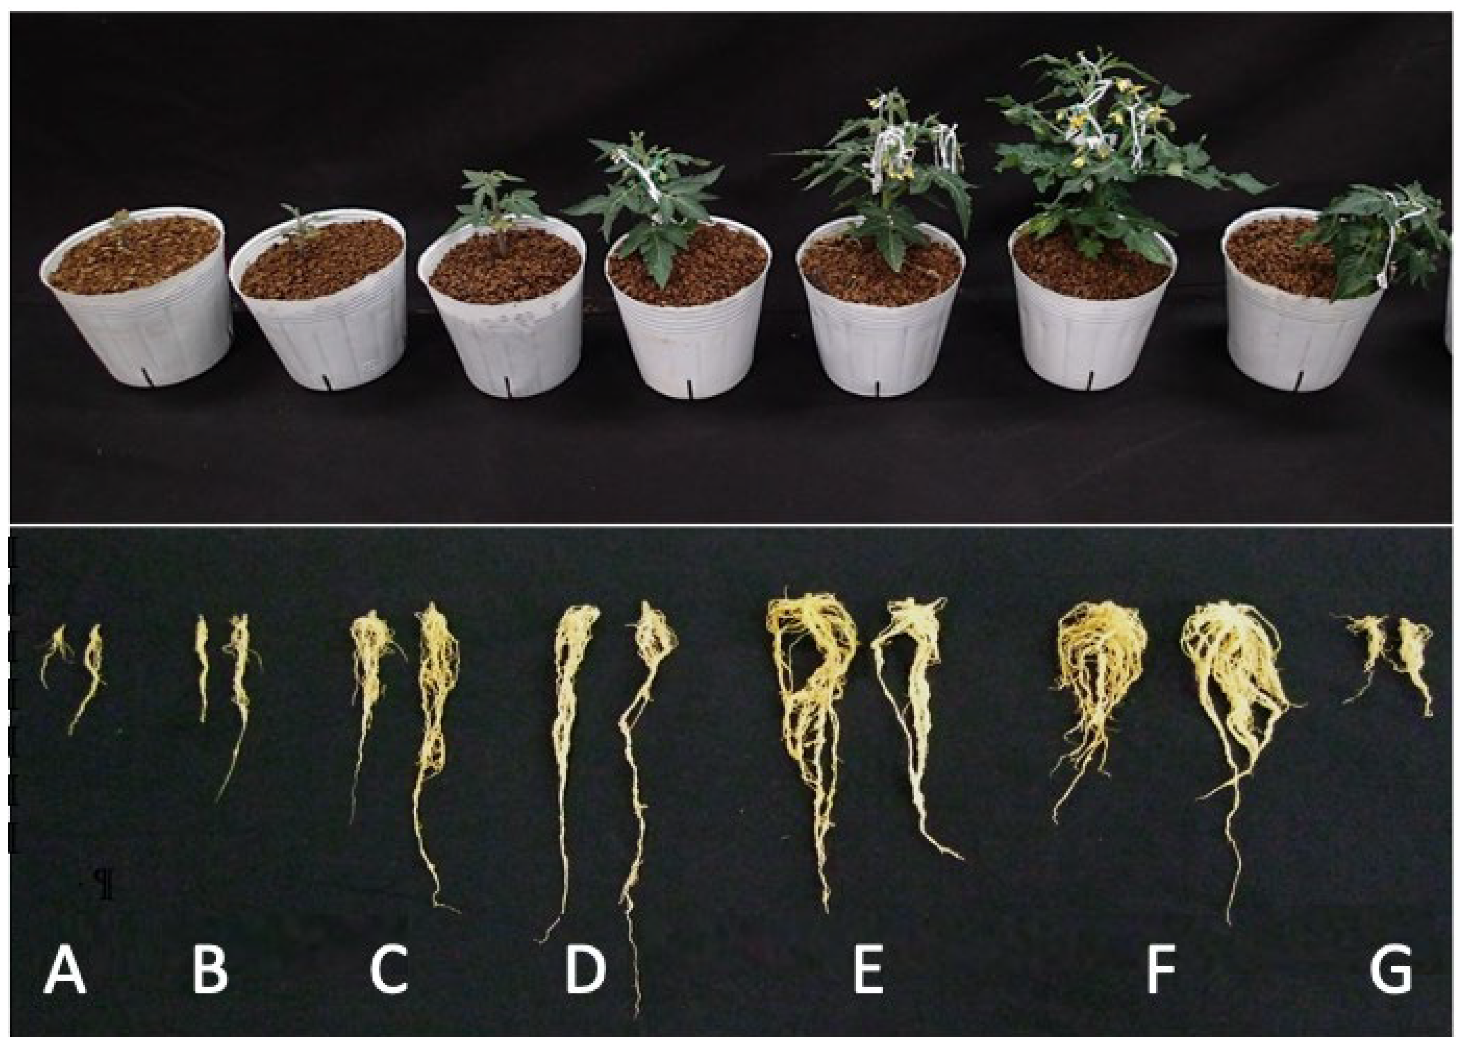
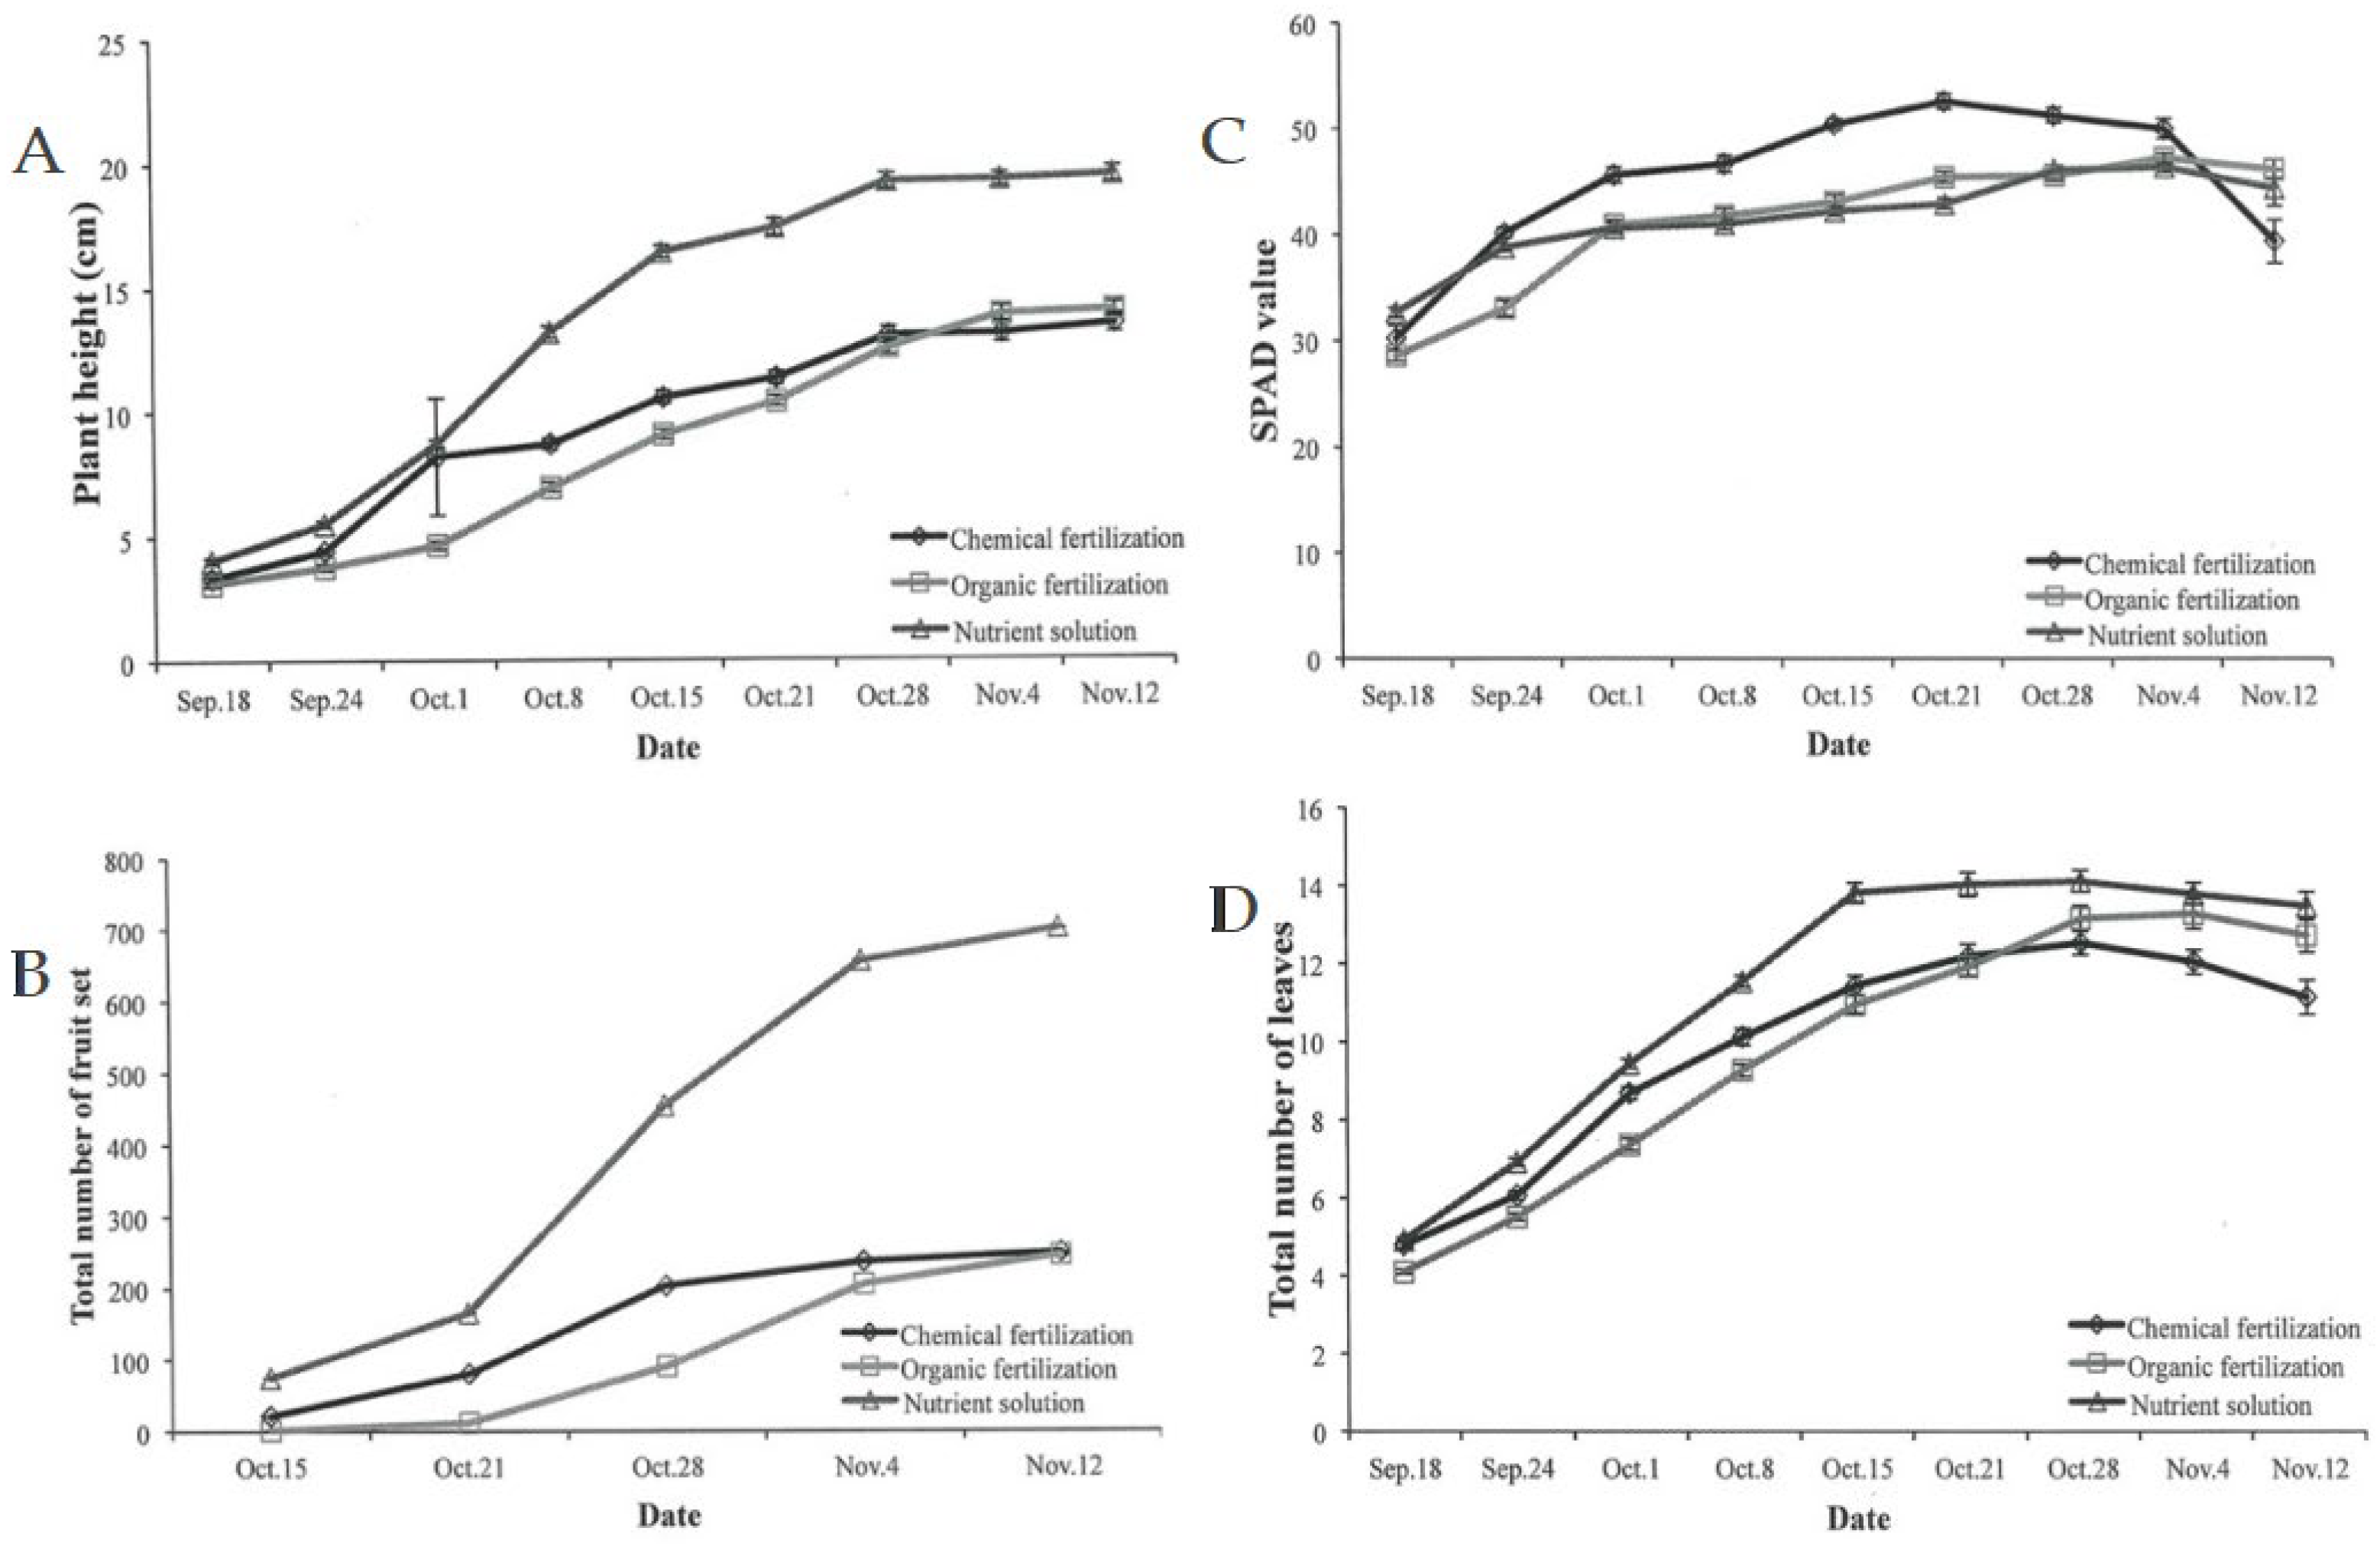
3.1.1. Plant Growth

The results of plant growth parameters are presented in Table 1. The plants under the different fertilization rates at 51 days after transplanting are presented in Figure 1. Except for root length, the highest value for the number of flowers, plant height, and root weight were recorded by the plants under treatment F, which is double the standard rate; where the highest values for the number of flowers, plant height, and root weight were 35.4, 11.7 cm, and 1.11 g, respectively. However, the value of plant height was not significantly different among D, E and F treatments.
Flowers did not appear in the plants under treatments A and B. The highest value for the root length was recorded in the D treatment (23.5 cm), followed by treatment E (20.7 cm). Although treatment F recorded the highest dry root weight (1.11 g), the root length was not the longest (Figure 1) due to the greater development of its secondary roots.

3.1.2. Yield and Fruit Quality Parameters

Only the pots with 0.13 g L−1 (D), 0.26 g L−1 (E), and 0.52 g L−1 (F) rates bore fruits available at harvest. The results of fruit quality parameters and yield are presented in Table 2. The highest yield per plant was recorded in treatment F (2144.5 g), which is significantly higher than in treatments E (447) and D (377.8). For weight per fruit, treatment E (standard) had a greater value (3.7 g) followed by treatment F (3.3 g) and D (2.6 g). The a* value of fruit skin color and the ascorbic acid content showed no pronounced difference among treatments. However, it differed slightly in the following order: F > E > D (a* value); D > E = F (ascorbic acid). The highest soluble solids content (Brix) was recorded in fruits from treatment F (5.9 %), while treatment D recorded the lowest value (5.3 %).

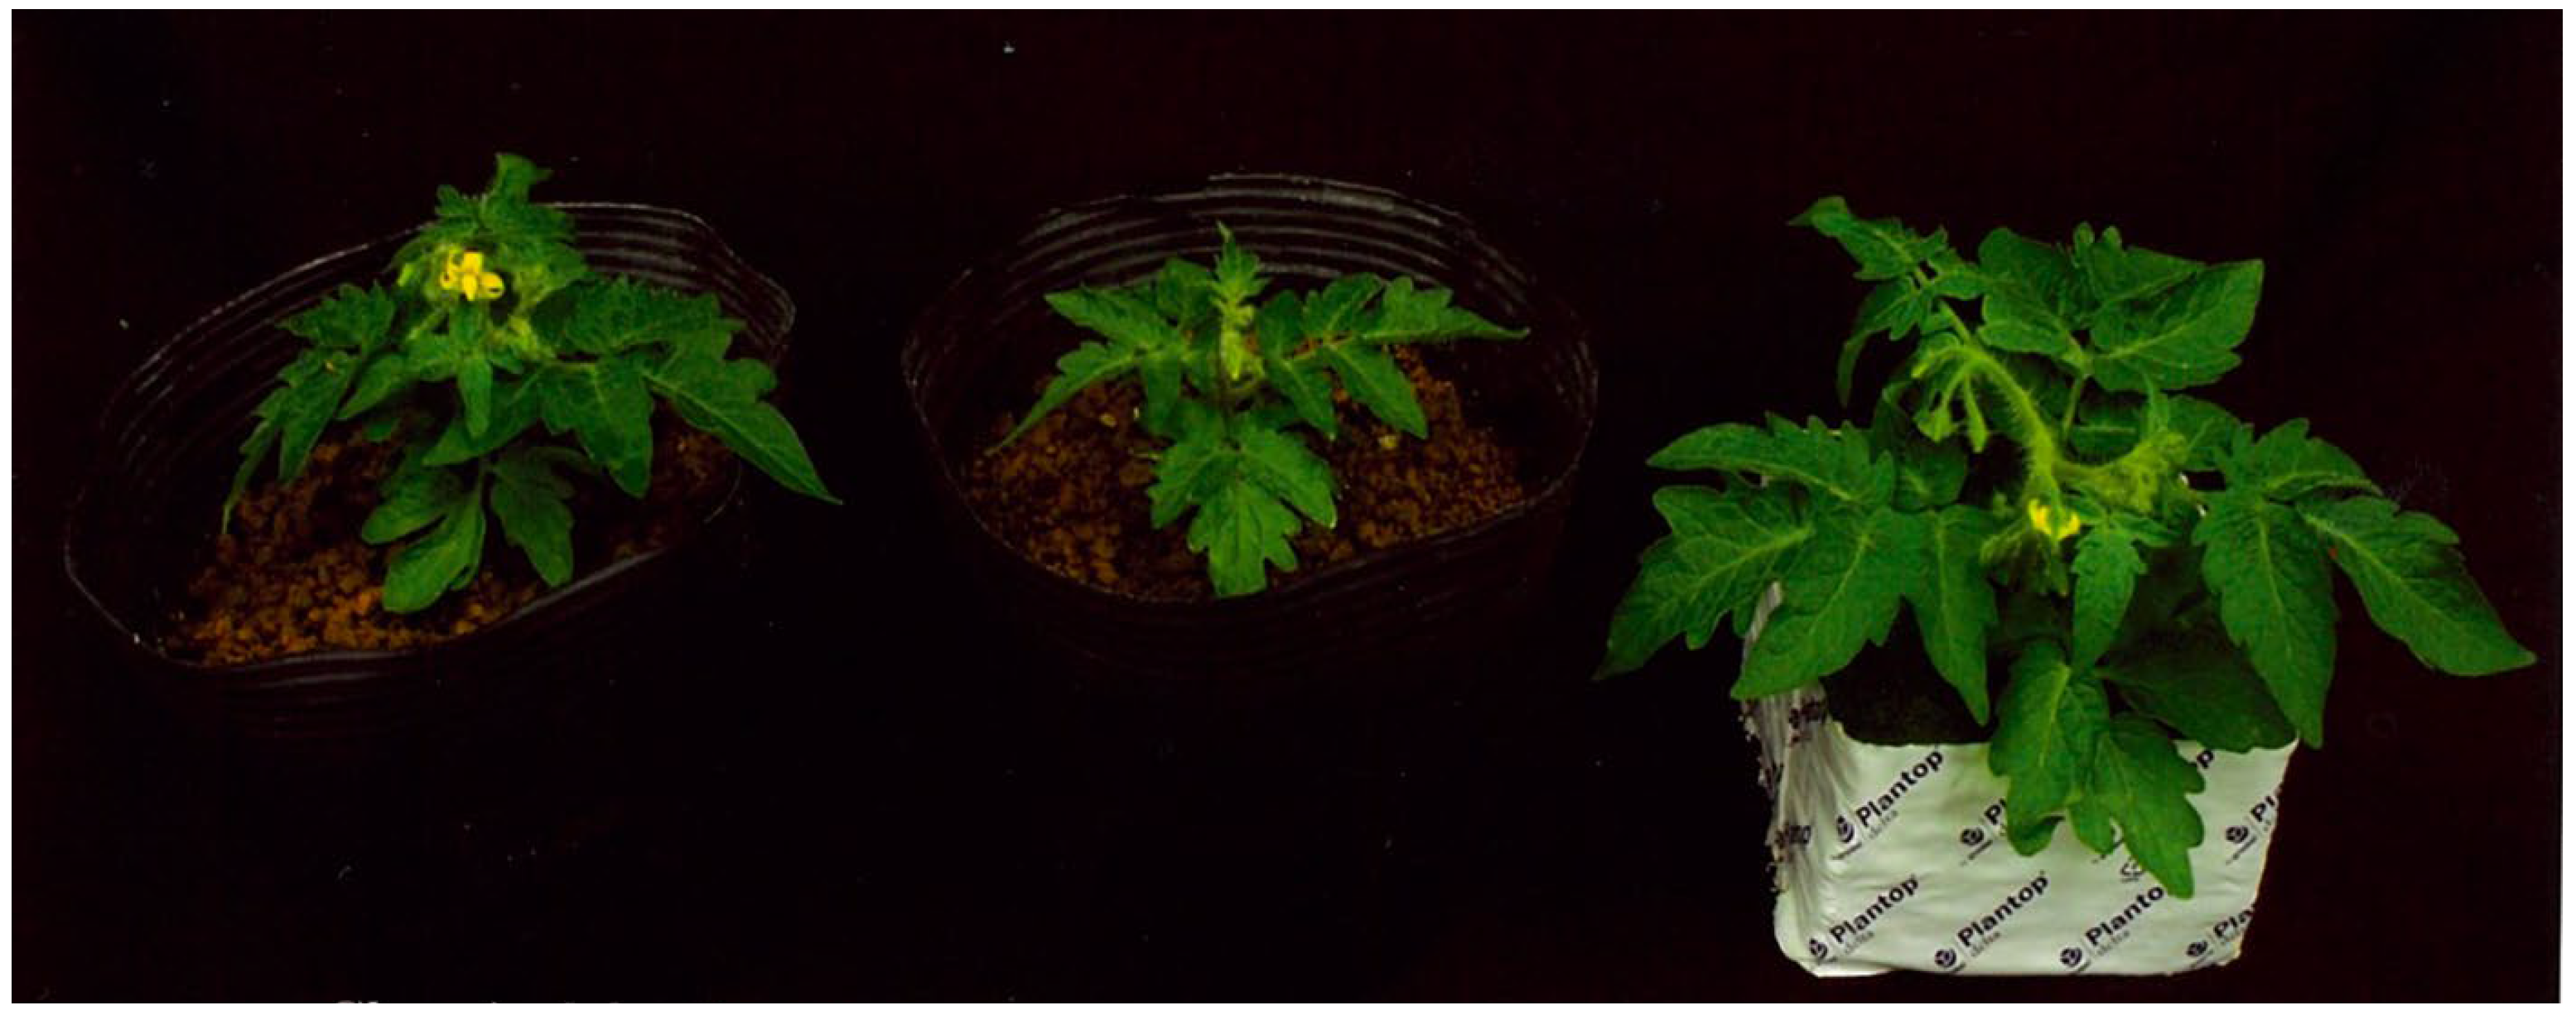
3.2. Effect of Cultivation System on Plant Growth and Fruit Quality

3.2.1. Leaf Parameters

The number of leaves per plant, leaf area, length of the fully developed leaf, and NO3-N were highly influenced by the cultivation method (Table 3). The hydroponic system recorded the highest value for all parameters: number of leaves per plant, leaf area, length of fully developed leaf, and NO3-N. The NO3-N amount and leaf area of plants under the hydroponic method were higher by more than twice the organic method. The length of the fully developed leaf and NO3-N amount did not show significant differences between the chemical and organic cultivation methods; however, the chemical cultivation system had a greater leaf area than the organic cultivation system. Figure 2 shows the Micro-Tom plants under the three cultivation systems 42 days after transplanting.

3.2.2. Fruit Quality Parameters and The Number of Flowers Per Plant

According to the data (Table 4), the number of flowers per plant, yield, weight per fruit, and amino acids were significantly higher in the hydroponic method; however, a* value, ascorbic acid, soluble solids content (Brix), organic acids, and total sugar content recorded the highest value in the organic method. Further, the data indicated that yield per plant is highly influenced by the cultivation method. The highest yield was recorded in the hydroponic method (432 g plant−1), more than twice as high as the conventional (194 g plant−1) and organic (182 g plant−1) cultivation methods.
The changes over time in plant height, the total number of fruit sets, SPAD value, and the total number of leaves per plant are shown in Figure 3. All parameters except for the SPAD value were higher in the plants grown under the hydroponic system. In both conventional and hydroponic methods, the total number of leaves per plant increased faster than the organic method; however, in the end, the organic method had a slightly higher number of leaves than the conventional system.

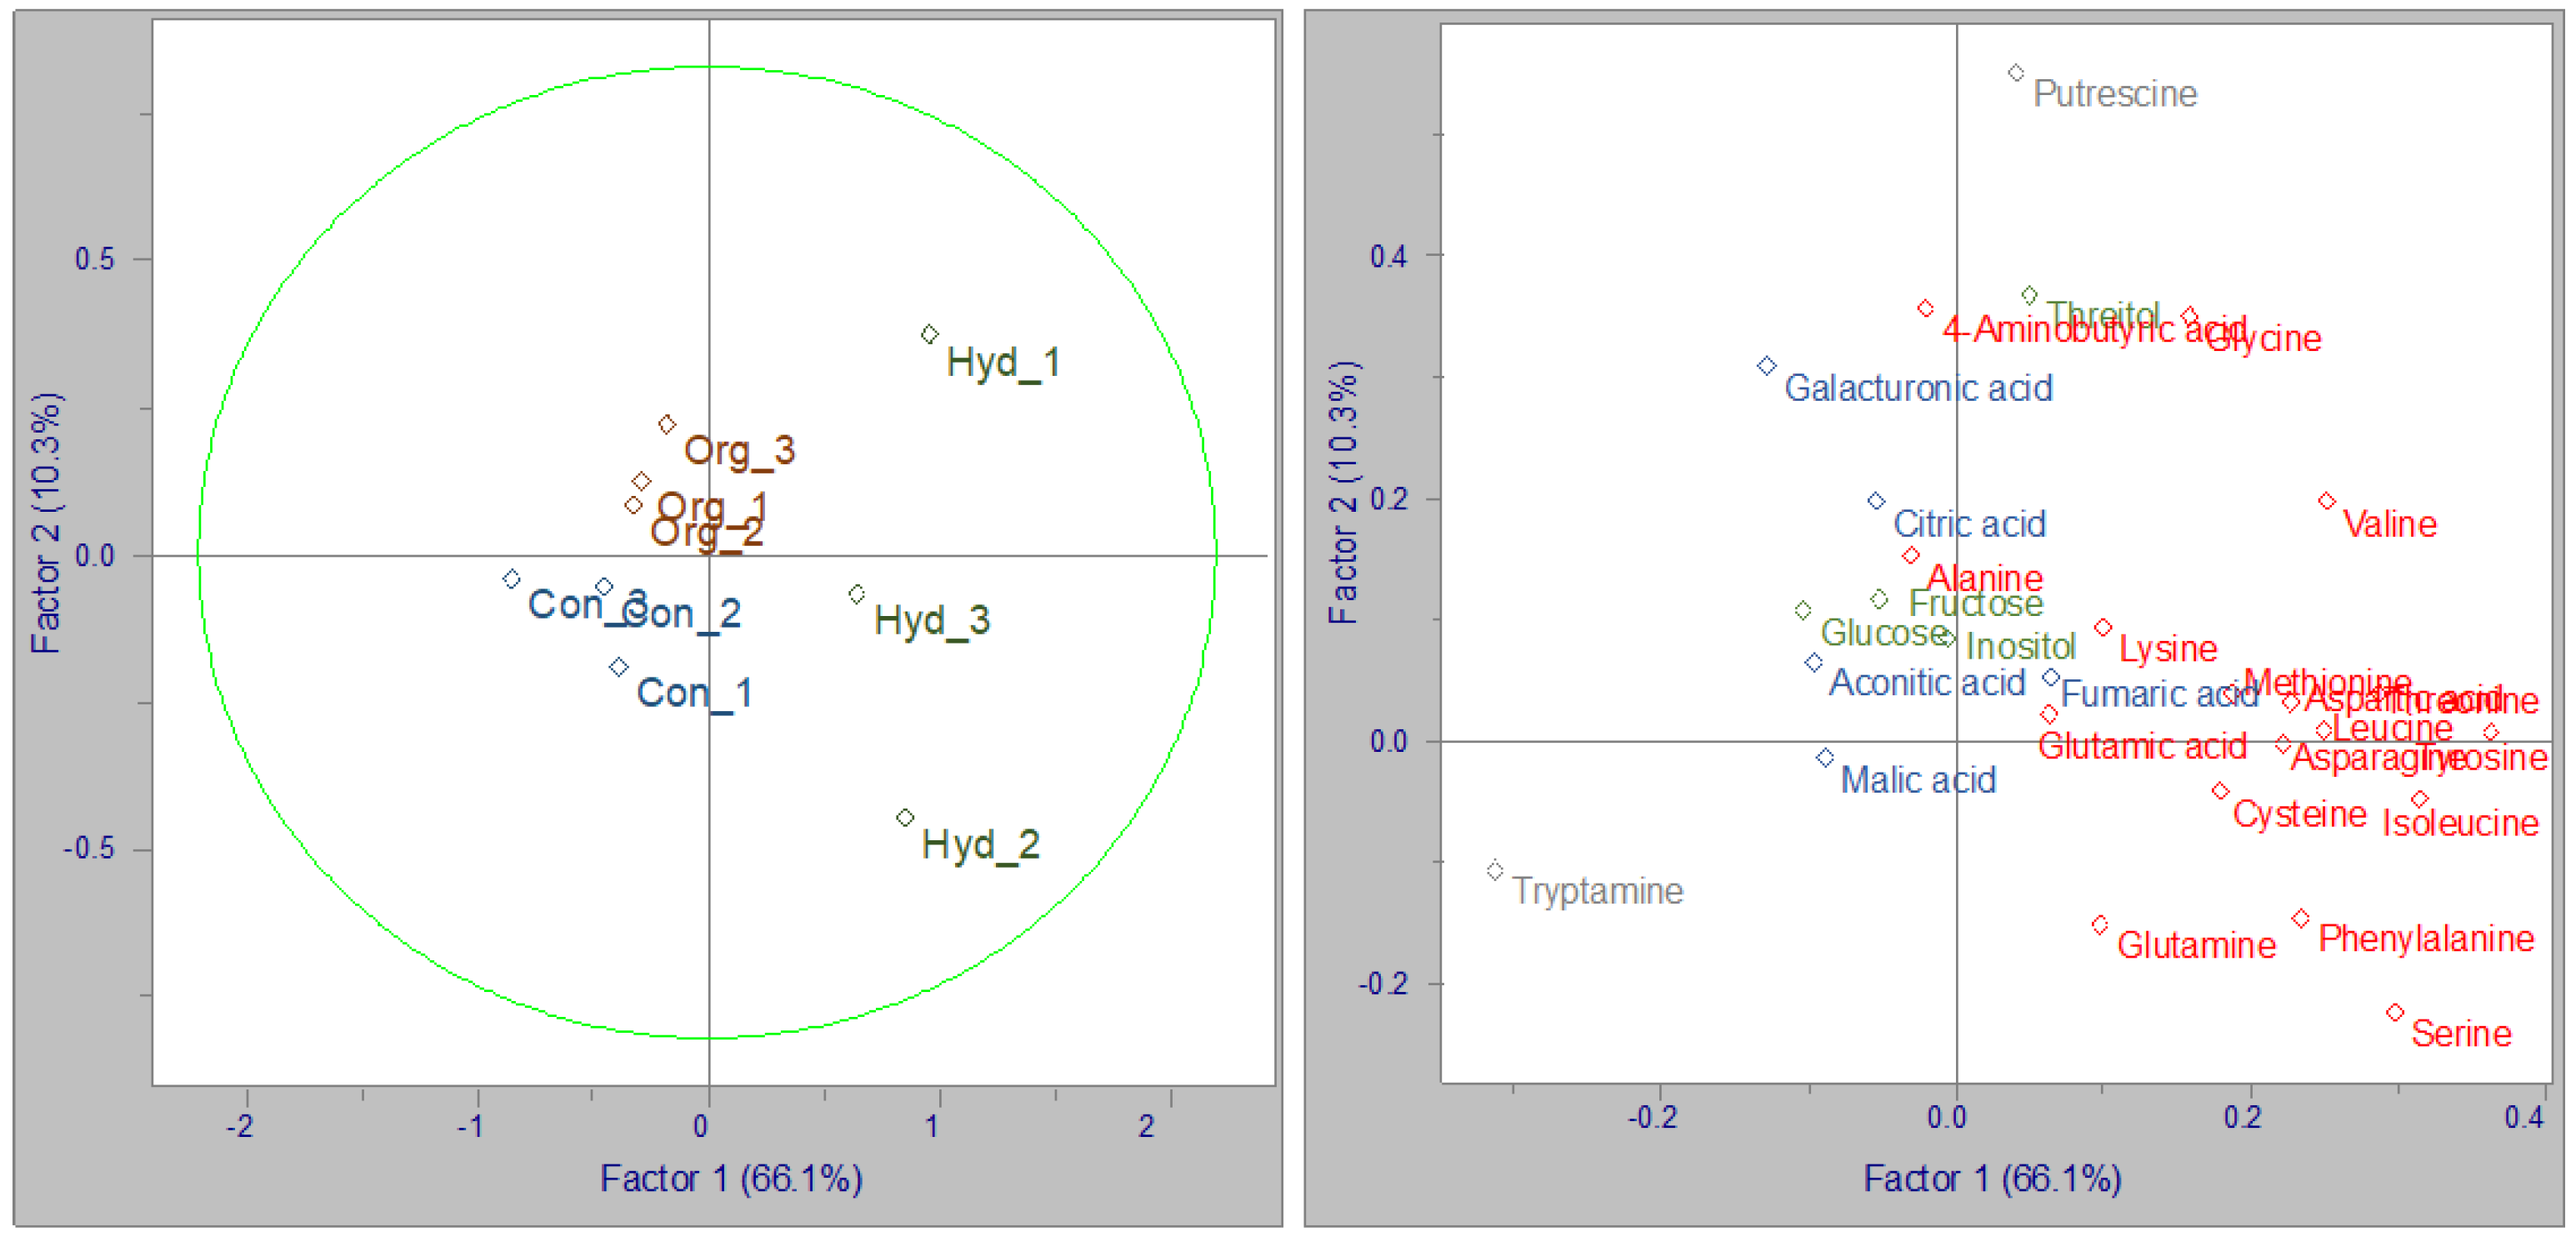
3.2.3. Principal Component Analysis (PCA)

The first component of the PCA (Figure 4) represented 66.1% of the variance, whereas the second component explained 10.3%. Altogether, they explained 76.4% of the variance of the data. According to the results, treatments were clearly separated into three groups: the hydroponic system, the organic system, and the conventional system. The primary metabolites of sugars and organic acids of Micro-Tom cultivated by the conventional and organic cultivation systems were centered, while amino acids of the hydroponic grown Micro-Tom were spread on the right side along with the first component.
Hierarchical cluster analysis (HCA) and heatmap visualization of metabolite profile (Figure 5) shows that the hydroponic system was associated with amino acids, mainly asparagine, leucine, isoleucine, aspartic acid, methionine, phenylalanine, and tyrosine; the conventional system was more linked to malic acid and glucose; and the organic system was related to alanine and aconitic acid. In addition, cluster A was enriched in amino acid (93.75%) while cluster B was enriched in sugars (39%).

4. Discussion

4.1. Effect of Different Fertilization Rates Plant Growth and Fruit Quality

According to the results of fertilizer treatments, it was observed that the plant growth increases along with the fertilization rate from treatment A (control) to F (0.52 g L−1). N, P, and K are essential macronutrients for tomato plants. According to Abdelhady et al. [28], chlorophyll content in plants decreases as the fertilization rate reduces. Chlorophyll content in the leaves is a determining factor for plant growth and fruit set, which might be the reason Micro-Tom plants treated with low fertilization rates (control, 0.026 g L−1, 0.052 g L−1) were unable to produce fruits. N is the most important nutrient for growing tomatoes and it is required in large amounts for optimal growth [29]; thus, low fertilization affects crop plants’ physiological metabolism, hindering plant growth and decreasing chlorophyll content and photosynthesis [30,31]. However, Matsumaru et al. [32] reported that the changes in external appearances, such as necrosis and/or wilting of tomato leaves, could be observed when N fertilizer application exceeds the adequate amount. These symptoms were observed in the seedlings that received a rate of 1.3 g L−1 where the rate was five times higher than the standard rate and was unable to produce fruits; therefore, this symptomatology could be related to the latter nutrient.
The results indicated that the number of flowers per plant and fruit yield positively correlated with the fertilization rate. In addition to N, K increases the fruit number and yield of tomatoes by stimulating early flowering and fruit set [33]; in this, the study rate of 0.52 g L−1 gave the highest yield and number of flowers, and this might be related to the fact that it has more K.
Although previous studies reported that ascorbic acid content in crops was negatively affected by the N rate [9,34,35] and positively correlated with the K and P rates [36,37,38], according to the results of our study, ascorbic acid content was not significantly affected by the fertilization rate.
In our research, soluble solid content was positively affected by the fertilization rate. K is the nutrient that is related to the increase in soluble solid content in the fruits and its increment would affect positively this parameter [39]. On the other hand, Wang et al. [9] reported that a lower amount of N influenced the increase in soluble solid but this argument is when this nutrient is evaluated individually. Among all the fruit traits, yield is the most important parameter for the farmers because it represents their expected income. The result of this study clearly showed that the fertilization rate highly influenced tomato yield.

4.2. Effect of Cultivation Systems on Plant Growth and Fruit Quality

Fruit quality parameters varied according to the cultivation method; in particular, differences were noticed between the soil cultivation systems (conventional and organic systems) and hydroponic systems. In this study, Rockwool was used for the hydroponic system, which has specific characteristics such as good aeration and is inert with low buffering capacity, which makes the nutrients available (almost 100%) for the plant [40]. N is an essential element for amino acids, and plants mainly uptake N as ammonium (NH4+-N) and nitrate N (NO3-N) [41,42]. The results of leaf parameters indicated that hydroponically grown tomato plant leaves contain a higher amount of NO3-N than the other two cultivation systems.
However, conventional and organic cultivation systems did not differ significantly in tomato fruit yield. These results are similar to the previous findings; similar tomato yields were recorded for plants grown in organic and conventional soil-bound systems [43,44,45]. In addition, soluble solids, fruit color (a* value), amino acid, total sugar, ascorbic acid, and organic acid content did not show a significant difference between the conventional and organic systems. The organic system reached similar soluble solids content as the conventional system. It has been reported that K and P have a positive effect on this parameter [39,46] since both systems had the same fertilization rates, the effect of these nutrients was similar for this trait. This is important because it shows that the organic system could reach similar fruit sweetness to the conventional one, but the organic system also involves other benefits to the environment.
Pieper and Barrett and Jurozek [47,48] reported that ascorbic acid content in tomato fruits is independent of the cultivation system. Among the three cultivation methods, the lowest ascorbic acid, organic acid, total sugar, and soluble solid content was recorded in the hydroponic system. Even though in the hydroponic system the K ratio is higher than in the other cultivation systems, it did not influence ascorbic acid and soluble solids as reported by Almeselmani et al. [49]. Ascorbic acid is the most abundant antioxidant in plants [50], and it can be negatively influenced by a higher level of N [51]. This response was observed in the hydroponic system, where leaves had high nitrate.
Micro-Tom leaves grown under organic cultivation showed the lowest NO3-N concentration and the highest ascorbic acid content, which agrees with other studies [52,53].
The plant height, number of fruit, and number of leaves per plant were found to be significantly higher in the hydroponic than in the other two systems. The high nutrient availability for the plants in the Rockwool, allowed Micro-Tom plants to have a higher growth rate and yield. This cultivation system had the highest K rate which positively influenced the tomato yield as has been mentioned by Colpan et al. [54]; moreover, Liu et al. [55] report the same trend with K but they did not find the effect in this trait when the P rate was increased. In addition, K stimulates fruit set [33], and this effect was observed in the hydroponic system in comparison to the soil cultivation systems. It was noticeable that at the same N rate (0.26 g L−1), the yield was higher in the first experiment than the second one but this increment was not proportional to the increase in fruit set registered in the cultivation systems; this might be associated with the fertilization success ratio due to the fact the P and K rates varied in the second experiment where only the N rate was fixed.
The fertilizer used for the hydroponic system also contains d B and Zn, and their effect plus the N outcome can cause more yield in tomatoes [56]. In addition, Haleem et al. [57] also reported that B and Zn had a positive effect on tomato yield.
The SPAD value illustrated a significant reduction after eight weeks of transplanting. Chlorophyll content in the leaves depends on several environmental factors such as temperature, moisture, and also the presence of required elements (N and P) [58,59,60]. Although hydroponically grown tomato plants could take more N than the other two cultivation systems, SPAD values were not very high because the leaf area expanded to reduce nitrate concentration to avoid toxic influence on the foliar cells.
In this study, PCA helped to illustrate how the cultivation system affects primary metabolite accumulation in tomato fruit. Amino acids are essential organic substances for the body and serve to build proteins and play an important role in cell metabolism [61]. However, essential amino acids cannot be synthesized in the body, and requirements should be supplied in food [62]. Therefore, the amino acid content in vegetables is considered a good quality indicator. The hydroponic system accumulated amino acids such as phenylamine, valine, and glycine which are important to the human body because they influence brain function, are essential for metabolism, and are major components in extracellular structural proteins [63,64,65].
The tomato fruit flavor is highly affected by the content of sugar and organic acids. Glucose, fructose, and sucrose are the commonly found sugars in tomatoes [66]; on the other hand, citric acid is considered as one of the most important natural organic acids because it is non-toxic and has a pleasantly sour taste [67]. According to the PCA results, Micro-Tom tomatoes grown under soil cultivation systems (conventional and organic) tended to accumulate glucose and fructose as well as some important organic acids such as citric and malic.
Briefly, we could infer that the hydroponically grown tomato is rather rich in amino acids, the organically grown one are sweet with rich sugars, and the conventionally grown one is a bit sour due to the higher amount of organic acids.

5. Conclusions

The results of the first experiment showed that plant growth and yield of Micro-Tom were highly influenced by the fertilization rate. Among all rates, Micro-Tom recorded the highest yield at 0.52 g L−1 in the greenhouse conditions.
In terms of cultivation systems, the hydroponically grown Micro-Tom tended to accumulate amino acid, whereas soil cultivation systems (organic and conventional) showed more accumulation of sugars and organic acid. At the same N rate, the yield obtained in the hydroponic system was more than doubled than the soil cultivation methods.
The findings of this study will contribute to promoting the organic and hydroponic cultivation of tomatoes which is beneficial to the environment.

Author Contributions

Conceptualization, N.T. and K.K.; Methodology, N.T., K.D., C.O., K.K. and A.S.; Data curation, N.T., C.O. and K.K.; Statistical analysis, K.D. and C.O., Writing—original draft preparation K.D. and K.K.; Writing—review and editing, N.T., K.D., C.O., K.K. and A.S. All authors have read and agreed to the published version of the manuscript.

Funding

This research was funded by the laboratory of Tropical Horticultural Science of Tokyo University of Agriculture.

Data Availability Statement

Data are contained within the article.

Acknowledgments

Thanks to the Tokyo University of Agriculture for supporting this research and to William Viera for his assistance in preparing the manuscript.

Conflicts of Interest

The authors declare no conflict of interest.

References

  1. United Nations. Peace, Dignity, and Equality on a Healthy Planet. Available online: https://www.un.org/en/global-issues/population#:~:text=The%20world%20population%20is%20projected,surrounding%20these%20latest%20population%20projections (accessed on 12 July 2022).
  2. Tomlinson, I. Doubling food production to fed the 9 billion: A critical perspective on a key discourse of food security in UK. J. Rural Stud. 2013, 29, 81–89. [Google Scholar] [CrossRef]
  3. Nicola, S.; Tibaldi, G.; Fontana, E. Tomato production systems and their application to the tropics. Acta. Hort. 2009, 821, 27–34. [Google Scholar] [CrossRef]
  4. Food and Agriculture Organization of the United Nations. Available online: https://www.fao.org/faostat/en/#data/QCL (accessed on 13 July 2022).
  5. Dorais, M.; Ehret, D.; Papadopoulos, A.P. Tomato (Solanum lycopersicum) health components: From the seed to the consumer. Phytochem. Rev. 2008, 7, 231–250. [Google Scholar] [CrossRef]
  6. Albornoz, F. Crop responses to nitrogen overfertilization: A review. Sci. Hortic. 2016, 205, 79–83. [Google Scholar] [CrossRef]
  7. Weinbaum, S.A.; Johnson, R.S.; Dejong, T.M. Causes and consequences of overfertilization in orchards. Hort. Technol. 1992, 2, 112–120. [Google Scholar] [CrossRef]
  8. Locascio, S.J.; Wiltbank, W.J.; Gull, D.D.; Maynard, D.N. Nitrogen in Crop Production; Hauck, R.D., Ed.; American Society of Agronomy Inc.: Madison, WI, USA, 1984; pp. 617–625. [Google Scholar]
  9. Wang, Z.; Li, S.; Malhi, S. Effects of fertilization and other agronomic measures on nutritional quality of crops. J. Sci. Food Agric. 2008, 88, 7–23. [Google Scholar] [CrossRef]
  10. Benard, C.; Gautier, H.; Bourgaud, F.; Grasselly, D.; Navez, B.; Caris-Veyrat, C.; Weiss, M.; Genard, M. Effects of low nitrogen supply on tomato (Solanum lycopersicum) fruit yield and quality with special emphasis on sugars, acids, ascorbate, carotenoids, and phenolic compounds. J. Agric. Food Chem. 2009, 57, 4112–4123. [Google Scholar] [CrossRef]
  11. Zhu, Q.; Ozofres-Hampton, M.; Li, Y.; Morgan, K.; Liu, G.; Mylavarapu, R.S. Effect of phosphorus rates on growth, yield, and postharvest quality of tomato in a calcareous soil. Hort. Sci. 2017, 52, 1406–1412. [Google Scholar] [CrossRef]
  12. Cao, F.; Guan, C.; Dai, H.; Li, X.; Zhang, Z. Soluble solids content is positively correlated with phosphorus content in ripening strawberry fruits. Sci. Hortic. 2015, 195, 183–187. [Google Scholar] [CrossRef]
  13. Li, Z.; Qiu, Q.; Chen, Y.; Lin, D.; Huang, J.; Huang, T. Metabolite alteration in response to low phosphorus stress in developing tomato fruits. Plant Physiol. Biochem. 2021, 159, 234–243. [Google Scholar] [CrossRef]
  14. Kanai, S.; Ohkura, K.; Adu-Gyamfi, J.J.; Mohapatara, P.K.; Nguyen, N.T.; Saneoka, H.; Fujita, K. Depression of sink activity precedes the inhibition of biomass production in tomato plants subjected to potassium deficiency stress. J. Exp. Bot. 2007, 58, 2917–2928. [Google Scholar] [CrossRef] [PubMed]
  15. Bustamante, M.; Munoz, A.; Romero, I.; Osorio, P.; Manquez, S.; Arriola, R.; Reyes-Diaz, M.; Ribera-Fonseca, A. Impact of potassium pre-harvest application on fruit quality and condition of sweet cherry (Prunus avium L.) cultivated under plastic covers in southern Chile orchards. Plants 2007, 58, 2917–2928. [Google Scholar] [CrossRef] [PubMed]
  16. IFOAM (International Movement of Organic Agriculture Movements). Definition of Organic Agriculture, IFOAM. 2015. Available online: https://www.ifoam.bio/why-organic/organic-landmarks/definition-organic (accessed on 20 January 2023).
  17. Gomiero, T.; Pimentel, D.; Paoletti, M.G. Environmental impact of different agricultural management practices: Conventional vs. organic agriculture. CRC Crit. Rev. Plant Sci. 2011, 30, 95–124. [Google Scholar] [CrossRef]
  18. Chassy, A.W.; Bui, L.; Renaud EN, C.; Van Horn, M.; Mitchell, A.E. Three-year comparison of the content of antioxidant microconstituents and several quality characteristics in organic and conventionally managed tomatoes and bell papers. J. Agric. Food Chem. 2006, 54, 8244–8252. [Google Scholar] [CrossRef]
  19. Richa, A.; Touil, S.; Fizir, M.; Martinez, V. Recent advances and perspectives in the treatment of hydroponic wastewater: A review. Rev. Environ. Sci. Biotechnol. 2020, 19, 945–966. [Google Scholar] [CrossRef]
  20. Jones, J.B., Jr. Hydroponics A Practical Guide for the Soilless Grower, 2nd ed.; CRC Press: Boca Raton, FL, USA, 2005; pp. 1–10. [Google Scholar]
  21. Asao, T.; Asaduzzaman, M. Hydroponics: A Standard Methodology for Plant Biological Researches; Asao, T., Ed.; In Tech: Rijeka, Croatia, 2012; pp. 67–100. [Google Scholar]
  22. Verdoliva, S.G.; Jones, D.G.; Detheridge, A.; Robson, P. Controlled comparisons between soil and hydroponic systems reveal increased water use efficiency and higher lycopene and β-carotene contents in hydroponically grown tomatoes. Sci. Hortic. 2021, 279, 109896. [Google Scholar] [CrossRef]
  23. Kunsch, U.; Scharer, H.; Durr, P.; Hurter, A.; Martinoni, J.; Sulser, G.H.; Seeger, B. Do differences exist in the quality between soilless and conventionally produced tomatoes and head lettuce. Mitt. Geb. Lebensm. Hyg. 1994, 85, 18–21. [Google Scholar]
  24. Novaes, H.B.; Vaitsman, D.S.; Dutra, P.B. Determination of nitrate in lettuce by iron chromatography after microwave water extraction. Quim. Nova 2009, 32, 1647–1650. [Google Scholar] [CrossRef]
  25. Powlson, D.S.; Addiscott, T.M.; Benjamin, N.; Cassman, T.M.; Kok, D.; Grinsven, H.V.; L’hirondel, J.; Avery, A.A.; Kessel, C.V. When does nitrate become a risk for humans? J. Environ. Qual. 2008, 37, 291–295. [Google Scholar] [CrossRef]
  26. Ecarnot, M.; Baczyk, P.; Tessarotto, L.; Chervin, C. Rapid phenotyping of the tomato fruit model, Micro-Tom, with a portable VIS-NIR spectrometer. Plant Physiol. Biochem. 2013, 70, 159–163. [Google Scholar] [CrossRef]
  27. Kanagawa Prefectural Government. Available online: https://www.pref.kanagawa.jp/docs/f6k/cnt/f6802/index.html (accessed on 23 January 2023).
  28. Abdelhady, A.S.; El-Azm, N.A.I.A.; Ei-Kafafi, E.S.H. Effect of deficit irrigation levels and NPK fertilization rates on tomato growth, yield and fruit quality. Middle East J. Agric. Res. 2017, 6, 587–604. [Google Scholar]
  29. Ferreira, M.M.M.; Ferreira, G.B.; Fontes, P.C.R. Eficiência da adubação nitrogenada do tomateiro em duas épocas de cultivo. Rev. Ceres 2010, 57, 263–273. [Google Scholar] [CrossRef]
  30. Bassi, D.; Menossi, M.; Mattiello, L. Nitrogen supply influences photosynthesis establishment along the sugarcane leaf. Sci. Rep. 2018, 8, 2327. [Google Scholar] [CrossRef] [PubMed]
  31. Wei, S.; Wang, X.; Shi, D.; Li, Y.; Zhang, J.; Liu, P.; Zhao, B.; Dong, S. The mechanisms of low nitrogen induced weakened photosynthesis in summer maize (Zea mays L.) under field conditions. Plant Physiol. Biochem. 2016, 105, 118–128. [Google Scholar] [CrossRef] [PubMed]
  32. Matsumaru, T.; Yoneyama, T.; Ishizuka, J.; Matsuoka, Y. Effect on growth of tomato and accumulation and assimilation of nitrogen. J. Jpn. Soc. Soil Sci. Plant Nutr. 1987, 58, 465–472. (In Japanese) [Google Scholar]
  33. Varis, S.; George, R.A.T. The influence of mineral nutrition on fruit yield, seed yield, and quality in tomato. J. Hort. Sci. 1985, 60, 373–376. [Google Scholar] [CrossRef]
  34. Rajasree, G.; Pillai, G.R. Effect of nitrogen nutrition on fruit quality and shelf life of cucurbitaceous vegetable bitter gourd. J. Plant Nutr. 2012, 35, 1139–1153. [Google Scholar] [CrossRef]
  35. Ibrahim, M.H.; Jaafar, H.Z.E.; Rahmat, A.; Rahman, Z.A. Improvement of nitrogen on flavonoids, glutathione, anthocyanin, ascorbic acid, and antioxidant activities of Malaysian medical plant Labisia pumila Blume (Kacip Fatimah). Int. J. Mol. Sci. 2012, 13, 393–408. [Google Scholar] [CrossRef]
  36. El-Nemar, M.A.; Abd El-Baky, M.M.H.; Salman, S.R.; El-Tohamy, W.A. Effect of different potassium levels on the growth, yield, and quality of tomato grown in sand-ponic culture. Aust. J. Basic Appl. Sci. 2012, 6, 779–784. [Google Scholar]
  37. Majid, F.; Jalal, M.; Munir, H. Effect of N, P, K concentrations on yield and fruit quality of tomato (Solanum lycopersicum L.) in tuff culture. J. Cent. Eur. Agric. 2010, 11, 179–184. [Google Scholar]
  38. Adebooye, O.C.; Adeoye, G.O.; Tijani-Eniola, H. Quality of fruits of three varieties of tomato (Lycopersicom esculentum (L.) Mill) as affected by phosphorus rates. J. Agron. 2006, 5, 396–400. [Google Scholar]
  39. Javaria, S.; Khan, M.Q.; Bakhsh, I. Effect of potassium on chemical and sensory attributes of tomato fruits. J. Anim. Plant Sci. 2012, 22, 1081–1085. [Google Scholar]
  40. Hao, X.; Papadopoulos, A.P. Growth, photosynthesis and productivity of greenhouse tomato cultivated in open or closed rockwool system. Can. J. Plant Sci. 2002, 82, 771–780. [Google Scholar] [CrossRef]
  41. Le, D.T.; Chu, H.D.; Le, N.Q. Improving nutritional quality of plant proteins through genetic engineering. Curr. Genom. 2016, 17, 220–229. [Google Scholar]
  42. Li, S.; Wang, Z.; Stewart, B.A. Five—Responses of crop plants to ammonium and nitrate N. Adv. Agron. 2013, 118, 205–397. [Google Scholar]
  43. Gravel, V.; Blok, W.; Hallmann, E.; Carmona-Torres, C.; Wang, H.; Van De Peppel, A.; Condor Golec, A.F.; Dorais, M.; Van Meeteren, U.; Heuvelink, E.; et al. Differences in N uptake and fruit quality between organically and conventionally grown greenhouse tomatoes. Agron. Sustain. Dev. 2010, 30, 797–806. [Google Scholar] [CrossRef]
  44. Nakano, A.; Uehara, Y. An effect of fertilization and cultivation on yield, quality, and environment of tomato. Agric. Hortic. 2006, 81, 291–301. (In Japanese) [Google Scholar]
  45. Heeb, A.; Lundegardh, B.; Ericsson, T.; Savage, G.P. Nitrogen form affects yield and taste of tomatoes. J. Sci. Food Agric. 2005, 85, 1405–1414. [Google Scholar] [CrossRef]
  46. Gad, N.; Kandil, H. Influence of cobalt on phosphorus uptake, growth and yield of tomato. Agric. Biol. J. N. Am. 2010, 5, 1069–1075. [Google Scholar] [CrossRef]
  47. Pieper, J.R.; Barrett, D.M. Effects of organic and conventional production systems on quality and nutritional parameters of processing tomatoes. J. Sci. Food Agric. 2009, 89, 177–194. [Google Scholar] [CrossRef]
  48. Juroszek, P.; Lumpkin, H.M.; Yang, R.Y.; Ledesma, D.R.; Ma, C.H. Fruit quality and bioactive compounds with antioxidant activity of tomatoes grown on-farm: Comparison of organic and conventional management systems. J. Agric. Food Chem. 2009, 57, 1188–1194. [Google Scholar] [CrossRef]
  49. Almeselmani, M.; Pant, R.C.; Singh, B. Potassium level and physiological response and fruit quality in hydroponically grown tomato. Int. J. Veg. Sci. 2009, 16, 85–99. [Google Scholar] [CrossRef]
  50. Smirnoff, N. Ascorbic acid: Metabolism and functions of a multi-facetted molecule. Curr. Opin. Plant Biol. 2000, 3, 229–235. [Google Scholar] [CrossRef]
  51. Dumas, Y.; Dadomo, M.; Di Lucca, G.; Grolier, P. Review: Effects of environmental factors and agricultural techniques on antioxidant content of tomatoes. J. Agric. Food Chem. 2003, 83, 369–382. [Google Scholar] [CrossRef]
  52. Worthington, V. Nutritional quality of organic versus conventional fruits, vegetables, and grains. J. Altern. Complement. Med. 2001, 7, 161–173. [Google Scholar] [CrossRef]
  53. Bourn, D.; Prescott, J. A comparison of the nutritional value, sensory qualities, and food safety of organically and conventionally produced foods. Crit. Rev. Food Sci. 2002, 42, 1–34. [Google Scholar] [CrossRef]
  54. Colpan, E.; Zengin, M.; Ozbahce, A. Effects of potassium on the yield and fruit quality components of stick tomato. Hort. Envi-ron. Biotechnol. 2013, 54, 20–28. [Google Scholar] [CrossRef]
  55. Liu, K.; Zhang, T.Q.; Tan, C.S.; Astatkie, T. Responses of fruit yield and quality of processing tomato to drip-irrigation and fertilizers phosphorus and potassium. Agron J. 2011, 103, 339–345. [Google Scholar] [CrossRef]
  56. Ali, S.; Javed, H.U.; Rehman, R.N.U.; Sabir, I.A.; Naeem, M.S.; Siddiqui, M.Z.; Saeed, D.A.; Nawaz, M.A. Foliar application of some macro and micro nutrients improves tomato growth, flowering and yield. Int. J. Biosci. 2013, 3, 280–287. [Google Scholar]
  57. Haleem, B.; Rab, A.; Hussain, S.A. Effect of calcium, boron and zinc foliar application on growth and fruit production of to-mato. Sarhad J. Agric. 2017, 34, 19–30. [Google Scholar]
  58. Li, Y.; He, N.; Hou, J.; Xu, L.; Liu, C.; Zhang, J.; Wang, Q.; Zhang, X.; Wu, X. Factors influencing leaf chlorophyll content in natural forests at the biome scale. Front. Ecol. Evol. 2018, 6, 64. [Google Scholar] [CrossRef]
  59. Yamane, Y.; Shikanai, T.; Kashino, Y.; Koike, H.; Satoh, K. Reduction of QA in the dark: Another cause of fluorescence FO increases by high temperature in higher plants. Photosynth. Res. 2000, 63, 23–34. [Google Scholar] [CrossRef] [PubMed]
  60. Yin, C.Y.; Berninger, F.; Li, C.Y. Photosynthetic responses of Populus przewalski subjected to drought stress. Photosynthetica 2006, 44, 62–68. [Google Scholar] [CrossRef]
  61. Wu, G. Amino acids: Metabolism, functions, and nutrition. Amino Acids. 2009, 37, 1–17. [Google Scholar] [CrossRef] [PubMed]
  62. Atanasova, E. Effect of nitrogen sources on the nitrogenous forms and accumulations of amino acid in head cabbage. Plant Soil. Environ. 2008, 54, 66–71. [Google Scholar] [CrossRef]
  63. Kopple, J.D. Phenylalanine and tyrosine metabolism in chronic kidney failure. J. Nutr. 2007, 137, 1586S–1590S. [Google Scholar] [CrossRef]
  64. Wang, X.; Zhang, H.; Quinn, P.J. Production of L- valine from metabolically engineered Corynebacterium glutamicum. Appl. Microbiol. Biotechnol. 2018, 102, 4319–4330. [Google Scholar] [CrossRef]
  65. Wang, W.; Wu, Z.; Dai, Z.; Yang, Y.; Wang, J.; Wu, G. Glycine metabolism in animals and humans: Implications for nutrition and health. Amino Acids 2013, 45, 463–477. [Google Scholar] [CrossRef]
  66. Agius, C.; Tucher, S.; Poppenberger, B.; Rozhon, W. Quantification of sugars and organic acids in tomato fruits. MethodsX 2018, 5, 537–550. [Google Scholar] [CrossRef]
  67. Sawant, O.; Mahale, S.; Ramachandran, V.; Nagaraj, G.; Bankar, A. Fungal citric acid production using waste materials: A mini-review. J. Microbiol. Biotechnol. Food Sci. 2018, 8, 821–828. [Google Scholar] [CrossRef]
Figure 1. Effect of the different fertilization rates on the visual plant growth and root length of Micro-Tom. (A) no fertilizer application control, (B) 0.026 g L−1, (C) 0.052 g L−1, (D) 0.13 g L−1, (E) 0.26 g L−1 standard, (F) 0.52 g L−1, (G) 1.3 g L−1.
Horticulturae 09 00367 g001
Figure 2. Effect of different cultivation systems on the growth of Micro-Tom under greenhouse conditions. Plants from left to right represent conventional, organic, and hydroponic systems.
Horticulturae 09 00367 g002
Figure 3. (A) Changes in plant height, (B) the total number of fruit set per cultivation system, (C) the SPAD value, and (D) the total number of leaves (per plant) in the Micro-Tom plants under the conventional system (chemical fertilization), organic system (organic fertilization), and hydroponic system (nutrient solution. Bars show the standard error.
Horticulturae 09 00367 g003
Figure 4. Principal component analysis for primary metabolites of tomato (Micro-Tom) under the different fertilization methods. Con. = Conventional system, Org. = Organic system, and Hyd. = Hydroponic system. Three colors in the right chart represent as follows: red—amino acids, green—sugars, blue—organic acids. 1, 2 and 3 represent replicates.
Horticulturae 09 00367 g004
Figure 5. Hierarchical cluster analysis (HCA) and heatmap visualization of metabolite profile of tomato (Micro-Tom) under the different fertilization methods. Con. = Conventional system, Org. = Organic system, and Hyd. = Hydroponic system.
Horticulturae 09 00367 g005
Table 1. Plant growth parameters affected by different fertilization rates.
TreatmentNumber of FlowersPlant Height (cm)Root Length (cm)Dry Root Weight (g)
A0 c1.7 c4.8 de0.02 c
B0 c3.1 bc9.2 cd0.06 c
C1.4 c5.2 b14.9 bc0.18 c
D11.2 bc9.4 a23.5 a0.28 bc
E18.8 b11.3 a20.7 ab0.52 b
F35.4 a11.7 a16.7 abc1.11 a
G1.3 c1.8 c2.5 de0.03 c
Means within a column with the same letter are not significantly different (Tukey test, p ≤ 0.05). A no fertilizer application control, B 0.026 g L−1, C 0.052 g L−1, D 0.13 g L−1, E 0.26 g L−1 standard, F 0.52 g L−1, and G 1.3 g L−1.
Table 2. Fruit quality parameters by different fertilization rates.
TreatmentYield (g plant−1)Weight Per Fruit (g)a* ValueAscorbic Acid (mg 100 g−1)Brix (%)
D377.8 b2.6 b41.2 a28.7 a5.3 b
E447 b3.7 a42.4 a25.9 a5.7 a
F2144.5 a3.3 ab43.0 a25.9 a5.9 a
Means in a column with the same letter are not significantly different (Tukey test, p ≤ 0.05). Fertilizer application rates: D 0.13 g L−1, E 0.26 g L−1 standard, F 0.52 g L−1.
Table 3. Leaf parameters affected by cultivation method.
Cultivation
System
Number of LeavesLeaf Area (cm2)Length of Fully Developed Leaf (cm)NO3-N (mg 100 g−1)
Conventional7.2 ab129.2 b6.1 b59.6 b
Organic6.8 b87.1 c5.9 b42.2 b
Hydroponic8.6 a175.5 a8.8 a98.4 a
Means in a column with the same letter is not significantly different (Tukey test, p ≤ 0.05).
Table 4. Number of flowers, yield and fruit quality parameters by the cultivation system.
Cultivation SystemNumber of Flowers (Per Plant)Yield
(g plant−1)
Weight Per Fruit
(g)
a* Value Ascorbic Acid
(mg 100 g−1)
Brix (%)Organic Acids (nmol g−1)Amino Acids (nmol g−1)Total Sugar (nmol g−1)
Conventional27.5 b194.0 b2.4 b39.4 a30 a5.5 a15 a90.5 b55.1 a
Organic22.0 c182.0 b2.9 b42.6 a30.6 a5.7 a14.2 a88.1 b56.2 a
Hydroponic36.4 a432.0 a3.6 a42.2 a23.7 b5.2 b12.1 b131.1 a49.4 b
Means in a column with the same letter is not significantly different (Tukey test, p ≤ 0.05).
Disclaimer/Publisher’s Note: The statements, opinions and data contained in all publications are solely those of the individual author(s) and contributor(s) and not of MDPI and/or the editor(s). MDPI and/or the editor(s) disclaim responsibility for any injury to people or property resulting from any ideas, methods, instructions or products referred to in the content.

