Article

Effects of Nutrition and Light Quality on the Growth of Southern Highbush Blueberry (Vaccinium corymbosum L.) in an Advanced Plant Factory with Artificial Lighting (PFAL)

1
Forest and Fruit Tree Research Institute, Shanghai Academy of Agricultural Sciences, Jinqi Road No. 1000, Fengxian District, Shanghai 201403, China
2
Shanghai Key Lab of Protected Horticultural Technology, Shanghai Academy of Agricultural Sciences, Jinqi Road No. 1000, Fengxian District, Shanghai 201403, China
*
Author to whom correspondence should be addressed.
Horticulturae 2023, 9(2), 287; https://doi.org/10.3390/horticulturae9020287
Submission received: 31 January 2023 / Revised: 15 February 2023 / Accepted: 16 February 2023 / Published: 20 February 2023

Abstract

:
A plant factory is a highly developed product system that can produce higher yields and better quality plants under controlled conditions. However, knowledge of blueberry cultivation in plant factories is limited. This study established an advanced plant factory with artificial lighting (PFAL) and investigated the effects of nutrition supply and light qualities on the growth performance of blueberries. Different nutrition treatments affected the vegetative growth of blueberries in PFAL, especially the new shoot length and number. Exogenous fertilization significantly promoted the uptake of N, P, and K elements, and a nutrition solution with N:P:K = 2:1:1 was suggested to be superior for blueberries in PFAL. Red light facilitated vegetative growth to some degree, and the blue light was conducive to increased chlorophyll and anthocyanin content. The Pn value was significantly enhanced under 60% red plus 40% blue light. Combining red and blue light is more beneficial to blueberry growth and might be a preferential strategy in PFAL. This study is the first to investigate the growth performance of blueberries cultivated in PFAL, which can provide an important theoretical database for blueberry cultivation in a plant factory with artificial lighting.

1. Introduction

A plant factory with artificial lighting (PFAL) is a modern, highly developed planting system that could produce higher yields and better quality plants in a controlled environment [1,2]. Unlike traditional open field farms or greenhouses, the environmental parameters in PFALs are always independent of ambient or seasonal changes. Furthermore, the internal PFALs environmental factors can be artificially controlled based on the growth dynamics of plants to obtain high productivity. Thus, in recent decades, PFALs have been rapidly developed owing to these unique advantages over traditional agriculture [3,4]. As a result, PFALs have successfully been used for commercial production in many Asiatic countries, such as China, Japan, Korea, and others. However, this commercial application is mainly confined to leafy vegetables or some herbs (lettuce and shade-type plant species) because these plant species have short growth cycles and require relatively lower light intensities to meet plant developmental requirements [5,6,7]. Currently, studies are limited regarding the application of PFALs in perennial woody plants, especially fruit-bearing species. This might be attributed to their complex genetic backgrounds, difficult cultivation technology, longer growth cycle, special light conditions of fruit-bearing trees, and the high construction cost of PFALs.
Plant factories are normally divided into two types based on the lighting source with sunlight (PFSLs) and with artificial lighting (PFALs) [7,8]. As described in Kozai (2019), PFALs are a closed planting system comprising one or more nearly airtight cultivation or operating rooms with walls, roofs, and floors optically opaque and thermally insulated and electric lamps only providing light [3]. Light-emitting diodes (LEDs) have been introduced to PFALs since the 2000s because they have a higher efficiency of converting electric power to light power and exert lower cooling loads as well as manipulate the spectral distribution to satisfy the demand for light sources along with different developmental stages of plants [4,9]. LEDs have a narrow bandwidth and low cost and have recently been used as the main lighting source in PFALs. Based on these, light environment optimization in PFALs, such as photoperiod, light quality, and quantity, is necessary [10,11]. Many studies in recent years have investigated the relationship between LEDs and plant growth. Recently, Wang et al. (2021a) analyzed the impact of daily light integrals (DLIs) of white LEDs on root morphology, growth performance, and photon yield of cucumber seedlings cultivated in a closed transplant production system [12]. Although a compact and vigorous morphology was obtained with increased DLIs, different DLI strategies should be applied based on the stage of plant growth [12]. The growth and qualities of blueberry can be significantly affected by high light irradiation under red and blue LEDs in a plant factory. Notably, the germination rate of blueberry cv. ‘Misty’ seedlings was significantly promoted after red LEDs irradiation, and the juvenile phase was successfully shortened in a controlled room with artificial lighting [13]. Moreover, the flowering characteristics, plant morphology, and year-round fruit quality of blueberry can be strongly influenced by light quality in a plant factory [4,14].
Blueberry (Vaccinium corymbosum L.), which belongs to Ericaceae family genus Vaccinium, is one of the most economically important small fruit crops worldwide and is popular among consumers for its unique taste and high antioxidant substances [15,16,17]. The blueberry is native to North America and was first introduced to China in 1983. China’s commercial cultivation of blueberries began in 2000 and entered a rapid development stage after 2006 [18]. Within the past two decades, the blueberry cultivation area in China has rapidly spread and statistically achieved 66,400 ha in total with an annual yield of 0.35 million tons to date, showing an excellent development prospect [18]. However, blueberry is a typical shallow-rooted plant with a fibrous root system with sparse root hairs, making it inefficient in water and nutrient absorption [19,20]. Blueberry cultivation usually requires a very high soil environment, i.e., moist but well-drained soil, high organic matter content, and particularly acid soils with a pH value of 4.5–5.5 [21], consequently limiting the development of the blueberry industry to some extent, especially in Shanghai, China. Shanghai soil is always alkaline (pH is approximately 7.5), leading to difficulty cultivating blueberries in ‘natural soils’. Though amendments are often exogenously added to the native soil to reduce the pH, or blueberry seedlings are usually potted in acid substrates with an automatic irrigation system to maintain low pH and ensure good vegetative growth, blueberry fruit quality is still poor and also sour. The development of PFALs provides a good opportunity for blueberry cultivation in Shanghai. A semi-closed plant factory has been introduced to blueberry cultivation in Japan. For example, Aung et al. (2014) assessed blueberry plant growth and fruit quality in a controlled room under artificial light, indicating the possibility of blueberry production in a controlled environment in PFALs [22]. However, the cultivation technology of blueberries in PFALs is still imperfect. Therefore exploring blueberry planting parameters in PFALs, such as lighting and nutrition supply, is urgently required.
In this study, to optimize the cultivation technology of blueberries in a closed plant factory system and thus produce better quality blueberry fruits, the effects of nutrition conditions and light quality were analyzed in a new advanced plant factory with artificial lighting using a southern highbush blueberry cultivar ‘Misty’. This is the first study to explore the plant growth performance of blueberries in an advanced PFAL, and the results will provide an important theoretical database for blueberry cultivation in a plant factory with artificial lighting.

2. Materials and Methods

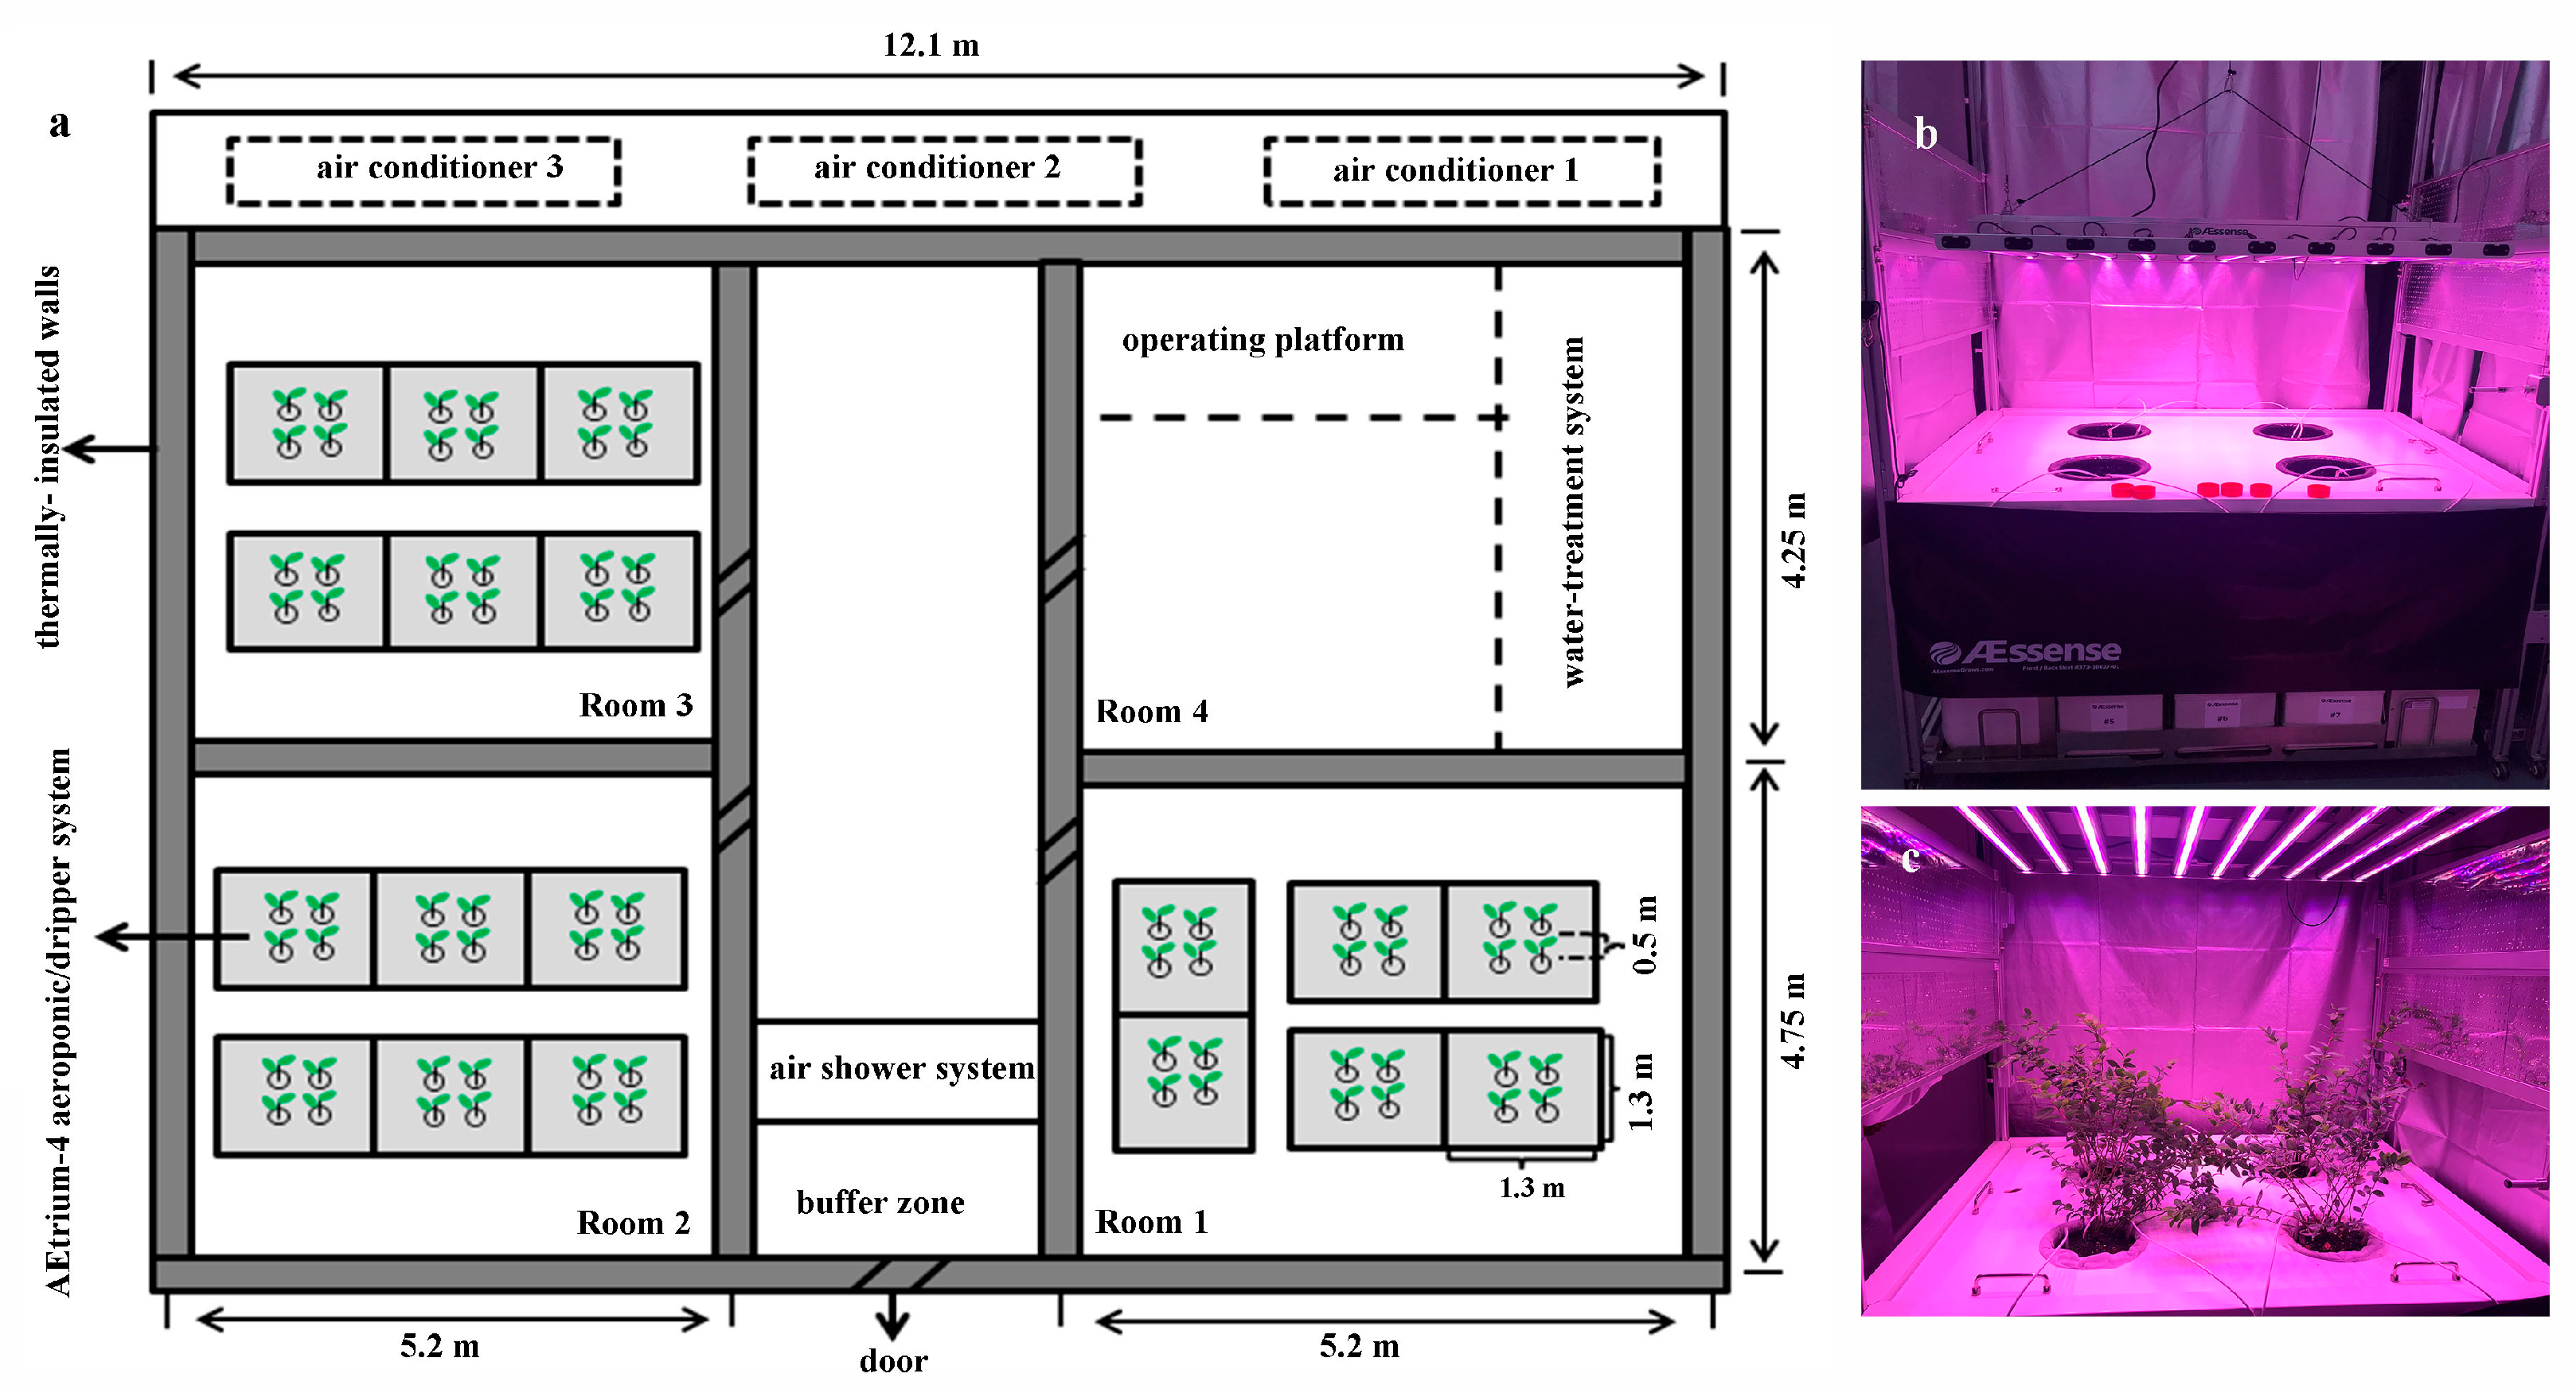
2.1. Plant Materials and Growth Conditions

Three-year-old southern highbush blueberry cultivar ‘Misty’ plants were used in this study. All the plants were potted in the medium that was consisted of peatmoss: perlite:vermiculite (1:1:1, v/v) and transplanted into an advanced plant factory established in 2017, comprising four rooms. Rooms 1 and 2 were used for plant cultivation, with artificially controlled room temperatures between 12 °C and 35 °C. Room 3 was a chilling cold room with adjustable temperatures ranging from 2 °C to 7.2 °C, and room 4 was the operating room (Figure 1a). Growers were only allowed to enter the plant factory through the air shower system. A customized smart AEtrium-4 aeroponic/dripper system (AEssenseGrows Co. Ltd., Shanghai, China) was used for blueberry cultivation, and LEDs were used as the lighting source (Figure 1b,c). The environmental parameters, including air temperature, moisture humidity, and CO2 concentration, were monitored and fed back in real time by an Internet of Things (IoT) system. The plant growth plan was automatically designed in GuardianTM Grow Manager Software (AEssenseGrows Co. Ltd., Shanghai, China).

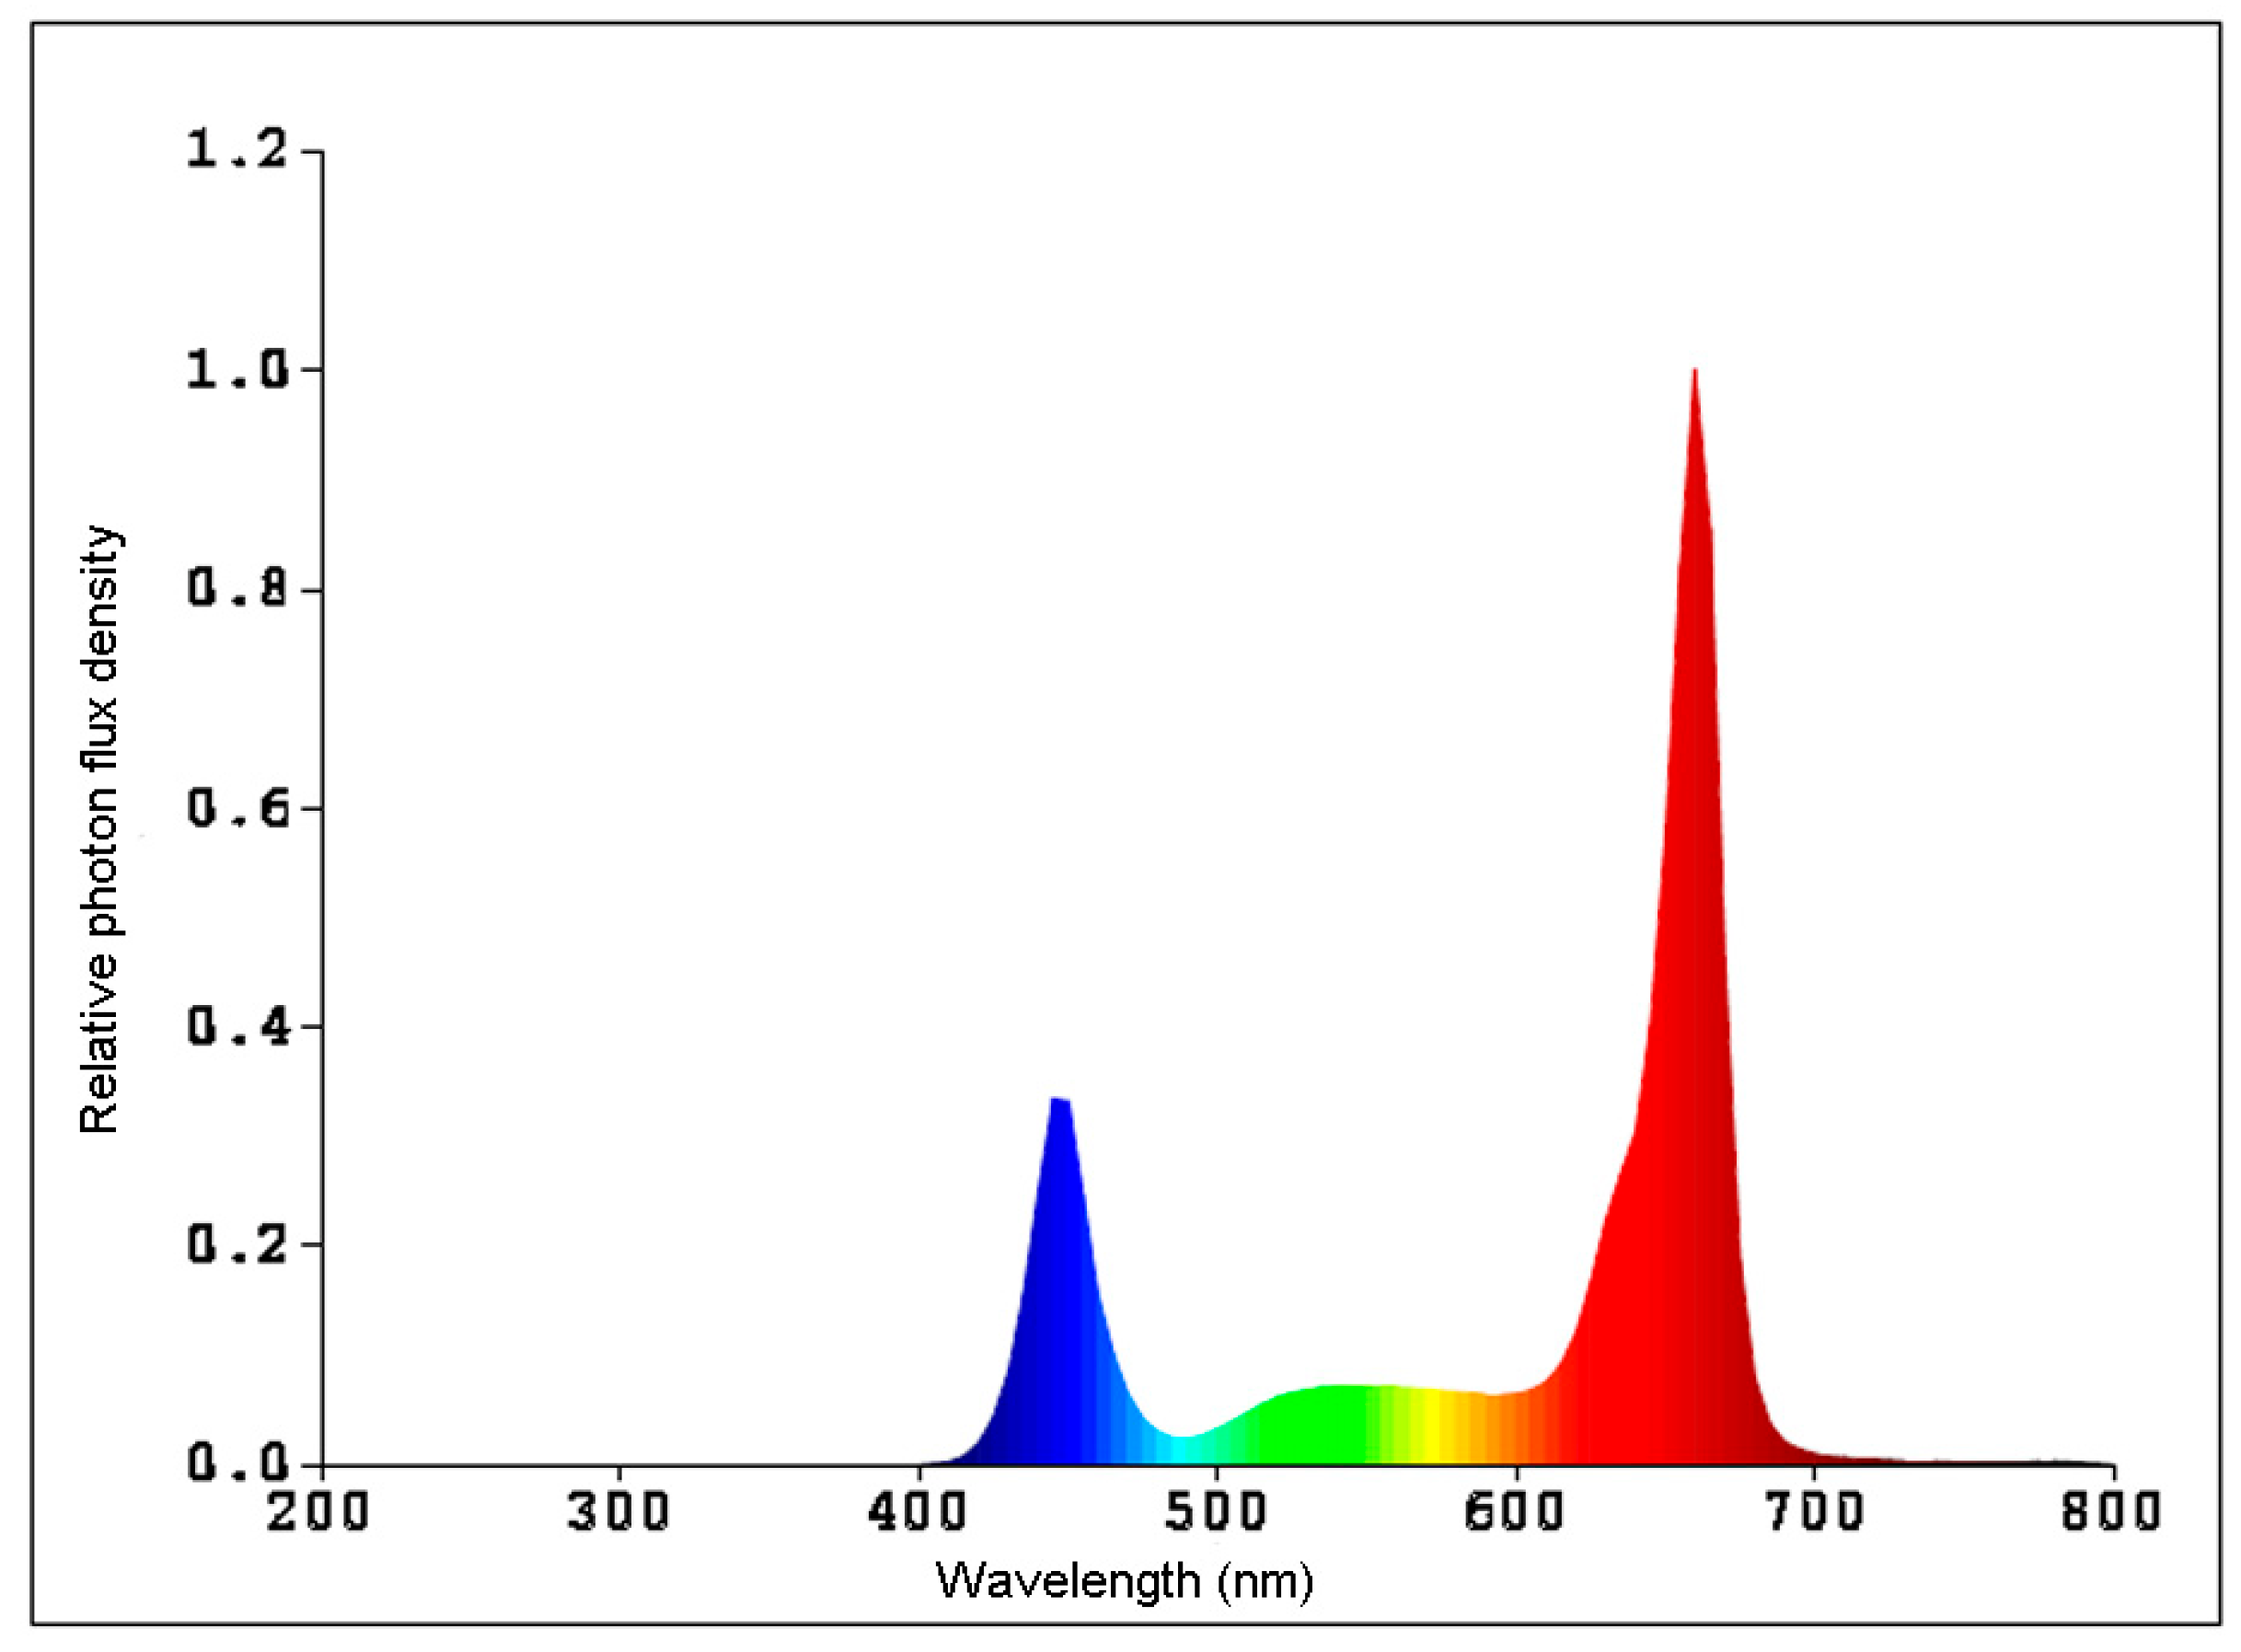
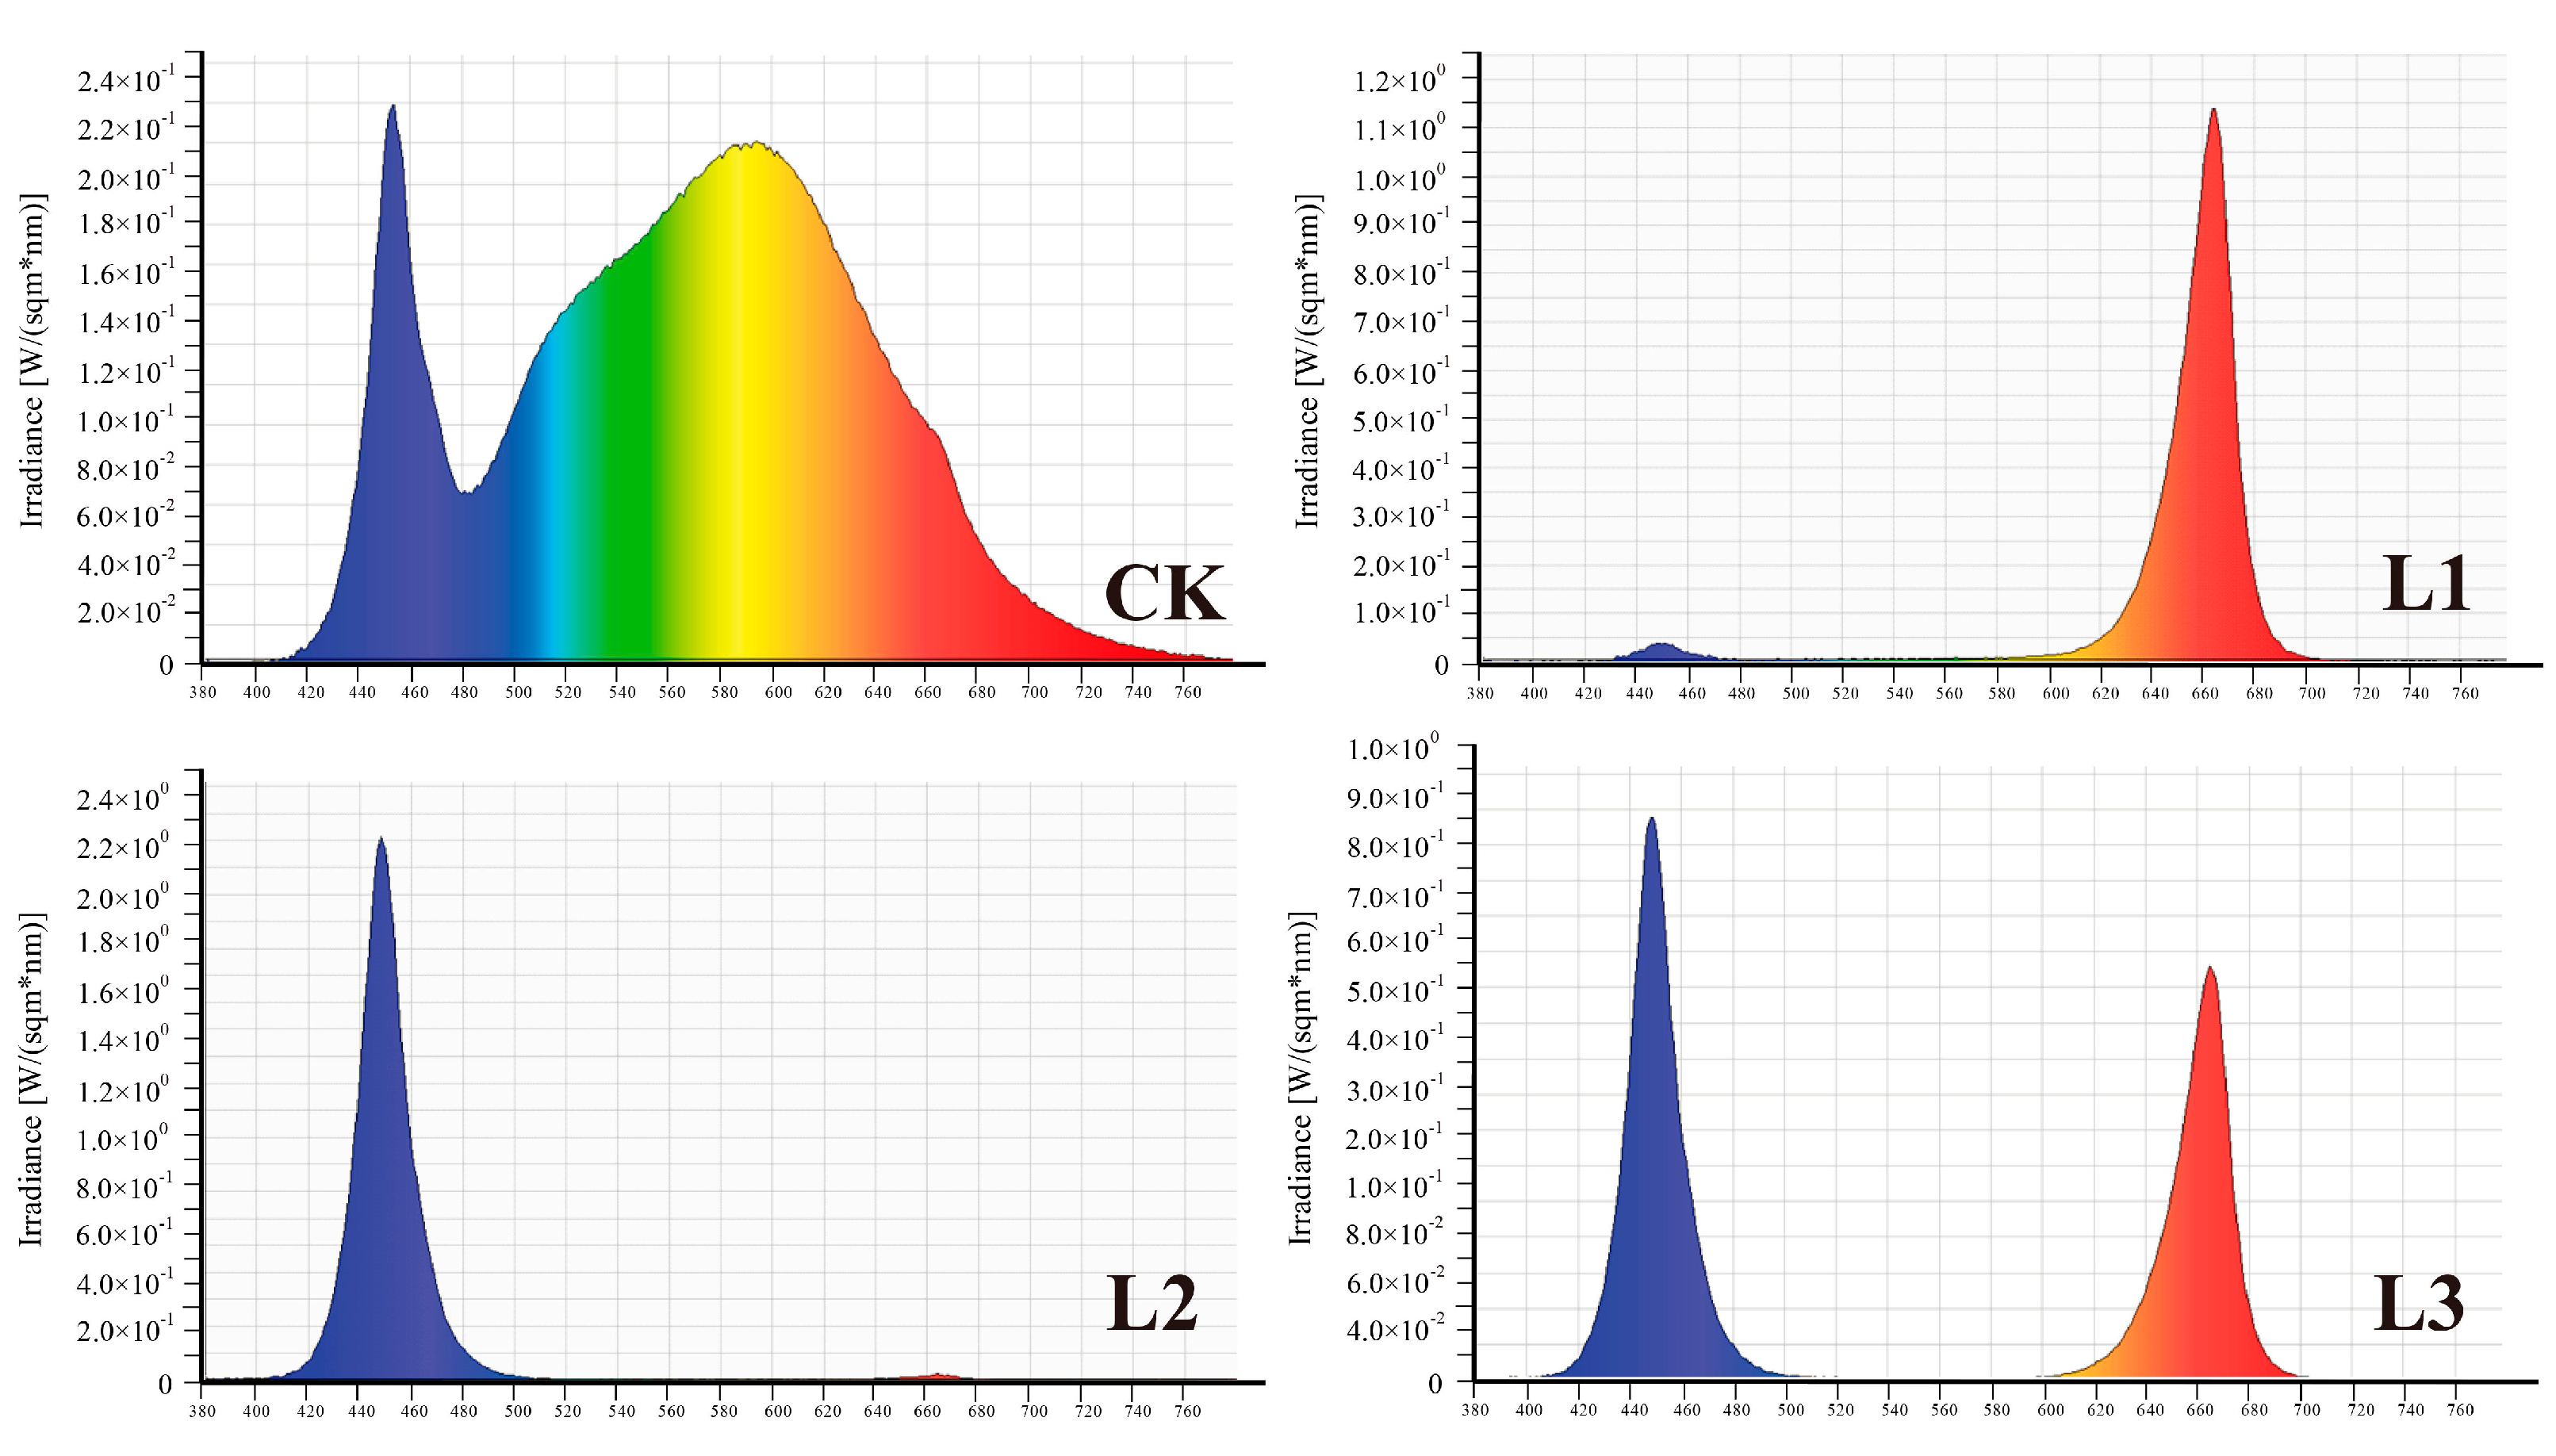
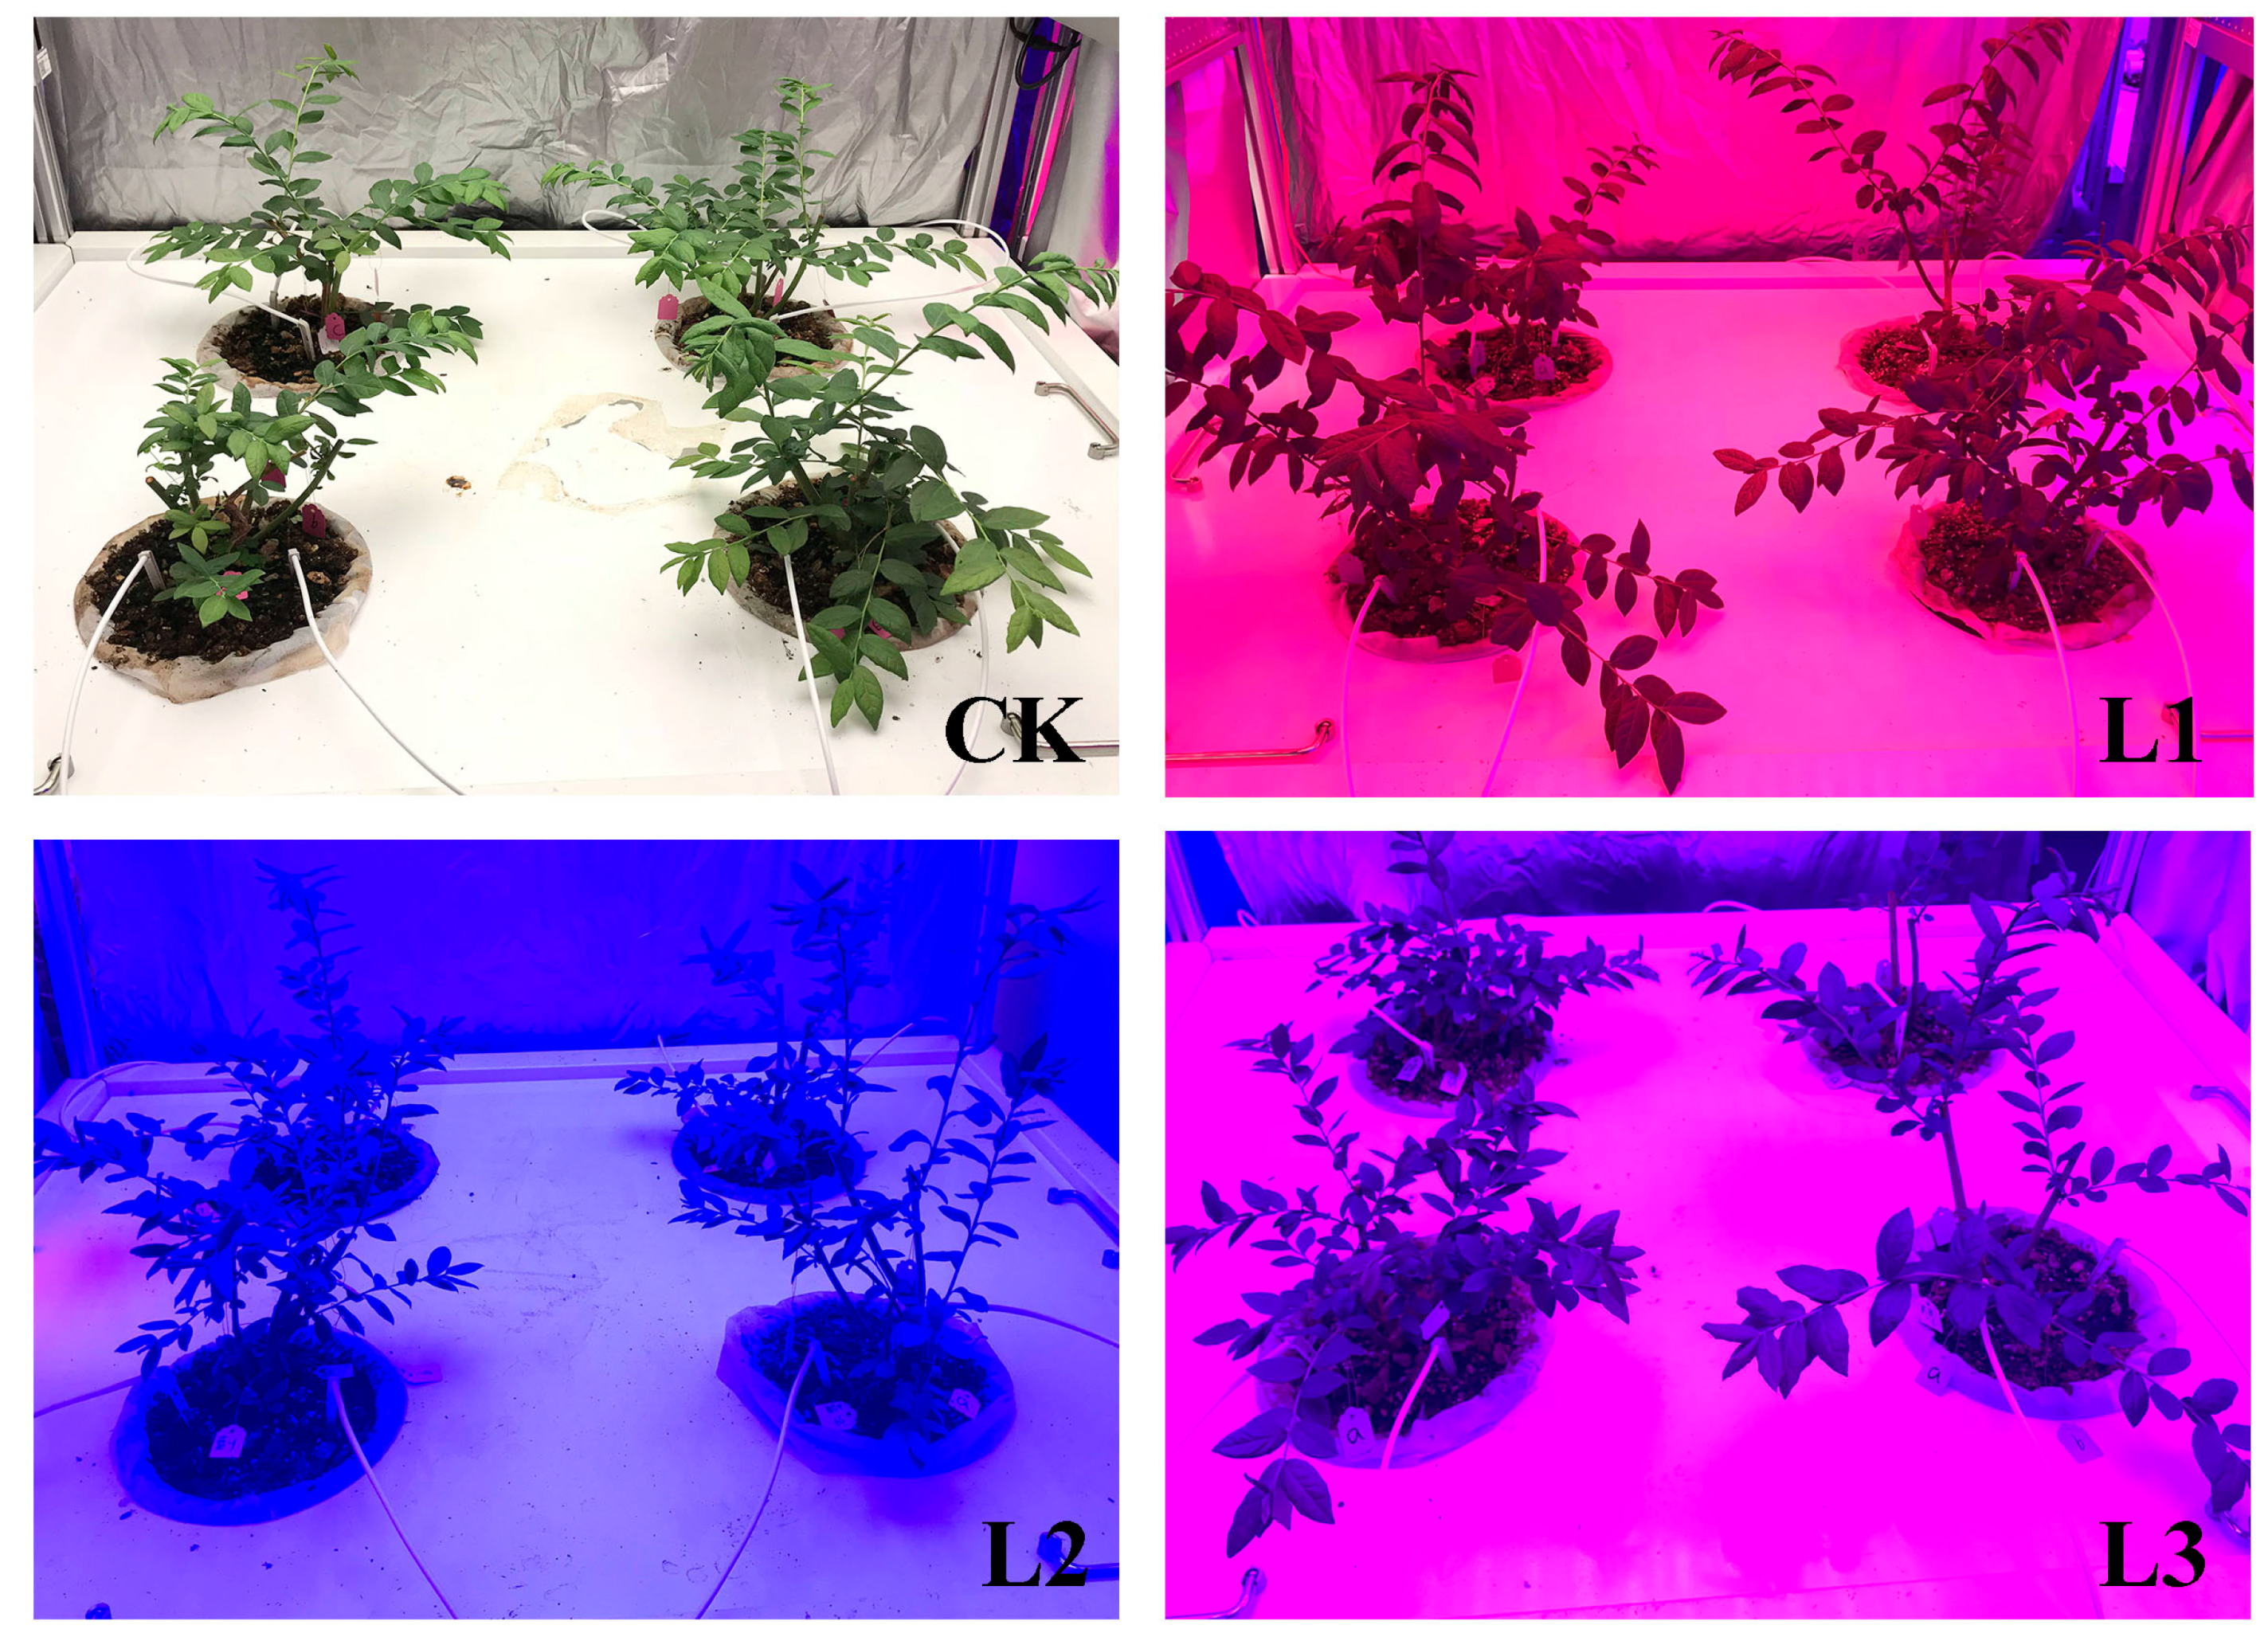
2.2. Experimental Designs

In this study, two experiments, as two separate cases, were carried out in the controlled room of the blueberry plant factory from 2019 to 2021. Experiment 1 was performed in Room 1 at six AEtrium-4 systems with three different modified Hoagland nutrient solution treatments, N:P:K = 1:1:1 (CK, the final N, P and K concentration was 0.8, 0.8 and 0.8 mol/L, respectively), N:P:K = 1:1:2 (T1, the final N, P and K concentration was 0.8, 0.8 and 1.6 mol/L, respectively), and N:P:K = 2:1:1 (T2, the final N, P and K concentration was 1.6, 0.8 and 0.8 mol/L, respectively), the nitrogen form used in this study was nitrate nitrogen. The growth conditions in Room 1 were as follows: the room temperature was set at 25 ± 2 °C during the daytime/22 ± 2 °C at night, the light/dark period was 16/8 h, CO2 concentration and relative humidity were set at approximately 400 μmol mol−1 and 60–70%, respectively [23]. The EC value of the nutrient solution was set at a level of 1500 ± 200 μs/cm, and the pH value was adjusted to 5.0 with a dilute sulfuric acid solution (SO42−). The irrigation was provided automatically with an interval of 300 s every 43,200 s during the daytime (about 100 mL/plant daily). The light was provided using AEpic LED-growth lamps (LBR001, AEssenseGrows Co. Ltd., Shanghai, China), the light intensity at the canopy of blueberry plants was 200 μmol m−2 s−1. The relative spectral photon flux was shown in Figure 2. Experiment 2 was performed in Room 2 at four AEtrium-4 systems equipped with different light qualities, white LED light (ck), 100% red spectrum (660–665 nm, L1), 100% blue spectrum (450–455 nm, L2), and 60% red + 40% blue spectrum (L3) with 200 μmol m−2 s−1 light intensity at the top canopy of blueberry plants, the relative spectral photon flux of each light quality was shown in Figure 3. The same Hoagland nutrient solution with N:P:K = 1:1:1 (the final N, P and K concentration was 0.8, 0.8 and 0.8 mol/L, respectively) was used in Experiment 2. The EC value, pH value, irrigation project, and other environmental conditions were the same as those described in Experiment 1.

2.3. Observation of Phenotypic Traits

Total 40 ‘Misty’ plants were potted with 5L-planting baskets, the growth medium was consisted of peatmoss: perlite:vermiculite (1:1:1, v/v), and transplanted into Room 1 (total 24 blueberry plants on six AEtrium-4 systems) and Room 2 (16 blueberry plants on four AEtrium-4 systems) of the plant factory, respectively. The blueberry plants were propagated by cuttings from ‘Misty’ and then grew for 3 years in a greenhouse and the plant height was about 1.0 m before being transferred to plant factory. All branches of plants were removed from a 10 cm distance above the growth media and recovered for about one month until new shoots were re-grown to approximately 10 cm. The new shoot number of each plant was recorded, the new shoot length was recorded every 7 days using a measuring tape, and chlorophyll content (SPAD value) was measured with a portable SPAD measuring instrument (SPAD-502 plus, Konica Co. Ltd., Tokyo, Japan). The plant height was record by a portable tapeline, and the stem diameter at 5 cm above the growth medium was measured with a digital vernier caliper.

2.4. Analysis of Photosynthetic Characteristics

Three full expanded leaves (the 5th–6th functional leaf from growth point) from new shoots of each blueberry tree were selected randomly for photosynthetic characteristics measurement, including net photosynthetic rate (Pn), stomatal conductance (gs), internal CO2 (Ci), transpiration rate (E), and water use efficiency (WUE) with a portable photosynthesis system (CIRAS-3, PP system, Massachusetts, USA) according to the operating instructions. The parameters were set as follows: the leaf temperature, relative humidity, CO2 reference, and photosynthetic photon flux density (PPFD) value were set at 25.1 °C, 60%, 390 ppm, and 1500 µmol·m−2·s−1, respectively. To obtain the photosynthetic light response curves, the net photosynthetic rate (Pn) was measured at nine levels of PPFD (2400, 2100, 1800, 1500, 1200, 900, 600, 300, and 0 µmol·m−2·s−1).

2.5. Determination of Nutrition Elements Uptake

To analyze the effects of different nutrient treatments on elements uptake in Experiment 1, approximately ten leaves per plant were randomly collected pre- and after treatment, respectively, and the content of total nitrogen (N), total phosphorus (P), and total potassium (K) were determined based on the method described by Wang et al. (2017) [24]. The increment of N, P, K elements in leaves, ΔN, ΔP, and ΔK, were calculated according to the formula: ΔN, P, K = Cafter − Cbefore, where Cbefore and Cafter indicate the content of N, P, and K elements before and after treatments, respectively. Then, a correlation analysis among growth traits, photosynthetic characteristics, and nutrition elements was conducted using SPSS 18.0 software (SPSS Inc., Chicago, IL, USA).

2.6. Determination of Anthocyanin Content

Anthocyanin content in fresh leaves was determined following the method by Li et al. (2016) [25]. Leaf samples (4 g) were ground with a mortar and pestle, and then the homogenate was soaked in 10 mL 0.1 mol·L−1 acidized ethanol for 30 min at 60 °C. The extraction procedure was repeated twice. The extracts were centrifuged at 1500× g for 5 min at 4 °C, and the supernatants were collected. The absorbance at 530, 620, and 650 nm was measured using an ultraviolet–visible spectrophotometer (UV-2000) (Spark, TECAN Grop Ltd., Männedorf, Switzerland) with a cell filled with 0.1 mol·L−1 acidized ethanol as the blank. The anthocyanin content was evaluated based on the following equation: anthocyanin content = (ΔOD × V × 1,000,000)/(ξ × m), where ΔOD = (OD530 − OD620) − 0.1 (OD650 − OD620), ξ is the molar absorption coefficient of anthocyanin, V is the dilution volume, and m is the fresh weight of the sample. All measurements were performed in triplicate.

2.7. Determination of Antioxidant Enzymes (CAT, POD, SOD), H2O2 Level, MDA, and Protein Content

The activities of antioxidant enzymes (CAT, POD, and SOD), H2O2 level, and protein content in ‘Misty’ leaves under different light intensities were determined using the relevant detection kits (Nanjing Jiancheng Bioengineering Institute, Nanjing, China) according to the manufacturer’s instructions. In addition, the MDA content was analyzed based on the method described in our previous work [26]. All measurements were performed in triplicate.

2.8. Data Statistical Analysis

The data were statistically analyzed by one-way ANOVA using SPSS 18.0 (SPSS Inc., Chicago, IL, USA) based on the method of Duncan’s multiple range tests (alpha = 0.05), differences with p value ≤ 0.05 were considered significant. All graphics were created using GraphPad Prism 6.0 (GraphPad Software, Inc., La Jolla, CA, USA).

3. Results

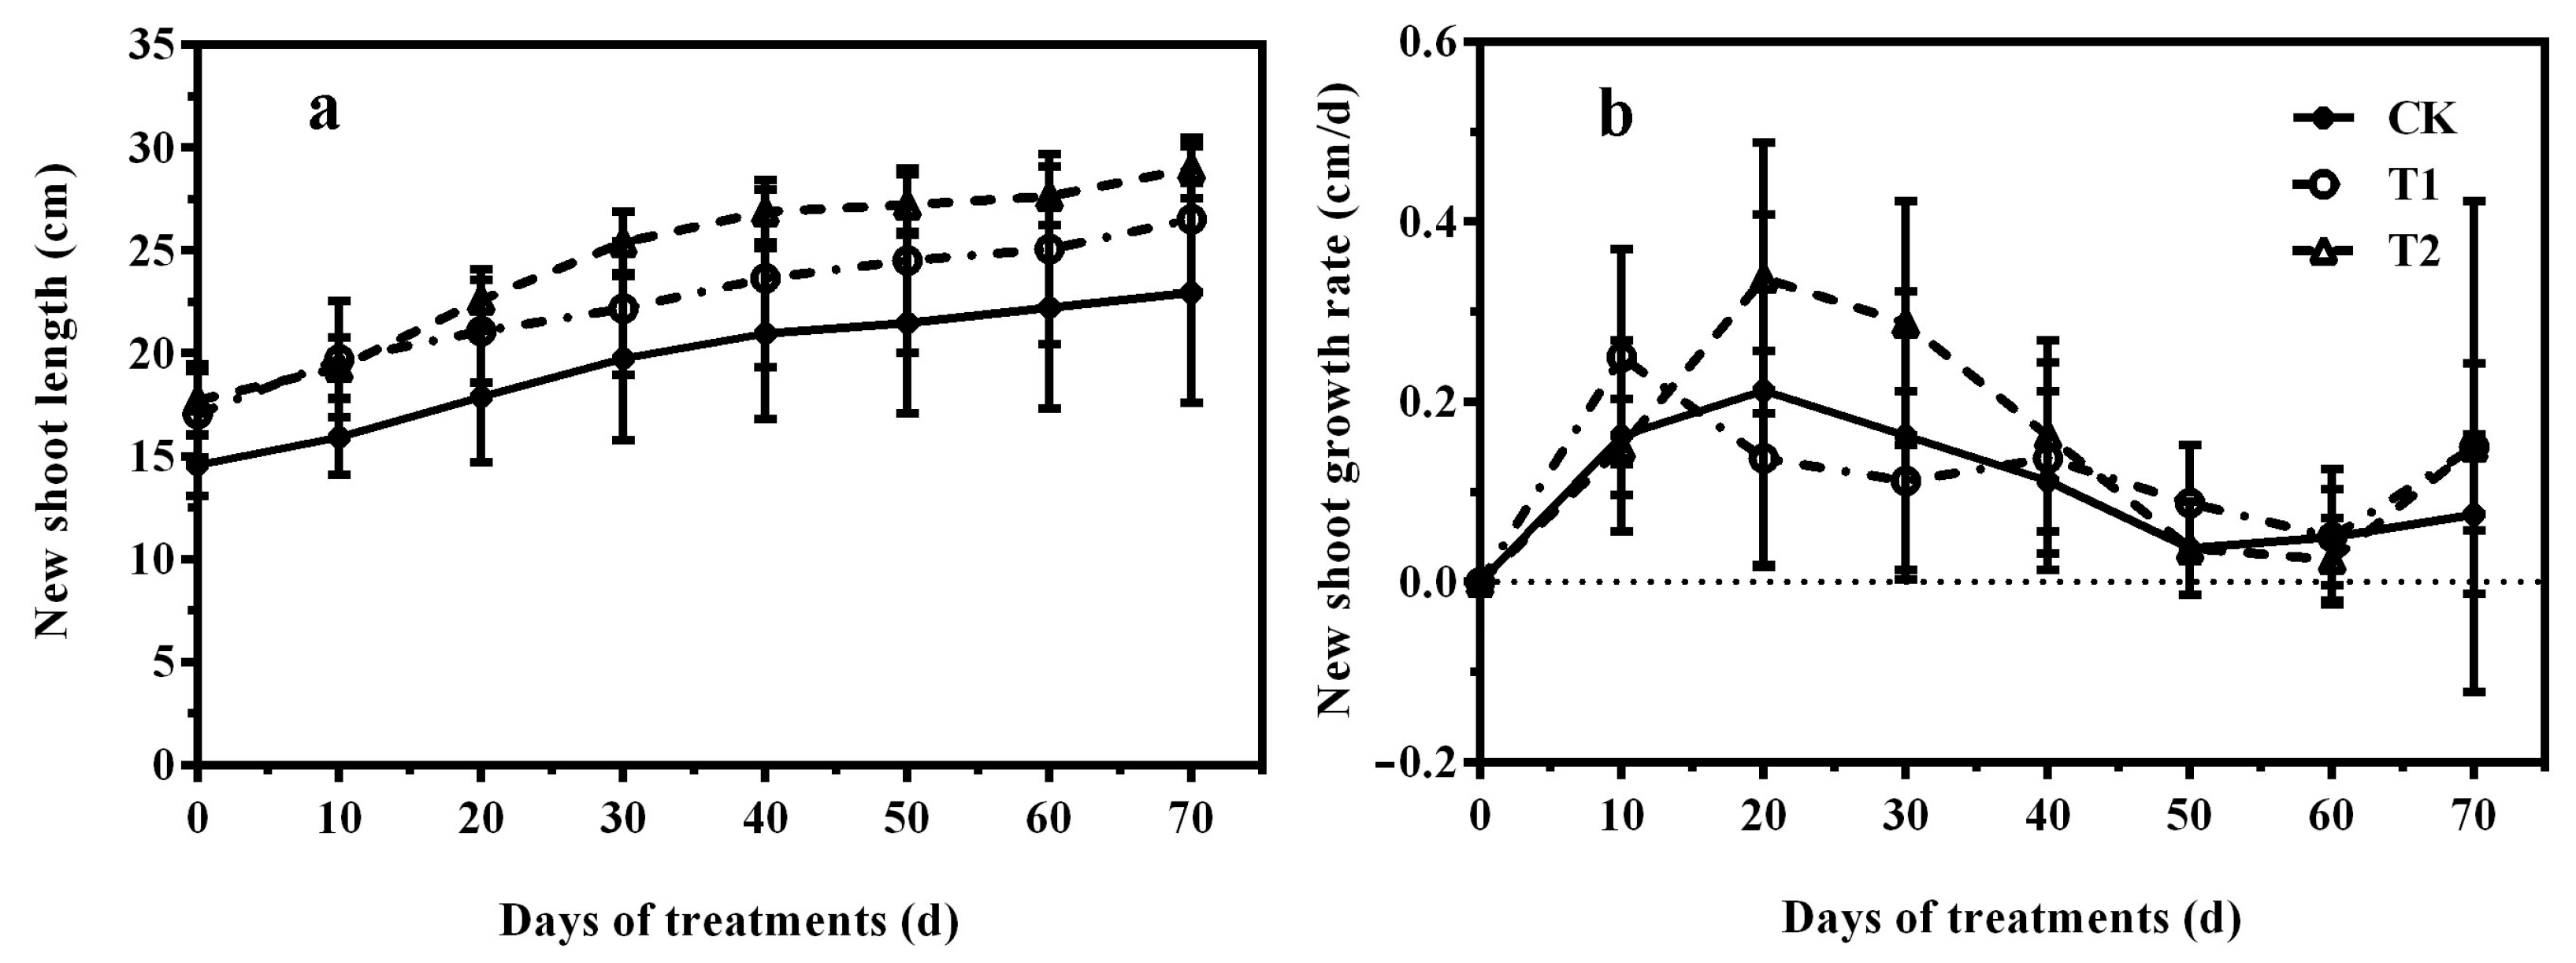
3.1. Effects of Nutrition on Plant Growth of ‘Misty’ in PFAL

There were no significant differences in plant height or chlorophyll content among the three nutrition treatments, however the stem diameter of ‘Misty’ in N:P:K = 1:1:2 (T1) and N:P:K = 2:1:1 (T2) treatments was significantly higher than that of N:P:K = 1:1:1 (CK) treatment (Table 1). Compared with the control treatment, the new shoot number and length in the T2 treatment were significantly increased (Table 1), indicating that the vegetative growth of ‘Misty’ plants in PFAL was significantly enhanced under higher nitrogen nutrition. The new shoot growth under all three treatments expanded gradually with increased time (Figure 4a), and the new shoot growth rate of the T2 treatment was prominently higher than other treatments, especially during the 20 to 40 days after treatments (Figure 4b).

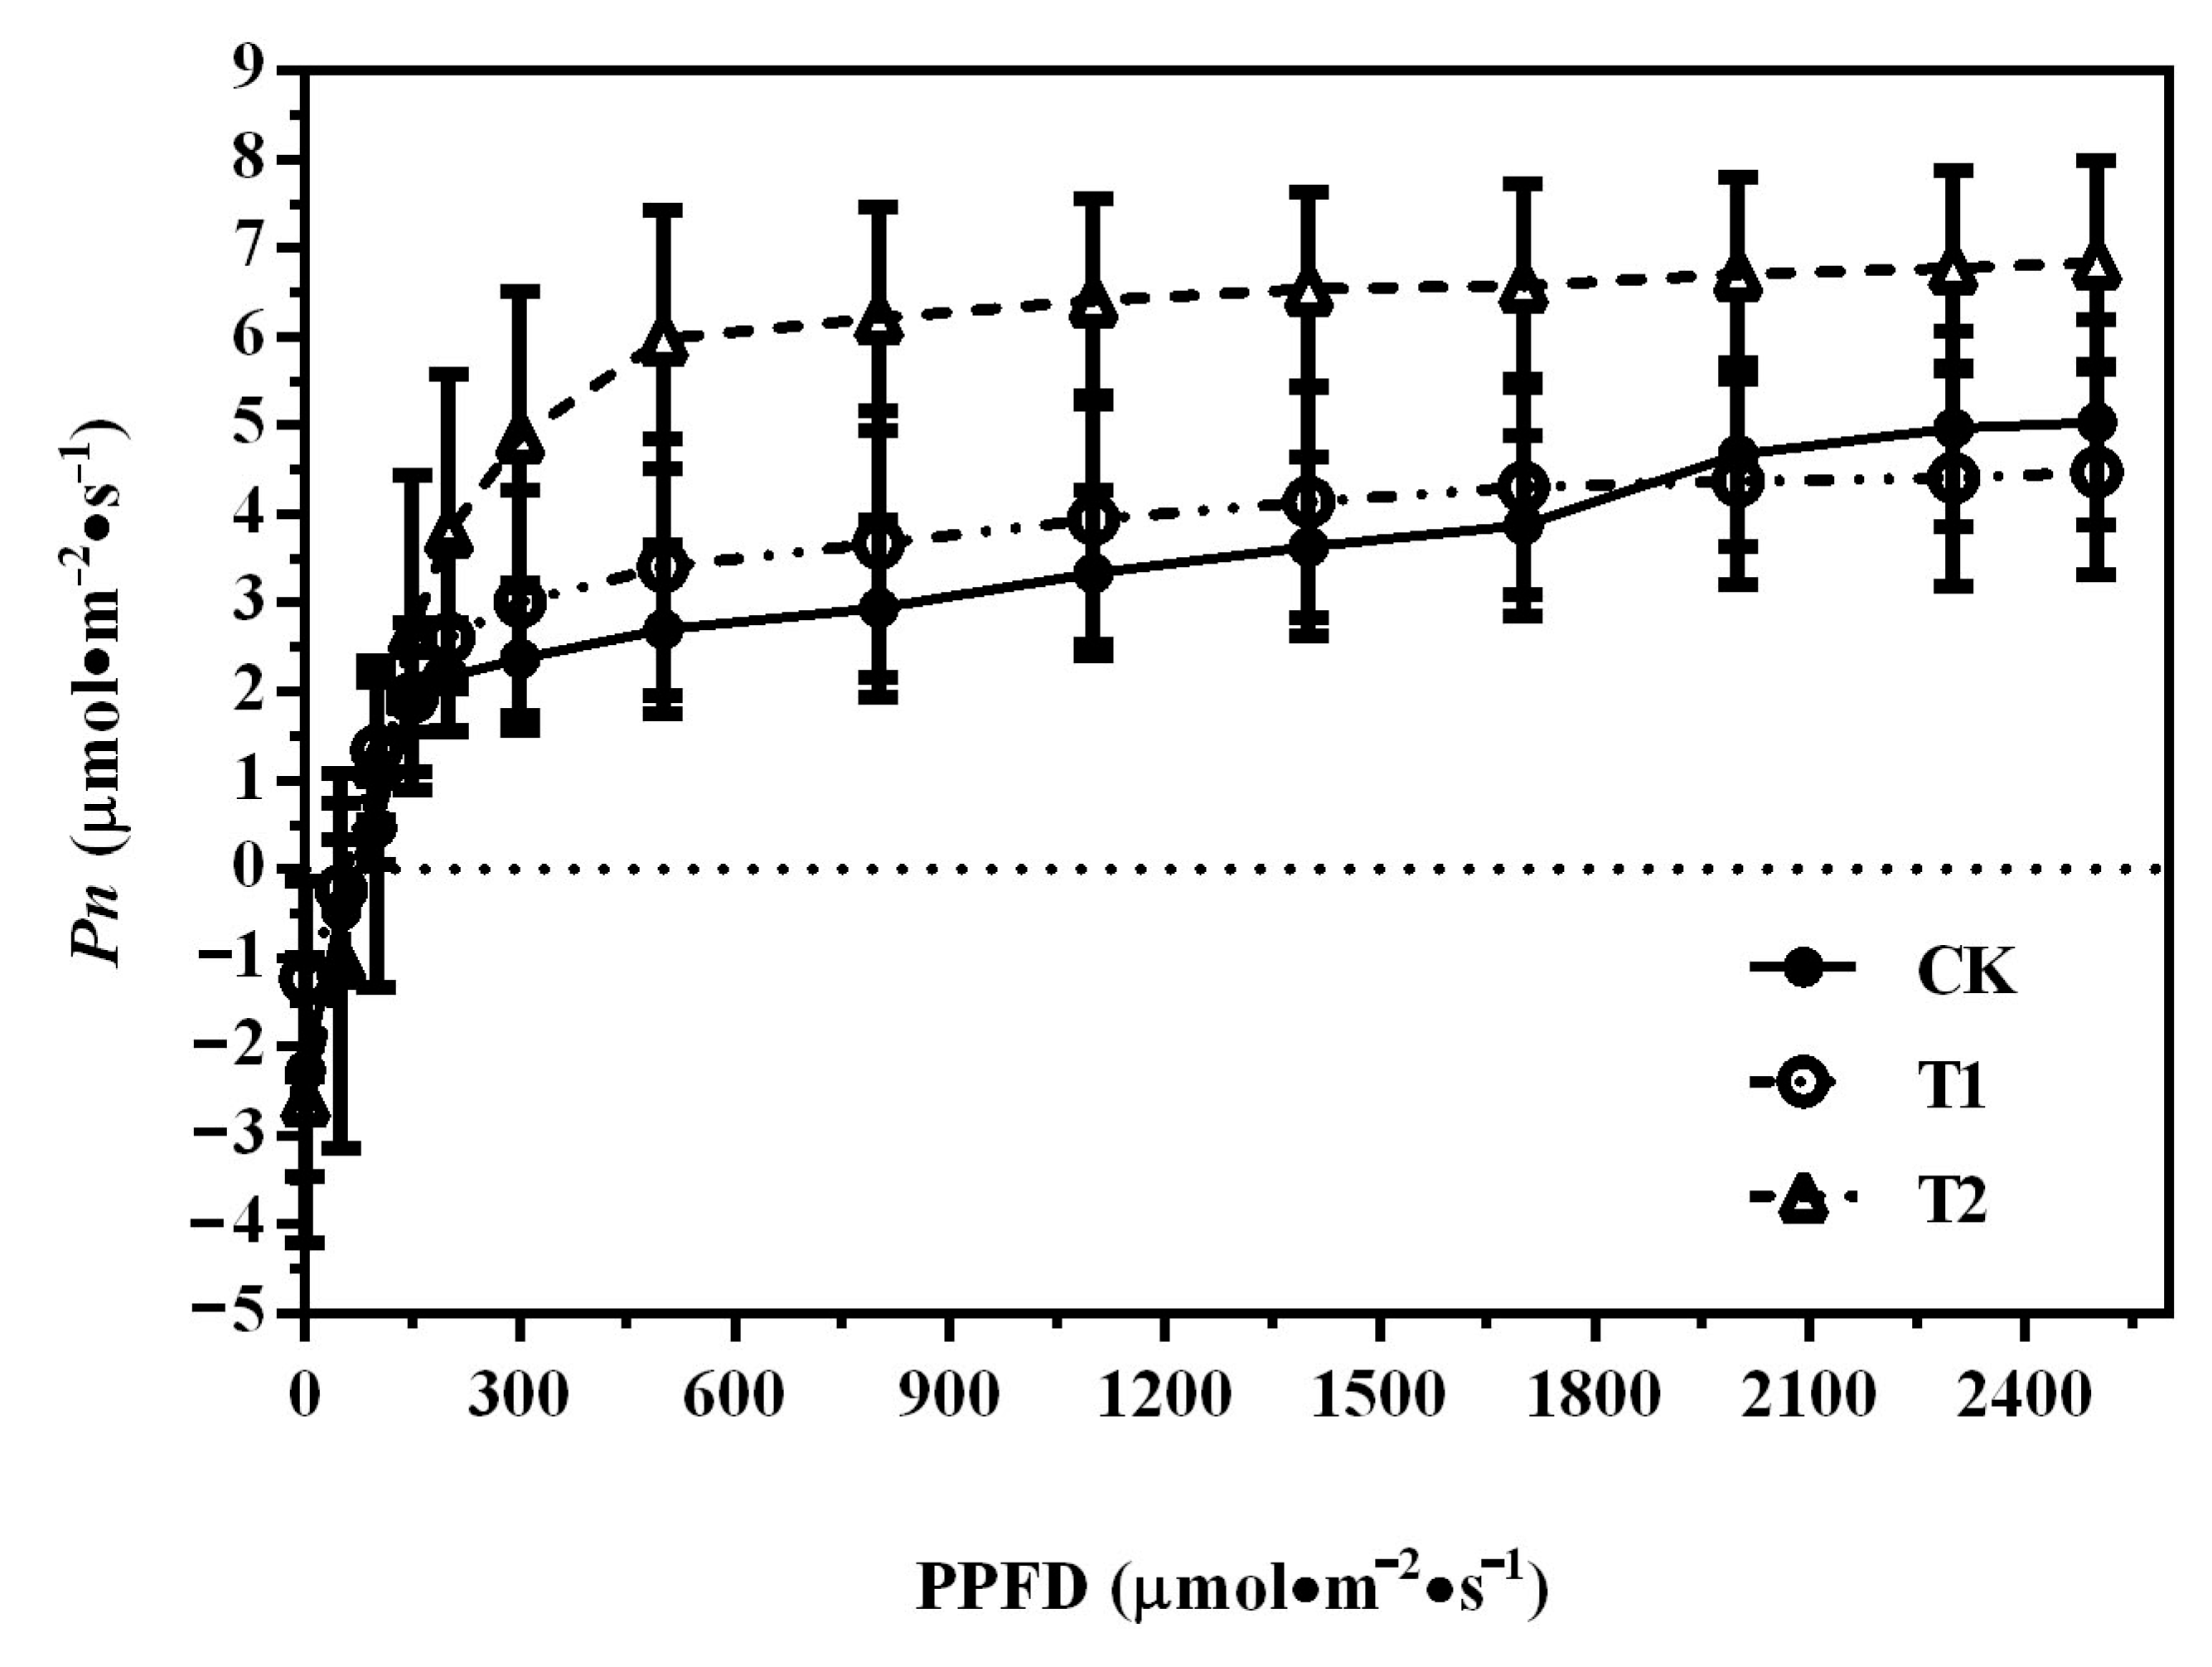
3.2. Photosynthetic Light-Response Curves of ‘Misty’ under Different Nutrition Treatments in PFAL

The photosynthetic light-response curves of ‘Misty’ plants were determined to assess the leaf photosynthetic capacity under different nutrition treatments in PFAL (Figure 5). The Pn value under three treatments increased gradually with the increased light intensity, showing a similar dynamic trend. However, the maximum photosynthetic rate at light saturation in the T2 treatment was the greatest, followed by that of the T1 treatment. In contrast, the maximum photosynthetic rate at light saturation in the control treatment was the smallest (Figure 5). Similarly, the net photosynthetic rate (Pn) in the T2 treatment was the largest (6.38 µmol·m−2·s−1), followed by that of the T1 treatment (5.95 µmol·m−2·s−1) and then that of the control treatment (5.54 µmol·m−2·s−1). The differences in net Pn among the three nutrition treatments were significant (Table 2), suggesting the photosynthetic characteristics can be significantly influenced by higher nitrogen supply under controlled conditions in PFAL.

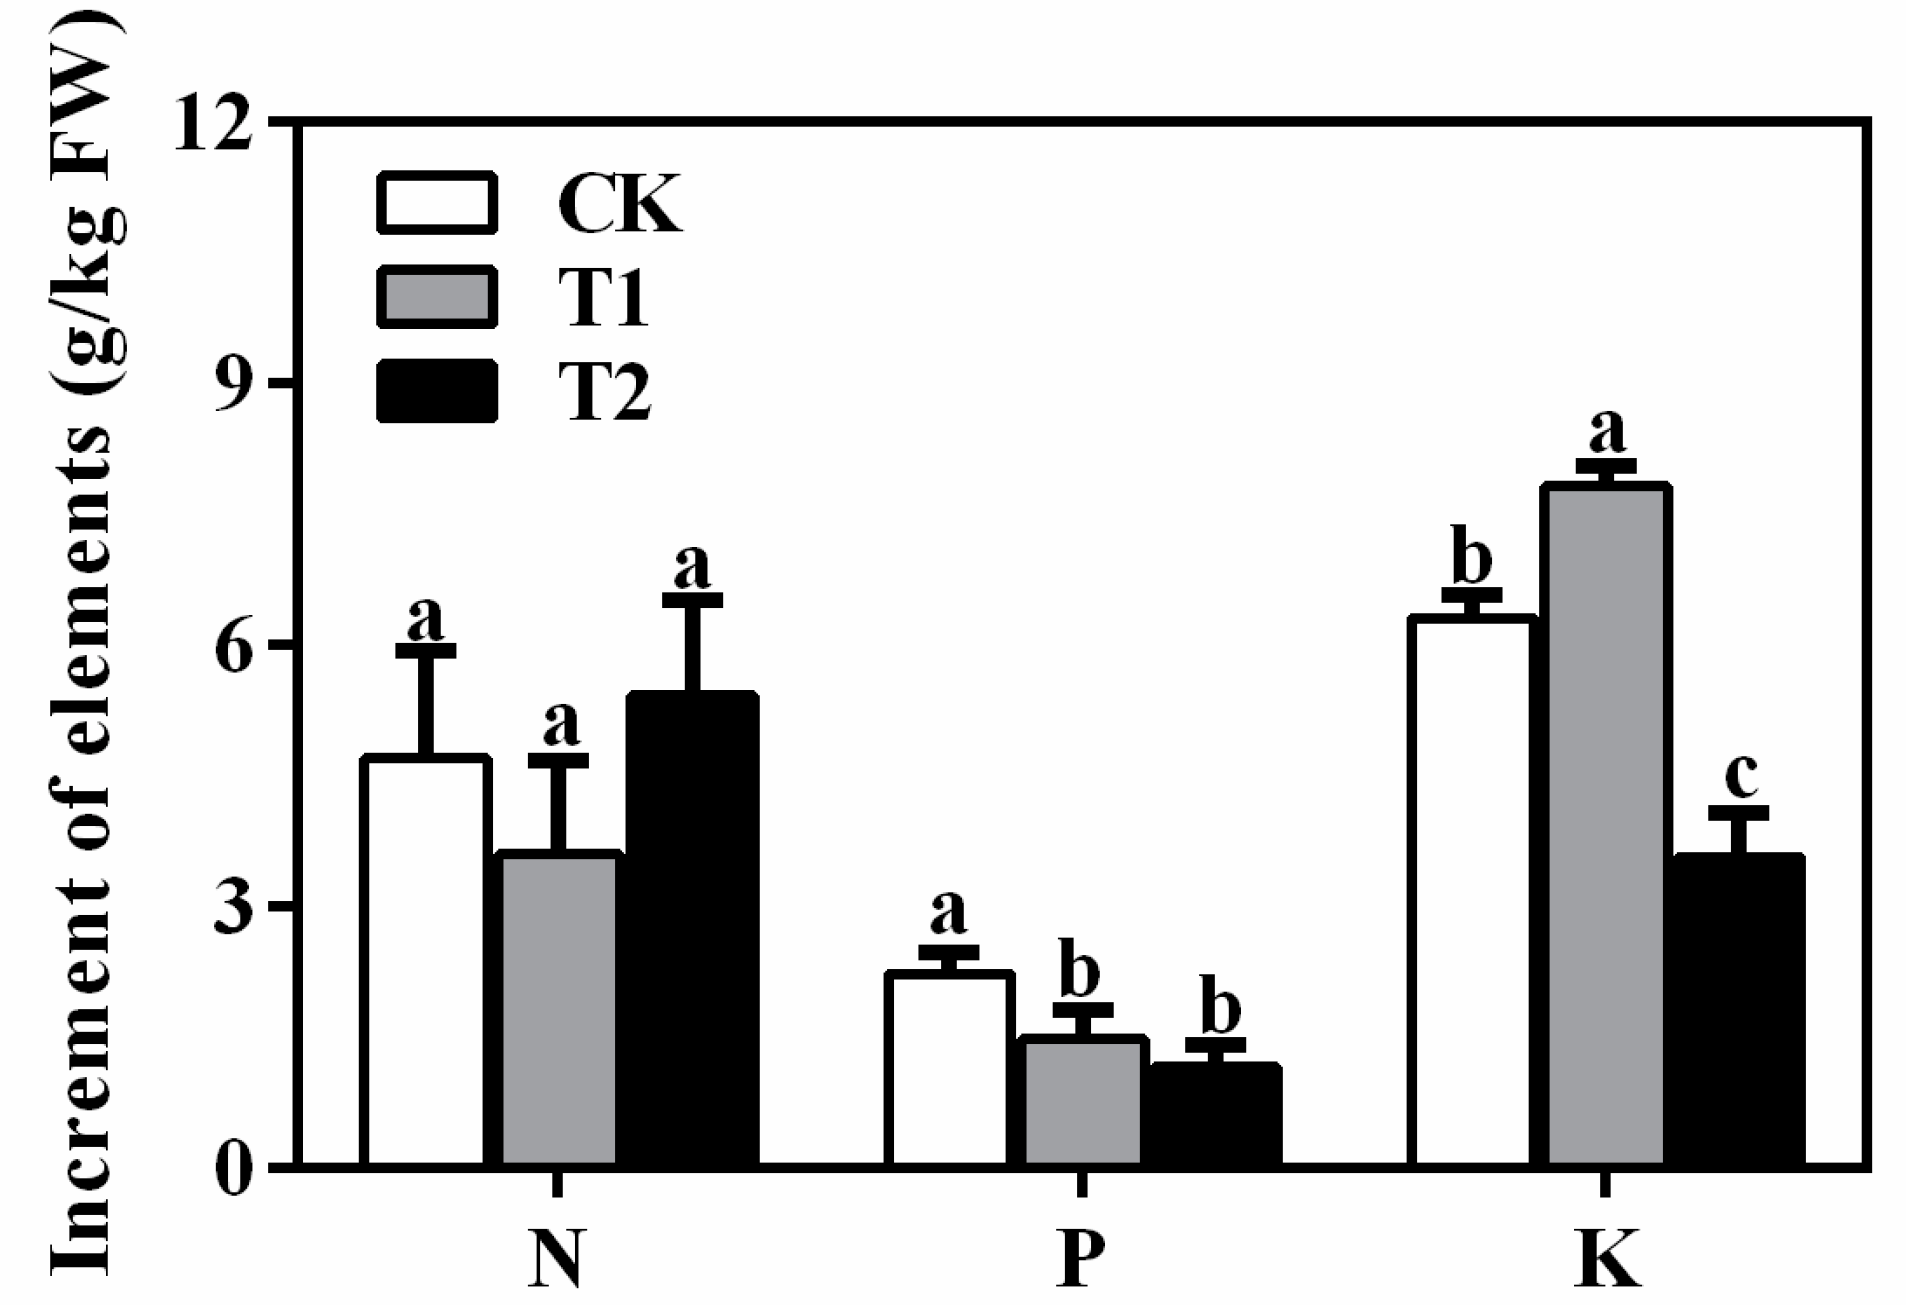
3.3. Effects of Different Nutrition Treatments on Elements Absorption of ‘Misty’ in PFAL

The N element increment in the control and T2 treatment was higher than that in the T1 treatment, although not significant (Figure 6). The P element in both T1 and T2 treatments was significantly lower than that in the control treatment (Figure 6). The K element in the T1 treatment was significantly higher but smallest in the T2 treatment (Figure 6). The results above indicated that higher N and K supply inhibited the absorption of the P element, and higher K supply might significantly facilitate increasing K content in leaves of ‘Misty’ in PFAL.
The correlation analysis of growth traits, photosynthetic characteristics, and nutrition elements suggested a significant positive correlation of plant height, stem diameter, new shoot number, new shoot length, and the increment of N, P, and K elements (Table 3). The net Pn was significantly negatively associated with internal CO2 concentration (Ci) but was significantly positively correlated with stomatal conductance (gs) and transpiration rate (E) (Table 3). A significant positive correlation was observed for the increment of N, P, and K elements (Table 3).

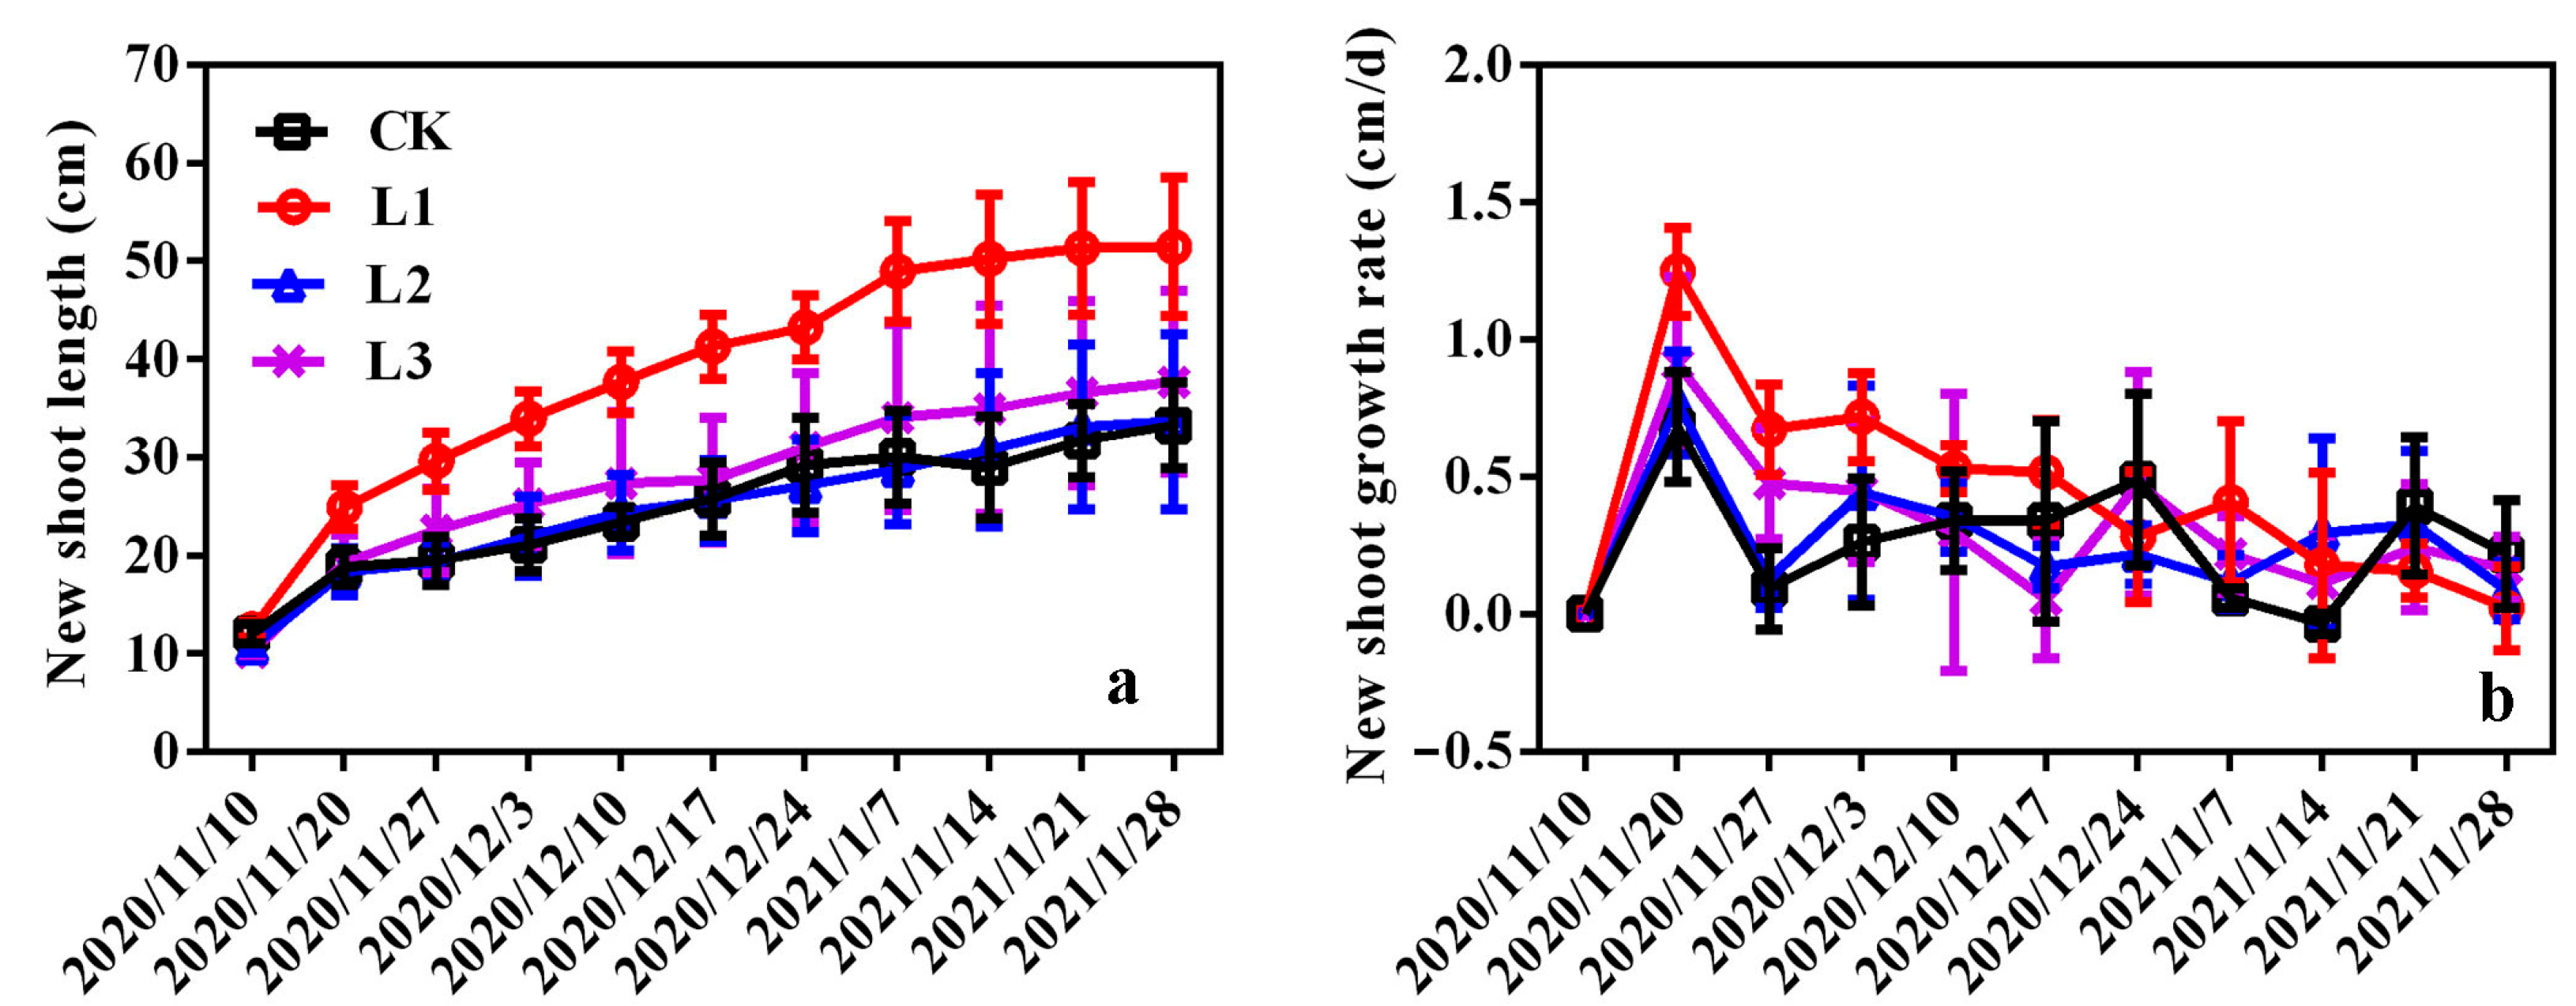
3.4. Effects of Different Light Qualities on Plant Growth of ‘Misty’ in PFAL

There were no significant differences in plant height, stem diameter, new shoot number, and leaf area among the four light-quality treatments. However, the plant height, stem diameter, and leaf area of ‘Misty’ grown under the red-lighting treatment (L1) was prominently larger than those grown under the other three lighting treatments (Table 4; Figure 7). In addition, the new shoot length of ‘Misty’ grown in the red spectrum (L1) was significantly larger, suggesting vegetable growth was evidently promoted by the red spectrum (Table 4; Figure 8a,b). Chlorophyll content (64.68 SPAD value) and anthocyanin (132.45 mg/kg) of ‘Misty’ leaves under the blue spectrum (L2) was significantly higher than that of the other three light-quality treatments (Table 4), indicating that blue spectrum accelerated anthocyanin accumulation in leaves of ‘Misty’.

3.5. Effects of Different Light Qualities on Photosynthetic Characteristics of ‘Misty’ in PFAL

The net photosynthetic rates (Pn) of ‘Misty’ grown under red (L1) and blue (L2) spectra were significantly reduced with the Pn value of 0.69 and 0.43 µmol·m−2·s−1, respectively, compared to those grown under white light (Table 5). There were no significant Pn differences of ‘Misty’ between white and 60% red + 40% blue spectrum (L3). The Pn value for white light and L3 treatment was 1.34 and 1.35 µmol·m−2·s−1, respectively (Table 5). No significant differences in stomatal conductance (gs) were observed among four light-quality treatments (Table 5). The internal CO2 concentration (Ci) of the L1 and L2 treatments was significantly higher than those of the control and L3 treatment (Table 5). The transpiration rate (E) of the control treatment was significantly lower than those of the other three treatments (Table 5).

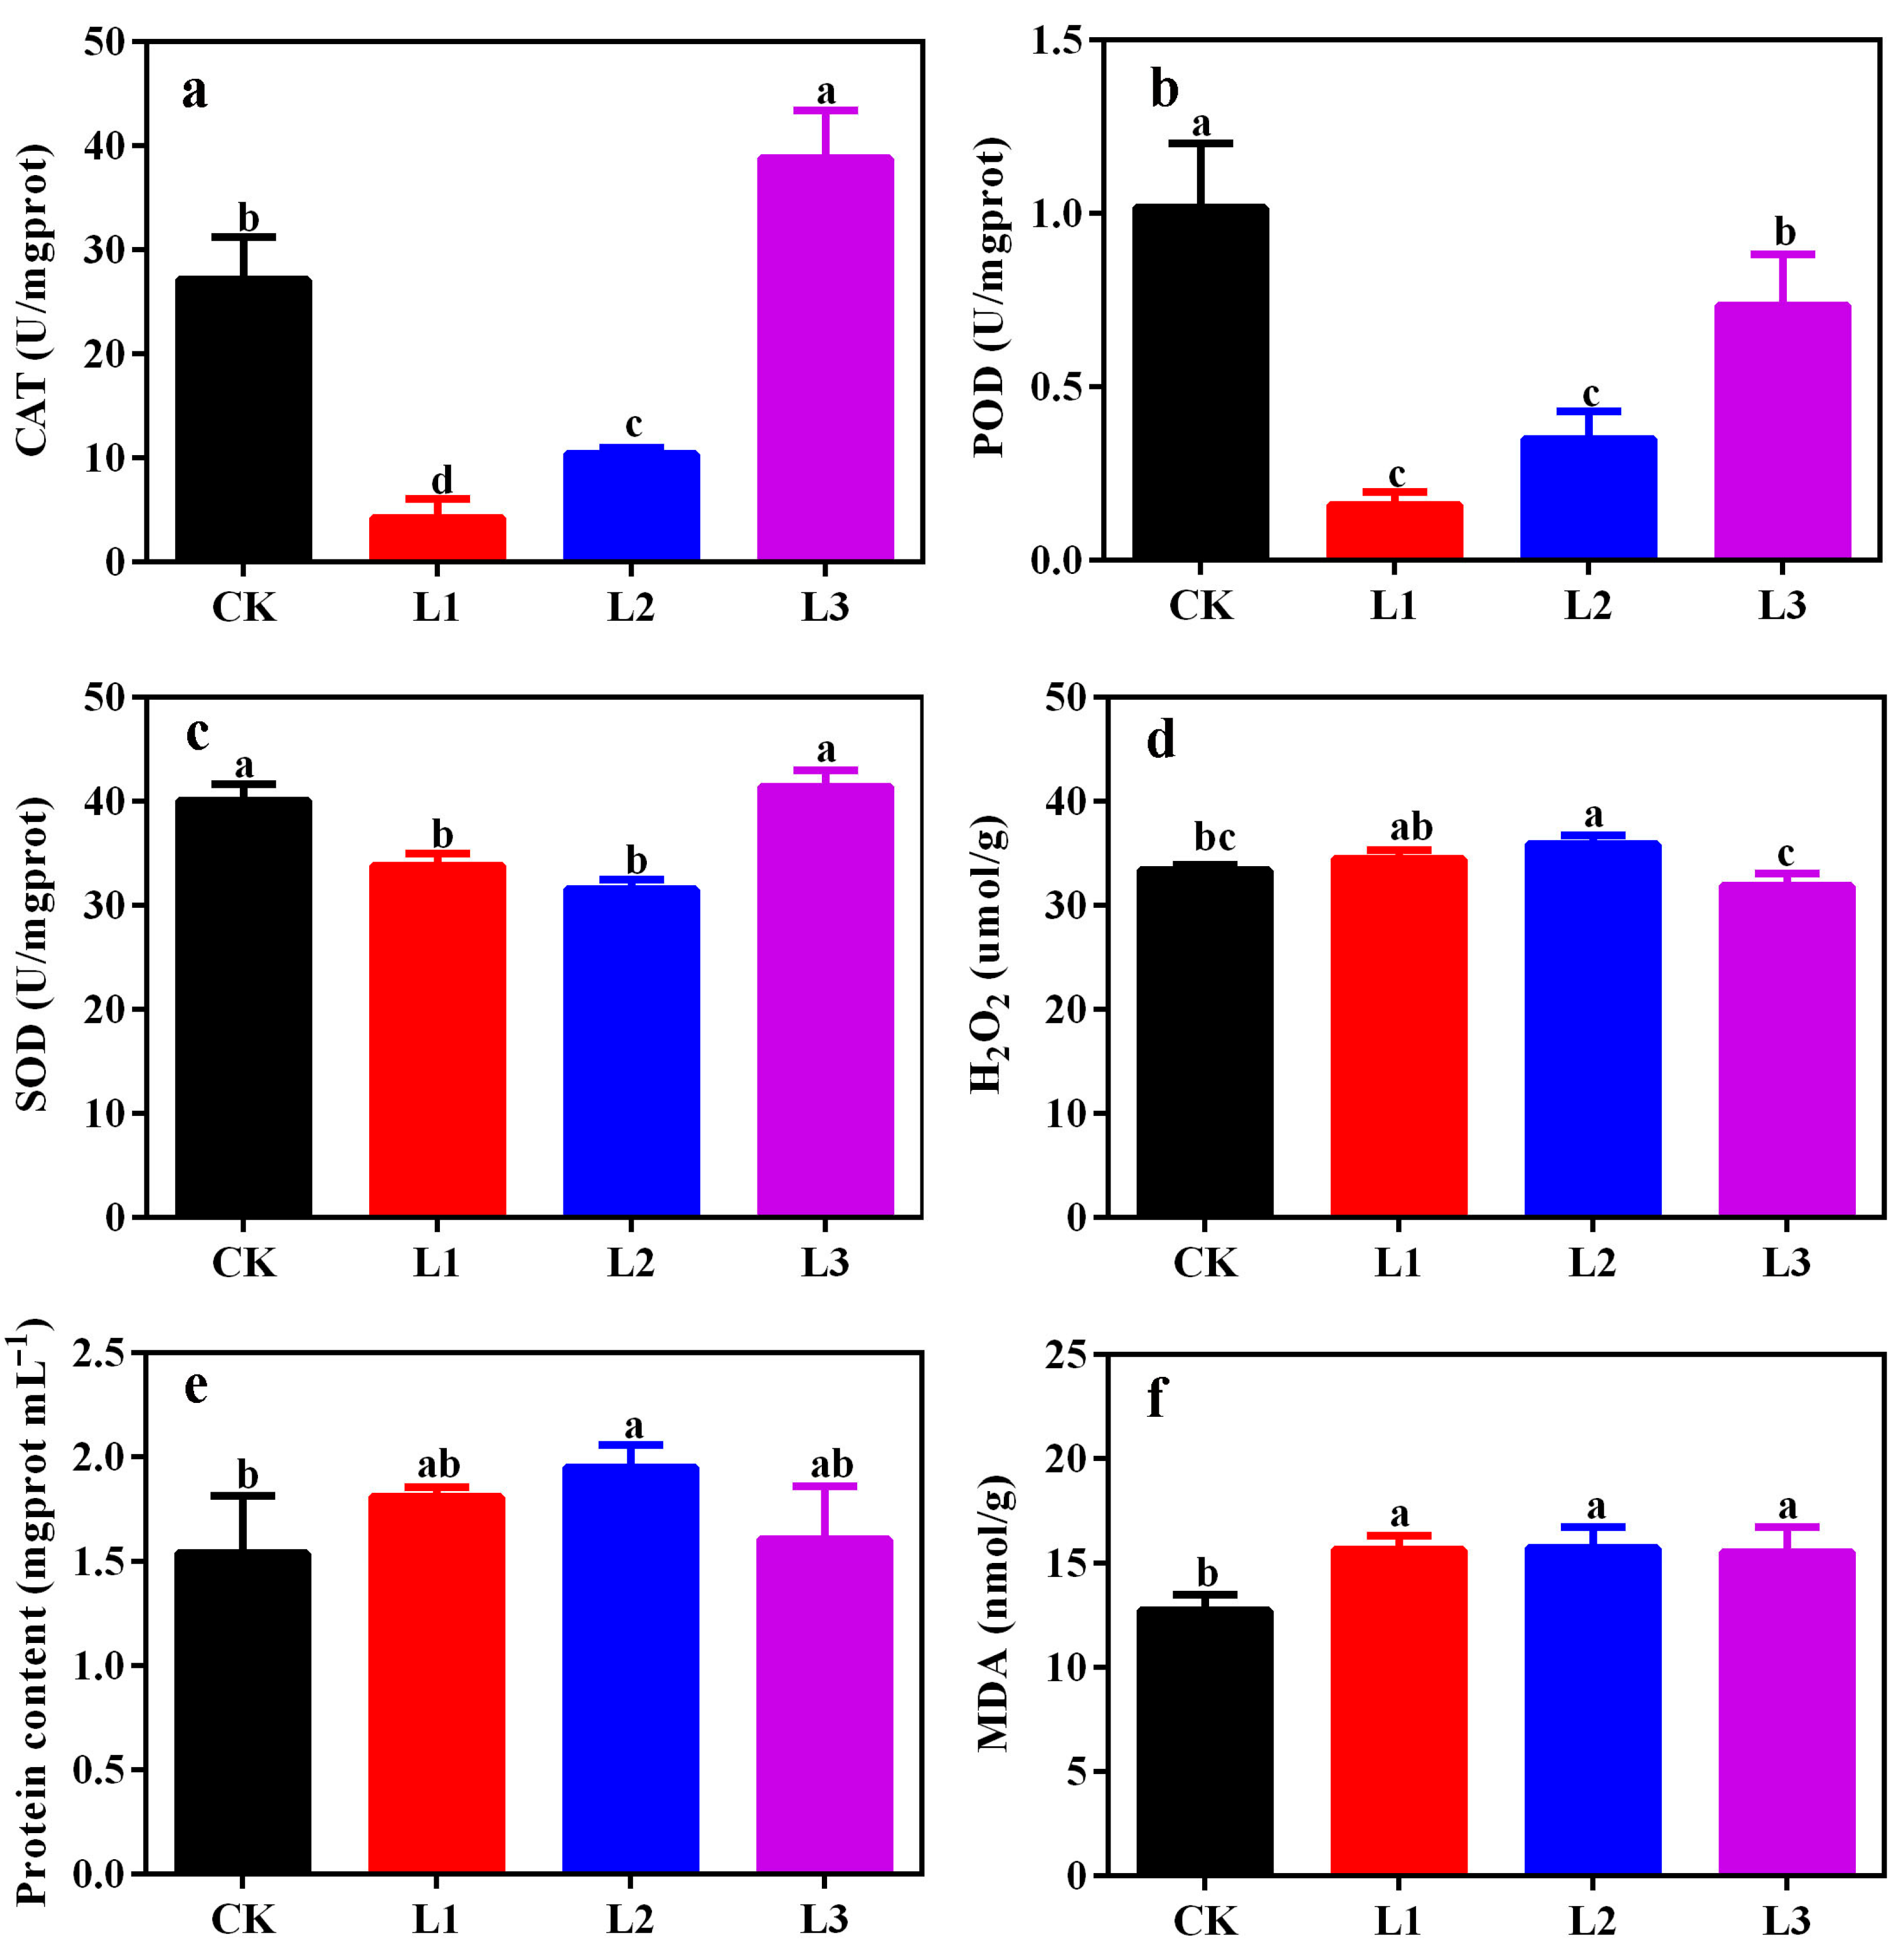
3.6. Changes in CAT, POD, SOD, H2O2, MDA, and Protein Content of ‘Misty’ Leaves in PFAL

Compared to those grown under white light, the CAT activity in ‘Misty’ leaves grown under the red (L1) and blue (L2) spectra was significantly reduced, whereas, under the 60% red + 40% blue spectrum (L3), it was significantly increased (Figure 9a). All the POD activities in ‘Misty’ leaves under the red (L1), blue (L2), and red/blue combined light (L3) were significantly decreased compared with that of white light (Figure 9b). The SOD activity under the red (L1) and blue (L2) spectra was significantly reduced, but no significant difference was observed between the leaves under red/blue and white light (Figure 9c). The H2O2 level and protein content in ‘Misty’ leaves under blue light were significantly higher than that under white light. There was no significant difference between red/blue and white light (Figure 9d,e). The MDA content in ‘Misty’ leaves under red, blue, and red/blue light was significantly higher than that of white light (Figure 9f).

4. Discussion

Recently, increasing focus has been on plant factories because indoor environmental factors such as temperature, light, and nutrition supply can be adjusted freely and strictly to provide a suitable growing condition [27]. Therefore, optimizing the indoor growth parameters of PFALs is urgently required to ensure thriving plant growth in the closed PFAL system and yield higher-quality vegetables or fruits. In the present study, an advanced plant factory with artificial lighting for blueberry cultivation was established in 2017, but the related technology for blueberry cultivation in PFALs was unclear. Therefore, to explore the related parameters suitable for blueberries in PFAL, the growth performance of blueberries under different nutrition supplies and light qualities in PFAL was investigated using a southern highbush cv. ‘Misty’.
Nitrogen (N), phosphorus (P), and potassium (K) are essential macronutrients for plant growth and development, and their availability largely affects the yield and quality of plants, including blueberry [28,29,30]. Though blueberry is well adapted to acidic soils with relatively low nutrient availability, a good fertilization program is frequently required for profitable production [31,32] because low pH of the growth medium can result in low plant availability for nutrients [33]. The deficiency of N, P, and K elements in blueberry can lead to various suppressive symptoms of plant height, basal diameter, and root volume, and the net Pn rate under –N, –P, and –K conditions is decreased significantly [34]. Appropriate application of N, P, and K effectively improves nutrient absorption and accumulation, enhances leaf photosynthesis, and promotes plant growth [35]. Li et al. (2009) analyzed the effects of N, P, and K on the growth, fruit production, and leaf physiology of blueberries at three fertilizer levels (14, 28, 42 N per plant; 7, 14, 21 g P per plant; and 7, 14, 21 g K per plant) [35]. Chlorophyll content and leaf color value varied significantly after fertilizer application, but no differences were observed among the shoot length and leaf area. They proposed that the best fertilizer combination of N, P, and K for blueberry was 28 N-14 P2O5-14 K2O. Conversely, in the present study under PFALs condition, the new shoot number and length under N:P:K = 2:1:1 treatment (T2) were significantly higher with a higher growth rate of new shoots (Table 1; Figure 4). Simultaneously, the Pn value of the T2 treatment was also significantly the largest (Table 2; Figure 5). Moreover, the increment of N, P, and K elements in leaves was considerably influenced by nutrition supply (Figure 6). Correlation analysis indicated that the N, P, and K were significantly positively associated with all vegetative traits, including plant height, stem diameter, new shoot number, and length (Table 3), suggesting exogenous fertilizer application can promote the uptake of N, P and K, and thus accelerate plant growth of blueberry. The results were consistent with Wei et al. (2021) [34] but relatively in agreement with Li et al. (2009) [35]; this might be due to the differences in tested blueberry cultivars, experimental conditions, or other factors. Generally, higher nitrogen content can promote chlorophyll synthesis or affect the amount of photosynthate, which directly/indirectly influences the photosynthetic capacity. Therefore, the future nutrition budgets for blueberries should comprehensively consider various characteristics, plant developmental stages, and environmental factors in PFALs. Furthermore, blueberry was thought to display an N-source preference for NH4+ [36], and the 5/1 (NH4+/NO3) ratio was recommended to promote the growth and improve the quality of blueberry [37]. Thus, the nitrogen-type trial, i.e., ammonium and nitrate nitrogen, was better introduced into PFALs to further investigate the growth adaptability of blueberries, including vegetative and reproductive growth.
Light is one of the most important environmental factors affecting plant growth and development. It directly influences the biological processes of plants by converting light energy into biochemical energy and indirectly regulates their morphogenesis, photoperiod response, physiological metabolism, crop yield and quality, and other aspects of plants [38,39,40]. Considering the advantage of light-emitting diodes (LEDs) (precise regulation of the spectrum or light intensity), the LEDs have become a viable lighting source for producing transplants in closed-type conditions, including PFALs. Revealing the relationship between plants and their responses under different LED-lighting conditions is necessary. The high proportion of red light normally induces a faster vegetative growth of plants [41,42], whereas blue light is important in the formation of chlorophyll and has a positive impact on photosynthetic ability [43]. In the plant factory system, faster growth and larger leaf area of lettuce were induced under full red light irradiation [44]. On the contrary, the plant height, leaf development, and photosynthetic characteristics of eggplant seedlings were inhibited by red light but improved by blue light [42]. Blue light also positively affected the shoot length of Anigozanthos bicolor and Zieria fraseria [45]. Moreover, a decline in fresh and dry mass accumulation of Chinese cabbage plants under combined red and blue LEDs was observed compared to those grown under high-pressure sodium lamps [46]. These incompletely consistent descriptions from previous studies might be due to the different responses of plants to light differing vastly from plant species. Although a noticeable promoting effect of the full red spectrum on new shoots elongation and leaf area expansion was observed (Table 4; Figure 7 and Figure 8), the chlorophyll and anthocyanin content of ‘Misty’ leaves under a full blue spectrum was significantly enriched (Table 4), suggesting different spectra might result in different phenotypic traits of ‘Misty’ grown in PFALs. Based on the photoprotection hypothesis, plants generally respond positively to external conditions as well as light environments [47]. Though the potential mechanism of anthocyanin biosynthesis of blueberry leaves’ response to different light qualities in PFAL was analyzed in our previous work described by Zhang et al. (2022a) [23], and some candidate genes involved in anthocyanin accumulation were identified, the growth of blueberry such as vegetative growth, and chlorophyll and anthocyanin accumulation under closed conditions in PFALs was influenced by multiple events. Therefore, the relationship between blueberry growth and environmental factors needs to be further investigated in the future. Moreover, the net Pn rates of ‘Misty’ leaves treated with the red and blue spectra were both significantly reduced (Table 5); however, the Pn value treated by a combination of 60% red and 40% blue light was fortuitously similar to that of the control treatment (white-LED lighting) (Table 5). It has been proven that in a dynamic light environment (open field farm), photosynthesis was limited by slow stomatal response to increasing light, and blueberry leaves reach a photosynthetic threshold at a light intensity of approximately 500 μmol m−2 s−1 [48], while in semi-closed or controlled PFAL conditions, constantly low light intensity (150 to 350 μmol m−2 s−1) could ensure blueberry plants to produce a vigorous fruit tree by maintaining leaves with constant Pn activity [22]. In this study, the Pn rate obtained either in Experiment 1 (Table 2) or in Experiment 2 (Table 5) was strangely lower than that of Pn obtained in blueberry leaves grown under open field [48] or shade condition [49], this might be attributed to the light intensity used in PFAL was relatively lower than open field condition. Antioxidant enzymes such as CAT, POD, SOD, and H2O2 play vital roles in the repair of oxidative damage, but different light qualities and high light intensity produce certain oxidative stress, leading to an increment or decrement in the activity of endogenous antioxidant enzymes [50,51]. For example, a long time exposure to supplementary light with high intensity resulted in notably decreased activities of SOD and CAT in cucumber seedlings [52]. The blue LED light was suggested to stimulate protein synthesis involved in the photosynthesis process [53]. In the present work, the CAT, POD, and SOD activities in ‘Misty’ leaves under red and blue light were significantly reduced, the H2O2 level and protein content under blue light were significantly higher, and the MDA content under red, blue, and red/blue light was significantly higher than that of white light (Figure 9a–f), supporting the fact that insufficient or excessive light can cause abiotic stresses [54,55]. Overall, the combined application of red and blue light was more beneficial to blueberry growth and might be a preferential strategy in PFAL than the monochromatic light quality. However, a suitable ratio of red and blue light, whether there is a need to add other wavelengths of light, and the response of blueberry plants to these complex light signals are still largely unknown. Moreover, the growth performance of blueberry in PFAL could be influenced by multiple factors, except for optimal nutrient solution with an appropriate N, P and K ratio obtained in Experiment 1 and a suitable combination of light quality or quantity based on the result of Experiment 2 in present study, therefore the future research should be focused on the synergistic reactions among nutrition, lighting, and other environmental conditions in PFAL.

5. Conclusions

In summary, the vegetative growth of blueberry in PFAL, especially the new shoot length and number, was evidently affected by higher nitrogen nutrition treatment. Exogenous fertilization can significantly accelerate the uptake of N, P, and K elements, and the ratio of N:P:K = 2:1:1 was suggested to be an optimized nutrition solution budget for blueberry in PFAL. Red light facilitated vegetative growth to some extent, blue light was conducive to increased chlorophyll and anthocyanin content, and the Pn value was significantly enhanced under 60% red plus 40% blue light. The antioxidant enzymes, MDA, and protein content in blueberry leaves were significantly influenced by monochromatic light quality, and a combined application of red and blue lights was a preferential strategy in PFAL. This is the first study on cultivation technology in a closed environment of PFAL in China, which lays the foundation for plant factory blueberry cultivation in the future.

Author Contributions

Conceptualization, H.A. and X.Z.; methodology, H.A. and J.Z.; validation, H.A. and X.Z.; formal analysis, H.A., J.Z., L.Z., S.L. and X.Z.; investigation, H.A., J.Z., B.Z. and L.Z.; data curation, H.A. and X.Z.; writing—original draft preparation, H.A.; writing—review and editing, H.A. and X.Z.; visualization, X.Z.; supervision, X.Z.; project administration, X.Z.; funding acquisition, X.Z. All authors have read and agreed to the published version of the manuscript.

Funding

This work was funded by the Key Scientific Project of the Shanghai Science and Technology Commission (No. 17391900800) and the Excellent Team Program of the Shanghai Academy of Agricultural Sciences (No. 2022-022).

Data Availability Statement

The data presented in this study are available on request from the corresponding author.

Conflicts of Interest

The authors declare no conflict of interest.

References

  1. Kozai, T. Resource use efficiency of closed plant production system with artificial light: Concept, estimation and application to plant factory. Proc. Jpn. Acad. Ser. B 2013, 89, 447–461. [Google Scholar] [CrossRef] [PubMed] [Green Version]
  2. Kozai, T. Plant factory in Japan—Current situation and perspectives. Chron. Hortic. 2013, 53, 8–11. [Google Scholar]
  3. Kozai, T. Towards sustainable plant factories with artificial lighting (PFALs) for achieving SDGs. Int. J. Agric. Biol. Eng. 2019, 12, 28–37. [Google Scholar] [CrossRef] [Green Version]
  4. Cho, H.Y.; Kadowaki, M.; Che, J.; Takahashi, S.; Horiuchi, N.; Ogiwara, I. Influence of light quality on flowering characteristics, potential for year-round fruit production and fruit quality of blueberry in a plant factory. Fruits 2019, 74, 3–10. [Google Scholar] [CrossRef]
  5. Kozai, T.; Niu, G. Plant factory as a resource—Efficient closed plant production system. Plant Fact. 2016, 2016, 69–90. [Google Scholar]
  6. Joshi, J.; Zhang, G.; Shen, S.; Supaibulwatana, K.; Watanabe, C.K.A.; Yamori, W. A combination of downward lighting and supplemental upward lighting improves plant growth in a closed plant factory with artificial lighting. HortScience 2017, 52, 831–835. [Google Scholar] [CrossRef] [Green Version]
  7. Niu, G.; Kozai, T.; Sabeh, N. Physical environmental factors and their properties. In Plant Factory: An Indoor Vertical Farming System for Efficient Quality Food Production, 1st ed.; Academic Press: Cambridge, MA, USA, 2016; pp. 129–140. [Google Scholar]
  8. Kikuchi, Y.; Kanematsu, Y.; Yoshikawa, N.; Okubo, T.; Takagaki, M. Environmental and resource use analysis of plant factories with energy technology options: A case study in Japan. J. Clean. Prod. 2018, 186, 703–717. [Google Scholar] [CrossRef]
  9. Watanabe, H. Light-controlled plant cultivation system in Japan—Development of a vegetable factory using LEDs as a light source for plants. Acta Hortic. 2011, 907, 37–44. [Google Scholar] [CrossRef]
  10. Shimizu, H.; Saito, Y.; Nakashima, H.; Miyasaka, J.; Ohdoi, K. Light environment optimization for lettuce growth in plant factory. Int. Fed. Autom. Control. 2011, 44, 605–609. [Google Scholar] [CrossRef] [Green Version]
  11. Shimizu, H.; Nakashima, H.; Miyaska, J.; Ohdoi, K. Current state and research trend in light environment for plant factory. Sens. Technol. Biomater. Food Agric. 2013, 8881, 888104. [Google Scholar]
  12. Wang, Y.; Chu, Y.; Wan, Z.; Zhang, G.; Liu, L.; Yan, Z. Root architecture, growth and photon yield of cucumber seedlings as influenced by daily light integral at different stages in the closed transplant production system. Horticulturae 2021, 7, 328. [Google Scholar] [CrossRef]
  13. Ohishi-Yamazaki, M.; Watanabe, M.; Nakanishi, A.; Che, J.; Horiuchi, N.; Ogiwara, I. Shortening of the juvenile phase of the southern highbush blueberry (Vaccinium corymbosum L. interspecific hybrid) grown in controlled rooms under artificial light. Hortic. J. 2018, 87, 329–339. [Google Scholar] [CrossRef] [Green Version]
  14. Cho, H.Y.; Kadowaki, M.; Che, J.; Horiuchi, N.; Ogiwara, I. Plant morphological characteristics for year-round production and its fruit quality in response to different light wavelengths in blueberry. Acta Hortic. 2018, 1206, 201–209. [Google Scholar] [CrossRef]
  15. Gupta-Elera, G.; Garrett, A.; Martinez, A.; Kraus, R.D.; Robison, R.; O’Neill, K. A comparison of antioxidant properties in organic and conventional blueberries. J. Food Res. 2012, 1, 1–7. [Google Scholar] [CrossRef] [Green Version]
  16. An, H.; Zhang, J.; Xu, F.; Jiang, S.; Zhang, X.; 2020. Transcriptomic profiling and discovery of key genes involved in adventitious root formation from green cuttings of highbush blueberry (Vaccinium corymbosum L.). BMC Plant Biol. 2020, 20, 182. [Google Scholar] [CrossRef] [Green Version]
  17. Li, S.; Zhang, J.; Zhang, L.; Fang, X.; Luo, J.; An, H.; Zhang, X. Genome-wide identification and comprehensive analysis reveals potential roles of long non-coding RNAs in fruit development of southern highbush blueberry (Vaccinium corymbosum L.). Front. Plant Sci. 2022, 13, 1078085. [Google Scholar] [CrossRef]
  18. Li, Y.; Pei, J.; Chen, L.; Sun, H. China blueberry industry report 2020. J. Jilin Agric. Univ. 2021, 43, 1–8. (In Chinese) [Google Scholar]
  19. Valenzuela-Estrada, L.R.; Vera-Caraballo, V.; Ruth, L.E.; Eissenstat, D.M. Root anatomy, morphology and longevity among root orders in Vaccinium corymbosum (Ericaceae). Am. J. Bot. 2008, 95, 1506–1514. [Google Scholar] [CrossRef] [Green Version]
  20. An, H.; Meng, J.; Xu, F.; Jiang, S.; Wang, X.; Shi, C.; Zhou, B.; Luo, J.; Zhang, X. Rooting ability of hardwood cuttings in highbush blueberry (Vaccinium corymbosum L.) using different indole-butyric acid concentrations. HortScience 2019, 54, 194–199. [Google Scholar] [CrossRef] [Green Version]
  21. Pescie, M.A.; Fradkin, M.; Lavado, R.S.; Chiocchio, V.M. Endophytic fungi in blueberry cultivars, in three production areas of Argentina. Physiol. Mol. Plant P. 2021, 115, 101662. [Google Scholar] [CrossRef]
  22. Aung, T.; Muramatsu, Y.; Horiuchi, N.; Che, J.; Mochizuki, Y.; Ogiwara, I. Plant growth and fruit quality of blueberry in a controlled room under artificial light. J. Japan Soc. Hortic. Sci. 2014, 83, 273–281. [Google Scholar] [CrossRef] [Green Version]
  23. Zhang, J.; Li, S.; An, H.; Zhang, X.; Zhou, B. Integrated transcriptome and metabolome analysis reveals anthocyanin biosynthesis mechanisms in blueberry (Vaccinium corymbosum L.) leaves under different light qualities. Front. Plant Sci. 2022, 13, 1073332. [Google Scholar] [CrossRef] [PubMed]
  24. Wang, J.; Tiyip, T.; Ding, J.; Zhang, D.; Liu, W.; Wang, F. Quantitative estimation of organic matter content in arid soil using vis-NIR spectroscopy preprocessed by fractional derivative. J. Spectrosc. 2017, 2017, 1375158. [Google Scholar] [CrossRef] [Green Version]
  25. Li, L.; Zhang, H.; Liu, Z.; Cui, X.; Zhang, T.; Li, Y.; Zhang, L. Comparative transcriptome sequencing and de novo analysis of Vaccinium corymbosum during fruit and color development. BMC Plant Biol. 2016, 16, 223. [Google Scholar] [CrossRef] [PubMed] [Green Version]
  26. Zhang, J.; An, H.; Zhang, X.; Xu, F.; Zhou, B. Transcriptomic analysis reveals potential gene regulatory networks under cold stress of loquat (Eriobotrya japonica Lindl.). Front. Plant Sci. 2022, 13, 944269. [Google Scholar] [CrossRef]
  27. Pennisi, G.; Pistillo, A.; Orsini, F.; Cellini, A.; Spinelli, F.; Nicola, S.; Fernandez, J.A.; Crepaldi, A.; Gianquinto, G.; Marcelis, L.F.M. Optimal light intensity for sustainable water and energy use in indoor cultivation of lettuce and basil under red and blue LEDs. Sci. Hortic. 2020, 272, 109508. [Google Scholar] [CrossRef]
  28. Wang, Y.; Chen. Y.F.; Wu. W.H. Potassium and phosphorus transport and signaling in plants. J. Integr. Plant Biol. 2021, 63, 34–52. [Google Scholar] [CrossRef]
  29. Cabrera, R.; Areces, A.J.; Diaz-Larrea, J.; Garcia, L.N.; Cruz-Avina, J.R. Influence of the macronutrients N, P and K on the agarophyte Alsidium triquetrum (S.G. Gmelin) trevisan, during experimental culture. Am. J. Plant Sci. 2021, 12, 573–585. [Google Scholar] [CrossRef]
  30. Doyle, J.W.; Nambeesan, S.U.; Malladi, A. Physiology of nitrogen and calcium nutrition in blueberry (Vaccinium sp.). Agronomy 2021, 211, 765. [Google Scholar] [CrossRef]
  31. Korcak, R.F. Nutrition of blueberry and other calcifuges. Hortic. Rev. 1988, 10, 183–227. [Google Scholar]
  32. Bryla, D.R.; Strik, B.C. Nutrient requirements, leaf tissue standards, and new options for fertigation of northern highbush blueberry. Horttechnology 2015, 25, 464–470. [Google Scholar] [CrossRef] [Green Version]
  33. Nestby, R.; Martinussen, I.; Krogstad, T.; Uleberg, E. Effects of fertilization, tiller cutting and environment on plant growth and yield of European blueberry (Vaccinium myrtillus L.) in Norwegian forest fields. J. Berry Res. 2014, 4, 79–95. [Google Scholar] [CrossRef] [Green Version]
  34. Wei, B.; Lou, X.; Wang, H.; Li, G. Effects of macroelements deficiency on the plant growth and gas exchange parameters of blueberries. Sci. Technol. Eng. 2021, 21, 1288–1294. (In Chinese) [Google Scholar]
  35. Li, Y.; Zhao, S.; Dai, H.; Guo, X. Effects of Nitrogen, phosphorus and potassium on growth, fruit production and leaf physiology in blueberry. Acta Hortic. 2009, 810, 759–764. [Google Scholar]
  36. Haynes, R.; Goh, K.M. Ammonium and nitrate nutrition of plants. Biol. Rev. 1978, 53, 465–510. [Google Scholar] [CrossRef]
  37. Zhang, Y.Y.; Tian, J.P.; Cui, J.; Hong, Y.H.; Luan, Y.S. Effects of different NH4+/NO3 ratios on the photosynthetic and physiology responses of blueberry (Vaccinium spp.) seedlings growth. J. Plant Nutr. 2021, 44, 854–864. [Google Scholar]
  38. Yanagi, T.; Okamoto, K.; Takita, S. Effects of blue, red, and blue/red lights of two different PPF levels on growth and morphogenesis of lettuce plants. Acta Hortic. 1996, 440, 117–122. [Google Scholar] [CrossRef]
  39. Dou, H.; Niu, G.; Gu, M.; Masabni, J.G. Effects of light quality on growth and phytonutrient accumulation of herbs under controlled environments. Horticulturae 2017, 3, 36. [Google Scholar] [CrossRef] [Green Version]
  40. Zhang, X.; He, D.; Niu, G.; Yan, Z.; Song, J. Effects of environment lighting on the growth, photosynthesis, and quality of hydroponic lettuce in a plant factory. Int. J. Agric. Biol. Eng. 2018, 2, 33–40. [Google Scholar] [CrossRef]
  41. Son, K.H.; Oh, M.M. Leaf shape, growth, and antioxidant phenolic compounds of two lettuce cultivars grown under various combinations of blue and red light-emitting diodes. HortScience 2013, 48, 988–995. [Google Scholar] [CrossRef]
  42. Di, Q.; Li, J.; Du, Y.; Wei, M.; Shi, Q.; Yang, F. Combination of red and blue lights improved the growth and development of eggplant (Solanum melongena L.) seedlings by regulating photosynthesis. J. Plant Growth Regul. 2021, 40, 1477–1492. [Google Scholar] [CrossRef]
  43. Kong, Y.; Nemali, K. Blue and far-red light affect area and number of individual leaves to influence vegetative growth and pigment synthesis in lettuce. Front. Plant Sci. 2021, 12, 667407. [Google Scholar] [CrossRef] [PubMed]
  44. Khoramtabrizi, M.; Aliniaeifard, S.; Chegini, G. Effects of different artificial light spectra on growth of lettuce in a continuous plant factory system. Acta Hortic. 2020, 1271, 101–106. [Google Scholar] [CrossRef]
  45. Tapingkae, T.; Taji, A. Light quality and quantity: Their effects on in vitro growth and development of two Australian plant species. Acta Hortic. 2000, 541, 281–288. [Google Scholar] [CrossRef]
  46. Ptushenko, V.V.; Avercheva, O.V.; Bassarskaya, E.M.; Berkovich, Y.A.; Erokhin, A.N.; Smolyanina, S.O.; Zhigalova, T.V. Possible reasons of a decline in growth of Chinese cabbage under a combined narrowband red and blue light in comparison with illumination by high-pressure sodium lamp. Sci. Hortic. 2015, 194, 267–277. [Google Scholar] [CrossRef]
  47. Hughes, N.M.; Lev-Yadun, S. Review: Why do some plants have leaves with red or purple undersides? Environ. Exp. Bot. 2023, 205, 105126. [Google Scholar] [CrossRef]
  48. Petridis, A.; van der Kaay, J.; Chrysanthou, E.; McCallum, S.; Graham, J.; Hancock, R.D. Photosynthetic limitation as a factor influencing yield in highbush blueberries (Vaccinium corymbosum) grown in a northern European environment. J. Exp. Bot. 2018, 69, 3069–3080. [Google Scholar] [CrossRef] [PubMed]
  49. Kim, S.J.; Yu, D.J.; Kim, T.C.; Lee, H.J. Growth and photosynthetic characteristics of blueberry (Vaccinium corymbosum cv. Bluecrop) under various levels. Sci. Hortic. 2019, 129, 486–492. [Google Scholar] [CrossRef]
  50. Gechev, T.; Willekens, H.; Montagu, M.V.; Inze, D.; Van Camp, W.; Toneva, V.; Minkov, I. Different responses of tobacco antioxidant enzymes to light and chilling stress. J. Plant Physiol. 2003, 160, 509–515. [Google Scholar] [CrossRef] [PubMed]
  51. Shao, M.; Liu, W.; Zha, L.; Zhou, C.; Zhang, Y.; Li, B. Differential effects of high duration on growth, nutritional quality, and oxidative stress of hydroponic lettuce under red and blue LED irradiation. Sci. Hortic. 2020, 268, 109366. [Google Scholar] [CrossRef]
  52. Yan, Z.; Wang, L.; Wang, Y.; Chu, Y.; Lin, D.; Yang, Y. Morphological and physiological properties of greenhouse-grown cucumber seedlings as influenced by supplementary light-emitting diodes with same daily light integral. Horticulturae 2021, 7, 361. [Google Scholar] [CrossRef]
  53. Wang, S.; Verma, S.K.; Said, I.H.; Thomsen, L.; Ullrich, M.S.; Kuhnert, N. Changes in the fucoxanthin production and protein profiles in Cylindrotheca closterium in response to blue light-emitting diode light. Microb. Cell Fact. 2018, 17, 110. [Google Scholar] [CrossRef] [PubMed]
  54. Li, F.; Wei, S.Q.; Liu, N.; Xu, L.J.; Yang, P. Growth of cucumber seedlings in different varieties as affected by light environment. Int. J. Agric. Biol. Eng. 2020, 13, 73–78. [Google Scholar]
  55. Wei, H.; Wang, M.Z.; Jeong, B.R. Effect of supplementary lighting duration on growth and activity of antioxidant enzymes in grafted watermelon seedlings. Agronomy 2020, 10, 337. [Google Scholar] [CrossRef] [Green Version]
Figure 1. The schematic diagram (a), customized AEtrium-4 aeroponic/dripper system (b), and blueberry (c) cultivated in PFAL.
Horticulturae 09 00287 g001
Figure 2. The relative spectral photon flux of AEpic LED-growth lamps in Room 1 of the blueberry plant factory. The wavelengths of light sources were measured with a spectrometer (PMS-2000 v1.01, Everfine corporation, Hangzhou, China).
Horticulturae 09 00287 g002
Figure 3. The relative spectral photon flux of AEpic LED-growth lamps in Room 2 of the blueberry plant factory. Notes: CK, white LED light; L1, red spectrum, L2, blue spectrum, L3, 60% red + 40% blue spectrum. The wavelengths of light sources were measured with a Spectro-Radiometer (JETI 1211, JETI Technische Instrumente GmbH, Jena, Germany).
Horticulturae 09 00287 g003
Figure 4. Dynamic changes of new shoot length (a) and growth rate (b) of ‘Misty’ grown in a plant factory with artificial lighting.
Horticulturae 09 00287 g004
Figure 5. Photosynthetic light-response curves of ‘Misty’ in a plant factory with artificial lighting. Notes: PPFD indicates photosynthetic photon flux density, and the bar indicates the standard deviation.
Horticulturae 09 00287 g005
Figure 6. Increment of N, P, K elements in leaves of ‘Misty’ in a plant factory with artificial lighting. Notes: The data are the mean value of three replicates, and the bar indicates the standard deviation. Different letters indicate significance at p ≤ 0.05 based on Duncan’s multiple range tests.
Horticulturae 09 00287 g006
Figure 7. Blueberries grown under white (CK), red (L1), blue (L2), and 60% red + 40% blue (L3) light qualities in Room 2 of the plant factory.
Horticulturae 09 00287 g007
Figure 8. Dynamic changes of the new shoot length (a) and growth rate (b) of ‘Misty’ grown under different light qualities in a plant factory with artificial lighting. Note: CK, white LED light; L1, red spectrum, L2, blue spectrum, L3, 60% red + 40% blue spectrum; the bar indicates the standard deviation.
Horticulturae 09 00287 g008
Figure 9. Changes in the activity of antioxidant enzymes CAT (a), POD (b), and SOD (c) and levels of H2O2 (d) protein content (e) and MDA (f) in ‘Misty’ leaves under different light qualities in a plant factory with artificial lighting. Notes: CK, white LED light; L1, red spectrum, L2, blue spectrum, L3, 60% red + 40% blue spectrum. All data are mean ± standard deviation (SD) of three replicates. Different letters indicate significance at p ≤ 0.05 based on Duncan’s multiple range tests. The bar indicates the standard deviation.
Horticulturae 09 00287 g009
Table 1. Effects of different nutrition treatments on the growth of ‘Misty’ in the plant factory with artificial lighting.
TreatmentsPlant Height
(cm)
Stem Diameter
(mm)
New Shoot Length
(cm)
New Shoot NumberChlorophyll Content
(SPAD Value)
CK61.94 ± 16.45 a8.11 ± 1.89 b22.95 ± 5.35 b20.50 ± 6.63 b57.00 ± 5.91 a
T163.25 ± 9.82 a11.38 ± 2.42 a26.51 ± 5.3.56 ab18.75 ± 3.69 b52.90 ± 2.93 a
T272.50 ± 12.00 a11.95 ± 3.27 a29.00 ± 1.45 a29.79 ± 6.10 a56.93 ± 4.37 a
Notes: All data are mean ± standard deviation (SD) of eight replicates, different letters within the same column indicate significance at p ≤ 0.05 based on Duncan’s multiple range tests.
Table 2. Effects of different nutrition treatments on photosynthetic parameters of ‘Misty’ in a plant factory with artificial lighting.
TreatmentsPn
(µmol·m−2·s−1)
Gs
(µmol·m−2·s−1)
Ci
(µmol·m−2·s−1)
E
(mmol·m−2·s−1)
CK5.54 ± 0.85 c52.45 ± 16.22 a271.68 ± 23.93 a1.59 ± 0.39 b
T15.95 ± 0.71 b51.38 ± 9.41 a247.04 ± 14.79 b1.61 ± 0.25 b
T26.38 ± 0.77 a62.34 ± 13.34 a228.38 ± 24.83 c1.81 ± 0.31 a
Notes: the photosynthetic character was determined with the parameters were set as follows: the leaf temperature, relative humidity, CO2 reference, and photosynthetic photon flux density (PPFD) value were set at 25.1 °C, 60%, 390 ppm, and 1500 µmol·m−2·s−1, respectively. Pn, net photosynthetic rate; gs, stomatal conductance; Ci, internal CO2 concentration; E, transpiration rate. All data are mean ± standard deviation (SD) of eight replicates. Different letters within the same column indicate significance at p ≤ 0.05 based on Duncan’s multiple range tests.
Table 3. Correlation analysis of growth traits, photosynthetic index, and nutrition elements of ‘Misty’ grown in a plant factory with artificial lighting.
Plant HeightStem DiameterNew Shoot LengthNew Shoot NumberSPAD ValuePnCigsENPK
Plant height1
Stem diameter0.843 **1
New shoot length0.756 **0.915 **1
New shoot number0.891 **0.837 **0.841 **1
SPAD value0.875 **0.793 **0.831 **0.903 **1
Pn0.0640.1580.074−0.024−0.1341
Ci−0.315−0.438 *−0.484*−0.448*−0.287−0.451 *1
gs0.0750.019−0.0210.0260.0270.701 **−0.1281
E0.0680.020−0.0330.0470.0290.682 **−0.1910.951 **1
N0.962 **0.866 **0.773 **0.845 **0.814 **0.131−0.3690.0640.0401
P0.846 **0.588 **0.590 **0.756 **0.895 **−0.107−0.1340.1070.1220.760 **1
K0.894 **0.804 **0.756 **0.768 **0.866 **0.015−0.2830.0130.0510.893 **0.847 **1
Notes: Pn, net photosynthetic rate; gs, stomatal conductance; Ci, internal CO2 concentration; E, transpiration rate; * indicates significance at p ≤ 0.05 and ** indicates significance at p ≤ 0.01 based on Duncan’s multiple range tests.
Table 4. Effects of different light qualities on the growth of ‘Misty’ in plant factory with artificial lighting.
TreatmentsPlant Height
(cm)
Stem Diameter
(mm)
New Shoot Length
(cm)
New Shoot NumberLeaf Area
(mm2)
Chlorophyll Content
(SPAD Value)
Anthocyanin
Content
(mg/kg FW)
CK61.33 ± 20.66 a11.66 ± 1.05 a33.22 ± 4.38 b21.25 ± 5.32 a1349.39 ± 50.07 a53.53 ± 3.81 c28.80 ± 0.96 d
L181.25 ± 12.62 a12.30 ± 1.01 a51.43 ± 7.03 a17.50 ± 3.11 a1608.08 ± 261.03 a50.35 ± 2.44 c47.43 ± 1.35 c
L269.80 ± 11.00 a11.93 ± 1.65 a33.64 ± 8.94 b15.25 ± 1.50 a1427.97 ± 158.71 a64.68 ± 1.23 a132.45 ± 6.40 a
L368.63 ± 17.65 a11.69 ± 0.66 a37.68 ± 9.32 b22.67 ± 9.24 a1320.08 ± 228.47 a58.89 ± 2.68 b106.07 ± 2.64 b
Notes: CK, white LED light; L1, red spectrum, L2, blue spectrum, L3, 60% red + 40% blue spectrum. All data are mean ± SD of four replicates. Different letters within the same column indicate significance at p ≤ 0.05 based on Duncan’s multiple range tests.
Table 5. Effects of different light qualities on photosynthetic parameters of ‘Misty’ in plant factory with artificial lighting.
Tre atmentsPn
(µmol·m−2·s−1)
Gs
(µmol·m−2·s−1)
Ci
(µmol·m−2·s−1)
E
(mmol·m−2·s−1)
CK1.33 ± 0.27 a38.87 ± 6.17 a311.38 ± 8.67 c0.98 ± 0.10 b
L10.68 ± 0.25 b39.25 ± 3.20 a339.38 ± 13.81 b1.23 ± 0.14 a
L20.42 ± 0.25 c42.63 ± 6.30 a354.13 ± 15.00 a1.17 ± 0.11 a
L31.35 ± 0.19 a44.50 ± 7.17 a316.75 ± 14.73 c1.22 ± 0.14 a
Notes: the photosynthetic character was determined with the parameters were set as follows: the leaf temperature, relative humidity, CO2 reference, and photosynthetic photon flux density (PPFD) value were set at 25.1 °C, 60%, 390 ppm, and 1500 µmol·m−2·s−1, respectively. Pn, net photosynthetic rate; gs, stomatal conductance; Ci, internal CO2 concentration; E, transpiration rate. All data are mean ± standard deviation (SD) of four replicates. Different letters indicate significance at p ≤ 0.05 based on Duncan’s multiple range tests. The bar indicates the standard deviation.
Disclaimer/Publisher’s Note: The statements, opinions and data contained in all publications are solely those of the individual author(s) and contributor(s) and not of MDPI and/or the editor(s). MDPI and/or the editor(s) disclaim responsibility for any injury to people or property resulting from any ideas, methods, instructions or products referred to in the content.

