Article

Genome Polymorphism Analysis and Selected Sweep Regions Detection via the Genome Resequencing of 91 Cabbage (Brassica oleracea) Accessions

1
Faculty of Life Science, Tangshan Normal University, Tangshan 063000, China
2
Tangshan Key Laboratory of Cruciferous Vegetable Genetics and Breeding, Tangshan 063000, China
3
Faculty of Plantation and Agrotechnology, Universiti Teknologi MARA, Jasin Campus, Merlimau 77300, Melaka, Malaysia
*
Authors to whom correspondence should be addressed.
Horticulturae 2023, 9(2), 283; https://doi.org/10.3390/horticulturae9020283
Submission received: 20 January 2023 / Revised: 15 February 2023 / Accepted: 18 February 2023 / Published: 19 February 2023
(This article belongs to the Section Genetics, Genomics, Breeding, and Biotechnology (G2B2))

Abstract

:
The completion of more and more high-quality cabbage genome sequencing attempts provides an important reference genome sequence for resequencing a large proportion of B. oleracea populations. This has laid a foundation for the study of the population diversity of B. oleracea and the excavation of genes related to important agronomic traits. Here, we performed genome resequencing of 91 B. oleracea accessions from 14 countries. We produced a total of 983.84 Gb of high-quality sequencing data, and the average sequencing depth of the genomes was over 15.71 among the 91 accessions. A total of 3,432,341 high-quality SNPs were detected in these B. oleracea accessions. A phylogenetic tree indicated that the leaf ball shapes of “Gaobian” accessions and most “Jianqiu” accessions converge with “Bianqiu” accessions, while “Yuanqiu” accessions were individually assigned to a branch. The principal component analysis (PCA) result was consistent with the phylogenetic relationships. The LD distance of “Yuanqiu” was 38.69 Kb, while that of “Bianqiu” was 30.16 Kb. This result indicated that the linkage degree of the “Yuanqiu” population is greater than that of the “Bianqiu” population, which may indicate that the “Yuanqiu” population has received more positive selection. Our analysis showed that, for the 91 accessions, the best population structure number was four. A total of 560 genes were identified across the 203 selected sweep regions identified in the “Yuanqiu” accessions. Similarly, 682 genes were identified across the 304 selective sweep regions in the “Bianqiu” accessions. Finally, several functional terms were identified via enrichment analysis of the genes in the selective sweep regions. In conclusion, this study will provide rich resources for studies on gene function related to leaf ball development and the population diversity of B. olearcea.

1. Introduction

Vegetable germplasm resource is the basis of vegetable heredity and breeding and is also the material basis for further improving varieties and breeding new varieties [1,2]. Therefore, countries all over the world attach great importance to the collection, preservation, and identification of germplasm resources. Cabbage (Brassica oleracea), originating from the Mediterranean to the North Sea coast, is a vegetable widely planted around the world which has important economic value and edible value [3]. Germplasm resources are the basis for breeding new varieties [4]. Without enough germplasm resources, a breeder could not cultivate good, new varieties or broaden the genetic diversity of resources [5]. B. oleracea germplasm resources are a component of vegetable germplasm resources. From the total amount of B. oleracea resources collected, it has been unable to meet the needs of a variety of breeding objectives until now. Therefore, we should pay attention to the investigation, introduction, collection, and preservation of B. oleracea germplasm resources, and conduct in-depth identification of the collected and preserved germplasm resources, so as to find new excellent raw materials and provide useful information and a scientific basis for breeding new varieties. It is of great significance to introduce new varieties and new germplasm resources.
Single nucleotide polymorphism (SNP) refers to the mutation of alleles, including single base transition, transversion, insertion, and deletion [6]. SNP is the most abundant genetic variation in the genome, present throughout almost the entire genome [7]. The distribution of SNPs in a single gene or the whole genome is also uneven [8,9]. The SNPs in the non-transcriptional region sequence are more frequent than those in the transcriptional region sequence, and synonymous mutations are more frequent in the transcriptional region than non-synonymous mutations [9]. With the completion of large-scale genome resequencing projects, a large amount of SNP data has been generated in many species. SNPs are widely used, such as in genetic maps for the identification of disease resistance genes, the study of evolution and population diversity, and the association analysis of complex traits [10,11,12]. Thus, SNP, as a new genetic strategy and research tool, can not only greatly accelerate research on genomes, but also bring great changes to all biological research.
With the completion of genome sequencing projects for more and more species, important reference genome sequences are provided for genome resequencing. With the completion of the genome sequence of Brassica carinata, all the genomes representing the six Brassica species of the U’triangle have now been resolved [13]. As a U’triangle species, several B. oleracea genomes have been sequenced prior to this study, providing important reference sequences (varieties such as capitata, italica, oleracea, and botrytis) for performing B. oleracea genome resequencing [3,14,15,16,17,18,19]. In this study, the population evolutionary relationships of 91 B. oleracea materials were explored through the development of SNP markers. At the same time, we expected to construct a comprehensive map of genetic variation for the B. oleracea genome. This map was used to analyze the differentiation, origin, and evolution of B. oleracea ecotypes. This study will provide reference for the selection of parents in the utilization of B. oleracea heterosis. Meanwhile, this study also provides legal protection and scientific basis for variety registration, the protection of variety rights, and safeguarding farmers’ interests.

2. Materials and Methods

2.1. Material Culture and DNA Extraction

First, all 91 pieces of B. oleracea material were seeded in a laboratory tray, and then grew under normal temperature, humidity, and light conditions. We took 3–5 tender leaves at the seedling stage, and extracted the DNA from the leaves via the CTAB (cetyltrimethylammonium bromide) method [20]. Agarose gel electrophoresis was used to analyze the degree of DNA degradation and whether there were heterobands or RNA and protein contamination. A Qubit 3.0 Fluorometer was used to accurately quantify the DNA concentration.

2.2. Database Building and Sequencing

The qualified DNA samples were randomly interrupted by a Covaris crusher with a growth of 350 bp. A TruSeq Library Construction Kit was used to build the library. The whole library was prepared through end repair, the addition of a ployA tail, the addition of a sequencing connector, purification, PCR amplification, and so on. After the construction of the library, we used Qubit3.0 for preliminary quantification and diluted the library to 1 ng/μL. Subsequently, Agilent 2100 was used to detect the insert size of the library. After the insert size met the expectation, qRT-PCR was used to accurately quantify the effective concentration of the library (the effective concentration of library was >2 nM) to ensure the quality of the library. The constructed library used Hiseq X Ten (Illumina, CA, USA) for pair ended sequencing, with a reading length of 150 bp. Relevant sequencing was entrusted to Beijing Novogene Corporation.

2.3. Processing and Evaluation of Sequencing Data

The original image data obtained via sequencing was converted into sequence data by base calling, which is called raw data or raw reads, and the results were stored in the fastq file format. However, after filtering out the connector information, low-quality bases, and undetected bases (N), the final data are called clean data or clean reads. The original data filtering method is detailed below, as referenced in the previous reports [21,22].
(i) The reads containing the connector sequence should be filtered out; (ii) when the content of N in the single-end sequencing read exceeds 10% of the length ratio of the read, this pair of paired reads needs to be removed; (iii) when a base number of low-quality (≤5) alkali contained in the single-ended sequencing read exceeds 50% of the length ratio of the read, this pair of paired reads needs to be removed. The filtered sequencing data is then counted, including sequencing data output, sequencing error rate, Q20 content, Q30 content, and GC content.

2.4. Genomic SNP Detection, Filtering and Annotation

We download the genome sequence of B. oleracea JZS 2.0 as the reference genome for subsequent analysis from the TBGR database [18,23]. Next, we used the Burrows Wheeler Alignment software (BWA, v0.7.5a-r405) (parameter: mem-t 4-k 32-M) to compare 91 B. oleracea sequencing data to the reference genome [24]. The results of the comparison were obtained via deleted duplication by SAMTOOLS (parameter: rmdup), and the unique comparison data were retained for the next step: genome variation detection [25]. Finally, we used SAMTOOLS and other software to detect SNP in 91 samples of B. oleracea [25]. Bayesian model was used to detect the polymorphic sites in the genome of B. oleracea population. High-quality SNPs were obtained via filtering and screening, and the filtering conditions were dp2-miss0.2-maf0.05, in accordance with the previous report [26].
Based on the chromosome, start site, stop site, reference nucleotide, and variant nucleotide where a SNP is located, we used ANNOVAR to produce gene-based annotations, region-based annotations, filter-based annotations, and other functionalities [27].

2.5. Population Evolution Analysis

The SNPs obtained from different B. oleracea individuals were used for population evolution analysis. The distance matrix was calculated with Treebest-1.9.2 software to obtain the genetic distance between different B. oleracea samples [28]. On this basis, the phylogenetic tree was constructed by the neighbor joining method, and the bootstrap values were set to 1000. The software EIGENSOFT was used for population principal component analysis (PCA) [29]. The PLINK program was used to analyze population structure [30]. First, we created the input PLINK-Ped file, and then we used frappe software to build population genetic structure and population lineage information.

2.6. Population Selection Analysis and Gene Function Enrichment Analysis

Based on SNP data, PopLDdecal software was used for calculating the genome-wide average r2 between two SNPs [31]. VCFtools was used to calculate the π and Fst values of the population, and then the ggplot2 (https://github.com/tidyverse/ggplot2) (accessed on 3 May 2022) of R program was used to plot [32]. π represents nucleotide diversity, where the larger the value, the higher the nucleotide diversity. Meanwhile, the higher the degree of selection, the lower the polymorphism [33,34]. Fst stands for differentiation coefficient, where a value between 0 and 1 indicates that the genetic relationship is becoming more distant [35]. Fst and θπ have been proven to form a very effective method to detect the selective elimination region, especially when mining the functional areas closely related to the living environment, as a strong selection signal can often be obtained [36,37,38]. Both of them can screen strong selection signals to facilitate the screening of target genes. Finally, a GO annotation was performed on the target genes using the GOseq of R package [39]. Furthermore, Kyoto Encyclopedia of Genes and Genomes (KEGG) pathway enrichment analysis was performed using the KOBAS program in accordance with previous reports [40,41]. Terms with a p-value of <0.01 were thought to be significantly enriched for the genes in the selected sweep regions, and the p-values were further corrected by Bonferroni [42].

3. Results and Discussion

3.1. Sequencing Data Statistics and Quality Evaluation

In order to reveal the genetic diversity of B. oleracea as comprehensively as possible, we collected 91 samples of B. oleracea from 14 countries, including from the main B. oleracea-producing areas in the world, and re-sequenced their entire genomes (Table S1). The total original sequencing data amounted to 996.74 Gb, and the filtered clean data of high quality totaled 983.84 Gb (Table S2). Further statistics on the 91 B. oleracea output data showed that the average effective rate was 98.71% and the error rate was 0.03%. Q20 ≥ 96.05% and Q30 ≥ 89.94%, indicating that the sequencing quality was high (Table S2). The average GC content was 37.64%. Our analysis showed that none of the 91 samples were polluted, and all can therefore be used for subsequent analysis.

3.2. Resequencing Data Were Mapped with Reference Genome

We selected a high-quality and high-chromosomal level B. oleracea genome for mapping: Brassica oleracea var. capitata (JZS.v2.0). The size of this genome was 561,157,886 bp, and it contained 59,064 protein-coding genes. The average mapping rate of the 91 B. oleracea samples was 98.03%, while the average sequencing depth of the genome (excluding gap region) was 15.71 (Table S3). The average coverage was 91.76% (at least one base was covered). The mapping results of each sample showed that their similarity with the reference genome met the requirements of resequencing analysis and had good coverage depth.

3.3. SNP Detection and Annotation

SNP (single nucleotide polymorphism) mainly refers to the DNA sequence polymorphism caused by the variation of a single nucleotide at the genome level, including the conversion and transversion of a single base. In this study, 8,317,406 SNPs were initially detected in the 91 B. oleracea samples. Through further screening of factors such as coverage depth, deletion rate, and minimum allele frequency (MAF), 3,432,341 high-quality SNPs were finally obtained after a serial filtering.
We further calculated the distribution of these 3,432,341 high-quality SNPs on the B. oleracea genome. The results showed that of the largest number the SNPs (1,933,643, 56.34%) were located in the intergenic region, accounting for more than half, followed by the exonic region (13.29%) and the intronic region (12.97%) (Table S4). In addition, we also produced statistics on SNP types and found that 2,039,311 (59.41%) SNPs belonged to transitions (ts), and 1,393,030 (40.59%) SNPs belonged to transitions (tv) (Table S4). The transition/transversion ratio can be used to measure genetic distances. Generally, the higher the transition/transversion ratio, the lower the genetic divergence between two species [43]. In this study, the ratio of Ts/Tv was relatively high, and reached 1.463, explaining the relatively low level of polymorphisms between different B. oleracea accession.

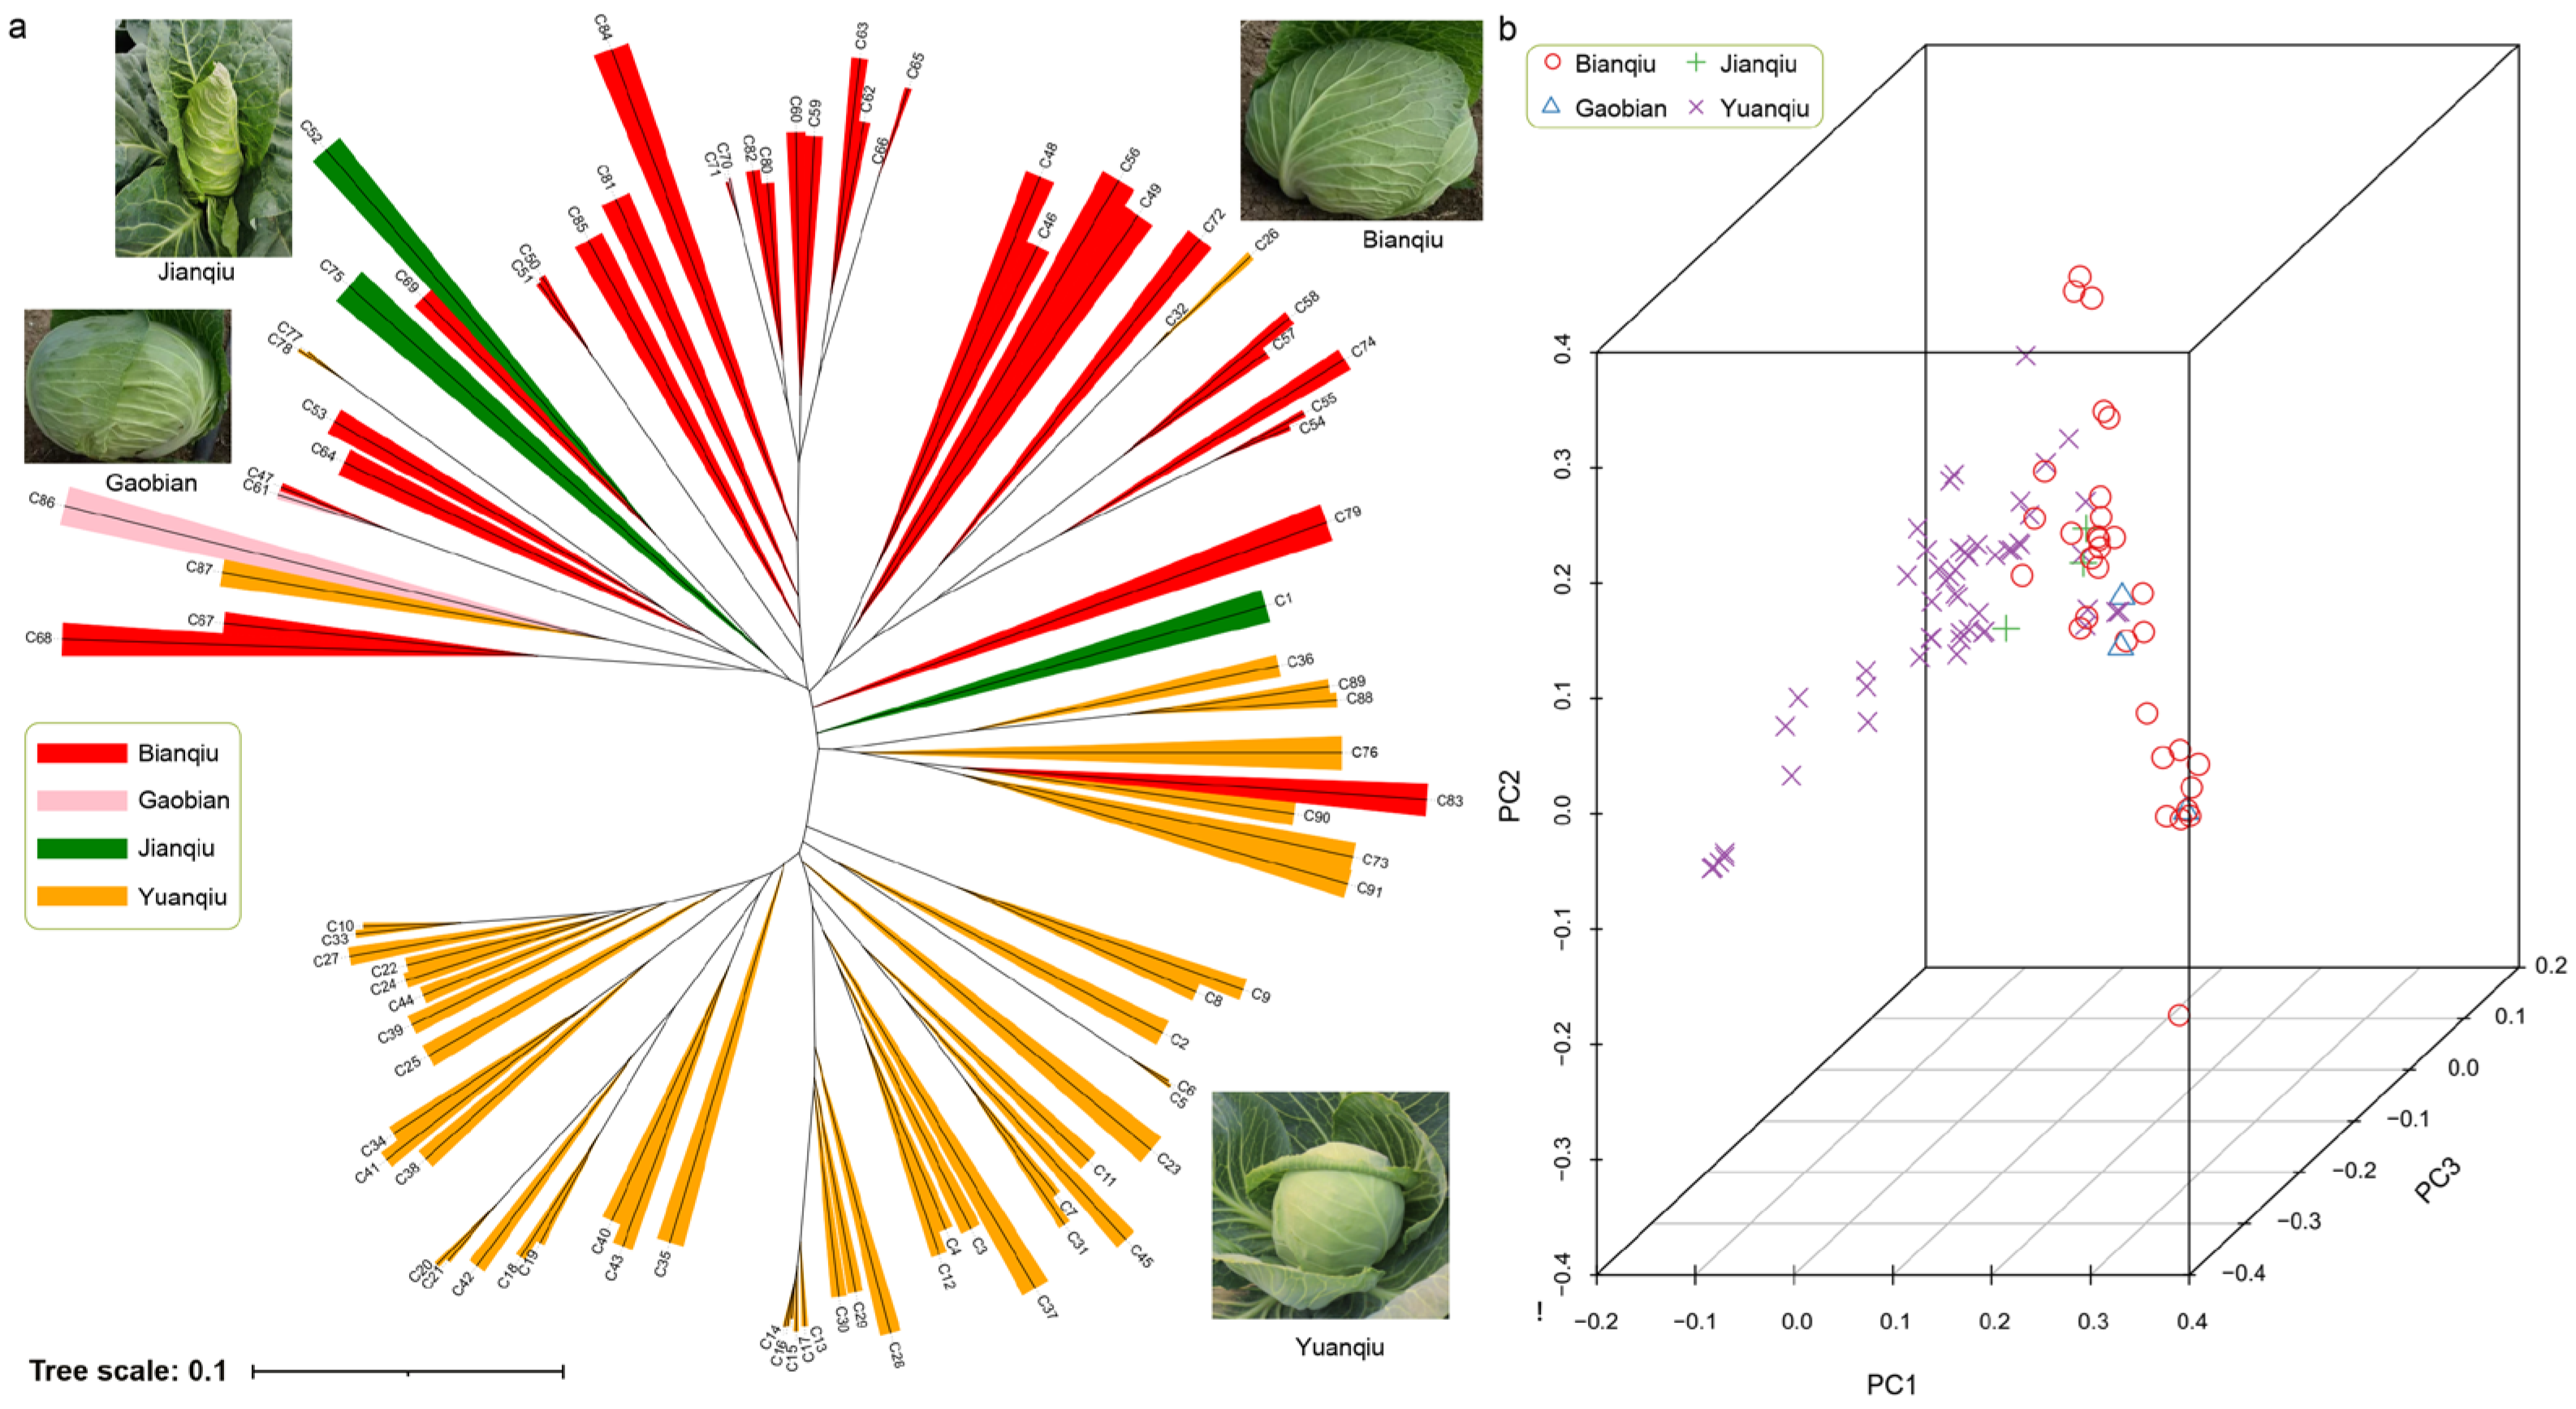
3.4. Population Evolution and Principal Component Analysis

A phylogenetic tree is a branch graph or tree that describes the order of differentiation between populations, which is used to represent the evolutionary relationships between populations [44,45]. According to the similarities or differences in physical or genetic characteristics of the populations, we can infer their genetic relationship. In this study, 91 B. oleracea materials were re-sequenced to obtain high-quality SNP data, and a phylogenetic tree was constructed based on the neighbor-joining method (Figure 1a). The tree topology structure directly showed the relationship between different accessions of B. oleracea.
According to the leaf ball shape, the 91 B. oleracea accessions were mainly divided into four categories; namely “Bianqiu”, “Jianqiu”, “Gaobian” and “Yuanqiu”. Among them, fifty-three were “Yuanqiu”, thirty-two were “Bianqiu”, three were “Jianqiu” and three were “Gaobian”. The B. oleracea leaf ball shape features were displayed on the evolutionary tree using different color markers (Figure 1a): red for “Bianqiu”, pink for “Gaobian”, green for “Jianqiu”, and yellow for “Yuanqiu”. It can be seen in the phylogenetic tree that three “Gaobian” accessions (C61, C70, C86) and two “Jianqiu” accessions (C52, C75) converge with “Bianqiu” accessions. One “Jianqiu” accession (C1) is between “Bianqiu” and “Yuanqiu” accessions. Most “Bianqiu” and “Yuanqiu” accessions can be obviously divided into two groups. However, some accessions have exceptions; for example, “Bianqiu” C83 and “Yuanqiu” cluster together, while “Yuanqiu” C26, C77, C78, and C87 and “Bianqiu” cluster together.
Based on the obtained high-quality SNPs, we further conducted PCA on 91 materials (Figure 1b). PCA can cluster individuals into different subgroups according to their principal components and traits. The PCA results were basically consistent with the above phylogenetic relationships.

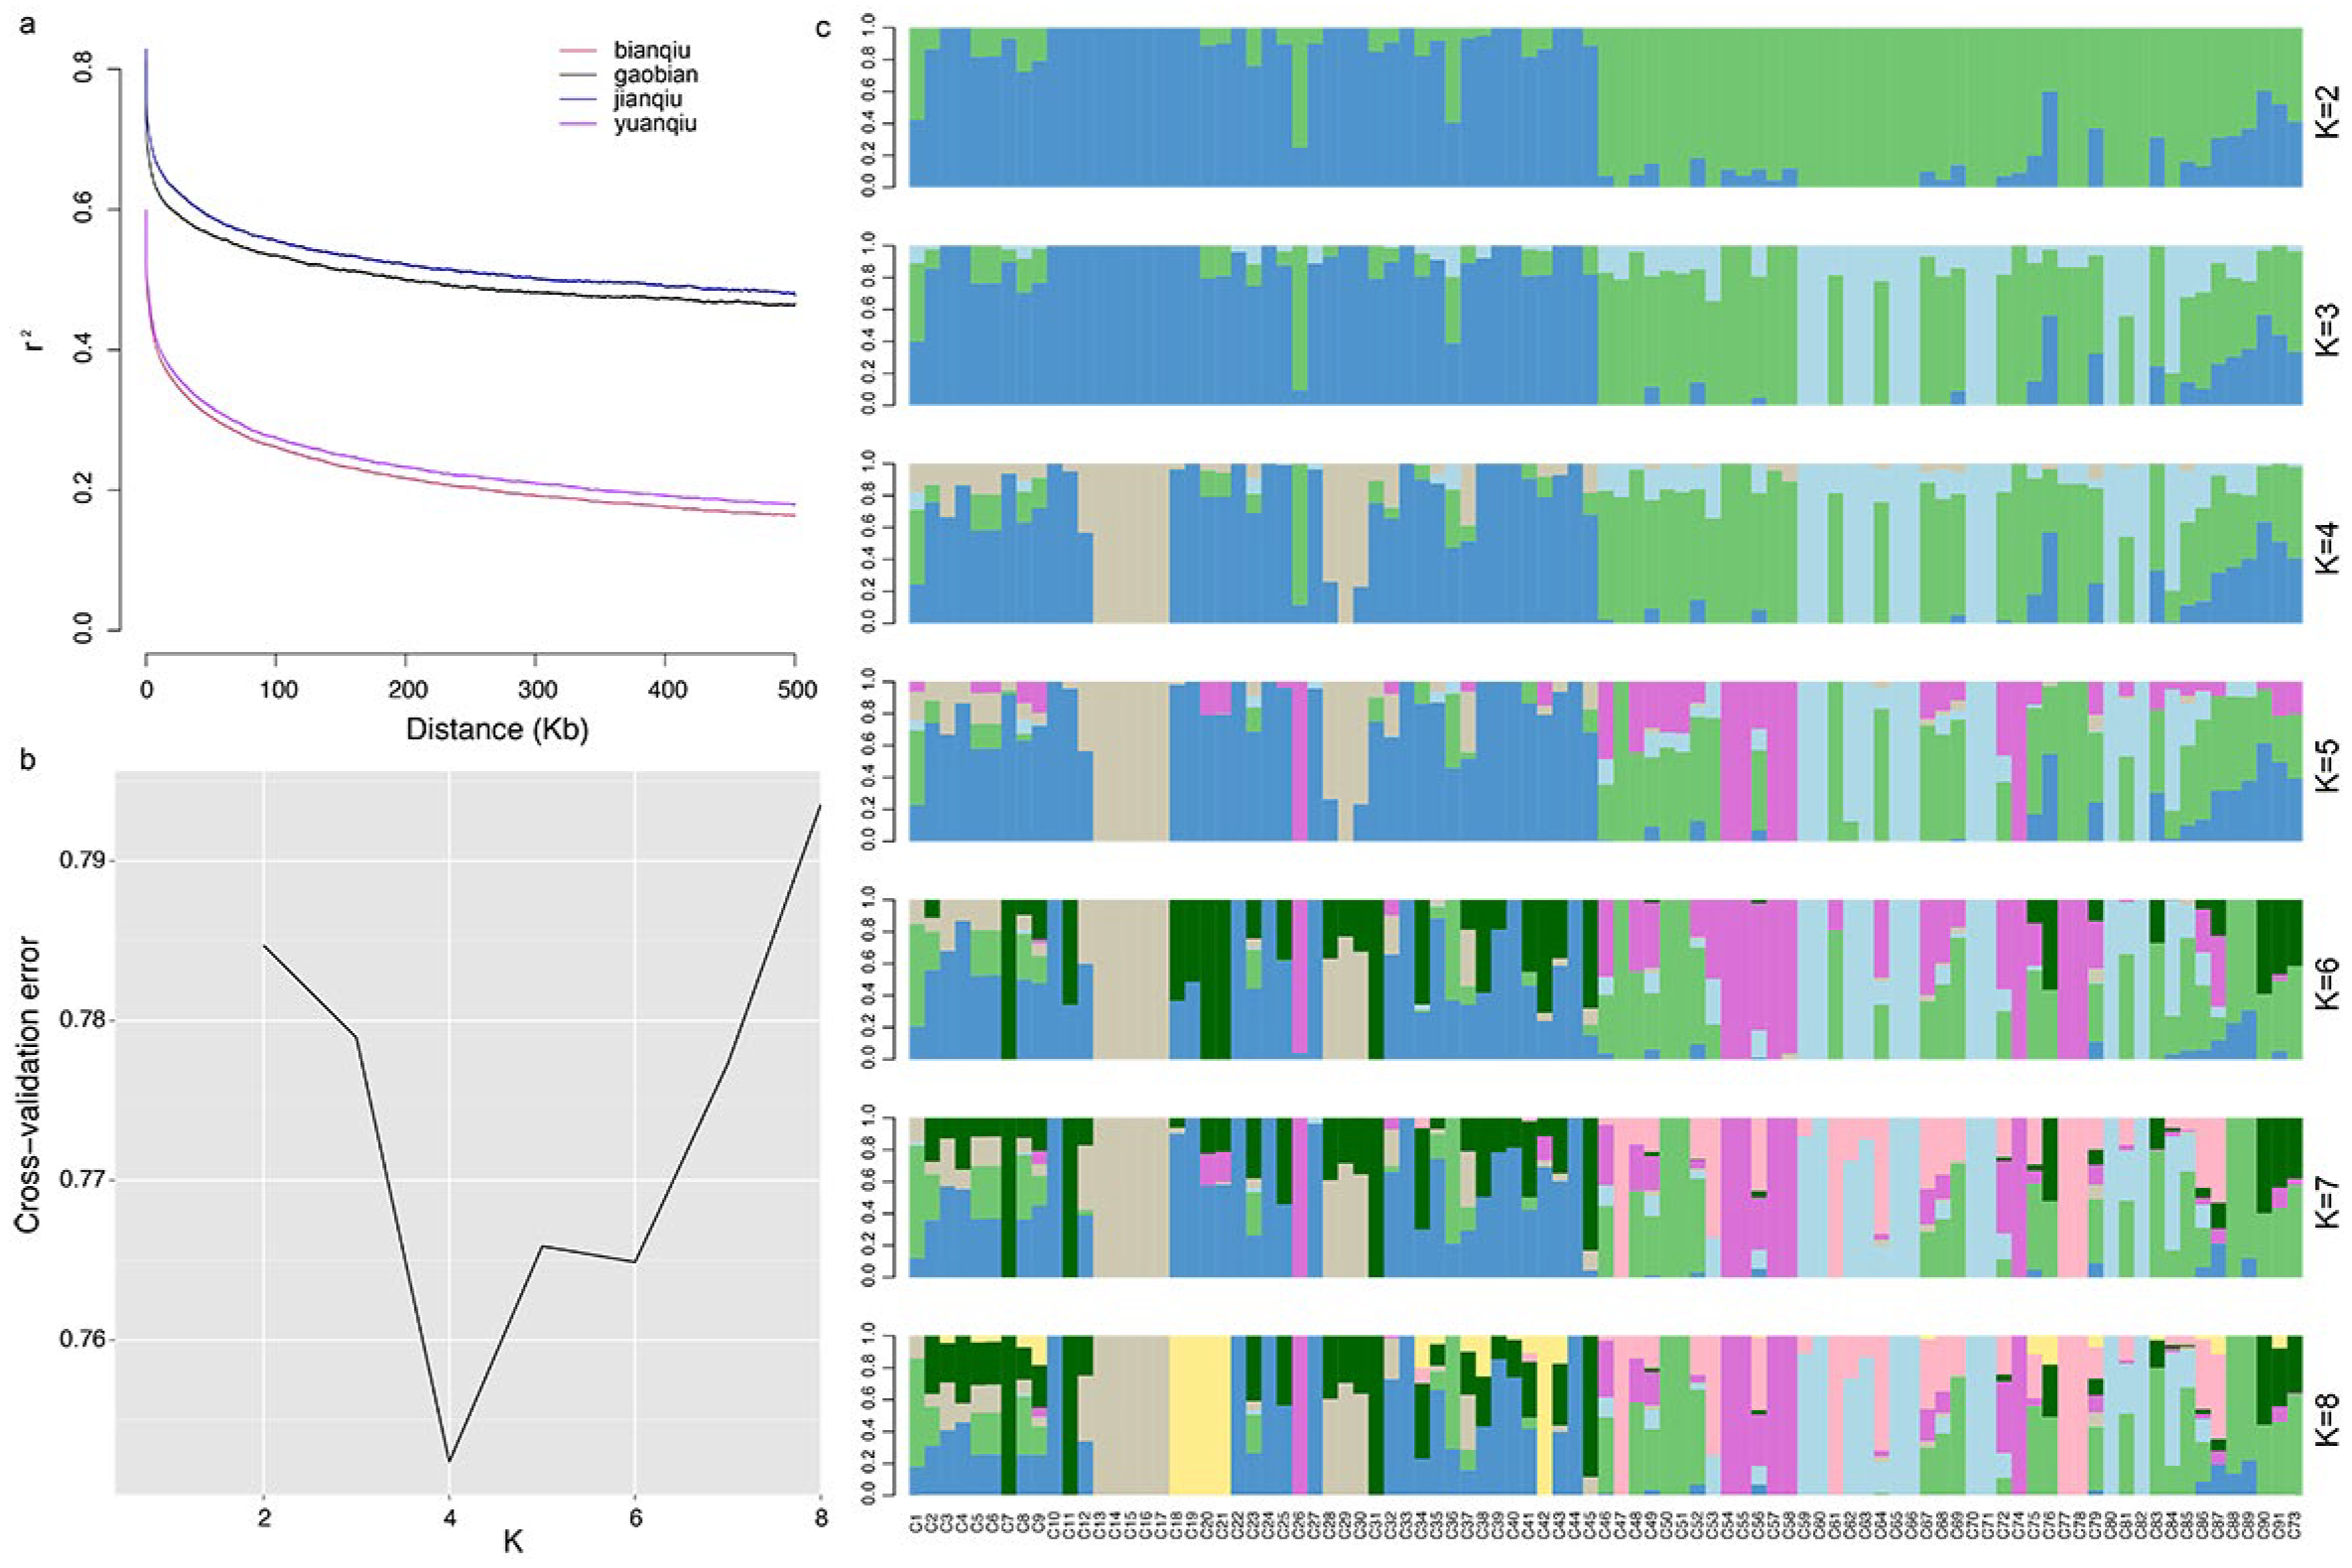
3.5. Linkage Disequilibrium Analysis

Linkage disequilibrium (LD) refers to the relationship between non-random combinations of alleles at different loci in a population [46]. That is, when the probability of simultaneous existence of two alleles (A, B) on the same chromosome is greater than the probability of simultaneous occurrence of random distribution in the population, the two points are said to be in an LD state [46,47]. LD is usually represented by r2, and the population LD attenuation distance usually refers to the corresponding physical distance when the average LD coefficient r2 value decays to half of the maximum value [46]. Generally speaking, the LD value of wild species is low, while the LD value of domesticated species will be higher due to positive selection [48,49]. The LD of cross-pollinated plants decreased faster than that of self-pollinated plants [49].
In this study, we detected LD in the B. oleracea populations of four types of leaf ball shape based on SNP data. The results showed that the LD values of the “Jianqiu” and “Gaobian” populations were much higher than those of the “Bianqiu” and “Yuanqiu” populations (Figure 2a). This may be due to the small number of samples in the “Jianqiu” and “Gaobian” populations, resulting in the large LD values. Since the population samples of these two leaf ball types are too few to reflect the true population’s LD values, we focused on the LD values of the “Bianqiu” and “Yuanqiu” populations in this study. It was found that the LD attenuation distance of “Yuanqiu” was 38.69 Kb, while that of “Bianqiu” was 30.16 Kb (Figure 2a). We found that although the sample size of “Yuanqiu” (53 samples) was larger than that of “Bianqiu” (32 samples), the LD value of “Yuanqiu” is still larger than that of “Bianqiu”, which indicated that the linkage degree of the “Yuanqiu” population was greater than that of the “Bianqiu” population, and it may be that “Yuanqiu” population has received more positive selection in the evolutionary process.

3.6. Analysis of Population Genetic Structure

Population genetic structure refers to a non-random distribution of genetic variation in a species or population [50]. According to geographical distribution or other criteria, a population can be divided into several subgroups [51]. Different individuals in the same subgroup have a higher genetic relationship, while the relationship between subgroups is slightly more distant [52]. Population structure analysis is helpful for understanding the evolutionary process and can determine the subgroup of an individual through the associated study of genotype and phenotype [53].
Based on the high-quality SNP data obtained from resequencing, we analyzed the population structures of the 91 B. oleracea accessions. We performed the tests for the population structure numbers ranging from two to eight (Figure 2b,c). The results showed that the optimal population structure number of the 91 accessions was four (Figure 2b). This result shows more clearly the ancestral genetic components of different samples and the possible hybridization history (Figure 2c). It can also indirectly measure the heterozygosity or homozygosity of B. oleracea accessions. For example, C1 contains the genetic components of four populations, while C2, C5, and C6 samples contain the genetic components of three populations. The vast majority of B. oleracea accessions contain genetic components from one to three populations. The results provide important resources for better understanding and studying the genetic background of these B. oleracea accessions.

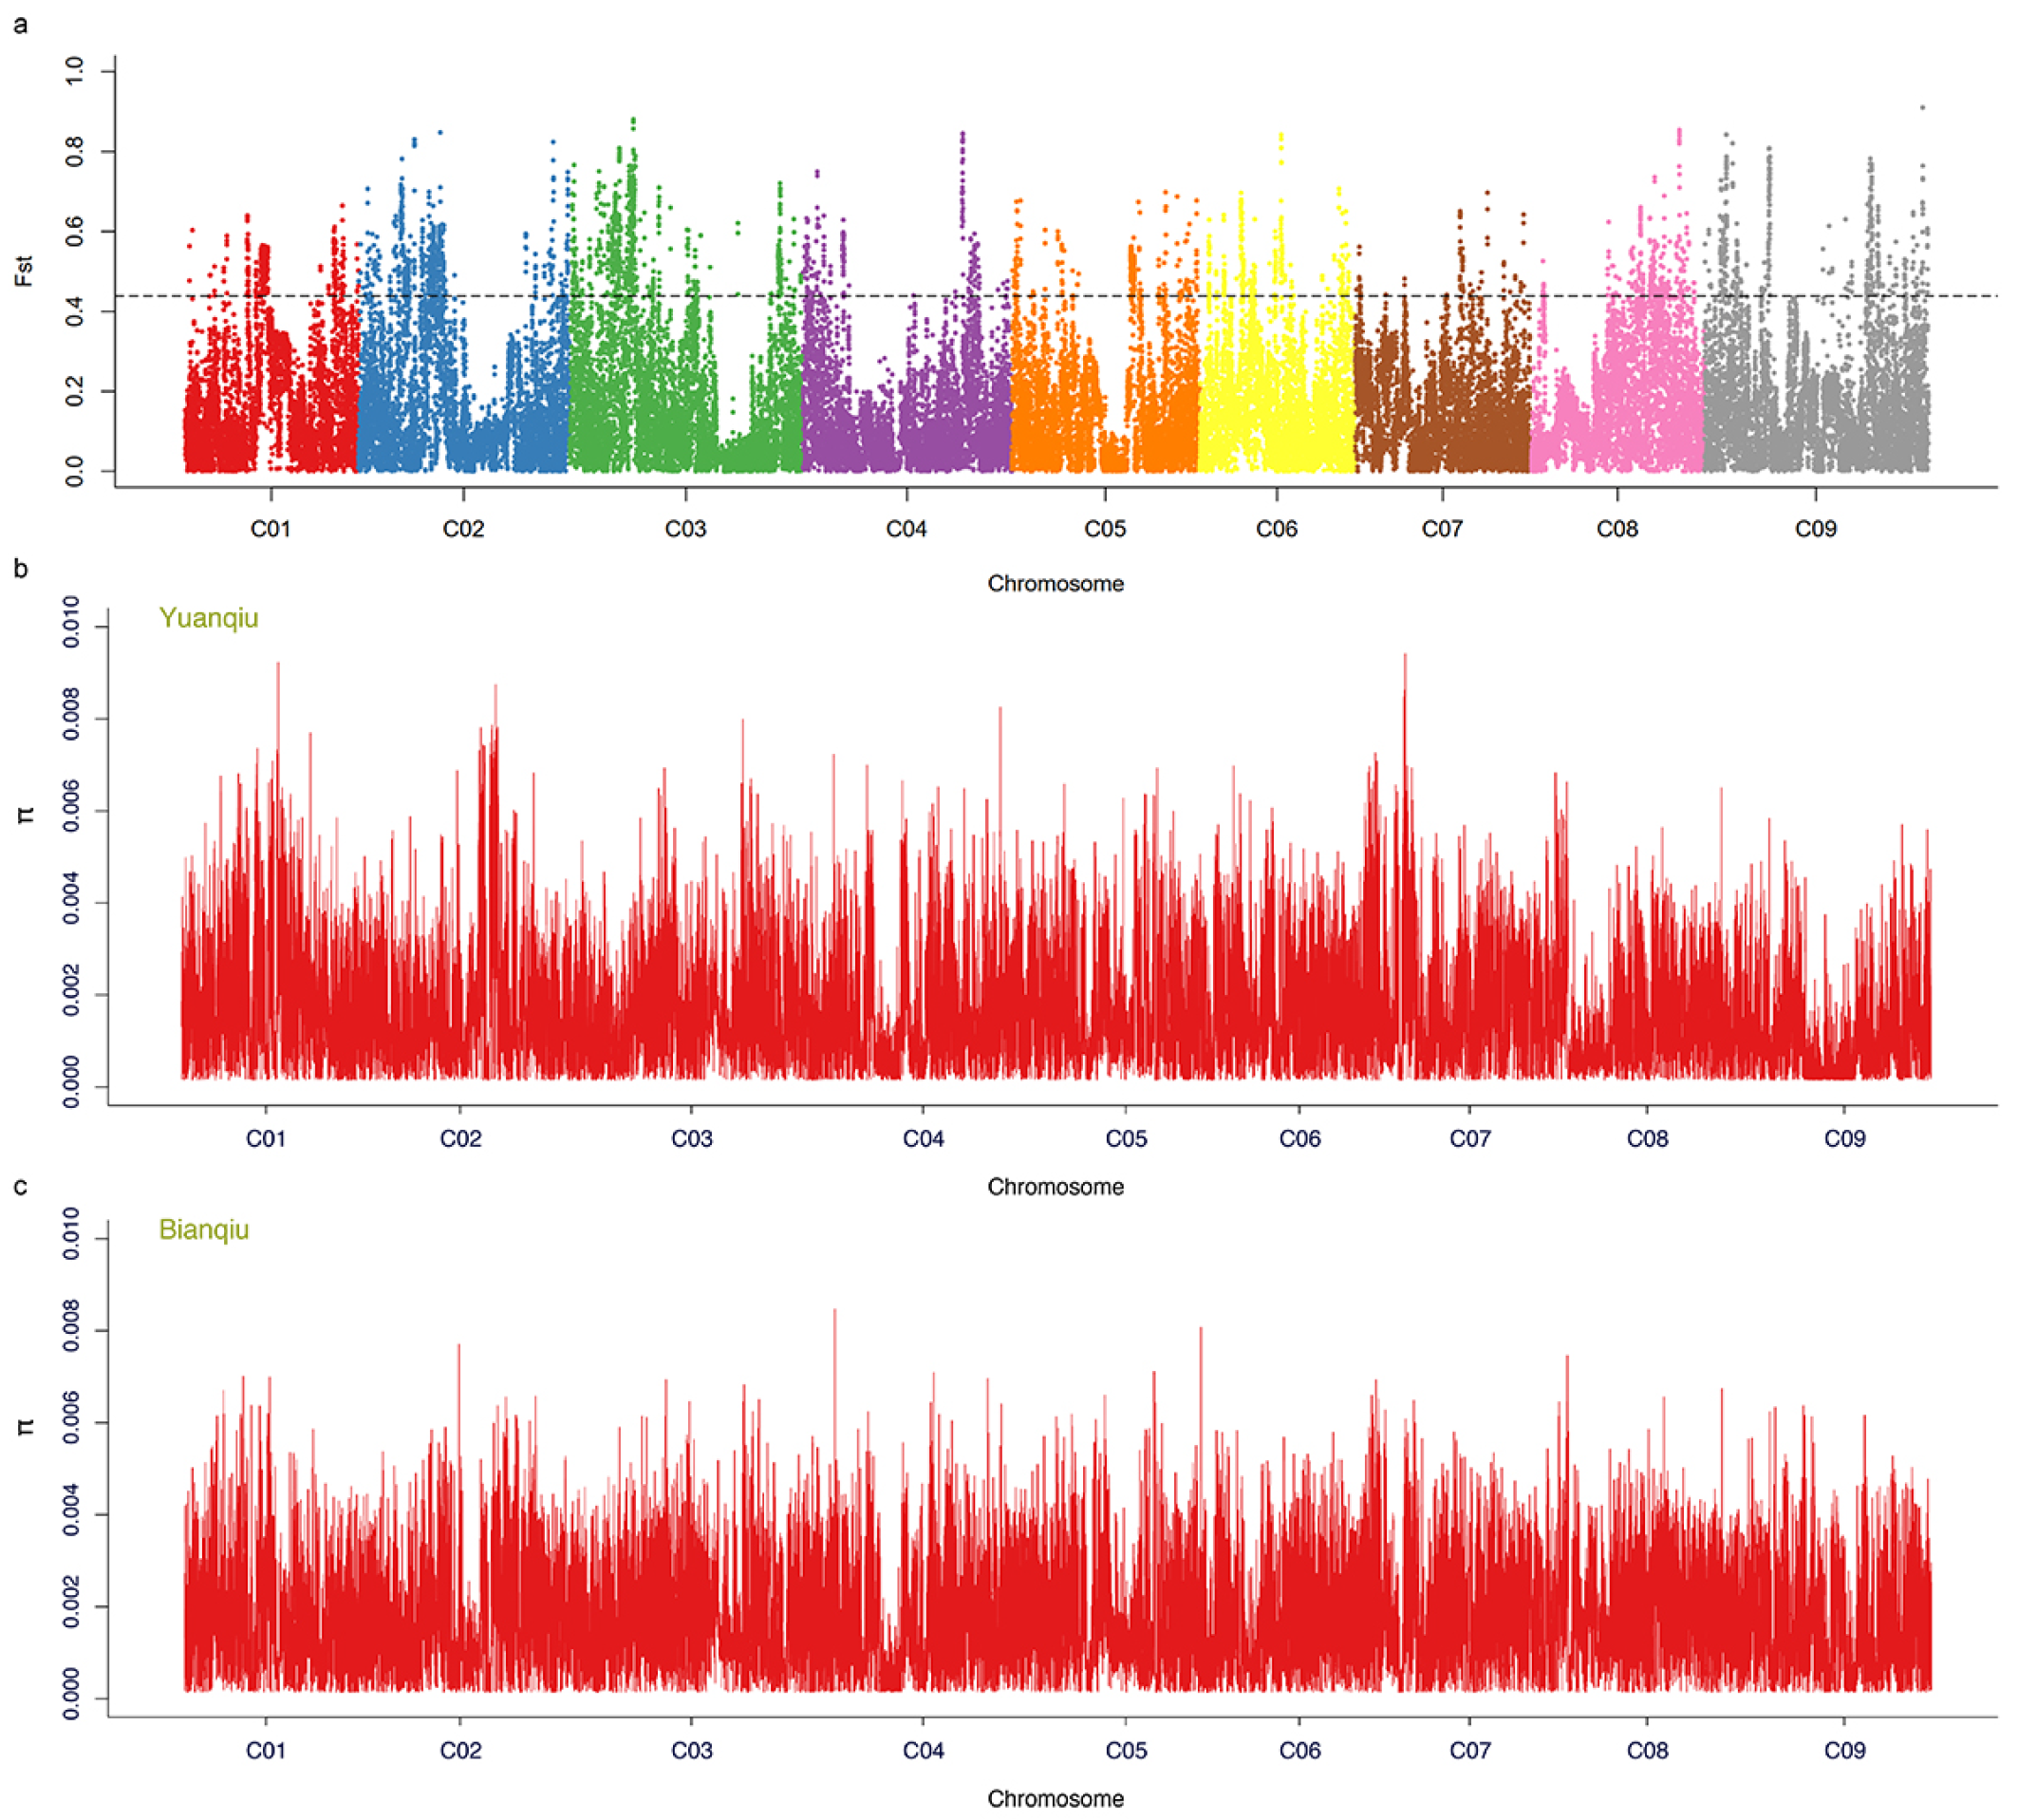
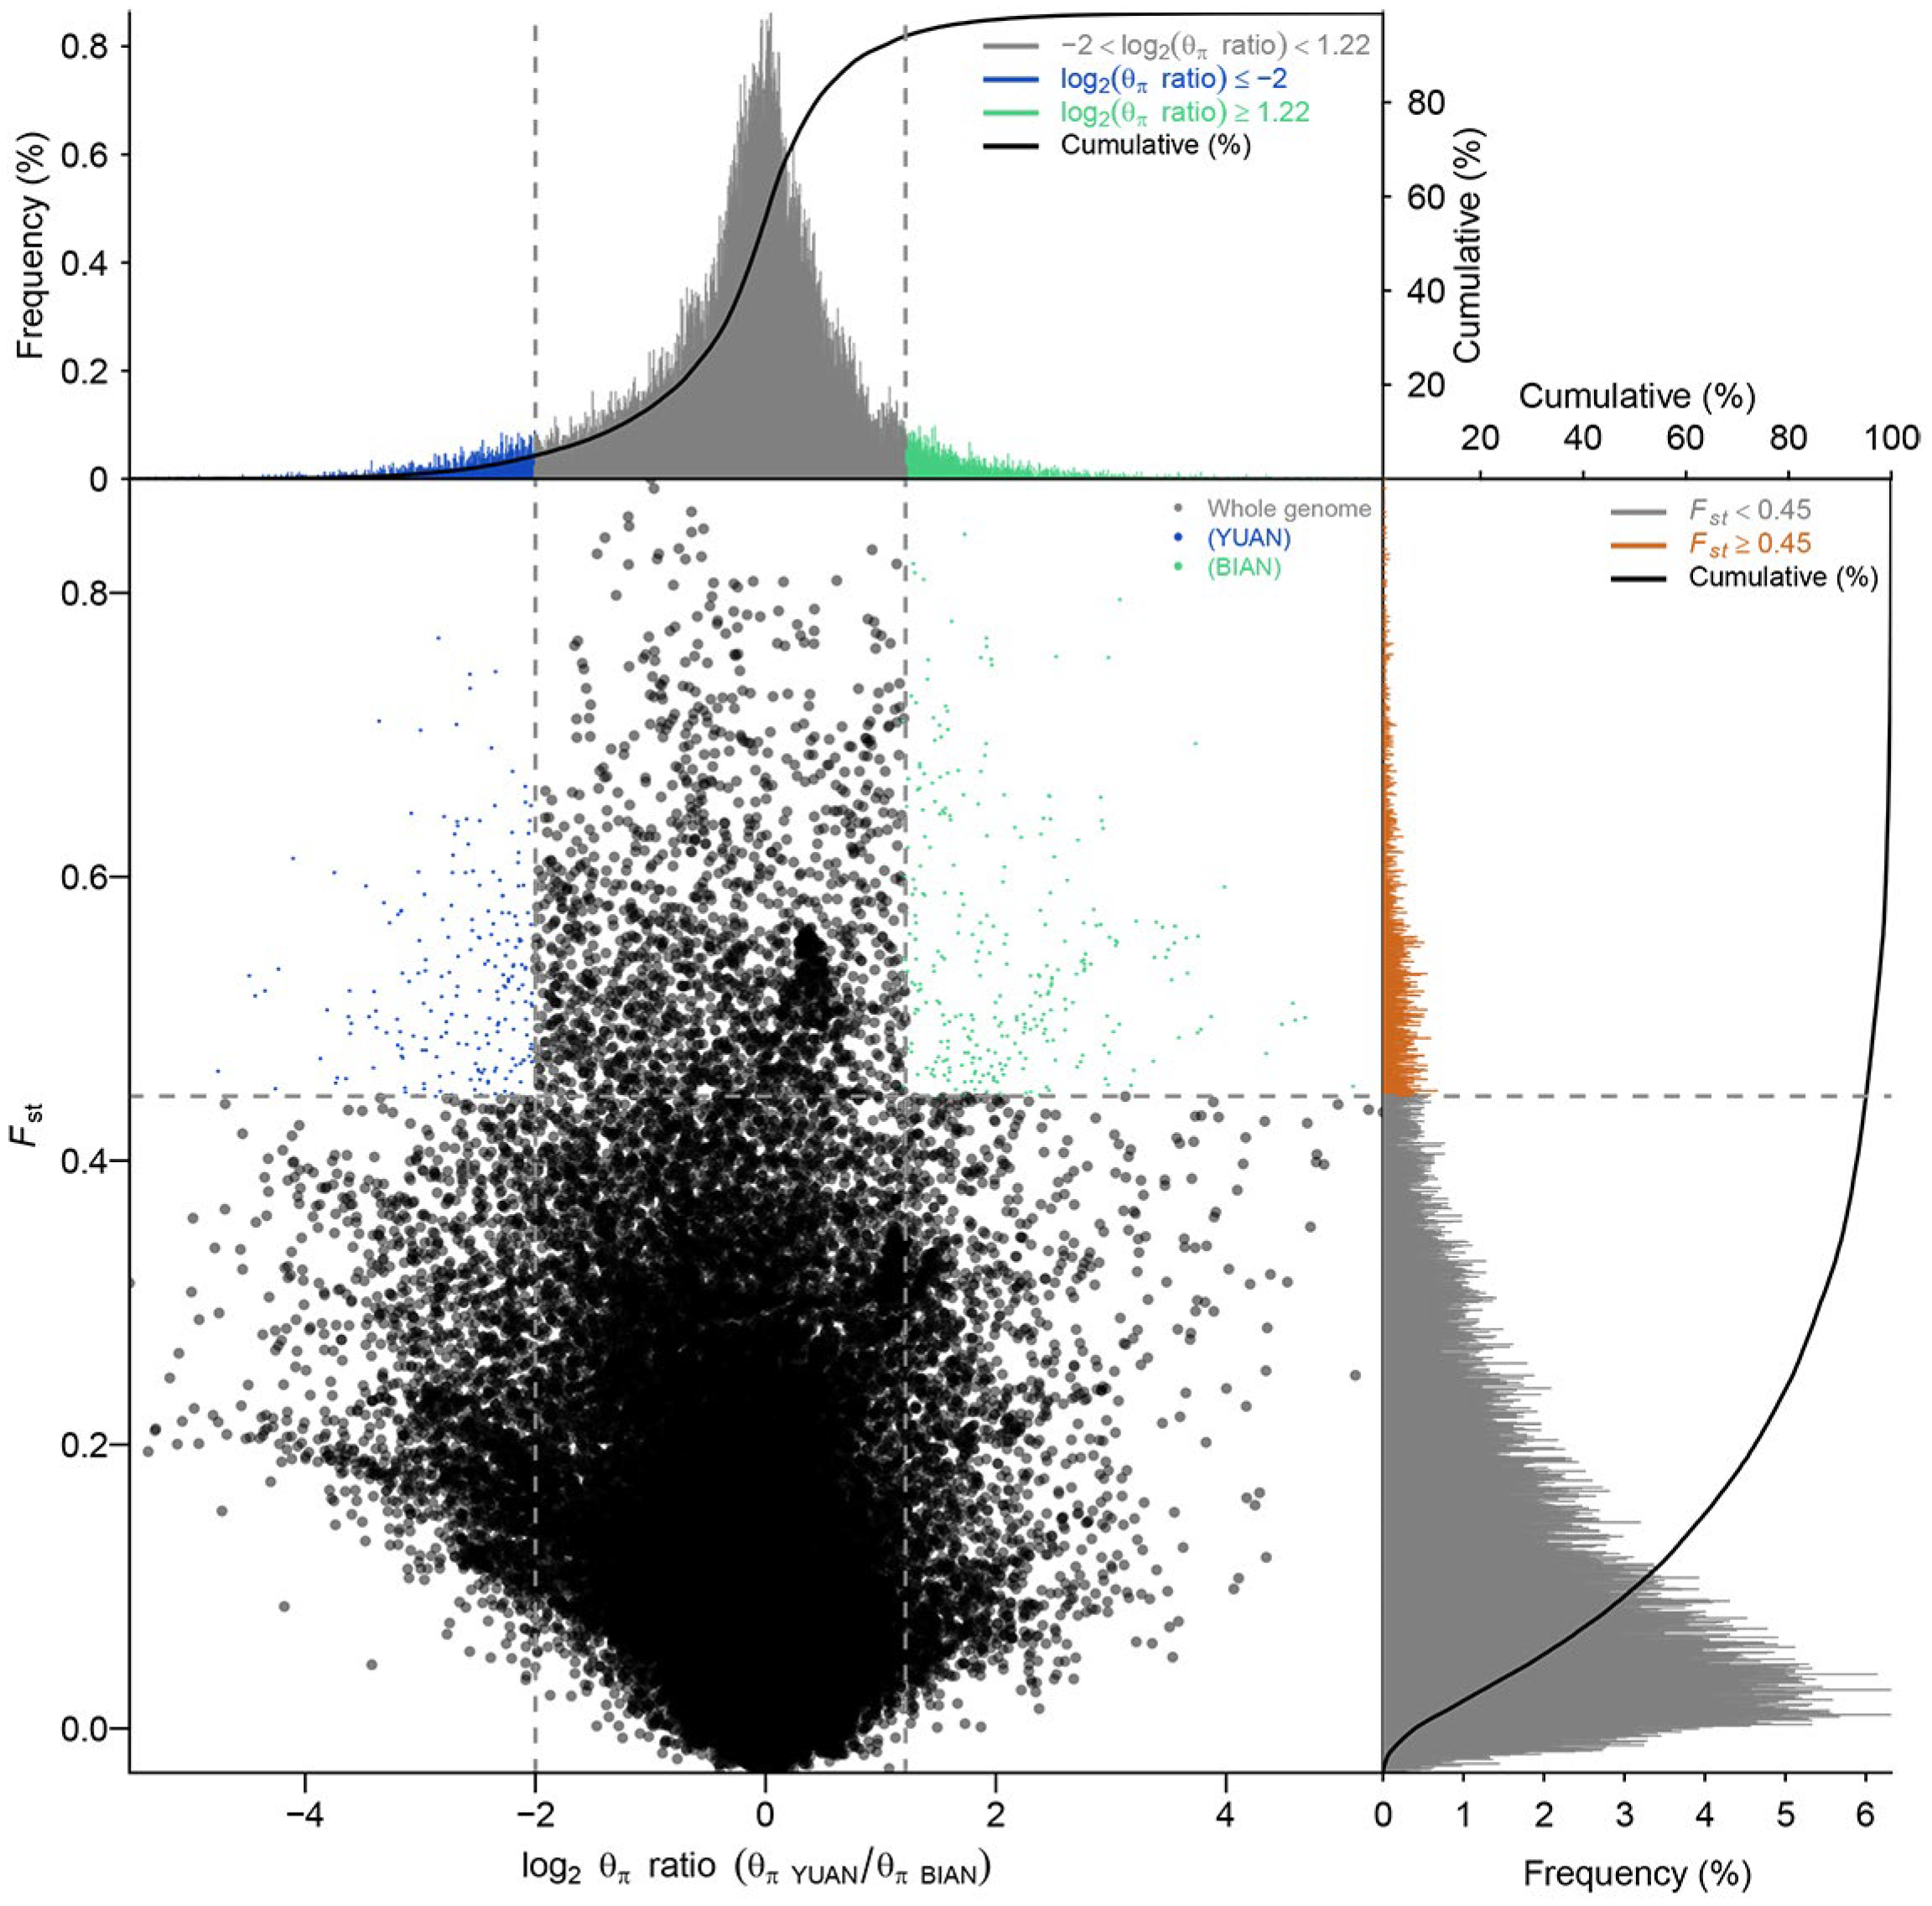
3.7. Selective Sweep Analysis

Fst reflects the level of population allele heterozygosity [54]. If an allele in a population undergoes adaptive selection because of its high fitness for a particular habitat, the increase in its frequency will increase the level of population differentiation, and there will be a higher Fst value [55]. The θπ value reflects the genomic base diversity of a population [56]. θπ analysis is used to analyze the differences in population genetic information (SNP) in the sliding window [52]. The smaller the θπ value is, the smaller the diversity of genomic bases which are likely to be in the selected region [57]. Integrating the Fst and θπ methods can effectively detect selective sweep regions and can then allow for the mining of candidate genes related to traits [36].
In this study, two methods (Fst and θπ) were used to analyze the selective sweep regions of two kinds of B. oleracea leaf balls (“Yuanqiu” and “Bianqiu”) with large numbers (Figure 3 and Figure 4). The region where the π ratio and Fst values were all in the top 5% was defined as the selection elimination region. In detail, the specific values were Fst ≥ 0.45 and log2(θπ ratio) ≥ 1.22 (Figure 4). There were 203 selected sweep regions identified in the “Yuanqiu” type of B. oleracea (Table S5). Among them, Chromosome 3 was the most frequent, reaching 71 regions, while Chromosome 6 was the least frequent, reaching only four regions. A total of 560 genes were identified in these selection sweep regions (Table S5). Similarly, 304 selective sweep regions were identified in the “Bianqiu” type (Table S6). Among them, Chromosome 6 was the most frequent, reaching 91 regions, followed by Chromosome 3 (68). A total of 682 genes were identified in these selection sweep regions in the “Bianqiu” type (Table S6).

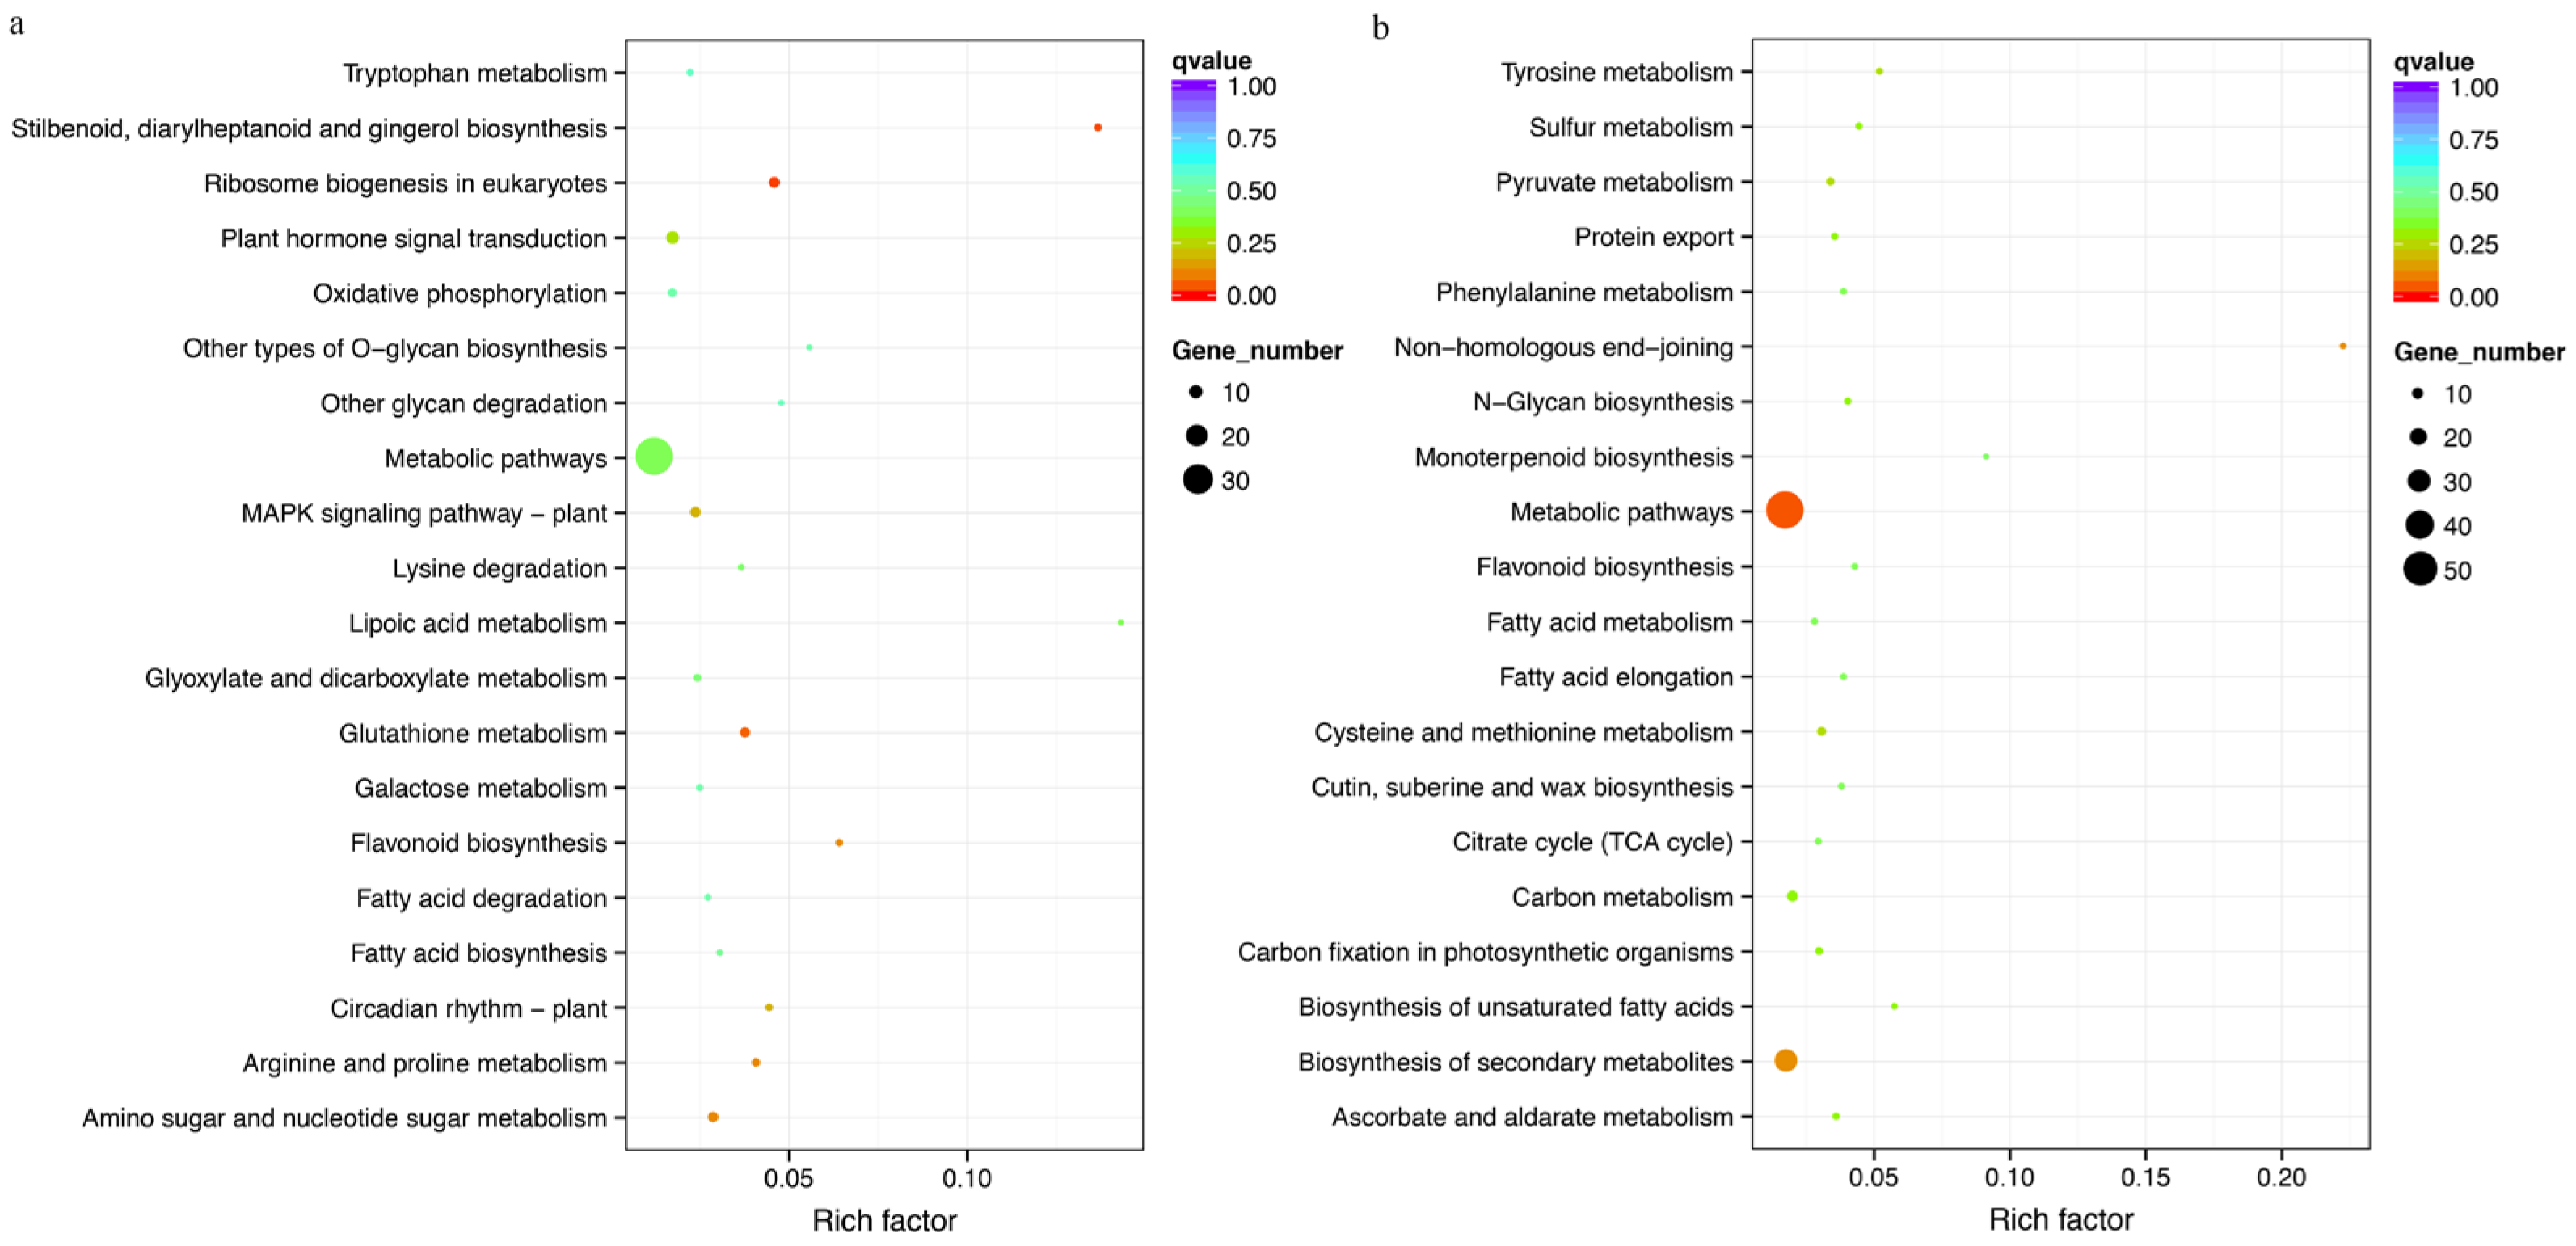
3.8. Gene Function Enrichment Analysis of Selection Sweep Regions

In order to better explore the molecular mechanism of B. oleracea leaf bulb character formation, we conducted functional enrichment analysis on the genes identified in the selection sweep regions.
The GO enrichment analysis showed that 44 GO functional items (p-value < 0.01) were significantly enriched in genes in the “Yuanqiu” selective sweep region (Table S7). Among the significantly enriched items, the most significant one was the successful transfer activity (GO: 0016748), followed by the cell wall macroporous metadata process (GO: 0044036). The genes in the “Bianqiu” selective sweep region were significantly enriched to 35 GO functional items (p-value < 0.01) (Table S8). Among the items with significant enrichment, the most significant term was the D-arabibino-1,4-lactone oxygen activity (GO: 0003885), followed by the oxidoreductase activity, acting on the CH-OH group of donors: oxygen as acceptor (GO: 0016899) and lyase activity (GO: 0016900).
Furthermore, we performed an KEGG enrichment analysis of genes identified in the selective sweep region. The genes in the “Yuanqiu” selection sweep region were significantly enriched to four functional items (p-value < 0.01) (Figure 5a, Table S9). Among the significantly enriched items, the most significant was ribosome biogenesis in eukaryotes, followed by ‘Stilbenoid, diarylheptanoid, and ginger biosynthesis,’ glutathione metropolis, and flavonoid biosynthesis. The genes in the “Bianqiu” selective sweep region were significantly enriched to three functional items (p-value < 0.01) (Figure 5b, Table S10). Among the items with significant enrichment, the most significant were the metallic pathways, followed by biosynthesis of secondary metals, and non-homologous end joining.
The genes contained in these enriched items may play a very important role in B. oleracea leaf ball development and character formation. In the future, these important functional genes can be further verified and analyzed using experimental techniques such as transgenic or gene editing, so as to further explore the key genes of B. oleracea leaf ball traits.

4. Conclusions

Here, we conducted a genome resequencing of 91 B. oleracea accessions from 14 countries in the world. A total of 3,432,341 high-quality SNPs were detected in these accessions by mapping with the reference genome. A phylogenetic tree showed that the leaf ball shapes of “Gaobian” accessions and most “Jianqiu” accessions converged with “Bianqiu” accessions, while “Yuanqiu” accessions were individually assigned to a branch. The PCA results were basically consistent with the phylogenetic relationships. The LD value of “Yuanqiu” was larger than that of “Bianqiu,” indicating that the linkage degree of the “Yuanqiu” population was greater than that of the “Bianqiu” population. Our analysis showed that the best population structure number for the 91 accessions was four. A total of 560 genes were identified across 203 selected sweep regions identified in the “Yuanqiu” type. Similarly, 682 genes were identified across 304 selective sweep regions in the “Bianqiu” type. Finally, several functional terms were identified via enrichment analysis of the genes in the selective sweep regions. This study will provide rich resources for studies on gene function related to leaf ball development and population diversity in B. olearcea.

Supplementary Materials

The following supporting information can be downloaded at: https://www.mdpi.com/article/10.3390/horticulturae9020283/s1, Table S1: Information of 91 Cabbage germplasm resources; Table S2: Sequencing data statistics of 91 Cabbage accessions; Table S3: Sequencing depth and coverage statistics of 91 cabbage accessions; Table S4: SNP detection statistics and annotation of 91 Cabbage accessions; Table S5: Identification of selected sweep regions (Yuanqiu selected) and related gene annotation information; Table S6: Identification of selected sweep regions (Bianqiu selected) and related gene annotation information; Table S7: GO enrichment analysis of Yuanqiu selected genes in the selected sweep regions (p-value < 0.01); Table S8: GO enrichment analysis of Bianqiu selected genes in the selected sweep regions (p-value < 0.01); Table S9: KEGG enrichment analysis of Yuanqiu selected genes in the selected sweep regions (p-value < 0.01); Table S10: KEGG enrichment analysis of Bianqiu selected genes in the selected sweep regions (p-value < 0.01).

Author Contributions

Q.L. conceived the project and was responsible for the project initiation. Q.L. and Y.C. supervised and managed the project and research. Experiments and analyses were designed by Q.L., G.Z. and Y.W. Data generation and bioinformatic analyses were led by Q.L., Y.Z., G.Z., L.G. and Y.W. The manuscript was organized, written, and revised by Q.L., Y.C. and S.A. All authors have read and agreed to the published version of the manuscript.

Funding

This research was funded by S&T Program of Hebei, grant number [21326341D], the Natural Science Foundation of Hebei, grant number [C2020105002], S&T Program of Tangshan, grant number [22130201H] and the Colleges and Universities in the Hebei Province Science and Technology Research Project, grant number [QN2020514].

Data Availability Statement

The datasets generated for this study can be found in the NCBI, Sequence Read Archive (BioProject: PRJNA936558).

Acknowledgments

The genome resequencing was conducted in the Novogene Corporation.

Conflicts of Interest

The authors declare no conflict of interest.

References

  1. Weng, Y. Inaugural Editorial: Vegetable Research. Veg. Res. 2021, 1, 1. [Google Scholar] [CrossRef]
  2. Yu, T.; Ma, X.; Liu, Z.; Feng, X.; Wang, Z.; Ren, J.; Cao, R.; Zhang, Y.; Nie, F.; Song, X. TVIR: A comprehensive vegetable information resource database for comparative and functional genomic studies. Hortic Res. 2022, 9, uhac213. [Google Scholar] [CrossRef]
  3. Liu, S.; Liu, Y.; Yang, X.; Tong, C.; Edwards, D.; Parkin, I.A.; Zhao, M.; Ma, J.; Yu, J.; Huang, S.; et al. The Brassica oleracea genome reveals the asymmetrical evolution of polyploid genomes. Nat. Commun. 2014, 5, 3930. [Google Scholar] [CrossRef] [Green Version]
  4. Yang, Y.; Sun, M.; Li, S.; Chen, Q.; Teixeira da Silva, J.A.; Wang, A.; Yu, X.; Wang, L. Germplasm resources and genetic breeding of Paeonia: A systematic review. Hortic. Res. 2020, 7, 107. [Google Scholar] [CrossRef]
  5. Zhang, Q.; Zhang, D.; Yu, K.; Ji, J.; Liu, N.; Zhang, Y.; Xu, M.; Zhang, Y.J.; Ma, X.; Liu, S.; et al. Frequent germplasm exchanges drive the high genetic diversity of Chinese-cultivated common apricot germplasm. Hortic. Res. 2021, 8, 215. [Google Scholar] [CrossRef]
  6. Shastry, B.S. SNPs: Impact on gene function and phenotype. Methods Mol. Biol. 2009, 578, 3–22. [Google Scholar]
  7. Aslam, M.L.; Bastiaansen, J.W.; Elferink, M.G.; Megens, H.J.; Crooijmans, R.P.; Blomberg, L.A.; Fleischer, R.C.; Van Tassell, C.P.; Sonstegard, T.S.; Schroeder, S.G.; et al. Whole genome SNP discovery and analysis of genetic diversity in Turkey (Meleagris gallopavo). BMC Genom. 2012, 13, 391. [Google Scholar] [CrossRef] [Green Version]
  8. Guo, Y.; Jamison, D.C. The distribution of SNPs in human gene regulatory regions. BMC Genom. 2005, 6, 140. [Google Scholar] [CrossRef] [Green Version]
  9. Lee, C.Y. A model for the clustered distribution of SNPs in the human genome. Comput. Biol. Chem. 2016, 64, 94–98. [Google Scholar] [CrossRef] [Green Version]
  10. Song, X.; Ge, T.; Li, Y.; Hou, X. Genome-wide identification of SSR and SNP markers from the non-heading Chinese cab-bage for comparative genomic analyses. BMC Genom. 2015, 16, 328. [Google Scholar] [CrossRef] [Green Version]
  11. Lehne, B.; Lewis, C.M.; Schlitt, T. From SNPs to genes: Disease association at the gene level. PLoS ONE 2011, 6, e20133. [Google Scholar] [CrossRef]
  12. Lu, L.; Chen, H.; Wang, X.; Zhao, Y.; Yao, X.; Xiong, B.; Deng, Y.; Zhao, D. Genome-level diversification of eight ancient tea populations in the Guizhou and Yunnan regions identifies candidate genes for core agronomic traits. Hortic. Res. 2021, 8, 388–406. [Google Scholar] [CrossRef]
  13. Song, X.; Wei, Y.; Xiao, D.; Gong, K.; Sun, P.; Ren, Y.; Yuan, J.; Wu, T.; Yang, Q.; Li, X.; et al. Brassica carinata genome characterization clarifies U’s triangle model of evolution and polyploidy in Brassica. Plant Physiol. 2021, 186, 388–406. [Google Scholar] [CrossRef]
  14. Parkin, I.A.; Koh, C.; Tang, H.; Robinson, S.J.; Kagale, S.; Clarke, W.E.; Town, C.D.; Nixon, J.; Krishnakumar, V.; Bidwell, S.L.; et al. Transcriptome and methylome profiling reveals relics of genome dominance in the mesopolyploid Brassica oleracea. Genome Biol. 2014, 15, R77. [Google Scholar] [CrossRef] [Green Version]
  15. Sun, D.; Wang, C.; Zhang, X.; Zhang, W.; Jiang, H.; Yao, X.; Liu, L.; Wen, Z.; Niu, G.; Shan, X. Draft genome sequence of cauliflower (Brassica oleracea L. var. botrytis) provides new insights into the C genome in Brassica species. Hortic. Res. 2019, 6, 82. [Google Scholar] [CrossRef] [Green Version]
  16. Lv, H.; Wang, Y.; Han, F.; Ji, J.; Fang, Z.; Zhuang, M.; Li, Z.; Zhang, Y.; Yang, L. A high-quality reference genome for cabbage obtained with SMRT reveals novel genomic features and evolutionary characteristics. Sci. Rep. 2020, 10, 12394. [Google Scholar] [CrossRef]
  17. Guo, N.; Wang, S.; Gao, L.; Liu, Y.; Wang, X.; Lai, E.; Duan, M.; Wang, G.; Li, J.; Yang, M.; et al. Genome sequencing sheds light on the contribution of structural variants to Brassica oleracea diversification. BMC Biol. 2021, 19, 93. [Google Scholar] [CrossRef]
  18. Cai, X.; Wu, J.; Liang, J.; Lin, R.; Zhang, K.; Cheng, F.; Wang, X. Improved Brassica oleracea JZS assembly reveals signif-icant changing of LTR-RT dynamics in different morphotypes. Theor. Appl. Genet. 2020, 133, 3187–3199. [Google Scholar] [CrossRef]
  19. Belser, C.; Istace, B.; Denis, E.; Dubarry, M.; Baurens, F.C.; Falentin, C.; Genete, M.; Berrabah, W.; Chevre, A.M.; Delourme, R.; et al. Chromosome-scale as-semblies of plant genomes using nanopore long reads and optical maps. Nat. Plants 2018, 4, 879–887. [Google Scholar] [CrossRef]
  20. Murray, M.G.; Thompson, W.F. Rapid isolation of high molecular weight plant DNA. Nucleic Acids Res. 1980, 8, 4321–4325. [Google Scholar] [CrossRef] [Green Version]
  21. Shen, S.; Li, N.; Wang, Y.; Zhou, R.; Sun, P.; Lin, H.; Chen, W.; Yu, T.; Liu, Z.; Wang, Z.; et al. High-quality ice plant reference genome analysis provides insights into genome evolution and allows exploration of genes involved in the transition from C3 to CAM pathways. Plant Biotechnol. J. 2022, 20, 2107–2122. [Google Scholar] [CrossRef]
  22. Song, X.; Liu, H.; Shen, S.; Huang, Z.; Yu, T.; Liu, Z.; Yang, Q.; Wu, T.; Feng, S.; Zhang, Y.; et al. Chromo-some-level pepino genome provides insights into genome evolution and anthocyanin biosynthesis in Solanaceae. Plant J. 2022, 110, 1128–1143. [Google Scholar] [CrossRef]
  23. Liu, Z.; Li, N.; Yu, T.; Wang, Z.; Wang, J.; Ren, J.; He, J.; Huang, Y.; Shi, K.; Yang, Q.; et al. The Bras-sicaceae genome resource (TBGR): A comprehensive genome platform for Brassicaceae plants. Plant Physiol. 2022, 190, 226–237. [Google Scholar] [CrossRef]
  24. Li, H.; Durbin, R. Fast and accurate short read alignment with Burrows-Wheeler transform. Bioinformatics 2009, 25, 1754–1760. [Google Scholar] [CrossRef] [Green Version]
  25. Danecek, P.; Bonfield, J.K.; Liddle, J.; Marshall, J.; Ohan, V.; Pollard, M.O.; Whitwham, A.; Keane, T.; McCarthy, S.A.; Davies, R.M.; et al. Twelve years of SAMtools and BCFtools. Gigascience 2021, 10, giab008. [Google Scholar] [CrossRef]
  26. Sulovari, A.; Li, D. GACT: A Genome build and Allele definition Conversion Tool for SNP imputation and meta-analysis in genetic association studies. BMC Genom. 2014, 15, 610. [Google Scholar] [CrossRef] [Green Version]
  27. Wang, K.; Li, M.; Hakonarson, H. ANNOVAR: Functional annotation of genetic variants from high-throughput sequencing data. Nucleic Acids Res. 2010, 38, e164. [Google Scholar] [CrossRef]
  28. Vilella, A.J.; Severin, J.; Ureta-Vidal, A.; Heng, L.; Durbin, R.; Birney, E. EnsemblCompara GeneTrees: Complete, duplica-tion-aware phylogenetic trees in vertebrates. Genome Res. 2009, 19, 327–335. [Google Scholar] [CrossRef] [Green Version]
  29. Price, A.L.; Patterson, N.J.; Plenge, R.M.; Weinblatt, M.E.; Shadick, N.A.; Reich, D. Principal components analysis corrects for stratification in genome-wide association studies. Nat. Genet. 2006, 38, 904–909. [Google Scholar] [CrossRef]
  30. Chang, C.C.; Chow, C.C.; Tellier, L.C.; Vattikuti, S.; Purcell, S.M.; Lee, J.J. Second-generation PLINK: Rising to the challenge of larger and richer datasets. Gigascience 2015, 4, s13742-015. [Google Scholar] [CrossRef]
  31. Zhang, C.; Dong, S.S.; Xu, J.Y.; He, W.M.; Yang, T.L. PopLDdecay: A fast and effective tool for linkage disequilibrium decay analysis based on variant call format files. Bioinformatics 2019, 35, 1786–1788. [Google Scholar] [CrossRef]
  32. Danecek, P.; Auton, A.; Abecasis, G.; Albers, C.A.; Banks, E.; DePristo, M.A.; Handsaker, R.E.; Lunter, G.; Marth, G.T.; Sherry, S.T.; et al. The variant call format and VCFtools. Bioinformatics 2011, 27, 2156–2158. [Google Scholar] [CrossRef]
  33. Yu, N.; Jensen-Seaman, M.I.; Chemnick, L.; Ryder, O.; Li, W.H. Nucleotide diversity in gorillas. Genetics 2004, 166, 1375–1383. [Google Scholar] [CrossRef] [Green Version]
  34. Bimolata, W.; Kumar, A.; Reddy, M.S.K.; Sundaram, R.M.; Laha, G.S.; Qureshi, I.A.; Ghazi, I.A. Nucleotide diversity analysis of three major bacterial blight resistance genes in rice. PLoS ONE 2015, 10, e7276. [Google Scholar] [CrossRef] [Green Version]
  35. Hall, S.J.G. Genetic Differentiation among Livestock Breeds-Values for Fst. Animals 2022, 12, 1115. [Google Scholar] [CrossRef]
  36. Guo, T.; Zhao, H.; Yuan, C.; Huang, S.; Zhou, S.; Lu, Z.; Niu, C.; Liu, J.; Zhu, S.; Yue, Y.; et al. Selective Sweeps Uncovering the Genetic Basis of Horn and Adaptability Traits on Fine-Wool Sheep in China. Front. Genet. 2021, 12, 604235. [Google Scholar] [CrossRef]
  37. Feng, G.; Ai, X.; Yi, H.; Guo, W.; Wu, J. Genomic and transcriptomic analyses of Citrus sinensis varieties provide insights into Valencia orange fruit mastication trait formation. Hortic. Res. 2021, 8, 111785. [Google Scholar] [CrossRef]
  38. Li, C.; Li, Y.; Zheng, J.; Guo, Z.; Mei, X.; Lei, M.; Ren, Y.; Zhang, X.; Zhang, C.; Yang, C.; et al. Trait Analysis in Domestic Rabbits (Oryctolagus cuniculus f. domesticus) Using SNP Markers from Gen-otyping-by-Sequencing Data. Animals 2022, 12, 2052. [Google Scholar]
  39. Young, M.D.; Wakefield, M.J.; Smyth, G.K.; Oshlack, A. Gene ontology analysis for RNA-seq: Accounting for selection bias. Genome Biol. 2010, 11, 3787–3793. [Google Scholar] [CrossRef] [Green Version]
  40. Mao, X.; Cai, T.; Olyarchuk, J.G.; Wei, L. Automated genome annotation and pathway identification using the KEGG Orthology (KO) as a controlled vocabulary. Bioinformatics 2005, 21, R14. [Google Scholar] [CrossRef]
  41. Song, X.; Hu, J.; Wu, T.; Yang, Q.; Feng, X.; Lin, H.; Feng, S.; Cui, C.; Yu, Y.; Zhou, R.; et al. Comparative analysis of long noncoding RNAs in angiosperms and characterization of long noncoding RNAs in response to heat stress in Chinese cabbage. Hortic. Res. 2021, 8, 48. [Google Scholar] [CrossRef]
  42. Armstrong, R.A. When to use the Bonferroni correction. Ophthalmic Physiol. Opt. 2014, 34, 502–508. [Google Scholar] [CrossRef]
  43. Purvis, A.; Bromham, L. Estimating the transition/transversion ratio from independent pairwise comparisons with an as-sumed phylogeny. J. Mol. Evol. 1997, 44, 112–119. [Google Scholar] [CrossRef]
  44. van der Merwe, N.A.; Gryzenhout, M.; Steenkamp, E.T.; Wingfield, B.D.; Wingfield, M.J. Multigene phylogenetic and pop-ulation differentiation data confirm the existence of a cryptic species within Chrysoporthe cubensis. Fungal Biol. 2010, 114, 966–979. [Google Scholar] [CrossRef] [Green Version]
  45. Bird, K.A.; An, H.; Gazave, E.; Gore, M.A.; Pires, J.C.; Robertson, L.D.; Labate, J.A. Population Structure and Phylogenetic Relationships in a Diverse Panel of Brassica rapa L. Front. Plant Sci. 2017, 8, 321. [Google Scholar] [CrossRef] [Green Version]
  46. Slatkin, M. Linkage disequilibrium—Understanding the evolutionary past and mapping the medical future. Nat. Rev. Genet. 2008, 9, 477–485. [Google Scholar] [CrossRef] [Green Version]
  47. Wang, M.; Jia, T.; Jiang, N.; Wang, L.; Hu, X.; Luo, Z. Inferring linkage disequilibrium from non-random samples. BMC Genom. 2010, 11, 328. [Google Scholar] [CrossRef] [Green Version]
  48. Kang, Y.; Guo, S.; Wang, X.; Cao, M.; Pei, J.; Li, R.; Bao, P.; Wang, J.; Lamao, J.; Gongbao, D.; et al. Whole-Genome Resequencing Highlights the Unique Characteristics of Kecai Yaks. Animals 2022, 12, 2682. [Google Scholar] [CrossRef]
  49. Flint-Garcia, S.A.; Thornsberry, J.M.; Buckler, E.S. Structure of Linkage Disequilibrium in Plants. Annu. Rev. Plant Biol. 2003, 54, 357–374. [Google Scholar] [CrossRef] [Green Version]
  50. Zhang, J.M.; Zhang, F. Population structure and genetic variation of the endangered species Elaeagnus mollis Diels (Elaeagnaceae). Genet. Mol. Res. 2015, 14, 5950–5957. [Google Scholar] [CrossRef]
  51. Nothnagel, M.; Lu, T.T.; Kayser, M.; Krawczak, M. Genomic and geographic distribution of SNP-defined runs of homozy-gosity in Europeans. Hum. Mol. Genet. 2010, 19, 2927–2935. [Google Scholar] [CrossRef] [Green Version]
  52. Nielsen, R. Population genetic analysis of ascertained SNP data. Hum. Genom. 2004, 1, 218–224. [Google Scholar] [CrossRef]
  53. Bandillo, N.; Jarquin, D.; Song, Q.; Nelson, R.; Cregan, P.; Specht, J.; Lorenz, A. A Population Structure and Genome-Wide Association Analysis on the USDA Soybean Germplasm Collection. Plant Genome 2015, 8, 1–13. [Google Scholar] [CrossRef] [Green Version]
  54. Flanagan, S.P.; Jones, A.G. Constraints on the FST-Heterozygosity Outlier Approach. J. Hered. 2017, 108, 561–573. [Google Scholar] [CrossRef] [Green Version]
  55. Holsinger, K.E.; Weir, B.S. Genetics in geographically structured populations: Defining, estimating and interpreting F(ST). Nat. Rev. Genet. 2009, 10, 639–650. [Google Scholar] [CrossRef] [Green Version]
  56. Feng, S.; Liu, Z.; Hu, Y.; Tian, J.; Yang, T.; Wei, A. Genomic analysis reveals the genetic diversity, population structure, evolutionary history and relationships of Chinese pepper. Hortic. Res. 2020, 7, 158. [Google Scholar] [CrossRef]
  57. Liu, Y.; Cheng, H.; Wang, S.; Luo, X.; Ma, X.; Sun, L.; Chen, N.; Zhang, J.; Qu, K.; Wang, M.; et al. Genomic Diversity and Selection Signatures for Weining Cattle on the Border of Yunnan-Guizhou. Front. Genet. 2022, 13, 848951. [Google Scholar] [CrossRef]
Figure 1. Phylogenetic tree and principal component analysis (PCA) of 91 B. oleracea accessions using SNPs. (a) A neighbor joining phylogenetic tree of 91 B. oleracea accessions. The B. oleracea leaf ball shape features are displayed on the evolutionary tree using four different colors. (b) Principal component analysis (PCA) of chayote accessions using the SNPs of 91 B. oleracea accessions.
Horticulturae 09 00283 g001
Figure 2. Linkage disequilibrium (LD) and population structure analysis of the 91 B. oleracea accessions using SNPs. (a) Linkage disequilibrium decay plot of the four leaf ball shapes of B. oleracea. (b) The CV (cross validation) errors of different cluster numbers (k = 2 to 8) and the K value corresponding to the lowest point were used to determine the optimal number of population structure. (c) Model-based clustering analysis with cluster numbers from k = 2 to 8. The y-axis indicates the ancestry ratio of each B. oleracea accession, and the x-axis shows the accession number of B. oleracea.
Horticulturae 09 00283 g002
Figure 3. Fst and θπ analysis of two kinds of leaf ball shape B. oleracea accessions using SNPs. (a) Fst distribution map. The x-axis represents different chromosome names, the y-axis represents the Fst value in the corresponding windows of each chromosome, and the dotted line represents the selection threshold (top 5%). (b) Selective sweep analysis of “Yuanqiu” using θπ. The x-axis represents the chromosome position, and the y-axis represents the nucleotide polymorphism level. (c) Selective sweep analysis of “Bianqiu” using θπ.
Horticulturae 09 00283 g003
Figure 4. Combination Fst and θπ analysis of two kinds of leaf ball shape B. oleracea accessions using SNPs. The x-axis shows the value of the θπ ratio, and the y-axis shows the value of Fst, which correspond to the above frequency distribution diagram and the frequency distribution diagram on the right. The dot plots in the middle represent the corresponding Fst and θπ ratio values in different windows. The blue and green regions are the top 5% regions selected by θπ, and the red regions are the top 5% regions selected by Fst.
Horticulturae 09 00283 g004
Figure 5. The KEGG enrichment analysis of genes located in the selective sweep regions of two kinds of leaf ball shape B. oleracea accessions. (a) The enrichment analysis of genes located in the selective sweep regions in the “Yuanqiu” shape. (b) The enrichment analysis of genes located in the selective sweep regions in the “Bianqiu” shape.
Horticulturae 09 00283 g005
Disclaimer/Publisher’s Note: The statements, opinions and data contained in all publications are solely those of the individual author(s) and contributor(s) and not of MDPI and/or the editor(s). MDPI and/or the editor(s) disclaim responsibility for any injury to people or property resulting from any ideas, methods, instructions or products referred to in the content.

