Article

Brcd1 Is Associated with Plant Height through the Gibberellin Pathway in Brassica rapa L.

1
College of Horticulture, Shenyang Agricultural University, Shenyang 110866, China
2
Foreign Language Teaching Department, Shenyang Agricultural University, Shenyang 110866, China
3
College of Agriculture and Environmental Science, University of California Davis, Davis, CA 95618, USA
*
Authors to whom correspondence should be addressed.
These author contributed equally to this work.
Horticulturae 2023, 9(2), 282; https://doi.org/10.3390/horticulturae9020282
Submission received: 17 January 2023 / Revised: 11 February 2023 / Accepted: 17 February 2023 / Published: 19 February 2023
(This article belongs to the Section Genetics, Genomics, Breeding, and Biotechnology (G2B2))

Abstract

:
In crops such as Brassica rapa, the agronomic trait plant height affects the leaf light absorption rate, benefits substance accumulation, and increases production by increasing the biological yield of the population. The mechanism of plant height was adequately studied in Brassica napus and Arabidopsis, while Brassica rapa had been rarely reported. Herein, we studied a B. rapa dwarf mutant Brcd1YS. Compared with its wild-type, Yellow sarson, Brcd1YS showed shorter hypocotyls and slow growth, with inhibited root elongation and reduced numbers of lateral roots. Chlorophyll content determination and pollen viability detection indicated that the mutant’s chlorophyll content was higher than that of the wild-type; however, its pollen was inactive. Cytological identification showed that the number of cells in Brcd1YS leaves was significantly reduced and were arranged irregularly compared with those of the wild-type. Bulked Segregant RNA sequencing combined with conventional linkage mapped the dwarf mutation Brcd1YS to Chromosome A06, at position 21,621,766 to 24,683,923 bp. Application of exogenous gibberellic acid (GA) partially rescued the dwarf phenotype of Brcd1YS. GA-related genes BraA06g034110.3C and BraA06g033010.3C were identified as the most promising candidate genes. These results make a valuable contribution to our understanding of the mechanism of plant height determination in B. rapa, paving the way for further breeding of dwarf B. rapa.

1. Introduction

Brassica rapa is an economically important vegetable that has long been cultivated in China and Southeast Asia. Among B. rapa strains, Chinese cabbage and Pak-choi are used mainly as vegetable foodstuffs, whereas turnip rape and yellow sarson are commonly used to produce oilseed and fodder [1]. B. rapa is one of the oil crops in the world, which show easy lodging and poor stress resistance, resulting in significant production losses. The yield of most B. rapa varieties is affected by plant density and lodging, which also restricts mechanical harvesting, particularly for hybrids. Meanwhile, plant height is likewise extremely important for improving the ecological adaptability and disease resistance of B. rapa. Dwarfing is an important factor affecting lodging plant structure and plant density; thus, dwarf breeding has always been an important goal for breeders [2,3]. There are few studies on the mechanism of plant height in B. rapa, and the regulatory locus found are also very limited.
Plant height is affected by phytohormones, such as gibberellin (GA), brassinosteroid (BR), and auxin (IAA). GA plays a vital role for controlling plant height, and the majority of plant height-related genes that have been utilized in agriculture are GA biosynthesis or response pathway genes [4,5]. GA is also a key factor that regulates the whole growth process of plants, from seed germination and stem and root extension to flowering and fruit ripening [6]. Most of the dwarfing mutants identified in plants were related to the GA pathway, and the effect of GA on plant height can be divided into two types: mutation of the GA signal transport pathway and mutation of gene-encoding enzymes in the GA synthesis pathway. In the former case, exogenous GA did not change the phenotype, whereas in the latter case, exogenous GA could restore the phenotype of a dwarf mutant [7,8]. The semi-dwarf and high yield varieties developed during the “Green revolution” were associated with a significant change in plant hormone GA biosynthesis and signaling pathways, and the most representative dwarf genes were rice sd1, and wheat Rht-B1b and Rht-D1b [9,10]. Rice sd1 encodes a defective GA biosynthetic enzyme, GA20ox, which reduces the GA content in the sd1 mutant. Wheat Rht-B1b and Rht-D1b encode a DELLA protein, which negatively regulates the GA signal pathway, thus leading to a dwarf phenotype [11,12].
Recently, an increasing number of genes associated with dwarf phenotypes were identified and isolated in Brassica plants, which paved the way for deciphering the molecular mechanism of dwarfing. Dwarfing can influence Brassica plant architecture and yield, indeed, knockout of two BnaMAX1 homologs and the BnaA03.BP gene using CRISPR/Cas9-targeted mutagenesis in Brassica napus led to a semi-dwarf phenotype and increased production [2,13]. In the GA pathway, B. napus DS-3 (encoding a DELLA protein involved in the GA pathway) was mapped to chromosome C07, the overexpression of which can result in a dwarf phenotype [14]. In B. rapa, dwarf2 is homologous to the A. thaliana RGA gene, both of which encode DELLA proteins that affect GA signal transduction pathway, eventually leading to a dwarf phenotype [15]. GA2ox6 overexpression in B. napus significantly reduced plant height and the development of the stem and hypocotyl, whereas chlorophyll accumulation was enhanced [16]. In another pathway, the B. napus auxin-related dwarf gene, ds-4, negatively regulates plant height through an auxin signaling pathway; BnaA03.IAA7 and BnaARF6/8 also regulated stem elongation and plant height through the auxin pathway [17,18]. Two genes, BraA01000252 and BraA05004386, were identified in Chinese cabbage, which, through the upregulation of novel_15 and novel_54, might lead to the inhibition of BR synthesis, resulting in plant dwarfing [19]. In summary, most dwarf studies in Brassica plants were related to the GA and IAA pathways; however, the specific molecular mechanisms require further exploration.
Previously, we used dwarf mutant Brcd1 and normal plant height inbred line Yellow Sarson (YS) as the donor and recipient parents, respectively. Bulk segregant RNA sequencing (BSR-Seq) combined with conventional mapping, employing the F2 population derived from the cross between Brcd1 and YS primary mapped Brcd1 to chromosome A06. Sequencing, expression analysis, and exogenous gibberellin spraying allowed the prediction of two GA-related genes as candidate genes for Brcd1. These results will promote further studies of the molecular mechanism governing plant height in B. rapa.

2. Materials and Methods

2.1. Plants and Measurement of Their Traits

RcBr (Rapid Cycling B. rapa) is an extremely early flowering, normal plant height inbred line, which was used for EMS mutagenesis to generate the dwarf mutant Brcd1 (B. rapa dwarf mutant1). The F2 Brcd1/Yellow sarson (YS) population was subsequently developed using self-pollination, which were donated by Scoot Woody (University of Wisconsin). One individual with normal plant height, but which was heterozygous at the Brcd1 locus (identified by two markers, L06-09 and L06-14, on chromosome A06) in the F2 population was selected for three successive backcrosses with the recurrent parent YS and one generation of selfing, according to the method detailed in our previous study [20]. Individuals with a dwarf phenotype were selected and named Brcd1YS, which should be near-isogenic lines (NILs) for the recurrent parent, Yellow sarson.
Individual plant phenotypic scores were calculated to assess plant growth indices, such as the plant height, distance from the plant base to the stem apex in five stages (the first true leaf, third true leaf, bolting stage, five days after bolting, and ten days after bolting), leaf length, and leaf width, were measured every five days from the third true leaf rosette stage to growth for 45 days. Root evaluations include measurement of their length and number of main and lateral root for 45 days of growth. Brcd1YS and YS were evaluated under normal conditions, and every index was analyzed in ten individuals. SPSS v17.0 (IBM Corp., Armonk, NY, USA) was used to determine the means of the phenotypic data using Student’s t-test.
Brcd1YS was crossed with YS to generate the F2 population. Five hundred F2 individuals grown under greenhouse conditions from March 2019 were used for BSR Seq analysis. Meanwhile, conventional linkage analysis was carried out using 500 F2 individuals in October 2019. All plants were sown directly into 10 cm pots, without any extra vernalization, under growth conditions as described in our previous study [21]. The experiment was conducted at the Experiment Station of Shenyang Agriculture University, Shenyang, China (41.8° N, 123.4° E).

2.2. Stem and Leaf Cell Morphological Characterization

To characterize their morphology, stems and true leaves from mutant Brcd1YS and YS at the same growth period made into paraffin sections for examination. A fresh stem and leaf from mutant Brcd1YS and YS were put it into separate bottles containing penicillin and fixed in formaldehyde, acetic acid and ethanol (FAA), followed by further vacuum storage for 24 h at 25 °C. Different concentrations of alcohol (30–95%) were used to dehydrate the samples for 2 h, with a final incubation in 100% alcohol overnight at 4 °C, followed by xylene permeation. Finally, the samples were paraffin-embedded and sectioned using a microtome (LeicaRM2016, Wetzlar, Leica, Germany). An optical microscope (Nikon ECLIPSE 80i, Tokyo, Japan) was used to observe the shape of the stem and leaf. The NIS-Element SF3.2 software ( Nikon, Tokyo, Japan)was applied to conduct the photo, select the adjusted image, and use the capture option to save.

2.3. Photosynthetic Index Determination

To identify the growth difference of Brcd1YS and YS, we measured the photosynthetic rate (Pn), the intercellular CO2 concentration (Ci), the transpiration rate (E), stomatal conductance (Gs), the photosynthetic pigment content (chlorophyll a, chlorophyll b, chlorophyll, carotenoid), pollen viability, and stem cell morphology.
After the fourth true leaf of the plant was fully unfolded, mutant Brcd1YS and YS in the same period were carried out on a sunny day between 08:00–12:00 h. The intensity of plant illumination was 800 μmol m−2s−1, CO2 concentration in cuvette of gas analyzer approximately 377.37–396.89 μmL, H2O concentration in cuvette of gas analyzer around 19.61–28.05 mmL, and the fourth true leaf was used to identify Pn, Ci, E and Gs using a Li-6400 portable photosynthesis system (LI-COR Biosciences, Lincoln, NE, USA); three replicates were performed, with six plants in each replicate. The photosynthetic indexes were measured with a modified from Li et al. (2019) [22]. Image J 1.8.0.345 software (National Institutes of Health, Rockville Pike Bethesda, America) was used to analyze the cell number.

2.4. Chlorophyll Content Determination

After the third true leaf of the plant was fully unfolded, mutant Brcd1YS and YS in the same period were selected on a sunny morning, the third true leaf was used to evaluate the photosynthetic pigment content. Ten 0.1 cm-diameter round leaves from Brcd1YS and YS with mix solution were placed in the dark for 24 h. After the leaf had completely faded, an ultraviolet spectrophotometer (DU-800; Beckman Coulter, Brea, CA, USA) was used to measure the light absorption value at wavelengths 663 nm, 645 nm, and 440 nm, respectively. The chlorophyll and carotenoid contents were measured with a modified from Arnon et al. (1949) [23]. The formulae are summarized below:
Chla = (12.72OD663 − 2.59OD645) V/1000 W;
Chlb = (22.88OD645 − 4.67OD663) V/1000 W;
Chl(a + b) = (8.05OD663 − 20.29OD645) V/1000 W;
Car = (1000OD440 − 3.27Chla − 104Chlb) V/229 × 1000 W.
Note: OD represents the optical density corresponding to the measured wavelength; V represents the total volume of chlorophyll extract (mL); W represents material quality (g).

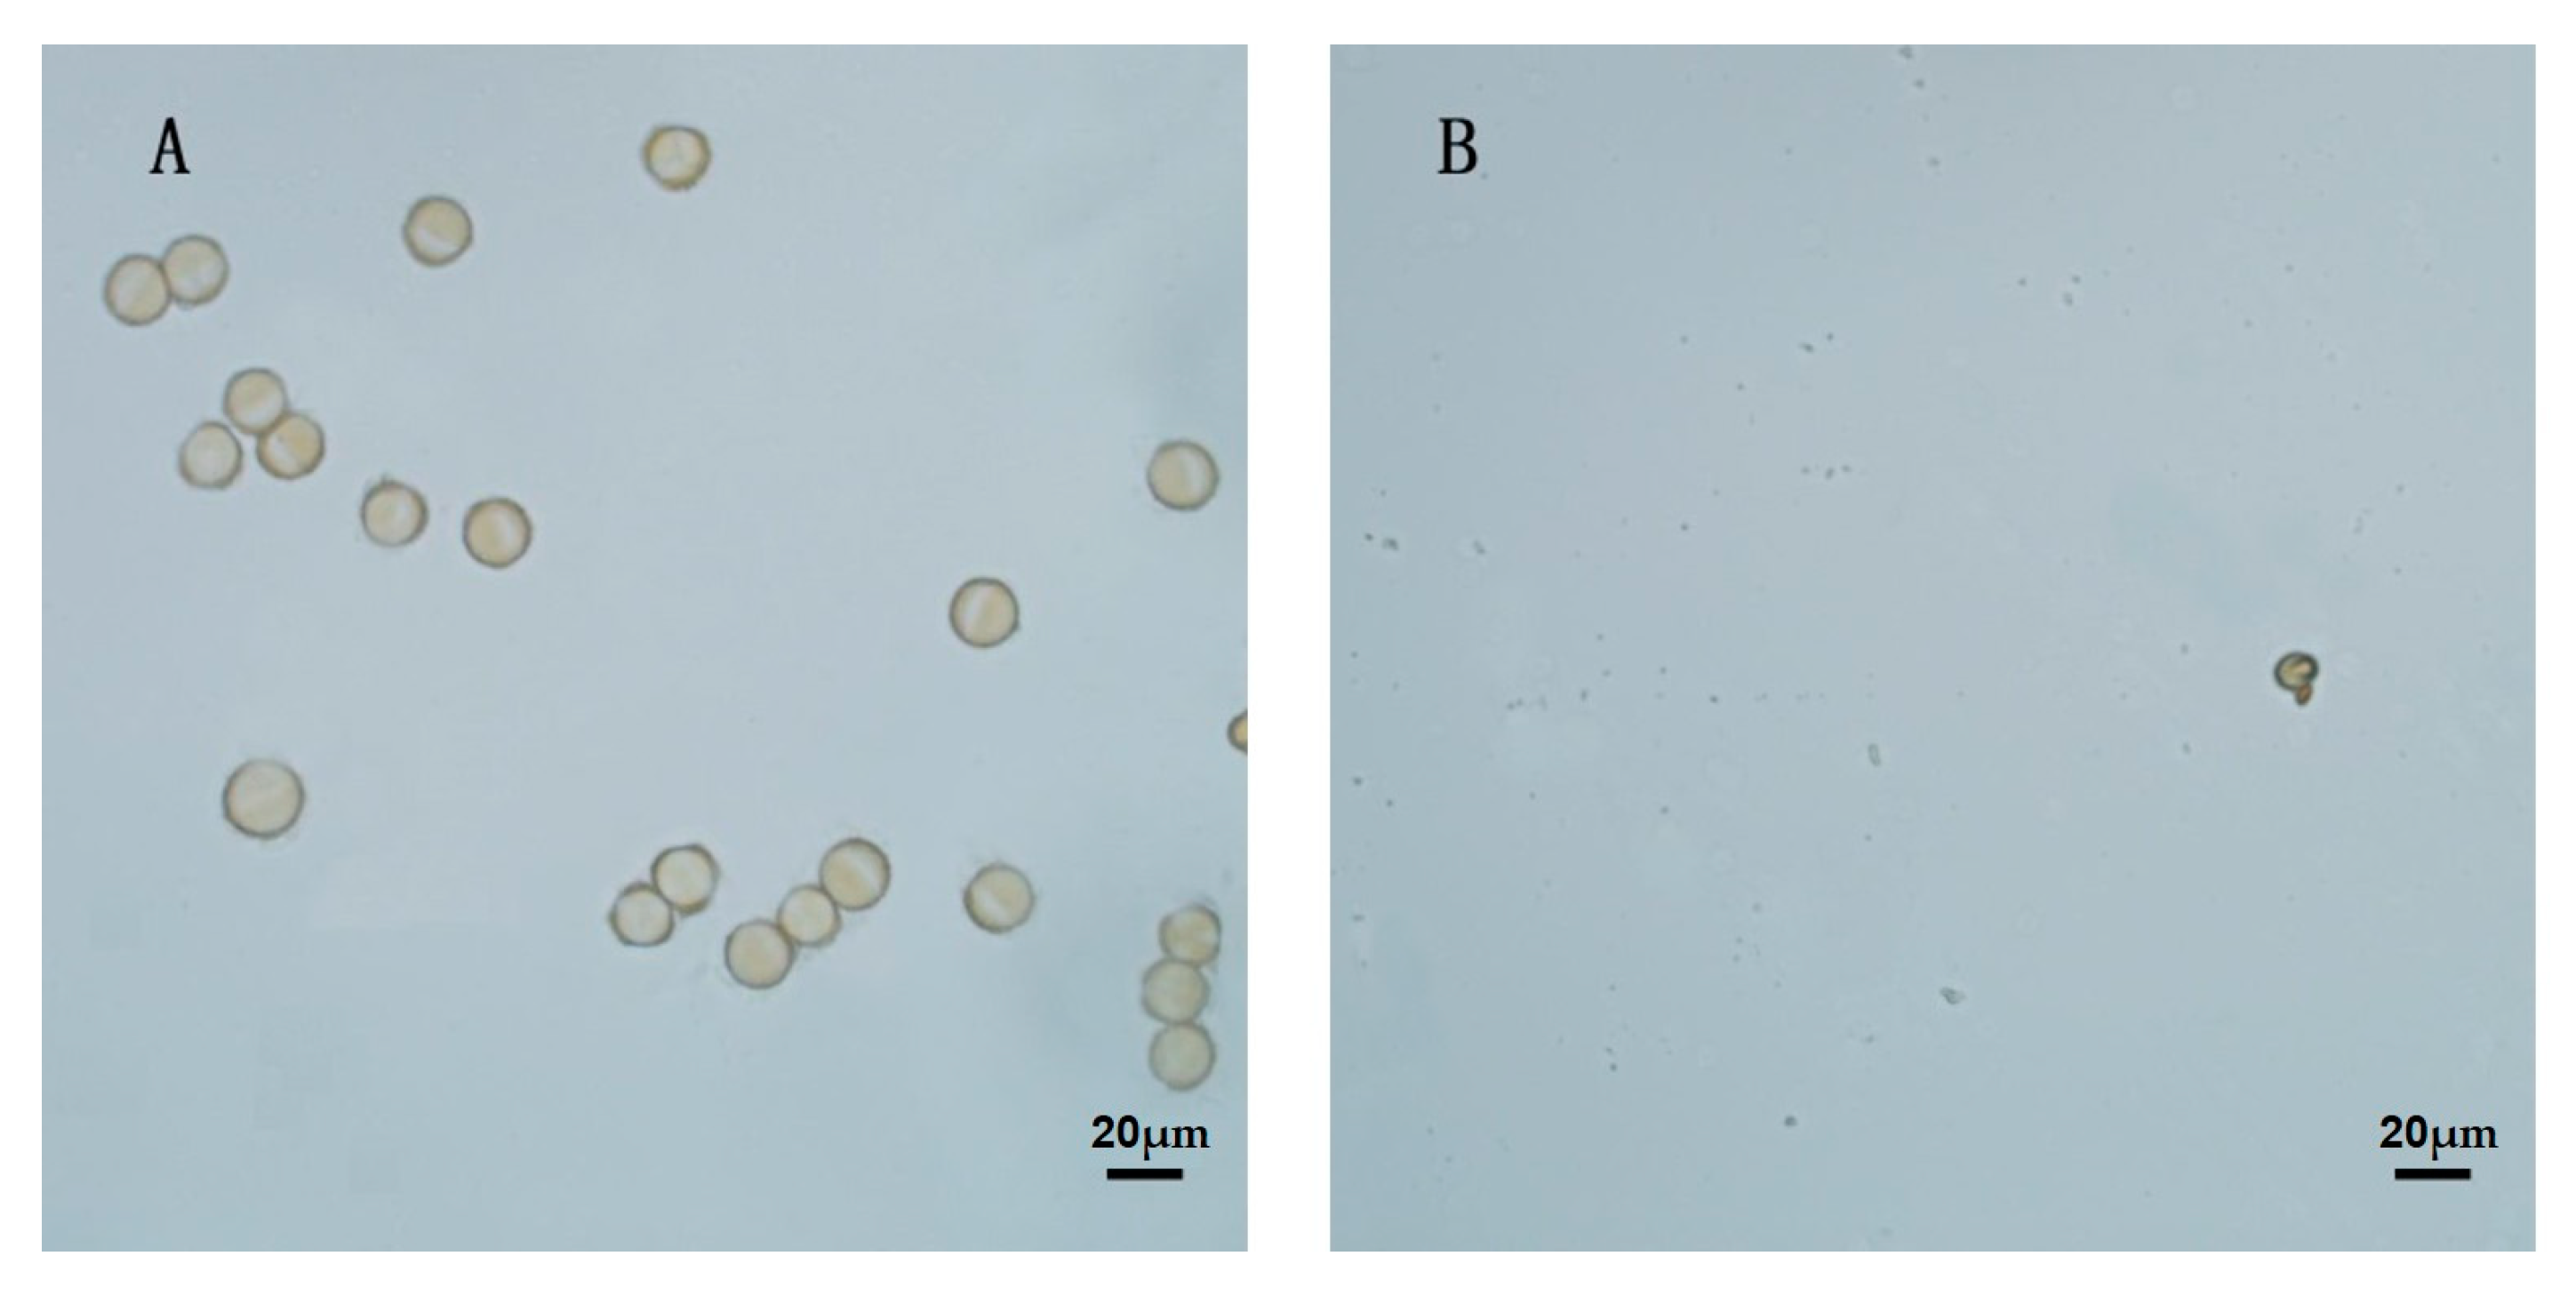
2.5. Pollen Viability Determination

Acetic red staining was used to evaluate the pollen viability of mutant Brcd1YS and YS, according to the method by Tan et al. [24]. The anthers were extracted in the flowering stage from mutant Brcd1YS and YS; pollen was placed on a slide with 1% magenta acetate and observed by Inversed Fluorescent Microscope (OLYMPUS DP80, Olympus Corporation, Tokyo, Japan). Analysis of each sample was repeated three times.

2.6. RNA Isolation and Extreme Pool Construction

A D-pool (dwarf pool) with 40 dwarf individuals and an N-pool (normal pool) with 40 normal plant height individuals were constructed as two extreme pools for BSR-seq. At 45 days after sowing, according to the phenotypes of 500 F2 individuals, the two sets of 40 extreme phenotype plants were selected, and their true leaves were sampled to isolate RNA. The TRIzol reagent (Invitrogen, Carlsbad, CA, USA) was adopted to extract the total RNA. An Agilent 2100 Bioanalyzer (Agilent Technologies, Palo Alto, CA, USA), a NanoDrop spectrophotometer (Thermo Fisher Scientific Inc., Waltham, MA, USA), and 1% agarose gel were used to assess the quantity and quality of the extracted RNA. RNA (1 μg) with an RNA integrity number (RIN) > 7 was then processed for next-generation sequencing library construction (NEBNext® Ultra™ RNA Library Prep Kit for Illumina®; NEB, Ipswich, MA, USA). The methods of RNA extraction and quality determination were the same as those detailed by Qu et al. [25].

2.7. BSR-seq

After the cDNA libraries were constructed, the Illumina HiSeq 2500 platform (Illumina, San Diego, CA, USA) was used to sequence them. Data analysis was performed by GENEWIZ company (Suzhou, China). To ensure the accuracy of the data, low-quality bases were removed using Trimmomatic v0.30, (Illumina, CA, USA) to generate clean data [26]. The clean data were compared with the B. rapa reference genome V3.0 (BRAD; http://brassicadb.cn/#/Download/ accessed on 10 May 2020) using Hisat2 (Johns Hopkins University, Baltimore, MD, USA) [27]. Single Nucleotide Variation (SNV) was detected using Samtools v0.1.18 (Trust Sanger Institute, Cambridgeshire, UK) and Bcftools v0.1.19 (Trust Sanger Institute, Cambridgeshire, UK) [28,29]. The Euclidean distance (ED) value was calculated based upon an mpileup file, which was generated by samtools v0.1.18 (Trust Sanger Institute, Cambridgeshire, UK) for BSR-seq. According to the basic principle of the ED value, the occurrence frequency of the four bases A, T, C, and G at the SNV site was statistically different in the population, and the corresponding base frequency of the two trait groups was calculated by distance. To eliminate the background noise, the ED value of each different SNV site was raised to the power of five, termed ED5 [30]. Screening identified the top 1% of ED5 values as a threshold value, which was compared with different SNV sites distributed in different chromosomes, finally confirming the candidate region for the dwarf phenotype.

2.8. Extraction of DNA and the Development of Markers

The cetyltrimethylammonium bromide (CTAB) method [31], with minor modifications, was used to extract total DNA. PCR was then carried out as described previously [21]. The specific approaches were summarized as follows: the dry and fresh plant leaves were well ground, 700 μL of CTAB solution was added, followed by 700 μL of chloroform isoamyl alcohol and frozen absolute ethanol, frozen at −80 °C for 8 min, eluted with 70% ethanol solution and dried overnight, and finally 100 μL of sterilized water was added. Specific primers and insertion/deletion (InDel) markers were designed based on the sequence variations from BSR-seq data between Brcd1YS and YS using Primer Premier 5.0 software (Premier Biosoft, San Francisco, CA, USA). In addition, some simple sequence repeat (SSR) markers were employed, which had been used previously in our laboratory. All the polymorphic markers are listed in Table S2.

2.9. Preliminary Localization of Brcd1 Dwarfing Mutation

Linkage analysis was used to confirm the candidate dwarfing region identified using BSR-seq, with the aid of polymorphic markers. Linkage analysis used an F2 population comprising 80 homozygous recessive individuals that were sown in September 2019. Six and eight polymorphic markers were developed in the A06 and A08 chromosomes, respectively. Progeny of recombinant individuals (1500 individuals) were sown in the greenhouse in October 2019 and used to narrow down the candidate region.

2.10. Exogenous GA3 Treatment and Candidate Gene Annotation Analysis

A total of 15 mutant Brcd1YS and 15 YS plants were treated using exogenous GA3, with distilled water as the control treatment. The GA3 powder (Solarbio, Beijing, China) was dissolved in 5 mL of ethanol and diluted with distilled water to 500 mg/L. The GA3 solution and distilled water were then sprayed on the individuals with fully expanded cotyledons. The spray was applied six times every other day, each treatment had three replications, and each replication comprised five individuals. The method was carried out as previously described by Gao et al. [32].
Gene functional analyses were carried out at The Arabidopsis Information Resource (TAIR; http://www.arabidopsis.org/, accessed on 10 May 2020 ) and The Brassica rapa database (BRAD; http://brassicadb.cn/#/Download/, accessed on 10 May 2020). The combined annotation information of both resources were used to predict the candidate genes in the identified region.

2.11. Candidate Gene Expression Determination

Quantitative real-time reverse transcription PCR (qRT-PCR) was used to detect the expression levels of candidate genes. Total RNA of Brcd1YS and GA3-treated Brcd1 (Brcd1YS-GA3) from roots, leaves, and stems were extracted using an RNA extraction kit (Aidlab Biotechnologies Co., Ltd., Beijing, China), followed by reverse transcription into cDNA (TIANGEN, Beijing, China). The cDNA formed the template for the qPCR step of the qRT-PCR protocol, which was carried out using SYBR Green PCR Master Mix (Takara, Dalian, China), following the manufacturer’s instructions. The relative expression levels were determined using the 2−∆∆Ct method and each sample had three independent technical replicates [33]. The actb gene (encoding beta actin) formed the internal control. Specific primers were designed using Primer Premier 5.0 (Premier Biosoft, Palo Alto, CA, USA) and are shown in Table S2. QuantStudio™6 Flex Manager software (ABI, Los Angeles, CA, USA) was used to analyze the data [34,35].

2.12. Sequence Analysis of Candidate Genes

Candidate genes obtained from the Brassica rapa genome were used to design specific PCR primers (Table S2) with Primer Premier 5.0 to amplify the full-length sequences. The PCR products were purified using a Gel Extraction Kit (CWBIO, Beijing, China), cloned into the pGEM T Easy Vector (Promega, Madison, WI, USA), and then sequencing was performed at Sangon Biotech (Shanghai, China). Sequence alignment was carried out using DNAMAN software (Lynnon Biosoft, San Ramon, CA, USA).

3. Results

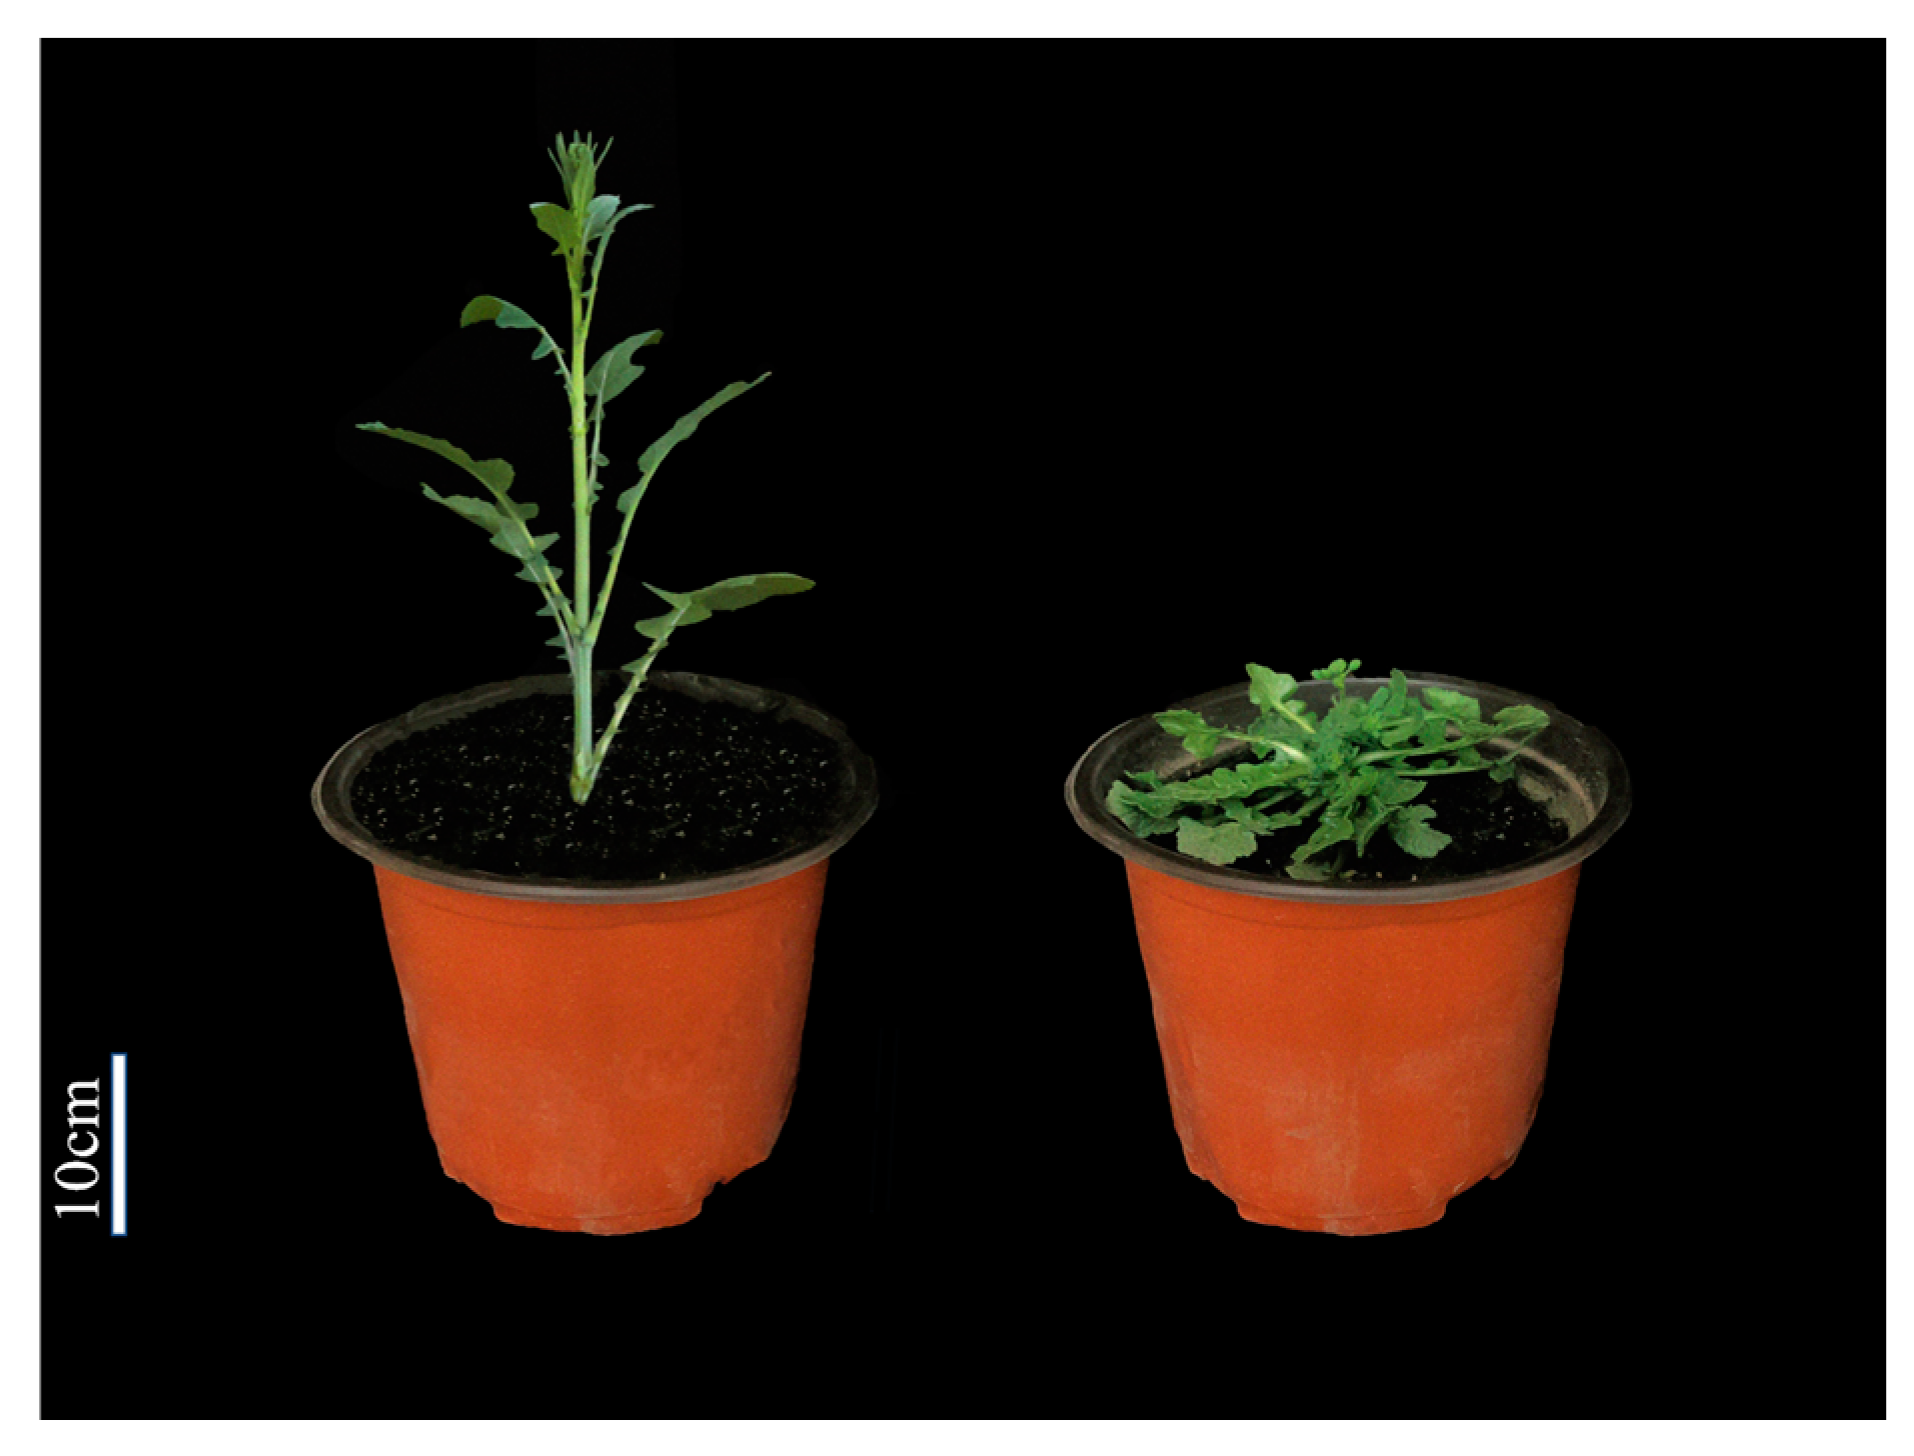
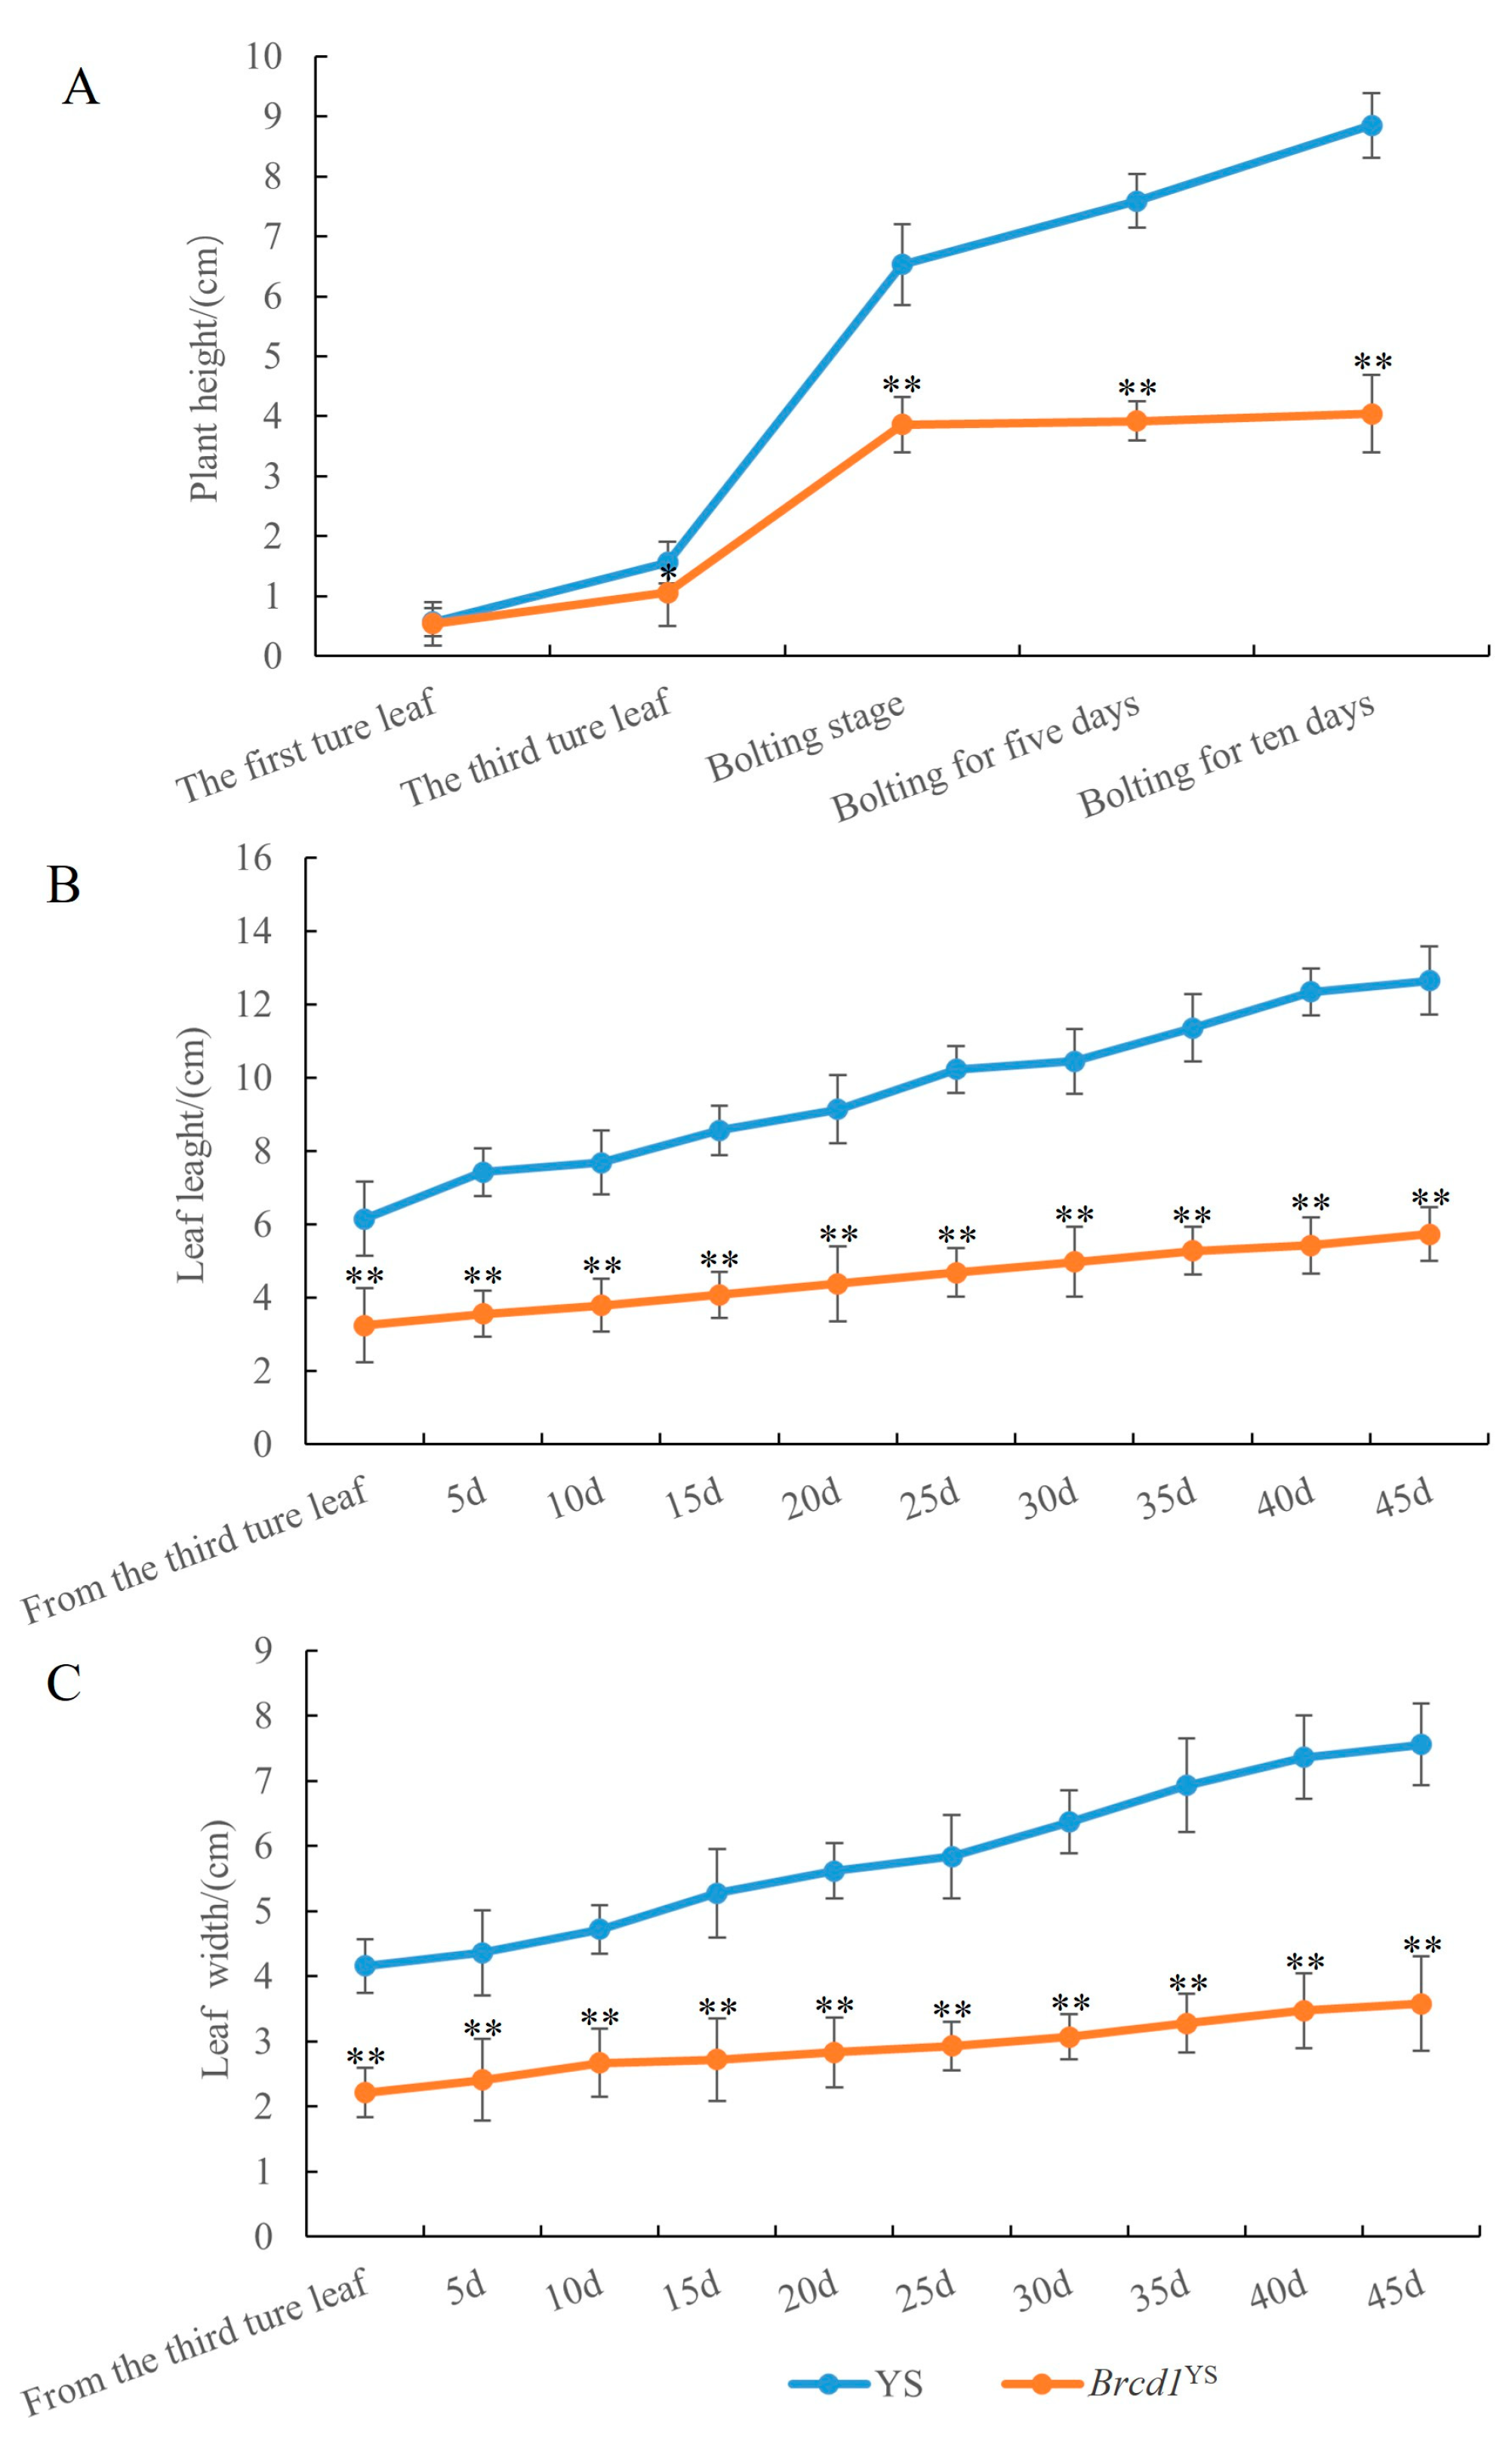
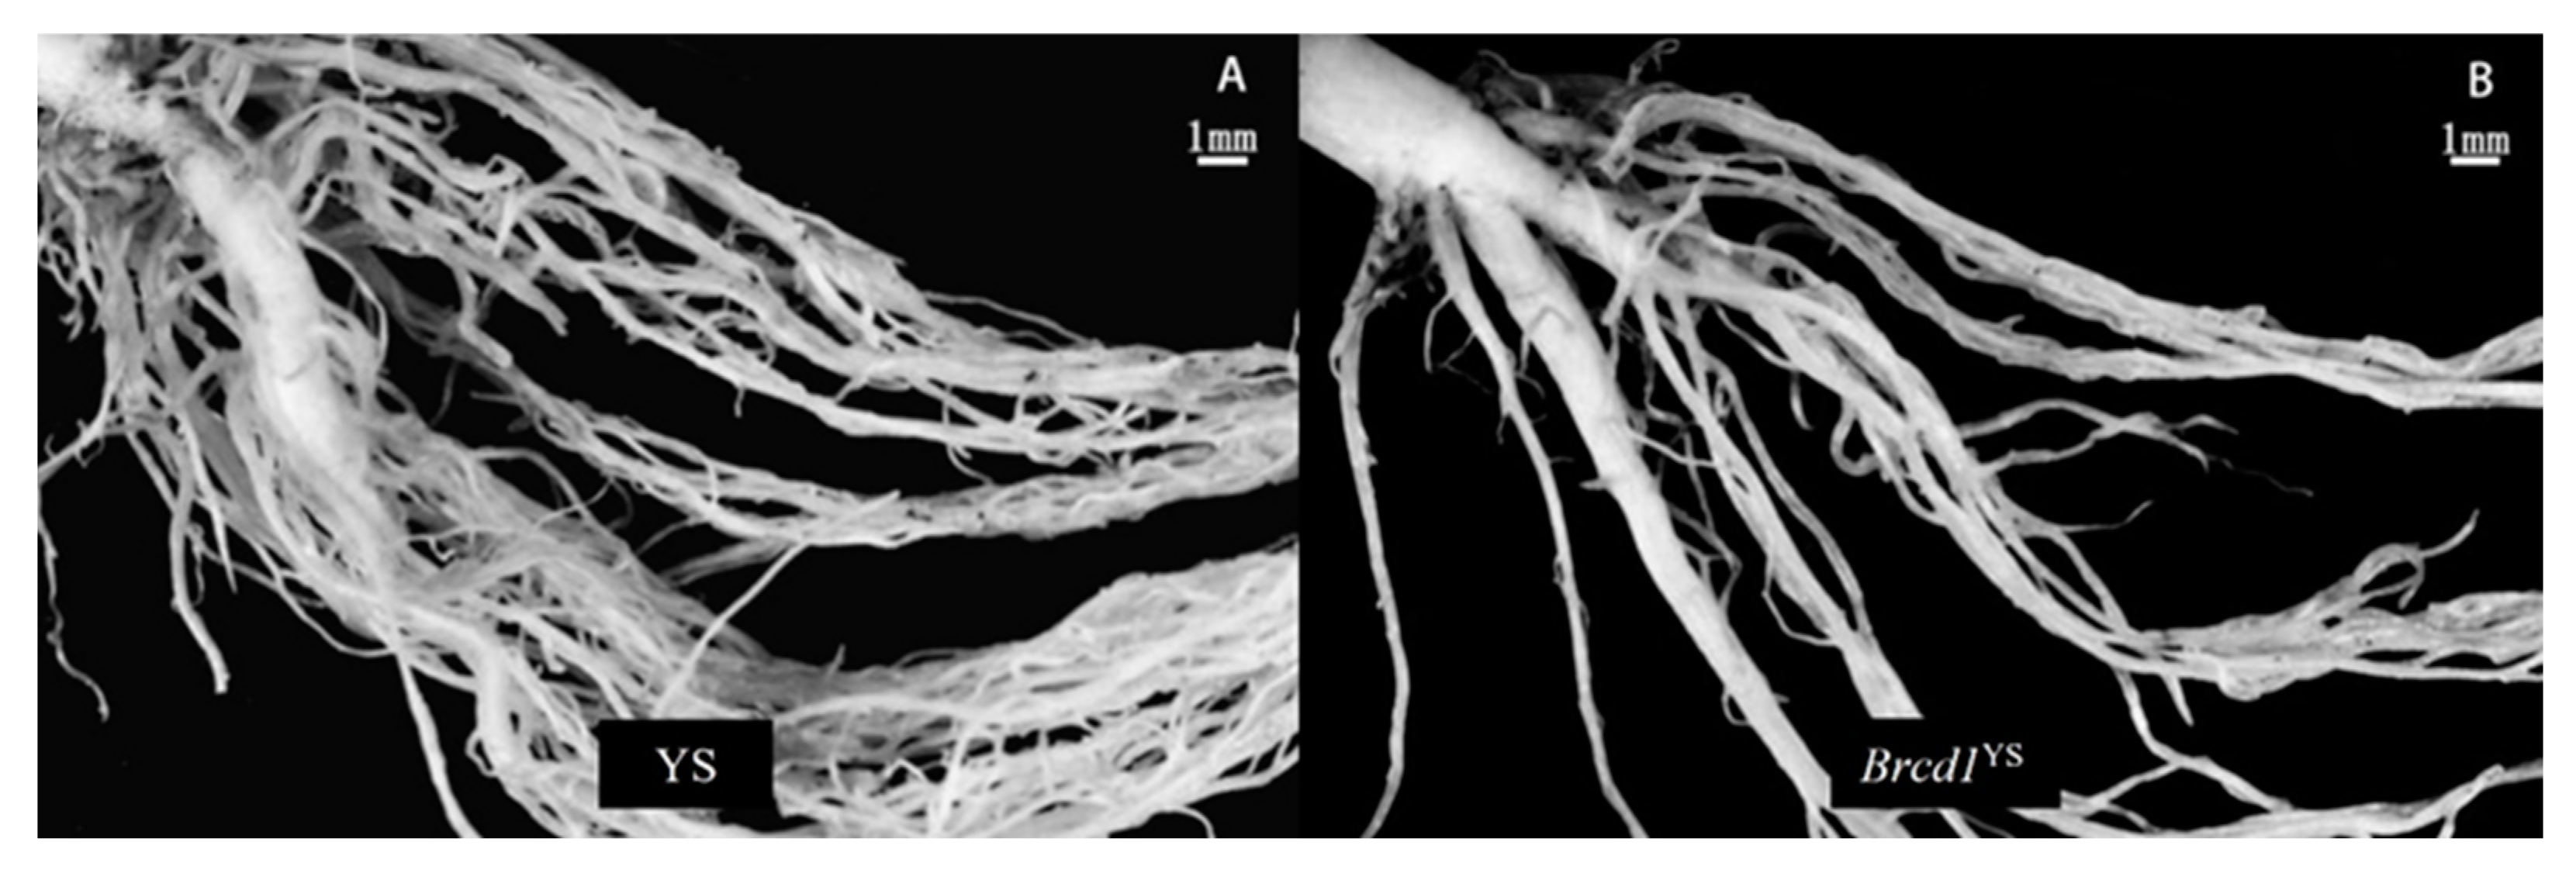
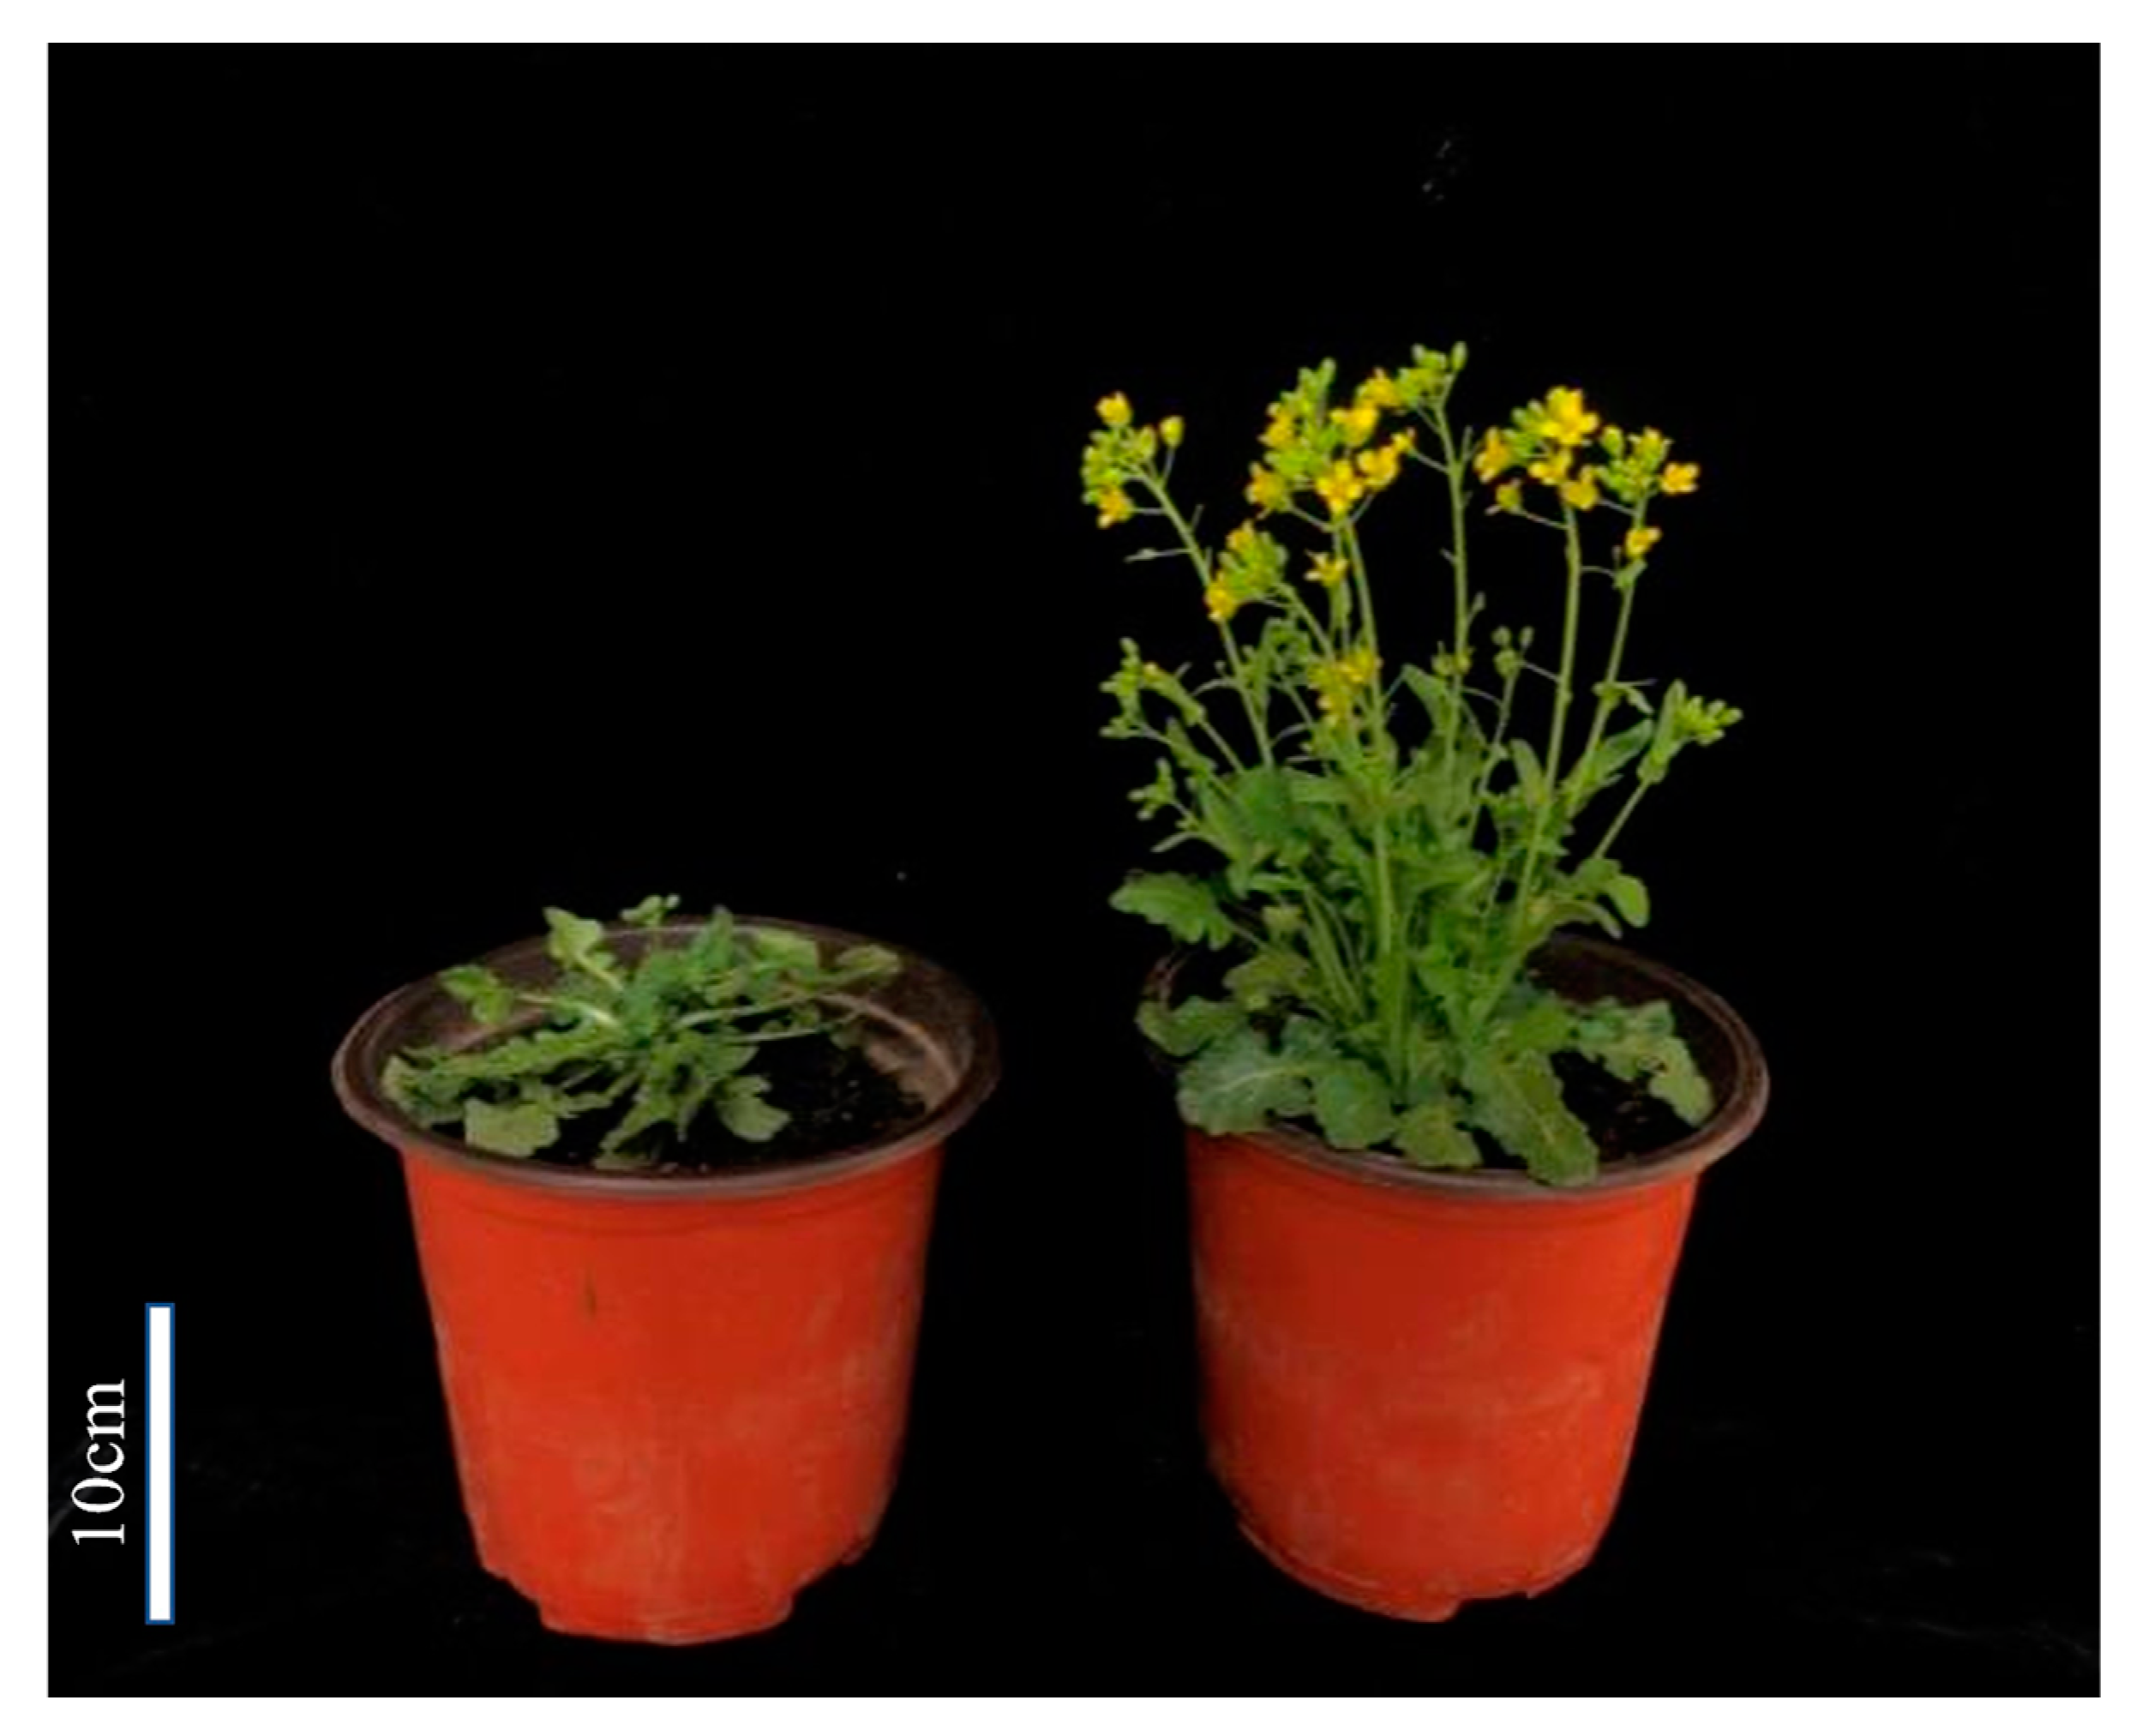
3.1. Phenotypic Characterization of the Dwarf Mutant

To explore the growth variation of dwarfing, we identified the phenotypic characteristics of the mutant Brcd1YS by comparing it with YS. Brcd1YS showed significant dwarfing compared with YS, grew slowly, and had very short hypocotyls. In addition, Brcd1YS leaves showed a dark color, prickly hairs, a narrow leaf area, and prominent veins (Figure 1). Brcd1YS showed a significant difference in plant height, leaf length, and leaf width compared with those of YS (Figure 2 and Table S1). Brcd1YS root elongation was significant restrained, and the number of lateral roots and main roots also decreased significantly compared with those in YS (Figure 3).

3.2. Analysis of Physiological Indices

Our study evaluated the Pn, Ci, E, Gs, photosynthetic pigment content (chlorophyll a, chlorophyll b, chlorophyll, carotenoid), pollen viability, and stem cell morphology between YS and Brcd1YS. The results (Table 1) showed that for Brcd1YS, Pn and Gs were higher than in YS, whereas Ci and E were lower, which indicated that the stress resistance of Brcd1YS is better than that of YS. The chlorophyll content in Brcd1YS was higher than that of YS. The pollen levels of mutant Brcd1YS was significantly decreased and the pollen grains were irregular in shape (Figure 4).

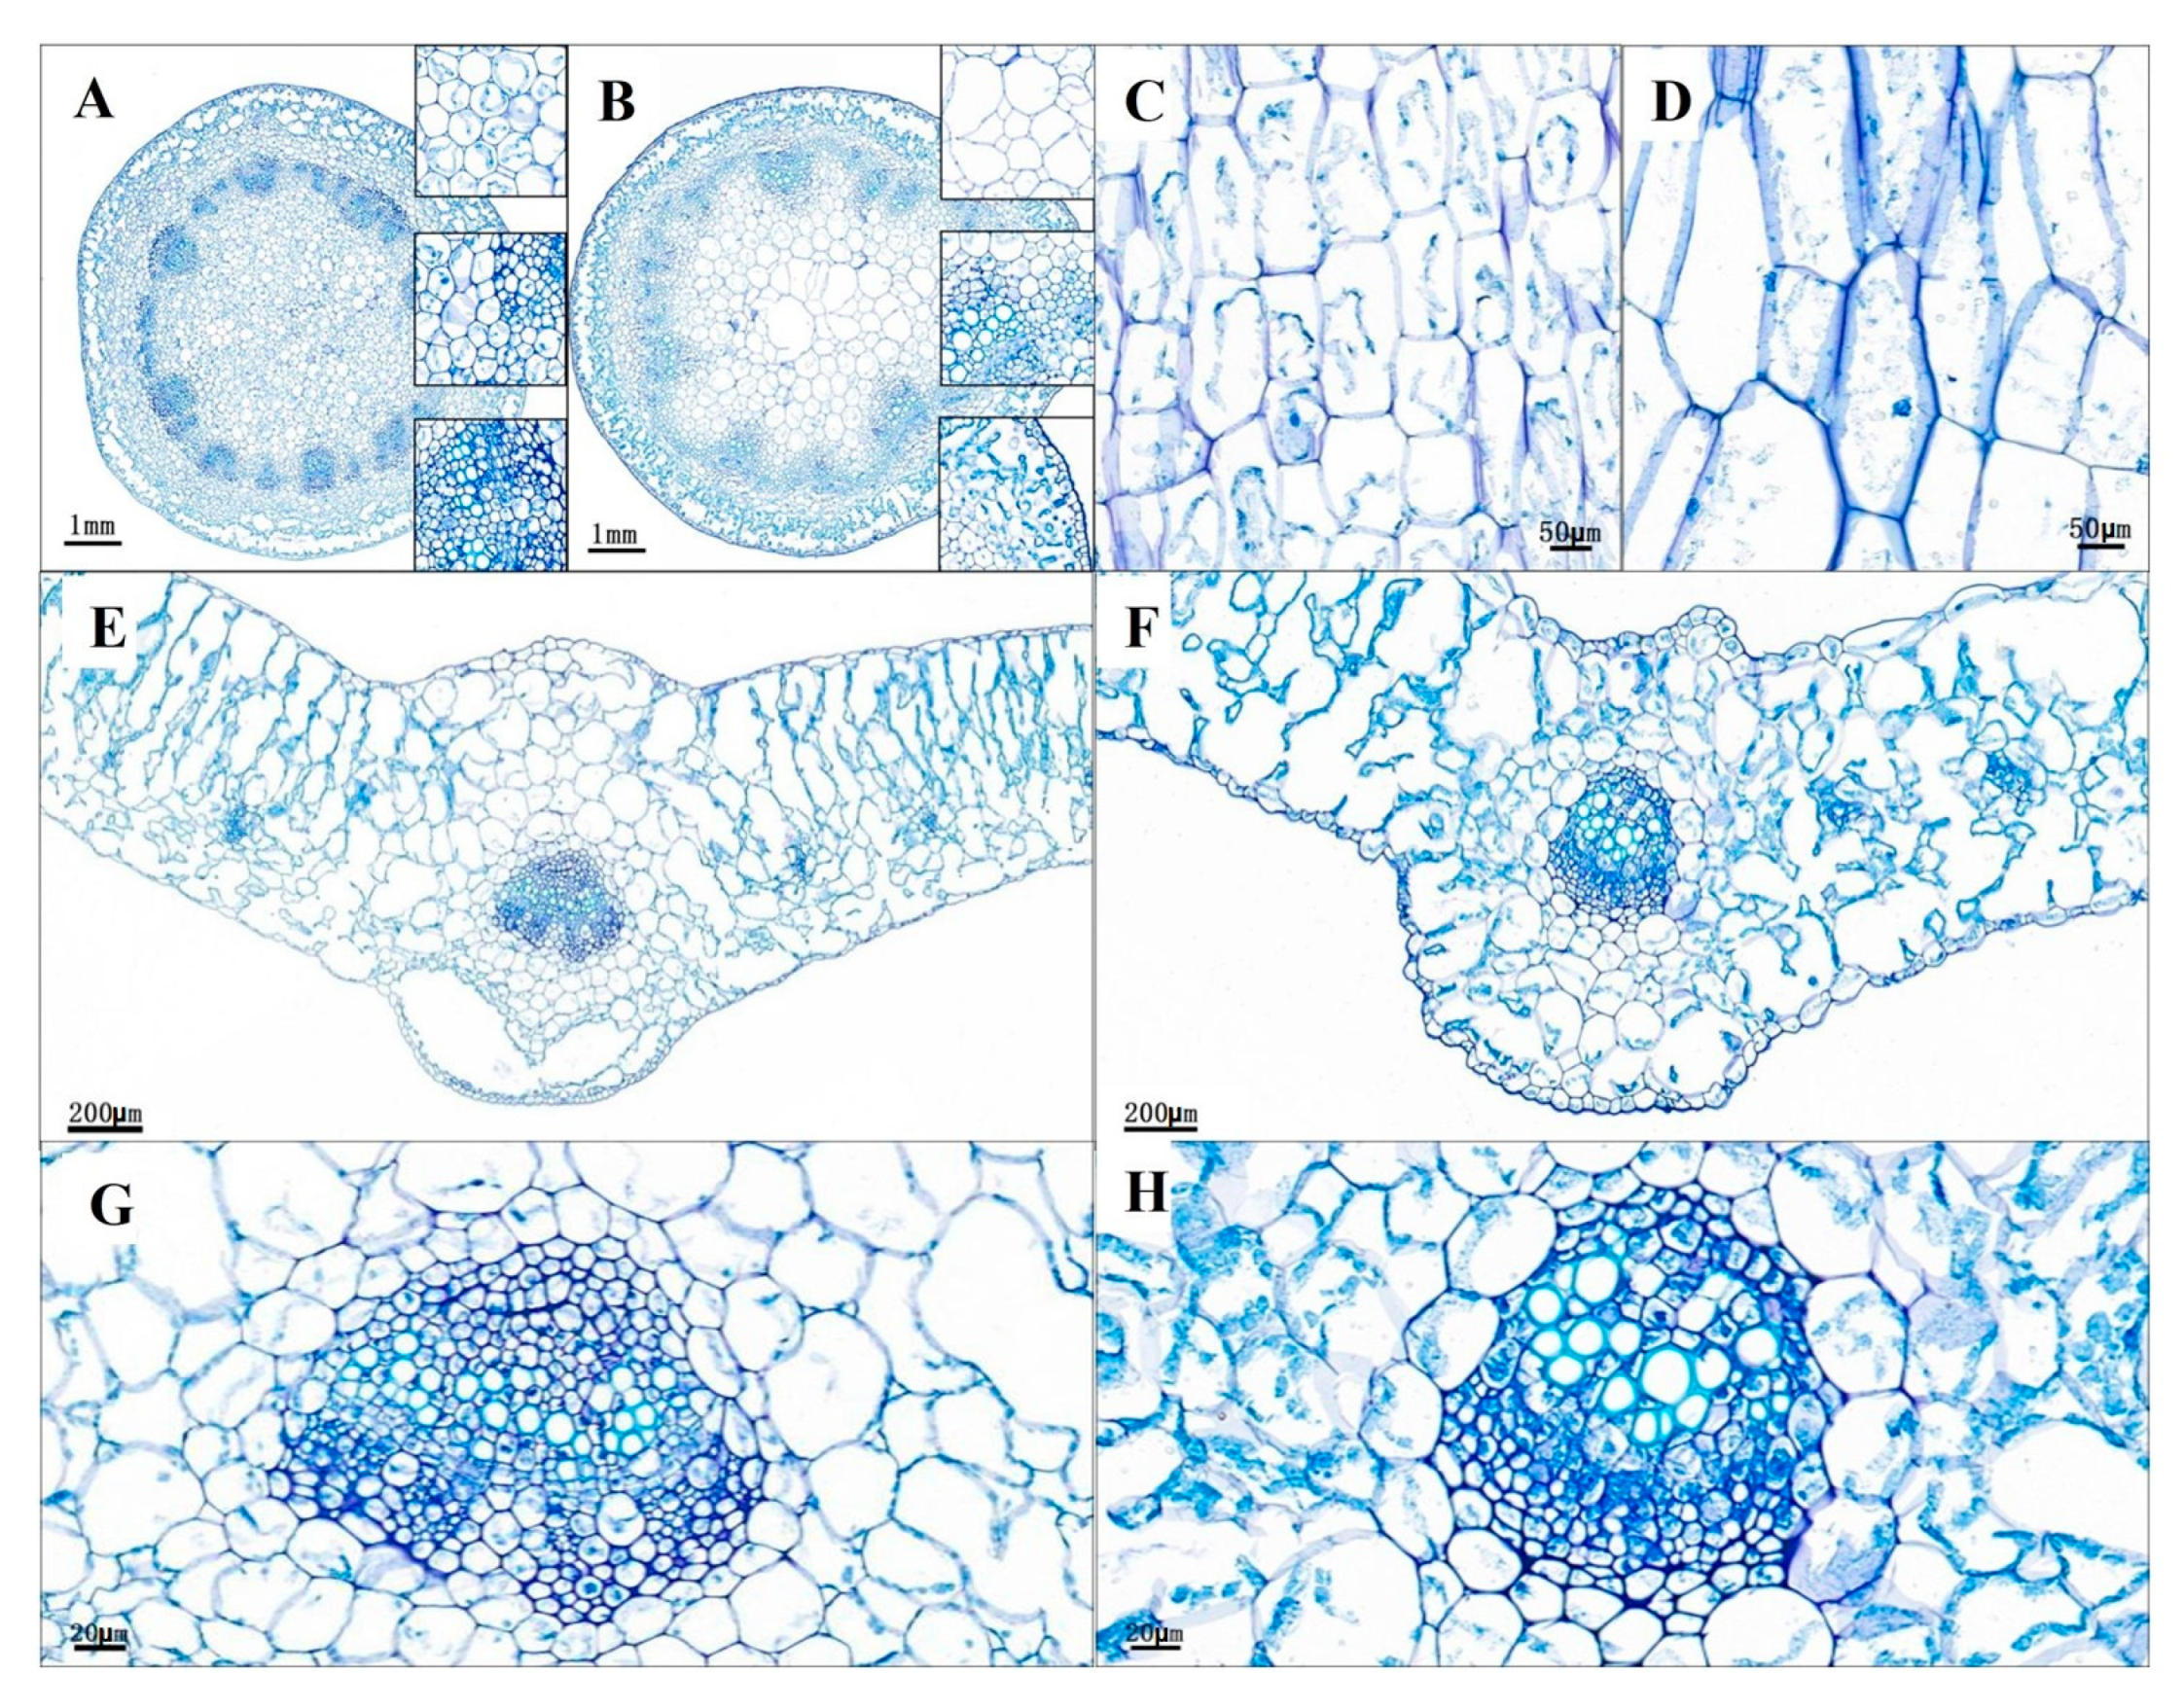
3.3. Identification Stem and Leaf Cell Morphologies of the Brcd1YS Mutant

The shorter stem resulted in the dwarf phenotype of mutant Brcd1YS, which might have been caused by a decrease in cell number or a shorter cell longitudinal length. To explain the mechanism of shortened stem of Brcd1YS, paraffin section analysis was performed on the stem of Brcd1YS and YS. Compared with YS, the space in the middle column cells was larger in the stem. Longitudinal section analysis showed that Brcd1YS parenchymal cells were significantly larger (Figure 5A–D). In the magnified stem section, the number of cells in Brcd1YS was 27 under the total cell area of 130,081 μm2, while that in YS was 55 under the total cell area of 1,266,445 μm2 (Table S3). In leaves, the cells of Brcd1YS had an irregular arrangement and enlarged cell size (Figure 5E–H). In the magnified leaf section, the cell number of Brcd1YS was 229 when the total cell area was 142,714 μm2, while that of YS was 313 when the total cell area was 158,677 μm2 (Table S3). Thus, the decrease in cell number and their irregular arrangement might be the major reason for the dwarf phenotype and altered leaves.

3.4. Primary Mapping and Validation of Brcd1 Locus

BSR-seq analysis allowed us to map 52,654,592 (D-pool) and 48,289,914 (N-pool) clean reads to the B. rapa reference genome. Compared with the B. rapa reference genome, we identified 227,846 single-nucleotide polymorphisms (SNPs) in the D-pool and 216,068 SNPs in the N-pool Using the top 1% of the ED5 values as the threshold and the distribution of SNV sites, the candidate regions for the Brcd1YS were located at chromosome A04 (starting at 17,334,001 and ending at 18,939,299) and A06 (starting at 19,356,018 and ending at 25,157,303); thus, the candidate regions comprised about 6.86 Mb (Figure S1). The candidate gene responsible for the dwarf phenotype was termed Brcd1YS.
BSR-seq analysis identified two candidate regions for Brcd1YS; therefore, to validate which one is reliable, 100 homozygous recessive individuals from the F2 population were used to determine the linkage related to the dwarf phenotype. We identified 14 polymorphic markers (Table S2) in the candidate intervals (Chromosomes A04 and A06), which were used for linkage analysis. Eight markers were identified as linked to the Brcd1YS in Chromosomes A06, and six markers were identified as not linked in Chromosome A04; thus, Brcd1YS was primarily mapped to Chromosome A06. Furthermore, using six polymorphic markers (Table S2) from the candidate region from chromosome A06, 500 homozygous-recessive individuals of F2 populations were typed to fine map Brcd1YS. Positioning of recombinant individuals allowed Brcd1YS to be narrowed down to an interval of 3.06 Mb between markers L06-09 and L06-14 (physical position: 21,621,766 to 24,683,923 bp) on chromosome A06.

3.5. Brcd1 Mutant Plants Could Be Rescued by Exogenous GA3 Treatment

Plant dwarfing is usually mediated by the GA pathway; thus, exogenous GA3 was used to spray dwarf plants, with water spraying as the control. The result showed that the dwarfing mutant Brcd1YS treated with exogenous GA3 recovered its height; however, there were no significant changes in leaf length, leaf width, and leaf fluctuation degree (Figure 6). Therefore, dwarfing Brcd1YS was sensitive to exogenous gibberellin treatment, and it was speculated that the reason for the plant height reduction of Brcd1YS was a defect in hormone synthesis.

3.6. Prediction of Candidate Genes

A total of 548 genes were detected in the 3.06 Mb candidate region (BraA06g032610.3CBraA06g038080.3C). Combining the results of exogenous GA3 treatment with the B. rapa reference genome and Arabidopsis genome information, only two GA-related genes were identified: BraA06g033010.3C and BraA06g034110.3C, and the specific information is shown in Table S4. BraA06g033010.3C is homologous with Arabidopsis AT5G25900, which is involved the GA biosynthetic pathway, and encodes a member of the CYP701A cytochrome p450 family. BraA06g034110.3C is homologous with Arabidopsis AT5G27320 and rice OsGID1, which encode a GA receptor with high affinity for GA4, which can interact with DELLA proteins in the presence of GA4 [36,37]. Thus, the two GA-related genes, BraA06g033010.3C and BraA06g034110.3C, were identified as promising candidate genes for Brcd1YS.

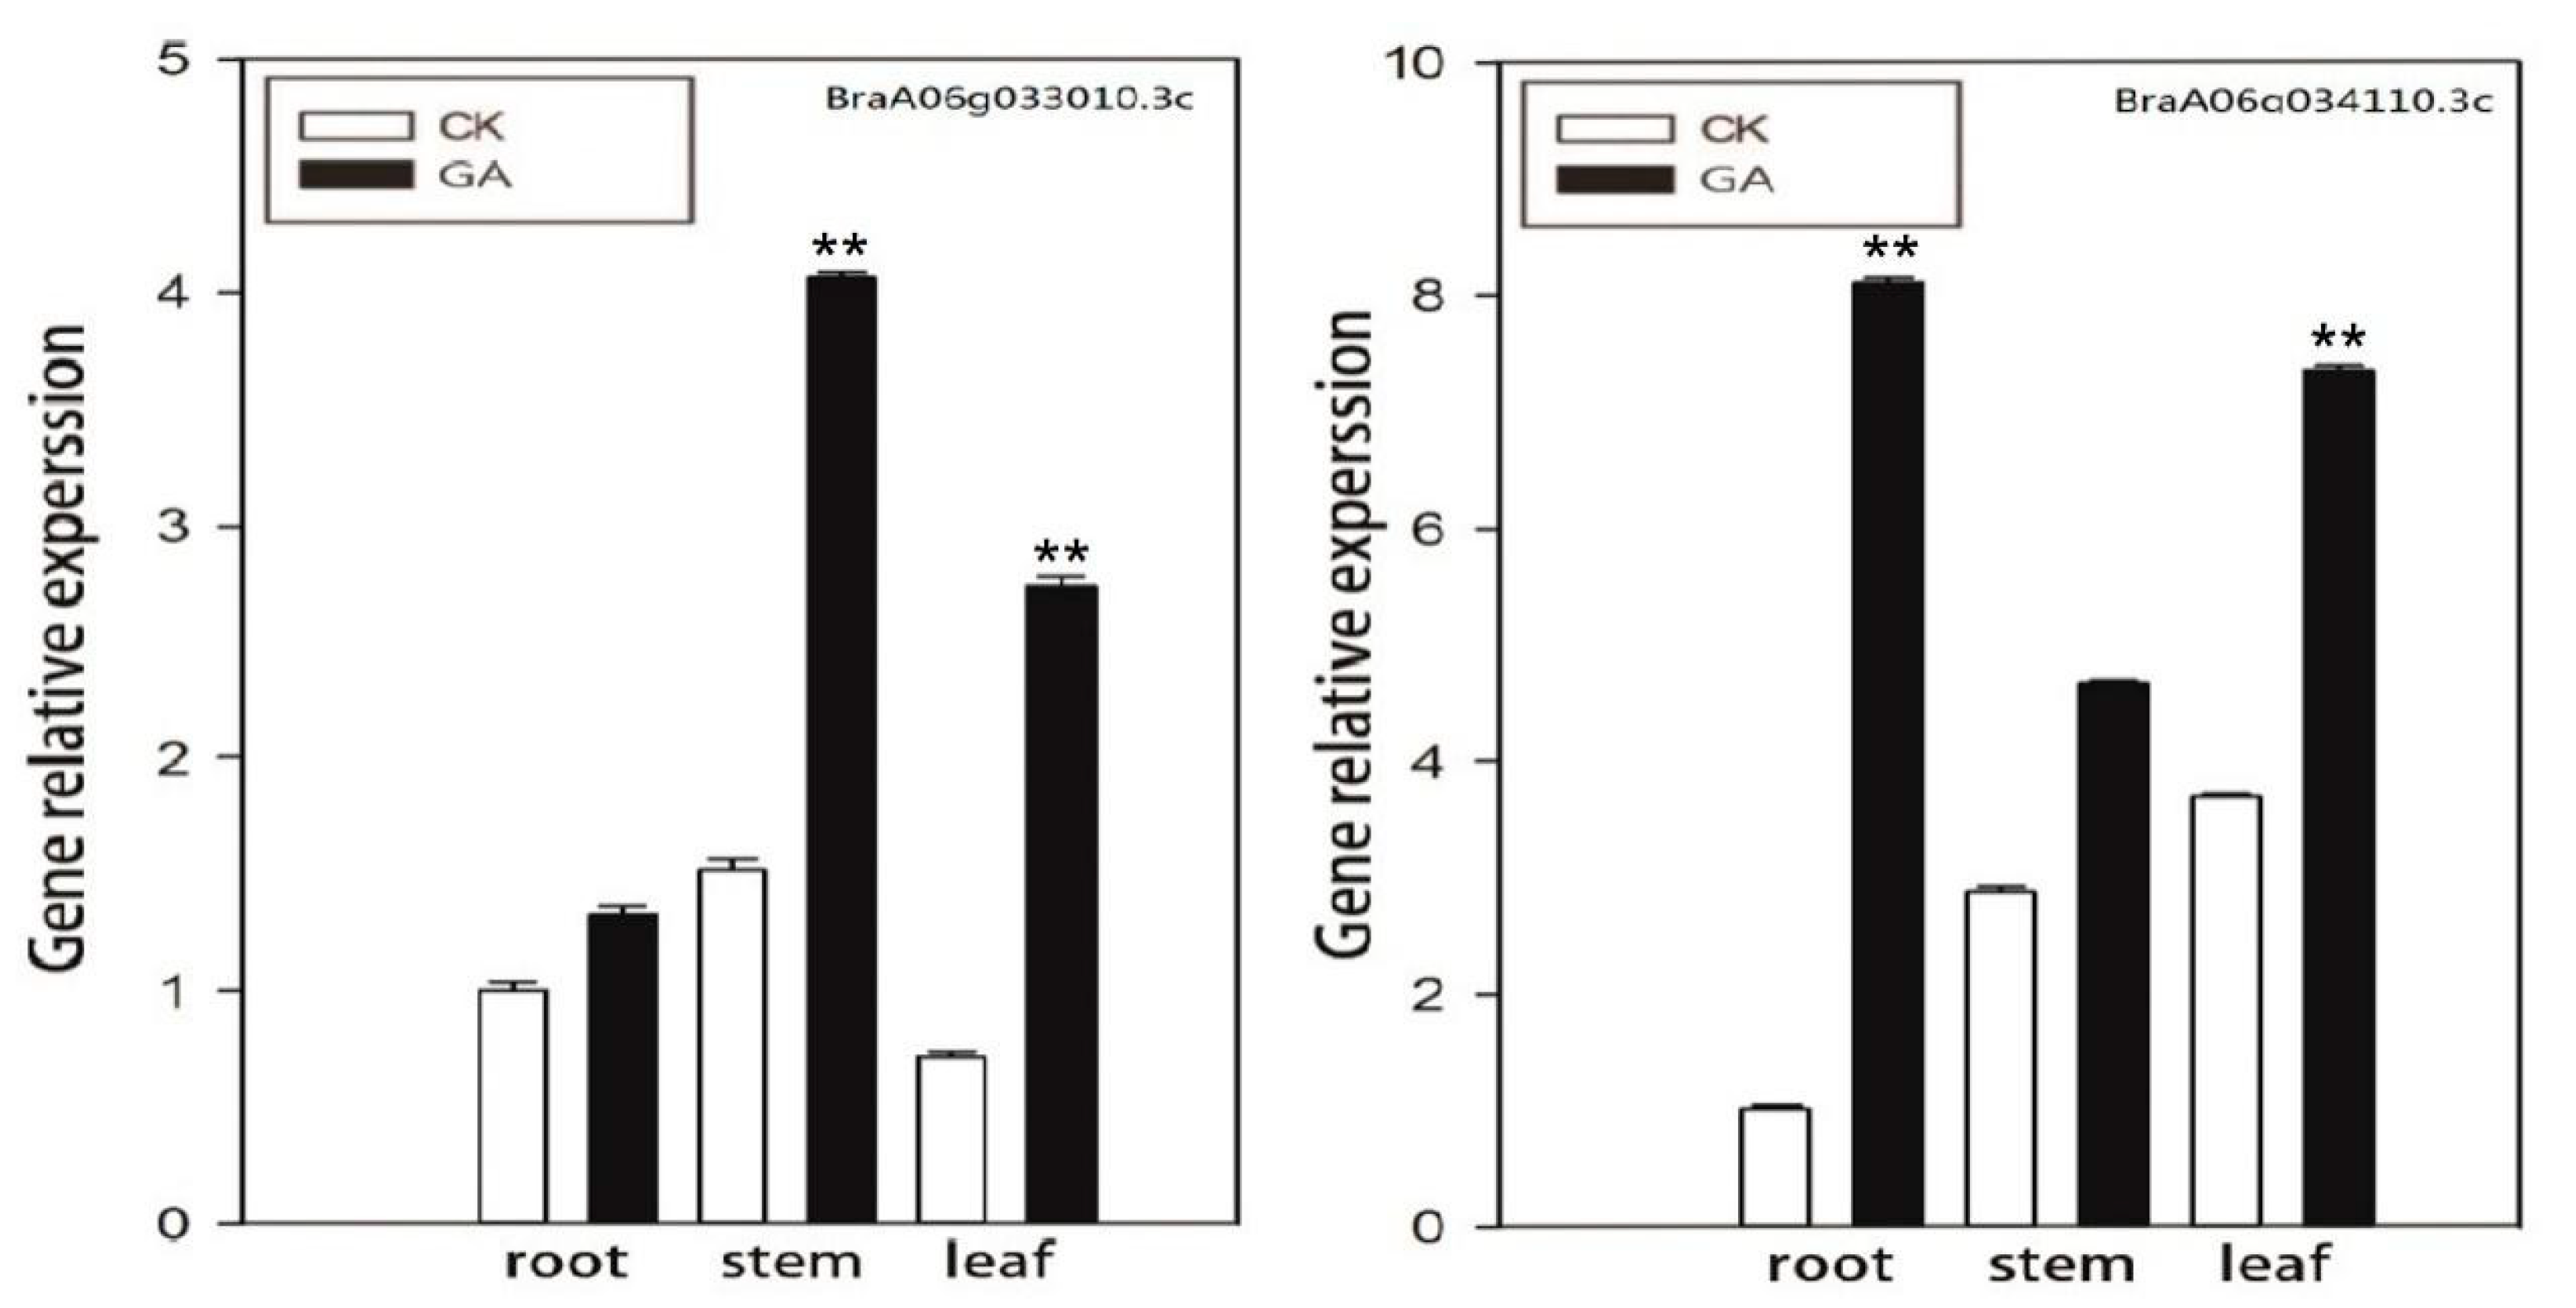
3.7. Expression Analysis of GA-Related Genes

QRT-PCR was used to detect the expression levels of the candidate genes in the dwarf mutant and sprayed individuals. Two specific primer sets, RT-22 and RT-41, were used to analyze the BraA06g033010.3C and BraA06g034110.3C genes. The results indicated that that the expression levels of the two genes were significantly upregulated in GA3-treated plants. The expression levels of BraA06g033010.3C and BraA06g034110.3C were significantly different in the leaf, stem, and root (Figure 7). Thus, BraA06g033010.3C and BraA06g034110.3C are candidate genes for Brcd1YS.

3.8. Sequence Variation Analysis of Candidate Genes

The sequences of the two candidate genes BraA06g033010.3C and BraA06g034110.3C from the two parents were obtained after map-based cloning, which were analyzed using DNAMAN V6.0 software (Lynnon BioSoft, Montreal, QC, Canada). The specific primer sets 33010-C and 34110-C were used to detect variations in the BraA06g033010.3C and BraA06g034110.3C sequences, respectively (Table S2). The sequence of BraA06g033010.3C comprises 2195 bp (22,597,175 to 22,599,369 bp), with six exons and five introns. Compared with the coding sequence (CDS) of YS, the CDS of Brcd1YS has a C base inserted at base 496, resulting in glutamine becoming lysine (Figure S2). The gene for BraA06g034110.3C comprises 1690 bp (23,226,835 to 23,228,525), with four exons and three introns. Compared with that of YS, the CDS of Brcd1YS has an A to G change at base 322, which results in threonine becoming alanine (Figure S3). These results further support BraA06g033010.3C and BraA06g034110.3C as candidate genes for dwarf mutant Brcd1YS.

4. Discussion

In the present study, phenotypic and cell morphology identification of Brcd1YS and YS revealed that the Brcd1YS exhibited geotropic growth during the entire growth period, and leaf and stem cells showed significant differences. Conventional mapping requires the development of many polymorphic primers and is time consuming. BSR-seq together with classical linkage analysis is a powerful tool to delineate candidate regions that control agronomic traits in a various crop [4,32,38]. In the present study, BSR-seq based on the F2 population derived from mutant Brcd1 and YS identified the candidate intervals responsible for the dwarf phenotype, which were further confirmed using linkage analysis.
The GA pathway is a major effector for plant height, in which GA1, GA3, GA4, and GA7 are the major bioactive GAs [39]. In our study, exogenous GA3 spraying rescued the phenotype of dwarf mutant, and BraA06g033010.3C and BraA06g034110.3C expression levels were significantly upregulated in the root, leaf, and stem by GA3, indicating that inhibition of GA synthesis affected plant morphogenesis. BraA06g033010.3C and BraA06g034110.3C are both key genes in the GA synthesis pathway. BraA06g033010.3C is homologous with Arabidopsis gene AT5G25900 and maize gene ZmGRF [34], which encode a member of the p450 family that is involved in GA biosynthesis. Studies suggested that ZmGRF overexpression in Arabidopsis promoted flowering and the flowering time, which was not affected by the photoperiod, and at the same time increased the cell size in leaves and stems, thereby changing the leaf morphology, similar to our study (Figure 2 and Figure 5) [36]. Lyu et al. [40] also identified this phenomenon in Arabidopsis. BraA06g034110.3C is homologous with Arabidopsis gene AT5G27320 and rice OsGID1, encoding a GA receptor gene with higher affinity to GA4, which can also interact with DELLA proteins in the presence of GA4 [28,40]. Griffiths et al. and Iuchi et al. found that loss of function of GID1 resulted in a dwarf phenotype in Arabidopsis that was not sensitive to GA, but showed signs of infertility [41,42]. These results contrasted with those of our study, in which exogenous GA3 spraying could restore the phenotype of the dwarf mutant. Our results demonstrated that the dwarf mutant was related to GA synthesis, but whether GA related genes in the candidate region control this phenotype requires validation using transgenic plants.
In this study, Brcd1YS showed extreme dwarfing, and is one of the few dwarf mutants found in B. rapa at present. Our results indicated that Brcd1 has a significant regulatory effect on the plant height, suggesting that it will be important for dwarf breeding in the future. B. rapa is frequently used for feed and oil seeds, and lodging resistance is very important in production [43]. Many studies have shown that dwarfing can increase the yield and improve plant stress tolerance, for example, in rapeseed and rice [44,45]. In addition, it was found that simultaneous knockout of all four BnaMAX1 homologous genes resulted in semi dwarfing and significantly increased the yield per plant [13]. During the Green Revolution, excessive use of nitrogen fertilizer led to crop collapse, and the development of dwarfing genes could help improve crop yields [9]. In this study, Pn, Ci, E, and Gs analyses showed that the stress tolerance of the plants was significantly improved; however, pollen viability detection indicated that the dwarf mutant was male sterile. Meanwhile, cell morphological observations were performed on the stems and leaves of two parents, Brcd1YS and YS. It was found that the median column cells and parenchymal cells in the stem were significantly larger than YS in Brcd1YS, and the leaf cells of Brcd1YS were irregularly arranged. Therefore, we think this may be one of the causes of plant dwarf. Kim et al. (2011) found that the dwarf phenotype exhibited by tyrosine decarboxylase transgenic rice is related to the irregular arrangement of leaf cells [46]; Jiang et al. (2012)’s results showed that the leaf epidermal cells and internode parenchyma cells of dwarf mutation in maize are irregular in shape and are arranged in a more random fashion [47]. Thus, to understand the mechanism of dwarfing, gene knockout using CRISPR-Cas9 could be used to create B. rapa with high quality and high yield.

5. Conclusions

In conclusion, we mapped a dwarf gene for B. rapa, Brcd1 to a physical interval of 3.06 Mb on chromosome A06. Brcd1 regulates the dwarf phenotype positively at all growth stages of B. rapa. Expression and annotation analysis identified the most likely candidate genes as BraA06g033010.3C and BraA06g034110.3C, both of which affect the synthesis of GA. Exogenous GA3 spraying could restore the phenotype, which further indicated that BraA06g033010.3C and BraA06g034110.3C were the most promising genes for the dwarf mutant phenotype. Our results provide a deeper understanding of the mechanisms of dwarf plant formation and supply a genetic resource for the study of crop improvement in B. rapa.

Supplementary Materials

The following supporting information can be downloaded at: https://www.mdpi.com/article/10.3390/horticulturae9020282/s1, Figure S1: ED5 values of differential SNPs distributed on Brassica rapa chromosomes based on the BSR-Seq data. SNP distributions on B. rapa chromosomes. The 10 chromosomes are shown on the x-axis and the ED5 values of the filtered SNP are on the y-axis; the horizontal bar indicates the top 1% threshold value. ED, Euclidean distance; SNP, single nucleotide polymorphism; Figure S2: The gene sequence of BraA06g033010.3C; Figure S3: The gene sequence of BraA06g034110.3C; Table S1: Identified phenotype mean value of YS and Brcd1YS; Table S2: Primers sequence; Table S3: Stem and leaf cell number as well as area statistics of YS and Brcd1YS; Table S4: Candidate gene annotation.

Author Contributions

Y.W. designed the experiments. J.H. and W.W. conducted the experiments, G.Q. wrote the manuscript, and performed the data analysis, X.G., Y.M., H.F., B.F. and C.H. assisted with the data analysis. G.Q., B.F. and Y.W. revised the manuscript. All authors reviewed and approved this submission. All authors have read and agreed to the published version of the manuscript.

Funding

This research was supported by the National Natural Science Foundation of China (grant number 32072569).

Data Availability Statement

The data used in this study are available from the author on reasonable request.

Acknowledgments

We would like to thank Scoot Woody (University of Wisconsin) for kindly providing the dwarf mutant seed.

Conflicts of Interest

The authors declare that they have no conflict of interests.

Ethical Statement

The authors note that this research was performed and reported in accordance with ethical standards of scientific conduct.

References

  1. Carpio, D.P.; Basnet, P.K.; De Vos, R.C.H.; Maliepaard, C.; Visser, C.; Bonnema, G. The patterns of population differentiation in a Brassica rapa core collection. Theor. Appl. Genet. 2011, 122, 1105–1118. [Google Scholar] [CrossRef] [Green Version]
  2. Fan, S.; Zhang, L.; Tang, M.; Cai, Y.; Liu, J.; Liu, H.; Liu, J.; Terzaghi, W.; Wang, H.; Hua, W.; et al. CRISPR/Cas9-targeted mutagenesis of the BnaA03.BP gene confers semi-dwarf and compact architecture to rapeseed (Brassica napus L.). Plant Biotechnol. J. 2021, 19, 2383–2385. [Google Scholar] [CrossRef] [PubMed]
  3. Muangprom, A.; Thomas, S.G.; Sun, T.P.; Osborn, T.C. A novel dwarfing mutation in a green revolution gene from Brassica rapa. Plant Physio. 2005, 137, 931–938. [Google Scholar] [CrossRef] [PubMed] [Green Version]
  4. Wang, Y.; Zhao, J.; Lu, W.; Deng, D. Gibberellin in plant height control: Old player, new story. Plant Cell. Rep. 2017, 36, 391–398. [Google Scholar] [CrossRef] [PubMed]
  5. Castorina, G.; Consonni, G. The role of Brassinosteroids in controlling plant height in Poaceae: A genetic perspective. Int. J. Mol. Sci. 2020, 11, 1191. [Google Scholar] [CrossRef] [Green Version]
  6. Yamaguchi, S. Gibberellin metabolism and its regulation. Annu. Rev. Plant Biol. 2008, 59, 225–251. [Google Scholar] [CrossRef]
  7. Davière, J.M.; Achard, P. Gibberellin signaling in plants. Development 2013, 140, 1147–1151. [Google Scholar] [CrossRef] [Green Version]
  8. Hartweck, L.M. Gibberellin signaling. Planta 2008, 229, 1–13. [Google Scholar] [CrossRef] [PubMed]
  9. Hedden, P. The genes of the Green Revolution. Trends Genet. 2003, 19, 5–9. [Google Scholar] [CrossRef] [PubMed]
  10. Tang, T.; Botwright Acuña, T.; Spielmeyer, W.; Richards, R.A. Effect of gibberellin-sensitive Rht18 and gibberellin-insensitive Rht-D1b dwarfing genes on vegetative and reproductive growth in bread wheat. J. Exp. Bot. 2021, 2, 445–458. [Google Scholar] [CrossRef] [PubMed]
  11. Peng, J.; Richards, D.E.; Hartley, N.M.; Murphy, G.P.; Devos, K.M.; Flintham, J.E.; Beales, J.; Fish, L.J.; Worland, A.J.; Pelica, F.; et al. ‘Green revolution’ genes encode mutant gibberellin response modulators. Nature 1999, 400, 256–261. [Google Scholar] [CrossRef] [PubMed]
  12. Tomlinson, L.; Yang, Y.; Emenecker, R.; Smoker, M.; Taylor, J.; Perkins, S.; Smith, J.; MacLean, D.; Olszewski, N.E.; Jones, J.D.G. Using CRISPR/Cas9 genome editing in tomato to create a gibberellin-responsive dominant dwarf DELLA allele. Plant Biotechnol. J. 2019, 17, 132–140. [Google Scholar] [CrossRef] [PubMed] [Green Version]
  13. Zheng, M.; Zhang, L.; Tang, M.; Liu, J.; Liu, H.; Yang, H.; Fan, S.; Terzaghi, W.; Wang, H.; Hua, W. Knockout of two BnaMAX1 homologs by CRISPR/Cas9-targeted mutagenesis improves plant architecture and increases yield in rapeseed (Brassica napus L.). Plant Biotechnol. J. 2020, 18, 644–654. [Google Scholar] [CrossRef] [Green Version]
  14. Zhao, B.; Li, H.; Li, J.; Wang, B.; Dai, C.; Wang, J.; Liu, K. Brassica napus DS-3, encoding a DELLA protein, negatively regulates stem elongation through gibberellin signaling pathway. Theor. Appl. Genet. 2017, 130, 727–741. [Google Scholar] [CrossRef] [PubMed]
  15. Muangprom, A.; Osborn, T.C. Characterization of a dwarf gene in Brassica rapa, including the identification of a candidate gene. Theor. Appl. Genet. 2004, 108, 1378–1384. [Google Scholar] [CrossRef]
  16. Yan, J.; Liao, X.; He, R.; Zhong, M.; Feng, P.; Li, X.; Tang, D.; Liu, X.; Zhao, X. Ectopic expression of GA 2-oxidase 6 from rapeseed (Brassica napus L.) causes dwarfism, late flowering and enhanced chlorophyll accumulation in Arabidopsis thaliana. Plant Physiol. Biochem. 2017, 111, 10–19. [Google Scholar] [CrossRef]
  17. Zhao, B.; Wang, B.; Li, Z.; Guo, T.; Zhao, J.; Guan, Z.; Liu, K. Identification and characterization of a new dwarf locus DS-4 encoding an Aux/IAA7 protein in Brassica napus. Theor. Appl. Genet. 2019, 132, 1435–1449. [Google Scholar] [CrossRef] [PubMed]
  18. Wei, T.; Zhang, L.; Zhu, R.; Jiang, X.; Yue, C.; Su, Y.; Ren, H.; Wang, M. A Gain-of-Function Mutant of IAA7 Inhibits Stem Elongation by Transcriptional Repression of EXPA5 Genes in Brassica napus. Int. J. Mol. Sci. 2021, 22, 9018. [Google Scholar] [CrossRef]
  19. Wang, Y.; Huang, S.; Liu, Z.; Tang, X.; Feng, H. Changes in endogenous phytohormones regulated by microRNA-target mRNAs contribute to the development of Dwarf Autotetraploid Chinese Cabbage (Brassica rapa L. ssp. pekinensis). Mol. Genet. Genom. 2018, 293, 1535–1546. [Google Scholar] [CrossRef] [PubMed]
  20. Wang, Y.; Liu, X.; Ji, X.; Zhang, L.; Liu, Y.; Lv, X.; Feng, H. Identification and validation of a major QTL controlling the presence/absence of leaf lobes in Brassica rapa L. Euphytica 2015, 205, 761–771. [Google Scholar] [CrossRef]
  21. Raj, J.D.; Nelson, J.A.; Rao, K.S. A study on the effects of some reinforcers to improve performance of employees in a retail industry. Behav. Modif. 2006, 30, 848–866. [Google Scholar] [CrossRef] [PubMed]
  22. Li, X.; Huang, S.; Liu, Z.; Hou, L.; Feng, H. Mutation in EMB1923 gene promoter is associated with chlorophyll deficiency in Chinese cabbage (Brassica campestris ssp. pekinensis). Physiol. Plant. 2019, 166, 909–920. [Google Scholar] [CrossRef]
  23. Arnon, D.I. Copper enzymes in isolated chloroplasts. Polyphenoloxidase in Beta vulgaris. Plant Physiol. 1949, 24, 1–15. [Google Scholar] [CrossRef] [PubMed] [Green Version]
  24. Tan, C.; Liu, Z.; Huang, S.; Feng, H. Mapping of the male sterile mutant gene ftms in Brassica rapa L. ssp. pekinensis via BSR-Seq combined with whole-genome resequencing. Theor. Appl. Genet. 2018, 132, 355–370. [Google Scholar] [CrossRef]
  25. Qu, G.; Gao, Y.; Wang, X.; Fu, W.; Sun, Y.; Gao, X.; Wang, W.; Hao, C.; Feng, H.; Wang, Y. Fine mapping and analysis of candidate genes for qFT7.1, a major quantitative trait locus controlling flowering time in Brassica rapa L. Theor. Appl. Genet. 2022, 135, 2233–2246. [Google Scholar] [CrossRef]
  26. Bolger, A.M.; Lohse, M.; Usadel, B. Trimmomatic: A flexible trimmer for Illumina sequence data. Bioinformatics 2014, 30, 2114–2120. [Google Scholar] [CrossRef] [PubMed] [Green Version]
  27. Zhang, L.; Cai, X.; Wu, J.; Liu, M.; Grob, S.; Cheng, F.; Liang, J.; Cai, C.; Liu, Z.; Liu, B.; et al. Improved Brassica rapa reference genome by single-molecule sequencing and chromo-some conformation capture technologies. Hortic Res. 2018, 5, 50. [Google Scholar] [CrossRef] [Green Version]
  28. Nakajima, M.; Shimada, A.; Takashi, Y.; Kim, Y.-C.; Park, S.-H.; Ueguchi-Tanaka, M.; Suzuki, H.; Katoh, E.; Iuchi, S.; Kobayashi, M.; et al. Identification and characterization of Arabidopsis gibberellin receptors. Plant J. 2006, 46, 880–889. [Google Scholar] [CrossRef]
  29. Li, H.; Handsaker, B.; Wysoker, A.; Fennell, T.; Ruan, J.; Homer, N.; Marth, G.; Abecasis, G.; Durbin, R. The Sequence Alignment/Map format and SAMtools. Bioinformatics 2009, 25, 2078–2079. [Google Scholar] [CrossRef] [Green Version]
  30. Su, A.; Song, W.; Xing, J.; Zhao, Y.; Zhang, R.; Li, C.; Duan, M.; Luo, M.; Shi, Z.; Zhao, J. Identification of Genes Potentially Associated with the Fertility Instability of S-Type Cytoplasmic Male Sterility in Maize via Bulked Segregant RNA-Seq. PLOS ONE 2016, 11, e0163489. [Google Scholar] [CrossRef] [Green Version]
  31. Murray, M.G.; Thompson, W.F. Rapid isolation of high molecular weight plant DNA. Nucl. Acids Res. 1980, 8, 4321–4325. [Google Scholar] [CrossRef] [PubMed] [Green Version]
  32. Gao, Y.; Huang, S.; Qu, G.; Fu, W.; Zhang, M.; Liu, Z.; Feng, H. The mutation of ent-kaurene synthase, a key enzyme involved in gibberellin biosynthesis, confers a non-heading phenotype to Chinese cabbage (Brassica rapa L. ssp pekinensis). Hortic. Res. 2020, 1, 178. [Google Scholar] [CrossRef]
  33. Livak, K.J.; Schmittgen, T.D. Analysis of relative gene expression data using real-time quantitative PCR and the 2(-Delta Delta C(T)) Method. Methods 2001, 25, 402-8. [Google Scholar] [CrossRef]
  34. Livak Narasimhan, V.; Danecek, P.; Scally, A.; Xue, Y.; Tyler-Smith, C.; Durbin, R. BCFtools/RoH: A hidden Markov model approach for detecting autozygosity from next-generation sequencing data. Bioinformatics 2016, 32, 1749–1751. [Google Scholar] [CrossRef] [Green Version]
  35. Huang, S.N.; Liu, Z.Y.; Yao, R.P.; Li, D.Y.; Feng, H. Comparative transcriptome analysis of the petal degeneration mutant pdm in Chinese cabbage (Brassica campestris ssp pekinensis) using RNA-seq. Mol. Genet. Genom. 2015, 290, 1833–1847. [Google Scholar] [CrossRef] [PubMed]
  36. Xu, M.; Lu, Y.; Yang, H.; He, J.; Hu, Z.; Hu, X.; Luan, M.; Zhang, L.; Fan, Y.; Wang, L. ZmGRF, a GA regulatory factor from maize, promotes flowering and plant growth in Arabidopsis. Plant Mol. Biol. 2015, 87, 157–167. [Google Scholar] [CrossRef] [PubMed]
  37. Zhong, M.; Zeng, B.; Tang, D.; Yang, J.; Qu, L.; Yan, J.; Wang, X.; Li, X.; Liu, X.; Zhao, X. The blue light receptor CRY1 interacts with GID1 and DELLA proteins to repress GA signaling during photomorphogenesis in Arabidopsis. Mol. Plant 2021, 2, 1328–1342. [Google Scholar] [CrossRef]
  38. Fu, W.; Huang, S.; Gao, Y.; Zhang, M.; Qu, G.; Wang, N.; Liu, Z.; Feng, H. Role of BrSDG8 on bolting in Chinese cabbage (Brassica rapa). Appl Genet. 2020, 133, 2937–2948. [Google Scholar] [CrossRef]
  39. Wang, S.; Wang, Y. Harnessing hormone gibberellin knowledge for plant height regulation. Plant Cell. Rep. 2022, 41, 1945–1953. [Google Scholar] [CrossRef]
  40. Guizhen, L.; Dongbing, L.; Shaoshan, L.; Hongpeng, H. STO and GA negatively regulate UV-B-induced Arabidopsis root growth inhibition. Plant Signal. Behav. 2019, 14, 1675471. [Google Scholar] [CrossRef]
  41. Griffiths, J.; Murase, K.; Rieu, I.; Zentella, R.; Zhang, Z.L.; Powers, S.J.; Gong, F.; Phillips, A.L.; Hedden, P.; Sun, T.P.; et al. Genetic characterization and functional analysis of the GID1 gibberellin receptors in Arabidopsis. Plant Cell. 2006, 18, 3399–3414. [Google Scholar] [CrossRef] [Green Version]
  42. Uchi, S.; Suzuki, H.; Kim, Y.C.; Iuchi, A.; Kuromori, T.; Ueguchi-Tanaka, M.; Asami, T.; Yamaguchi, I.; Matsuoka, M.; Kobayashi, M.; et al. Multiple loss-of-function of Arabidopsis gibberellin receptor AtGID1s completely shuts down a gibberellin signal. Plant J. 2007, 50, 958–966. [Google Scholar] [CrossRef] [PubMed]
  43. Guo, Z.; Liu, X.; Zhang, B.; Yuan, X.; Xing, Y.; Liu, H.; Luo, L.; Chen, G.; Xiong, L. Genetic analyses of lodging resistance and yield provide insights into post-Green-Revolution breeding in rice. Plant Biotechnol. J. 2021, 19, 814–829. [Google Scholar] [CrossRef] [PubMed]
  44. Zhao, C.; Yang, L.; Tang, M.; Liu, L.; Huang, J.; Tong, C.; Xiang, Y.; Liu, S.; Cheng, X.; Xie, M. Genome-wide association study reveals a GLYCOGEN SYNTHASE KINASE 3 gene regulating plant height in Brassica napus. Front. Plant Sci. 2022, 2, 1061196. [Google Scholar] [CrossRef] [PubMed]
  45. Shearman, J.R.; Vejchasarn, P.; Naktang, C.; Phansenee, Y.; Jomchai, N.; Lanceras-Siangliw, J.; Tangphatsornruang, S.; Toojinda, T. Rice height QTLs in KDML105 chromosome segment substitution lines. Genomics 2022, 114, 482–487. [Google Scholar] [CrossRef] [PubMed]
  46. Kim, Y.S.; Park, S.; Kang, K.; Lee, K.; Back, K. Tyramine accumulation in rice cells caused a dwarf phenotype via reduced cell division. Planta 2011, 233, 251–260. [Google Scholar] [CrossRef] [PubMed]
  47. Jiang, F.; Guo, M.; Yang, F.; Duncan, K.; Jackson, D.; Rafalski, A.; Wang, S.; Li, B. Mutations in an AP2 transcription factor-like gene affect internode length and leaf shape in maize. PLoS ONE 2012, 7, e37040. [Google Scholar] [CrossRef] [Green Version]
Figure 1. Phenotypic characterization of Brcd1YS and YS. The dwarf mutant ‘Brcd1YS’ (right) and wild-type ‘YS’ (Yellow Sarson, left) grown under natural conditions. Scale bars = 10 cm.
Horticulturae 09 00282 g001
Figure 2. Phenotype characterization of Brcd1YS and YS. The plant height, leaf length, and leaf width were used for the phenotypic characterization of Brcd1YS and YS, all the traits presented a normal distribution. (A): plant height, (B): leaf length, (C): leaf width. Data are shown as presented the mean ± SD (n = 10 plants). ** p < 0.01.
Horticulturae 09 00282 g002
Figure 3. Evaluation of the roots of Brcd1YS and YS. Images of the roots of Brcd1YS and YS. (A): YS, (B): Brcd1YS. Scale bars = 1 mm.
Horticulturae 09 00282 g003
Figure 4. Pollen viability determination of Brcd1YS and YS. Pollen viability determination of Brcd1YS and YS. (A): YS, (B): Brcd1YS. Scale bars = 20 µm.
Horticulturae 09 00282 g004
Figure 5. Stem and leaf cell morphology of Brcd1YS and YS. Paraffin sections were used to identify the stem and leaf cell morphologies of Brcd1YS and YS. (A): Stem cross section of YS; (B): stem cross section of Brcd1YS, scale bars = 1 mm. (C): Magnified stem section of YS; (D): magnified stem section of Brcd1YS, scale bars = 50 µm. (E): Leaf section of YS; (F): leaf section of Brcd1YS, scale bars = 200 µm. (G): Magnified leaf section of YS; (H): magnified leaf section of Brcd1YS, scale bars = 20 µm.
Horticulturae 09 00282 g005
Figure 6. Phenotypes of the Brcd1YS in response to exogenous gibberellin (GA3) treatment. The dwarf mutant ‘Brcd1YS’ (left) and dwarf mutant ‘Brcd1YS’ treated with GA3 (right) grown under natural conditions. The plants are shown at 45 days after sowing (DAS). Scale bars = 10 cm.
Horticulturae 09 00282 g006
Figure 7. Expression patterns of gibberellin (GA)-related genes in plant tissue. Expression levels of BraA06g033010.3C and BraA06g034110.3C in the leaf, stem and root according to quantitative real-time reverse transcription PCR (qRT-PCR) analysis. Error bars indicate the standard errors (n = 3); white is mutant Brcd1YS is shown in white and GA treatment is shown in black, ** p < 0.01.
Horticulturae 09 00282 g007
Table 1. Evaluation of the physiological indices of YS and Brcd1YS.
Photosynthetic Rate
(μmol m−2s−1)
Intercellular CO2 Concentration
(μmol mol−1)
Transpiration Rate
(mmol m−2s−1)
Stomatal Conductance
(mmol m−2s−1)
Chlorophyll a
(mg g−1 FW)
Chlorophyll b
(mg g−1 FW)
Total
Chlorophyll
(mg g−1 FW)
Carotenoid
(mg g−1 FW)
YS20.44 ± 1.49404 ± 4.056.17 ± 0.306.17 ± 16.151.61 ± 0.010.47 ± 0.032.08 ± 0.040.52 ± 0.03
Brcd1YS25.91 ± 0.74 *390 ± 3.31 *5.04 ± 0.28 *7.69 ± 25.0 *1.67 ± 0.01 *0.55 ± 0.03 *2.20 ± 0.02 *0.46 ± 0.02 *
Note: * p < 0.05.
Disclaimer/Publisher’s Note: The statements, opinions and data contained in all publications are solely those of the individual author(s) and contributor(s) and not of MDPI and/or the editor(s). MDPI and/or the editor(s) disclaim responsibility for any injury to people or property resulting from any ideas, methods, instructions or products referred to in the content.

