1. Introduction
Photosynthetic processes in the callus tissues support the scale up of their biomass production [
1] and, therefore, are important for developing effective plant tissue techniques for the conservation of rare plant species and the micropropagation of agricultural, horticultural and ornamental plants. Photomixotrophic and photoautotrophic callus cultures of plant cells are promising objects for the genetic engineering of photosynthesis [
2]. Photosynthesis in callus tissues seems to be a suitable experimental model to study cell metabolism without tissue-specific correlations [
3]. Photosynthetic activity in calluses is of interest from the point of view of CO
2 balance regulation within the tissue culture vessels [
4]. In addition, callus photosynthetic processes may be closely related to morphogenesis (photomorphogenesis). Thus, tomato chlorenchyma cells were shown to play a crucial role in promoting shoot primordia formation and subsequent shoot regeneration [
5].
Overall, the above and other works clearly show that the distinctive features of callus photosynthesis need to be studied in detail. However, only a small number of studies have addressed this issue. Photosynthesis in callus tissues has been studied since pioneering works by Hanson and Edelman [
6] and Berlyn and Zelitch [
7]. Photomixotrophic and photoautotrophic plant cells in culture were shown to maintain photosynthetic parameters comparable to plant leaves [
8,
9]. Transmission electron microscopy (TEM) studies have shown that the Rubisco activity and ultrastructure of
Zea mays chloroplasts are close to that of the leaf mesophyll [
3]. However, in this work, photosynthesis studies were performed without taking into consideration cell differentiation within the callus bodies. Thus, the callus bodies were represented by different tissue types: embryogenic and non-embryogenic tissues undergoing different stages of development [
10]. An embryogenic callus may be distinguished into a compact callus or a friable callus [
11,
12]. In contrast to a friable callus, a compact callus may be green when cultivated under light [
13], and, therefore, only the compact callus is of interest for photosynthesis research. In
Zoysia matrella compact calluses, chloroplasts were found in the cells located below the base of regenerated plantlets [
14]. However, a detailed comparative representation of the ultrastructure of calluses and mesophyll chloroplasts based on TEM images was not provided in any of these or other works.
Comparative studies of the photosynthetic primary light reactions in the callus and mesophyll are also of great interest. It was shown [
15] that the quantum yield of photosystem II (PSII) for dark-adapted states, F
v/F
m, in
Eutrema salsugineum calluses previously grown under blue light was strongly lowered (0.17) compared to that in calluses grown under red (0.35) and white light (0.42), whereas the typical F
v/F
m value in the leaves of most plants exceeds 0.8 [
16]. The typical F
v/F
m value was detected in potato plantlets cultivated in vitro under blue light (0.82), but, on the contrary, under red light, it was lowered to 0.65 [
17]. However, the F
v/F
m value was measured in these works using a standard PAM fluorometer equipped with only a single-color source of measuring light and a white light source of saturating light. It should be noted in this connection that the F
v/F
m in the leaves of the red-light-adapted (for 15 days) plants differed from that of blue-light-adapted plants by only 3–4% if it was measured using a conventional (monocolor) PAM fluorometer [
18]. At the same time, the difference between red- and blue-light-adapted (even within a few dozens of minutes) leaves was much more significant if the F
v/F
m was measured, on the one hand, using red measuring and red saturating light, and, on the other hand, using blue measuring and blue saturating light [
19]. Unfortunately, such multicolor PAM-fluorometric measurements were not performed on callus tissues. Thus, the color-addressed effects attributable to the primary light reactions in the photosynthesizing calluses evidently exist and differ from that in leaves, but their patterns still remain unclear.
A limited number of works have been devoted to studying the dark reactions of photosynthesis in callus tissues. Bender [
20] has shown that there are both C3 and C4 photosynthetic pathways observable in
14CO
2-fixation experiments with
Daucus carota callus tissue, although
D. carota is normally a C3 plant. The characterization of O
2 exchange and of some enzymes and metabolites of CO
2 assimilation indicated that a chlorophyllous
Solanum tuberosum (C3 plant) callus grown on a carbohydrate-free medium developed the photosynthetic pathway typical of C3 plants [
21]. The Rubisco activity in
Zea mays (C4 plant) calluses was 3–3.5 times lower compared to that in green leaves, if calculating per chlorophyll
a +
b and soluble protein. However, there were only granal chloroplasts observed in
Z. mays calluses, but not agranal ones, which are typical for the bundle sheath cells of
Z. mays and other C4 plants [
5].
Until now, there have been no data published on the net CO
2 assimilation kinetics excited in green calluses in response to turning on an actinic light, although such data may give important information related to dark photosynthetic reactions [
22,
23].
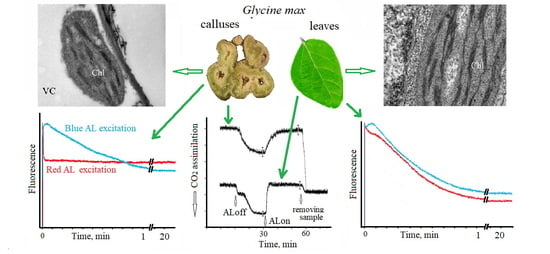
In this work, we show that green Glycine max compact callus tissues contained granal chloroplasts in the senescent cells that exhibited sequestration of cytoplasm, whereas chlorophylless friable callus tissues (having low vacuolization) contained only agranal plastids. Nevertheless, such a green tissue exhibited a rather high level of CO2 assimilation under blue (but not under red) light. Chlorophyll fluorescence kinetics in green callus tissues (studied through a method of video registration) drastically differed depending on the color of actinic light applied: red or blue. In addition, the green callus tissues demonstrated a one-step CO2 assimilation kinetics, whereas green leaves displayed a two-step CO2 assimilation kinetics. The possible causes of this are discussed.
The results obtained contribute to our knowledge on how to evaluate, control and interpret the photosynthetic parameters of callus photosynthesis.
2. Materials and Methods
2.1. Plant Material and Tissue Culture
Vegetable soybean plants, G. max (L.) Merr., var. “Delicates” (“Russkiy ogorod”, Shchelkovo, Moscow region, Russia) were grown for 3 weeks in a greenhouse, in 1 L vegetation vessels for each plant, filled with a mix of soil, perlite, vermiculite and sand (1:1:1:1) with the addition of a starting nutrient mix of NH4H2PO4 (200 mg kg−1), KNO3 (170 mg kg−1) and Ca(NO3)2 (250 mg kg−1 of dry soil mix mass). The plants were cultivated under standard conditions: air temperature of 28/19 ± 1 °C (day/night), relative air humidity of 70%, relative soil moisture of 60–70%, light/dark regime of 14 h/10 h and photosynthetic photon flux density (PPFD) of 300 µmol photons m−2 s−1 (white LEDs).
The leaves were cut from 3-week-old plants and used in the experiments no later than 5 min after cutting.
The samples of hypocotyls were sterilized in a mix (1:1) of 70% ethanol and 3% H
2O
2 for 5 min, washed using distilled water for 5 min, cut into 5–8 mm long segments and then placed into culture vessels containing Murashige and Skoog medium [
24], pH 5.9, with 1 mg/L 2,4D (2,4-dichlorophenoxyacetic acid), 1 mg/L BAP (6-benzylaminopurine), 1 mg/L α-NAA (α-naphtyl acetic acid), 30 g/L sucrose and 6 g/L agar. The explants were cultivated in the dark at 28 °C for a 14-day period, at the end of which the induction of callus growth was observed. Further cultivation was carried out for 30 days at 26 °C, light/dark regime of 14 h/10 h and a PPFD of 100 µmol photons m
−2 s
−1 (white LEDs). After another 60 days of cultivation under the same conditions, the calluses were used in the experiments.
2.2. Measurements of CO2 Assimilation Rates and Dark Respiration
Measurements of the CO
2 assimilation rates and dark respiration were performed according to the previously described method [
25].
G. max leaves were placed into 0.25 mL water-filled mini-tubes via their petioles, where they were encapsulated. Leaves with the mini-tubes and calluses were placed in a flat, parallel glass chamber (100 × 50 × 5 mm) fed through a pneumatic line communicating with a digital gas flowmeter, humidifier, gas flow stabilizer and gas balloon with compressed air. The air flow was adjusted to 100 mL min
−1, and the relative air humidity was 60%. The input CO
2 level (Q
0) was 420 ppm. The output of the chamber was connected with a non-dispersive infrared CO
2-sensor IRM300 (SemeaTech, Shanghai, China) communicating with a PC via a USB port. The CO
2 levels were measured every 3 s for 40 min in response to switching a red actinic light (80 µmol photons m
−2 s
−1) on at 10
th min after the beginning of measurements. The data were saved into a text log file, from which the corresponding kinetic curves were obtained.
The net CO
2 assimilation rate was calculated on the wet-weight basis as follows:
or it was calculated on the square basis (only for leaves) as follows:
where ΔpCO
2P is the difference between output CO
2 concentrations in the dark (Q
R) and light (Q
P) (
Figure 1),
Vair is the air volume flow rate,
Ms is the sample’s (callus or leaf) wet mass,
Sleaf is the leaf square and 7.44 × 10
−7 is a complex coefficient for the conversion of ppm/mL to nmol and min to s.
The dark respiration rate was calculated on the wet-weight basis as follows:
or it was calculated on the square basis (only for leaves) as follows:
where ΔrCO
2R is the difference between input (Q
0) and output (Q
R) CO
2 concentrations in the dark (
Figure 1).
Sleaf was measured using a PC scanner and ImageJ 1.53t software.
2.3. Transmission Electron Microscopy
Samples of callus tissues were fixed in 2.5% glutaraldehyde (Sigma-Aldrich, Bellefonte, PA, USA, washed in phosphate buffer (pH 7.4) and additionally post-fixed in 1% OsO4 solution on phosphate buffer for 16 h at 2–4 °C. Next, the samples were dehydrated in an ascending-graded ethanol series, passed through three changes of propylene oxide and embedded in Epon 812. Semi-thin and ultrathin sections were cut with an EM UC 6 ultramicrotome (Leica Microsystems, Wetzlar, Germany) using an ultra 45° diamond knife (Diatome, Nidau, Switzerland). Further, the semi-thin sections were stained with methylene blue and observed with a Leica DM 6000 (Leica, Microsystems, Wetzlar, Germany) light optical microscope. The ultrathin sections were contrasted with uranyl acetate and lead citrate and then viewed under a Jem 1011 (Jeol, Tokyo, Japan) transmission electron microscope at 80 kV.
2.4. Measuring Chlorophyll Content
The chlorophyll (
a +
b) concentration was measured according to Lichtenthaller and Buschmann [
26] in ethanol extracts as follows: C
a+b = (13.36 A
664.1 − 5.19 A
648.6) + (27.43 A
648.6 − 8.12 A
664.1), where A
648.6 and A
664.1 are the values of absorbance at the specific wavelengths (648.6 and 664.1 nm, respectively). Further, the chlorophyll content was calculated on the wet-mass basis (for leaves and compact callus tissues) and on the square basis (for leaves only).
2.5. Measuring Chlorophyll Fluorescence Kinetics
The photoinduction curves were obtained by processing the video recording of chlorophyll fluorescence [
27] excited in response to white actinic light. The actinic light was excited using two 10 W blue LEDs applying an incident illumination of 80 µmol photons m
−2 s
−1 at the section surface of a cut sample of callus or at the adaxial leaf side. The video was recorded using an ultrasensitive CCD video camera (VNC-748-H3 EVS, St. Petersburg, Russia) equipped with an interference filter (λ
max = 740 nm). After a dark adaptation of the sample for 20 min, image acquisition was performed at a frequency of 25 frames per second for 6 min. The actinic light was turned on just 5 s after starting the video capture, which was executed via VDub 1.8.1 software. The recorded *.avi files were converted to an image sequence (*.bmp file series) using the same software. During the following data processing, the obtained sequence was opened with ImageJ software. Then, regions of interest (ROIs) were selected in the images of whole leaves or in the areas corresponding to the green regions of cut samples of calluses displayed in the single frame of the opened sequence. Photoinduction curves were obtained for each of the ROIs (one ROI for one callus,
n = 8, or one ROI for one leaf,
n= 8) using ImageJ.
The fluorescence decrease ratios (R
fd) were calculated for each photoinduction curve as R
fd = (F
p − F
st)/F
st, where F
p—peak fluorescence and F
st—steady-state fluorescence. The value of R
fd (also called the “vitality index”) is considered as an appropriate index for assessing the photosynthetic performance and correlates with CO
2 assimilation rates [
28,
29].
2.6. Measuring Quantum Yields of Photosystem II (PSII) in Leaves and Calluses for Dark- and Light-Adapted States
The maximal quantum yields of PSII for dark-adapted states (F
v/F
m) and the operational quantum yield of PSII for light-adapted states (F
v’/F
m’) [
30] were measured using a pulse-amplitude-modulated (PAM) fluorometer DivingPAM (Waltz, Effeltrich, Germany). The measuring light, saturating flashes (both emitted from the fiber optic cable lug of Diving-PAM) and actinic light (white LED, 80 µmol photons m
−2 s
−1) were applied to the adaxial leaf side or to the green areas of section surfaces of cut samples of calluses.
2.7. Adjusting Photon Fluxes
The levels of photosynthetic photon flux density (PPFD) were measured and adjusted using the PPFD sensor of a Diving-PAM fluorometer.
2.8. Statistical Analysis
The testing of statistically significant differences between the photosynthetic parameters (through an ANOVA test) and the evaluation of mean ± SD were performed using Microsoft Excel 2010 software. Measurements of chlorophyll content, fluorescence and CO2 assimilation kinetics were repeated three times, each including eight leaves: one leaf from eight plants. In all cases, no significant (p > 0.05) differences were found between the three repetitions. In all these kinds of experiments, the maximal (from three repetitions) SD was chosen and is presented in the Results section.
3. Results
The cultivation of
G. max calluses under the conditions of the experiment led to the formation of calluses having a clear differentiation between green compact and white (or yellowish) friable callus tissues (
Figure 2 and
Figure 3). The compact callus tissue was arranged in a concentric layer around the friable callus core (
Figure 2). In contrast to the compact callus tissue, the friable callus tissue was composed of cells with sharp, uneven edges (
Figure 3). The compact callus tissue had inclusions of densely located cells (
Figure 3), which are commonly referred [
31] to as meristemoids.
Chloroplasts with a clearly exhibited granal structure were observed in the cells of the compact callus tissue; however, these cells showed strongly marked signs of senescence—very thin layer of cytoplasm and cytoplasm sequestration, rupture of the vacuolar membrane, delamination of the cytoplasm from the cell wall and targeting of organelles (including chloroplasts) into vacuoles, with a low number or absence of mitochondria (
Figure 4A,B,D,E). The chloroplast membranes were often destroyed (
Figure 4C). The non-targeted compact callus chloroplasts were located mostly in the delaminated cytoplasm (
Figure 4B). In contrast, friable callus cells had a thick layer of cytoplasm separated from the vacuole by an intact membrane and contained a significant number of mitochondria (
Figure 4G,H). The vacuoles of the friable tissue cells did not contain targeted organelles. Thus, the friable tissue ultrastructure indicated a much higher metabolic state of its cells compared to the compact callus tissue. However, there were no chloroplasts revealed in the friable callus tissue. Unfortunately, we could not find chloroplast-containing tissue that could be the precursor to compact callus tissue.
Some chloroplasts of compact callus cells had an oval shape and a small number (2–3) of large grana, each containing an average of 20–25 thylakoids (visible in slice) (
Figure 4A,D), whereas the palisade mesophyll chloroplasts of leaves (
Figure 4C,F) and some compact callus chloroplasts of another type (
Figure 4B,E) had small grana.
The chlorophyll content in the calluses and leaves was 0.50 and 3.45 mg chl a + b g−1 tissue wet weight, respectively. When calculating on the leaf square basis, it was 190 mg m−2.
This study shows that CO
2 assimilation in compact green callus tissue was not excited by red light but was quite significant when excited by blue light (
Figure 1), conceding to that in leaves (compared on a wet-mass basis) only by a factor of 1.5 (
Table 1). CO
2 assimilation in calluses started to increase strongly and immediately after the actinic light was turned on and achieved a constant rate (ΔpCO
2P = 130–134 ppm) at 20 min (one-step kinetics). In contrast, CO
2 assimilation in leaves started rapidly but weakly, keeping a relatively constant intermediate level (ΔpCO
2P = 52–55 ppm) from 2 to 7 min after the start and achieving a final constant rate (ΔpCO
2P = 178–182 ppm) also at 20 min (two-step kinetics) (
Figure 1). In other words, CO
2 assimilation in the leaves occurred with some lag period.
The amplitude of fluorescence kinetics excited by red actinic light in calluses was significantly lower than that of leaves (R
fd 0.67 and 2.97, accordingly), and the same was true in the case of blue actinic light (R
fd of 0.80 and 2.07, accordingly) (
Table 1,
Figure 5). Despite a small difference in R
fd values between red- and blue-light fluorescence kinetics (R
fd 0.67 and 0.80) excited in calluses, the corresponding photoinduction curves drastically differed in shape. Red actinic light induced a sharp peak lasting 10–15 s, after which a steady-state fluorescence was rapidly attained (
Figure 5). In contrast, blue actinic light induced a fast fluorescence rise and then slowly declined for 8–16 min (
Figure 5). At the same time, the fluorescence kinetics excited in the leaves was weekly dependent on the actinic light color by amplitude and shape (
Figure 5). After an initial fast rise, the corresponding photoinduction curves both (for red and blue light) showed a slow and deep decline.
The maximal quantum yields of PSII for dark-adapted plants, F
v/F
m, and the operational quantum yield of PSII for light-adapted plants, Fv’/Fm’, in calluses were significantly (2–2.5 times) lower than that in leaves (
Table 1).
4. Discussion
In this work, the one-step kinetics of CO
2 assimilation was found to be different in calluses compared to that in leaves, where it occurs in two steps. Similarly, we previously observed a similar two-step kinetics in the leaves of
Morus nigra, Ficus benjamina and
Ailanthus altissima plants. Such a kinetics was also revealed in the work of Cubas et al. [
20] in phylogenetically linked C3 and C4
Alloteropsis species. The authors proposed that (i) it may be related to the restriction of CO
2 exchange caused by a delay in stomatal opening at the first phase of the CO
2 assimilation (low-amplitude lag phase) or (and) (ii) it could be due to the fact that only the C3 cycle is activated in the first phase (fast activation), whereas the C4 cycle is activated later, in the second phase (slow activation). Thus, the loss of the lag period of CO
2 assimilation kinetics in the calluses compared to the leaves is not surprising considering the absence of stomata and indications of the possible C3/C4 functional balance changes in their tissues [
3].
Hourly time scale measurements of the CO
2 exchange have shown that CO
2 uptake in the
G. max calluses, in contrast to leaves, cannot compensate for the respiration, being three to four times lower than the dark respiratory CO
2 release. At first sight, it seems to be caused by the lowered (by three to four times) chlorophyll content in calluses compared to leaves. However, an analogy can be made here with those leaves that have a strongly lowered chlorophyll concentration (C
chl) in their chlorophyll-deficient tissues, which, nevertheless, does not lead to a sufficient decrease in the photosynthetic activity and CO
2 assimilation. Even at C
chl values below 15–20% of the C
chl in normal green leaves, the chlorophyll-deficient leaf tissues maintain a level of photosynthesis close to that of normal green leaves [
32]. This is partly a result of the higher efficiency of photosynthesis [
33]. In addition, it can be explained by the laws of optics. Thus, the photochemical utilization of light is directly proportional to the fraction of absorbed light, which may be calculated as follows: F = 1 − J/J
0, where J is the output light flux and J
0 is the input light flux. At the same time, in accordance with the Lambert–Beer law, the chlorophyll concentration C
chl (as well as concentration of any other pigment) is proportional to the optical density, D, which, in turn, is proportional to the decimal logarithm of the J/J
0 ratio: C
chl = D/ε × l = −lg(J/J
0)/ε × l, where ε is the chlorophyll-specific molar absorption coefficient and l is the optical path length. Therefore, C
chl = −lg(1 − F)/ε × l. From this equation, it is easy to calculate, for example, that, if C
chl is decreased by a factor of 6.45, from 100% to 15.5% of the initial value, F will only decrease by a factor of 3. In our experiments, the net photosynthetic CO
2 assimilation in the calluses was 2.7 times lower (in absolute values) than the CO
2 release during dark respiration, whereas in the leaves it was 3.4 times higher than that during dark respiration. Thus, the low CO
2 assimilation in calluses cannot be explained by their low chlorophyll content but is consistent with the low electron transport rates (evaluated by F
v/F
m and R
fd) and the senescent character of the callus photosynthetic tissues observed (see below).
Along with the color-dependent difference in the CO
2 assimilation kinetics, a significant difference was revealed between fluorescence kinetics excited in calluses by blue (gradual fluorescence decrease) and red (sharp peak at the beginning of the photoinduction curve) light. We cannot exclude that this may be related to the different occurrences of the phenomenon of fluorescence quenching within the divergent electron transport pathways. The phenomenon is known to be based on two distinct processes: non-photochemical quenching (NPQ) and photochemical quenching (qP). NPQ is the main response of the light phase of photosynthesis to overexcitation [
34]. The level of NPQ under a PPFD of 80 µmol photons m
−2 s
−1 may be neglected in this study because such a low applied PPFD does not lead to significant levels of NPQ [
30]. The qP phenomenon is caused by the electron transfer from the excited molecule of P
680* (RC of PSII) further forward into the electron transport chain (ETC), as a result of that the electron cannot return to the ground state of P
680, and, therefore, cannot emit a quantum of fluorescence [
35]. In the first few seconds after switching the actinic light on, the ETC does not function; the electron transport is very low, and the fluorescence is maximal. As the chain begins to transfer electrons, the fluorescence decreases. The fluorescence decrease rate strongly depends on the electron sink from the ETC (if it is working in the non-cyclic or linear electron transport, LET, mode) which is mostly based on the functioning of the Calvin–Benson cycle (C3) and CO
2 assimilation [
36]. Because the remaining ETC section from P
680 to the ferredoxin-NADP
+ reductase and C3 cycle comprises a long and highly complicated pathway, the electron transport throughout ETC attains a steady-state level for a relatively long time, within 15–20 min after the beginning of illumination. It results in a slow and gradual decline of the photoinduction curve.
Another situation occurs in the case of the cyclic electron transport around photosystem II through cytochrome b559 (CET-PSII), when the electron pathway is enclosed, short and independent of the sink from the ETC [
37]. In this case, the electron transport may reach a steady-state rate in a short time, resulting in the appearance of a short and sharp peak at the beginning of the photoinduction curve. We observed such a sharp peak rapidly turning to a constant level of fluorescence in studies of the chlorophyll-deficient sectors of variegated
Ficus benjamina leaves. We have proposed that it is due to CET-PSII [
38]. Similarly, in this work, the look-alike peak may point to CET-PSII in the
G. max calluses under red light, which is consistent with their zero (at least below the detection limit of the method) light-induced CO
2 assimilation. In this regard, it should be noted that CET-PSII does not result in CO
2 assimilation, only providing ATP synthesis [
36,
39]. However, further studies are necessary to prove the participation of CET-PSII in the given case.
Evidently, the lowered amplitude of fluorescence kinetics, R
fd and F
v/F
m values measured in the green
G. max callus tissues compared with leaf tissues are relevant to their senescence-associated cell ultrastructural features observed. Surprisingly, such tissues remained visually viable and maintained a small but quite measurable level of photosynthesis for at least 15–30 days. Despite the fact that a large percentage of chloroplasts had an undamaged structure, we did not find any chloroplasts in the cytoplasm separated from the vacuole by an intact membrane. All the cells studied that showed no signs of senescence belonged to the friable embryogenic callus tissues and did not have chloroplasts among their plastids. Therefore, the intermediate stage of
G. max callus development in which “healthy” (non-senescent) cells contain normal chloroplasts was rapidly transient or absent. Evidently, it may be not so in the case of other plant species or other conditions of cultivation, as it appeared, for example, in studies in which non-senescent, chloroplast-containing callus tissues were observed along with [
40] or without [
2] senescent ones.
5. Conclusions
The results obtained in this work have demonstrated that green Glycine max callus tissue is composed of cells containing granal chloroplasts, which are structurally distinct from the mesophyll chloroplasts of leaves. The senescent features of these cells raise a practical question for future studies, whether the appearance of senescence in compact callus tissues is unavoidable or whether it may be repaired by optimizing cultivation conditions, thus improving the callus tissue’s quality and health. The photosynthetic characteristics of compact callus cells revealed in this work indicate that green calluses are an interesting model for studying the alterations in photosynthetic functions governed by processes of cell senescence.
The observed senescent cells are still able to maintain photosynthesis, but it is too weak to compensate for respiratory CO2 uptake. Photosynthesis in calluses differs from photosynthesis in leaves in the CO2 assimilation kinetics (one-step and two-step type, respectively). In contrast to the leaves, photosynthesis in G. max calluses is strongly dependent on the color of actinic light. This means that researchers should consider and choose the actinic light spectrum carefully when attempting to increase callus biomass production or attempting to influence photomorphogenesis in callus tissues.
In addition, the data obtained may be useful in the development of plant tissue culture methods that require consideration of the contribution of photosynthesis to the CO2 balance in closed culture vessels. Evidently, among them may be new methods of conservation of rare plant species and micropropagation of agricultural, horticultural and ornamental plants.

 ,
, 


