Article

Callus Induction and Plant Regeneration from Carum copticum and Assessment of Antioxidant Responses and Phytochemical Profiling by In Vitro Salinity Stress

by
Roya Razavizadeh
1,*,
Fatemeh Adabavazeh
1,2,
Marzieh Rezaee Chermahini
1 and
Setsuko Komatsu
3,*
1
Department of Biology, Payame Noor University, Tehran 19395-3697, Iran
2
Department of Biology, Shahid Bahonar University, Kerman 76169-14111, Iran
3
Department of Applied Chemistry and Food Science, Fukui University of Technology, Fukui 910-8505, Japan
*
Authors to whom correspondence should be addressed.
Horticulturae 2023, 9(1), 22; https://doi.org/10.3390/horticulturae9010022
Submission received: 31 October 2022 / Revised: 19 December 2022 / Accepted: 20 December 2022 / Published: 23 December 2022
(This article belongs to the Special Issue New Advances in Molecular Biology of Horticultural Plants)

Abstract

:
Higher production of secondary metabolites is one of the adaptive responses to alleviate the impact of environmental injuries. In the present investigation, the production of these metabolites with medicinal importance induced by salinity in Carum copticum was investigated. To develop a better way for the production of medicinal substances, callogenesis and plant regeneration were analyzed, and seeds, calli, and/or regenerated seedlings were exposed to different concentrations of NaCl under in vitro culture conditions. The maximum frequency of callus induction was obtained on a medium supplemented with 0.25 mg L−1 2, 4-dichlorophenoxyacetic (2,4-D) and 1 mg L−1 benzyl amino purine (BAP) from stem explants. Plant regeneration with multiple shoots was obtained from pieces of callus transferred to MS medium fortified with 0.25 mg L−1 2,4-D and 1.5 mg L−1 BAP. Four weeks after treatment, salinity induced a substantial increase in the accumulation of reducing sugars and proline as compatible osmolytes and the activity of antioxidant enzymes. Total phenolics and anthocyanin significantly increased in all samples with increasing NaCl concentrations; however, the regenerated seedlings showed a reduction in these compounds at severe NaCl concentration compared to the control. Moreover, NaCl enhanced thymol, γ-terpinene, sabinene, and myrcene in the seedlings and calli, as well as carvacrol, limonene, and α-terpinene in the regenerated seedlings. These results suggest that salinity has a marked impact on improving the content of antioxidant metabolites and essential oils in C. copticum, whose callus might be the most salt tolerant in all tested samples.

1. Introduction

The secondary metabolites of the plant have a multifunctional role in the growth and developmental processes of plants, reactive-oxygen species (ROS) scavenging, and response to environmental stressors [1]. Additionally, in the last decades, many experimental studies, along with some clinical trials, showed that essential oils have potent antioxidant, immunomodulatory, anti-inflammatory, and antimicrobial properties, which offer promising approaches to the synthesis and development of new drugs [2]. Concerning the higher production of most of these metabolites is part of the defense mechanism associated with increased resistance to stress, secondary metabolisms can be increased by the addition of biotic and abiotic elicitors to the culture media [3]. Hence, this has led to the use of a considerable number of elicitors through the plant in vitro cultures for enhancing and improving the production of the metabolites in plant cells.
Salinity, which is potentially damaging to plants, is emphasized as an abiotic stress that can increase the production or even induce de novo synthesis of secondary metabolites under in vitro conditions [4]. Significant numbers of findings unravel that the presence of high levels of secondary metabolites and antioxidants is an adaptation to salinity [5,6]. Salinity stress has short or long-term effects on plants; disrupting homeostasis in water potential is regarded as short-term, while disrupting ion balance has long-term effects [7]. Plants alter their physiology and biosynthesis of the metabolites for recognition and adaptation to saline conditions. This may involve changes in growth, adjustments in photosynthetic rates, osmotic adjustments, and alterations in the metabolism of bioactive compounds [8]. Numerous studies have confirmed the effectiveness of the utilization of in vitro salt stress in the mass production of plant secondary metabolites [9,10]. Accordingly, in vitro salt stress can be considered as a powerful approach to improve the biosynthesis of special secondary metabolites and pharmaceuticals.
In vitro culture systems were provided with practical alternative approaches to improving and enhancing the production of natural metabolites of crucial commercial value [11]. Among all in vitro techniques, callus induction and plant regeneration techniques may enhance the potential for achieving this goal. They enable the production of a large number of raw plant materials in small explants obtained from a mother seedling in a short time so that there could be alternative ways for the conservation and rapid multiplication of many indigenous rare, threatened, and valuable medicinal plants [12]. Therefore, elicitation of in vitro cultures through the application of salinity and comparing their responses to salt stress for selection of the most salt-tolerant in vitro culture with high production of secondary metabolites has a great value.
Carum copticum L. or Ajwain is one of the valuable medicinal herbs native to Iran that is overexploited by herbalists because of its pharmacological metabolites without replenishment. It is an annual herb with white flowers and grayish seeds in the family Apiaceae, providing phytochemicals for the pharmaceutical, food, and cosmetic sectors. Both the seed-like fruit and leaves of the plant are mainly used for treating the common cold, colic, dyspepsia, indigestion, and diarrhea, though there was renewed interest in this plant as a source of metabolites with anti-inflammatory, antiseptic, antimicrobial, carminative, antiparasitic, and antitussive effects [13]. In addition, the effects of this plant in the treatment of peptic ulcer and acute inflammation in rats and liver injury in mice have been demonstrated [14]. Previous studies indicated that C. copticum produces a complex mixture of chemical constituents, involving flavonoids, phenolics, and essential oils (terpiene, thymol, β-pinene, and p-cymene), which are responsible for its biological activities [15]. Due to the gathering of leaves and seeds as sources of medicine, wild species are facing a severe threat of extinction and degradation of genetic diversity. The condition is further deteriorated by its habitat degradation. Therefore, propagation and conservation, as well as increasing its natural pharmacological metabolites by in vitro culture techniques, are of great importance for the rehabilitation of C. copticum.
This study aimed to investigate the potential of in vitro regeneration capacity and callus induction of C. copticum to synthesize main pharmacological metabolites and to evaluate whether in vitro salt stress can improve the production of these metabolites. For this purpose, in the first part of this study, a fast and effective regeneration and callus induction protocol for C. copticum was established. Then, the effects of salinity treatment on physiological parameters, antioxidant metabolites, and essential oil contents of C. copticum in different in vitro systems, which include seedlings, calli, and regenerated seedlings, were studied.

2. Materials and Methods

2.1. Seed Culture and Preparation of Explants

C. copticum seeds were provided by Pakan Bazr company (Isfahan, Iran). After surface sterilization with 70% (v/v) ethanol, 20% (v/v) of commercial bleach solution, and sterile water, the seeds were cultured in Murashige and Skoog nutrient medium (MS) [16] comprising 30 g L−1 sucrose and 10 g L−1 agar–agar (Merck, Darmstadt, Germany). All media were maintained in a growth chamber set at 25 ± 2 °C on a 16 h light/8 h dark cycle.

2.2. Callus Induction and Plant Regeneration of C. copticum

Different explants (leaf, stem, and root) were taken from four-week-old growing seedlings under sterile conditions. The explants were transferred to MS medium supplemented with 36 different concentrations of plant growth regulators [2,4-Dichlorophenoxyacetic acid (2,4-D; 0.0, 0.25, 0.5, 1, 1.5, 2 mg L−1) and benzyl amino purine (BAP; 0.0, 0.25, 0.5, 1, 1.5, 2 mg L−1)] provided by Sigma-Aldrich. All cultures were held in a culture room (16 h light: 8 h dark photoperiod, 25 ± 2 °C and 95% relative humidity). For six weeks, callus induction percentages and morphological changes of calli formed were measured and recorded to optimize a basal medium for callogenesis.
To develop an efficient protocol for shoot regeneration, the calli formed were placed on the MS basal media supplemented with different concentrations of 2,4-D (0.0, 0.25, and 0.5 mg L−1) and BAP (0.0, 0.25, 0.5, 1, 1.5, 2 mg L−1). After incubation for four weeks in the culture room, the number of shoots per explant and shoot length was recorded. The regenerated shoots were excised from the parent culture and transferred for rooting to MS basal medium containing different concentrations of indole-3-acetic acid (IAA; 0.0, 0.5, and 1 mg L−1) and indole-3-butyric acid (IBA; 0.0, 0.5 and 1 mg L−1; Sigma-Aldrich, St. Louis, MO, USA). The rooting percentage, number of roots per shoot, and root length were recorded after five weeks of culture.

2.3. Salt Treatment

Ten disinfected seeds were placed on MS medium supplemented by 0, 25, 50, 100, and 150 mM NaCl (Merck, Rahway, NJ, USA). All cultures were kept in the growth chamber. Four weeks after treatment, the effects of salt on proline, reducing sugar, total phenolic, anthocyanin, protein contents, antioxidant enzyme activities, and essential oils were investigated in the shoot of C. copticum.
After optimization of callus induction, the stem explants of aseptically grown seedlings were placed on MS medium with 1 mg L−1 BAP and 0.25 mg L−1 2,4-D. Four weeks after callus induction, calli were subcultured on the same medium and maintained at 25 ± 2 °C in the darkness for four weeks. The subculture was repeated every month. After three subcultures, calli were placed on the MS medium, including 1 mg L−1 BAP, 0.25 mg L−1 2,4-D, and the above-mentioned concentrations of NaCl. After four weeks, the above-mentioned traits were analyzed in calli. Furthermore, to investigate callus induction percentage under salinity stress, the stem explants about 0.5 cm in length were placed directly on MS medium containing 1 mg L−1 BAP, 0.25 mg L−1 2,4-D, and 0, 25, 50, 100, 150, and 200 mM NaCl. All cultures were kept in the darkness in a growth chamber. Callus induction percentage and fresh weight were evaluated during the four-week growth period.
Regenerated seedlings were re-cultured directly onto the MS medium supplemented with NaCl and kept in a culture room for four weeks. Then, the effects of salt on proline, reducing sugar, total phenolic, anthocyanin, protein contents, antioxidant enzyme activities, and essential oils were analyzed in regenerated seedlings.

2.4. Measuring Amount of Proline

Proline content was determined by employing a ninhydrin reaction [17]. A portion (0.1 g) of fresh tissue (shoots and calli) was extracted with 10 mL of 3% (w/v) sulfosalicylic acid (Merck), and the mixture was passed through Whatman number 2 paper (Whatman, Maidstone, UK). After extraction, 2 mL of ninhydrin reagent, glacial acetic acid (Sigma- Aldrich), and the filtered extract were mixed together. First, all mixtures were incubated at 100 °C for 1 h and then cooled rapidly in an ice bath. After adding 4 mL of toluene to the reaction solution, absorbance was recorded at 520 nm with a spectrophotometer (U-6305 model; Jenway, Staffordshire, UK). To calculate proline contents, a standard curve was developed using a series of proline standards, and the result was expressed as mg g−1 fresh weight.

2.5. Measuring Amount of Reducing Carbohydrates

Reducing carbohydrate content was determined by adapting the method reported previously [18]. A portion (0.1 g) of fresh tissue (shoots and calli) was homogenized with 10 mL of water and then heated in a boiling water bath until the boiling point was reached. After that, the sample was immediately cooled and passed through the Whatman paper (Number 2). The obtained extract (2 mL) was mixed with 2 mL of alkaline copper tartrate, which was prepared by dissolving 0.45 g hydrated cupric sulfate, 0.75 g tartaric acid, and 4 g anhydrous sodium carbonate by adjusting the volume to 100 mL of distilled water. After incubation at 80 °C for 20 min, the alkaline copper (II) tartrate-plant extract solution was mixed with 2 mL of phosphomolybdate solution. The resulting blue color absorbance was read at 600 nm. Sugar concentration was estimated from a standard curve, which was drawn by standard concentrations of glucose, and the result was reported as mg g−1 fresh weight.

2.6. Protein Extraction and Enzyme Assay

A portion (0.1 g) of fresh tissue (shoots and calli) was homogenized in 2 mL of 25 mM sodium phosphate buffer (pH 7.8). The extraction was centrifuged at 10,000× g for 20 min at 4 °C. Then, the supernatant was collected for measurement of protein concentration and antioxidant enzyme activities, described as follows.
Protein Concentration: The total amount of protein was analyzed according to the Bradford method [19] with slight modification. The absorbance was read at 595 nm, and the results were expressed as mg g−1 fresh weight. A standard curve was developed using standard concentrations of bovine serum albumin.
Antioxidant Enzyme Activities: The activity of superoxide dismutase (SOD) was estimated by adding 100 μL of the extracts to 1900 μL of a reaction mixture comprising 50 mM sodium phosphate buffer (pH 7.8), 0.1 mM ethylenediaminetetraacetic acid (EDTA), 50 mM Na2CO3, 1 μM riboflavin, 12 mM L-methionine, and 75 μM p-nitro blue tetrazolium chloride in dark conditions, following the previous protocol [20]. The reaction was lighted for 10 min under a fluorescent lamp (45 μmol m−2s−1), and the blank was incubated in the darkness. The absorbance was recorded at 560 nm. In the described conditions, the absorbance in the sample without enzyme extract was assumed to be 100%, and the enzyme activity was calculated by determining the percentage of NBT inhibition per minute. One unit of SOD was identified as the amount of enzyme needed to prevent 50% (w/v) NBT photo-reduction rate in 1 min, and the activity was reported as unit mg−1 protein.
The activity of catalase (CAT) was analyzed based on the Aebi protocol [21]. The reaction mixture contained 850 µL of 50 mM sodium phosphate buffer (pH 7), 50 μL of enzyme extract, and 100 μL of 37% (v/v) H2O2. The reduction of absorbance due to CAT activity was recorded at 240 nm (extinction coefficient 36 mM−1cm−1), and the activity was expressed as unit mg−1 protein.
The activity of ascorbate peroxidase (APX) was estimated in a 1 mL reaction mixture, which was composed of 50 mM sodium phosphate buffer (pH 7.0), 0.2 M EDTA, 0.5 mM ascorbic acid, 250 mM H2O2, and 100 μL extract. The reduction in ascorbic acid was measured at 290 nm (extinction coefficient 2.8 mM−1cm−1) [22]. The activity was reported as a unit of mg−1 protein.

2.7. Measuring of Total Phenolic Content

Total phenolic content was assayed using 95% (v/v) ethanol [23]. A portion (0.1 g) of shoot and callus was extracted with 5 mL of ethanol and incubated for 72 h at 25 °C. This solution was centrifuged at 4000× g for 10 min at 25 °C. Afterward, 1 mL supernatant was added to 1 mL of 5% (w/v) aqueous sodium carbonate, 3 mL of distilled water, 1 mL of ethanol, and 0.5 mL of 50% (v/v) Folin–Ciocalteu phenol reagent (Merck) and maintained for 1 h at 25 °C in the dark. The absorbance was recorded at 725 nm. To calculate phenolic substance, a standard curve was drawn by standard concentrations of gallic acid (Merck), and results were shown as mg of gallic acid g−1 FW.

2.8. Measuring of Anthocyanin Content

Anthocyanin was analyzed by a modified method using acidified methanol (Methanol: HCl 99: 1 v/v) [24]. A portion (0.1 g) of shoots and calli was homogenized in 5 mL of acidified methanol and kept at 25 °C for 24 h in the dark. After centrifugation of the homogenate at 4000× g for 10 min at room temperature, the absorbance of each supernatant was measured at 550 nm. The extinction coefficient 33,000 (mM−1 cm−1) was used to calculate the amount of total anthocyanin expressed as μmol g−1 FW.

2.9. Determination of Essential Oils

Essential oil components in C. copticum were identified by gas chromatography–mass spectrometry (GC/MS). In this regard, a Hewlett–Packard 5890 GC (Hewlett Packard, Waldbronn, Germany) was used. It was equipped with an HP-5 (50 m × 0.20 mm; cross-linked phenyl–methyl silicon) column with 0.25 μm film thickness and flame ionization detector (HP-5970 mass-selective detector). 100–250 °C with changes of 4 °C min−1 and 70 eV were considered as the temperature program and ionization energy, respectively. Helium as carrier gas was used, the flow through the column was 1 mL min−1, and the split ratio was set to 100:1. Identification was established upon sample retention time, and mass was recorded [25,26].

2.10. Statistical Analysis

All experiments were conducted in a completely random design with three replicates using analysis of variance (ANOVA) with Duncan’s tests at the 5% level. One-way ANOVA was utilized for the effect of salinity on callus induction and callus fresh weight of C. copticum. Moreover, to test the significance of NaCl, samples and their interaction effects in other parameters, two-way ANOVA was utilized. The result was given as averages ± standard error.

3. Results

3.1. Callus Induction and Plant Regeneration

The frequency of callus induction from different explants in response to different combinations of plant growth regulators (PGRs) is shown in Table 1 and Table 2. The results showed varying degrees of callus formation on MS medium with different concentrations of 2,4-D and BAP in both leaf and stem explants, while no callus formation was observed on the MS medium without PGRs. Callus induction rate and callus weight were significantly influenced by the explant type and PGR concentrations. The observation indicated that stem explants produced more and better-quality calli than leaf explants. The maximum callus induction rates (100%) and callus weights (1.04 g) were observed at 1 mg L−1 BAP and 0.25 mg L−1 2,4-D from the stem explant (Table 2). These calli were greenish–yellow, hard, and friable, indicating that they were typical of embryogenic callus.
Among the various treatments tested, BAP, as a strong cytokinin, could encourage shoot regeneration without any other PGRs (Table 3). However, the higher concentration of BAP along with 2,4-D was more effective for maximum shoot induction. MS medium fortified with 0.25 mg L−1 2,4-D and 1.5 mg L−1 BAP showed the highest regeneration rate (80%), number of shoots (31 ± 0.48) and shoot length (1.01 ± 0.02) after five weeks of culture (Figure 1A). The regenerated shoot on MS medium containing various concentrations of IBA and IAA alone or in combination with each other showed varied response with respect to the rooting percentage and the number of roots obtained (Table 4). The best results were obtained with MS medium supplemented by 1 mg L−1 IAA. The rooting percentage was 63%, and the number of roots per shoot and root length was 7.7 ± 0.26 and 0.91 ± 0.01, respectively (Figure 1B).

3.2. Effects of In Vitro Salt Stress on Callus Induction Percentage and Fresh Weight

After four weeks of NaCl treatment, a meaningful reduction of the callus induction percentage and fresh weight was obtained with higher concentrations of NaCl. The minimum percentage of callus induction and fresh weight was obtained at 200 mM NaCl compared to the control (Figure 2). The impact of increasing salt concentration on the callus phenotype of C. copticum is shown in Figure 3. The friable yellowish–green calli were achieved from callus grown at 100 and 150 mM NaCl, while the callus color appeared brown under 200 mM NaCl treatment.

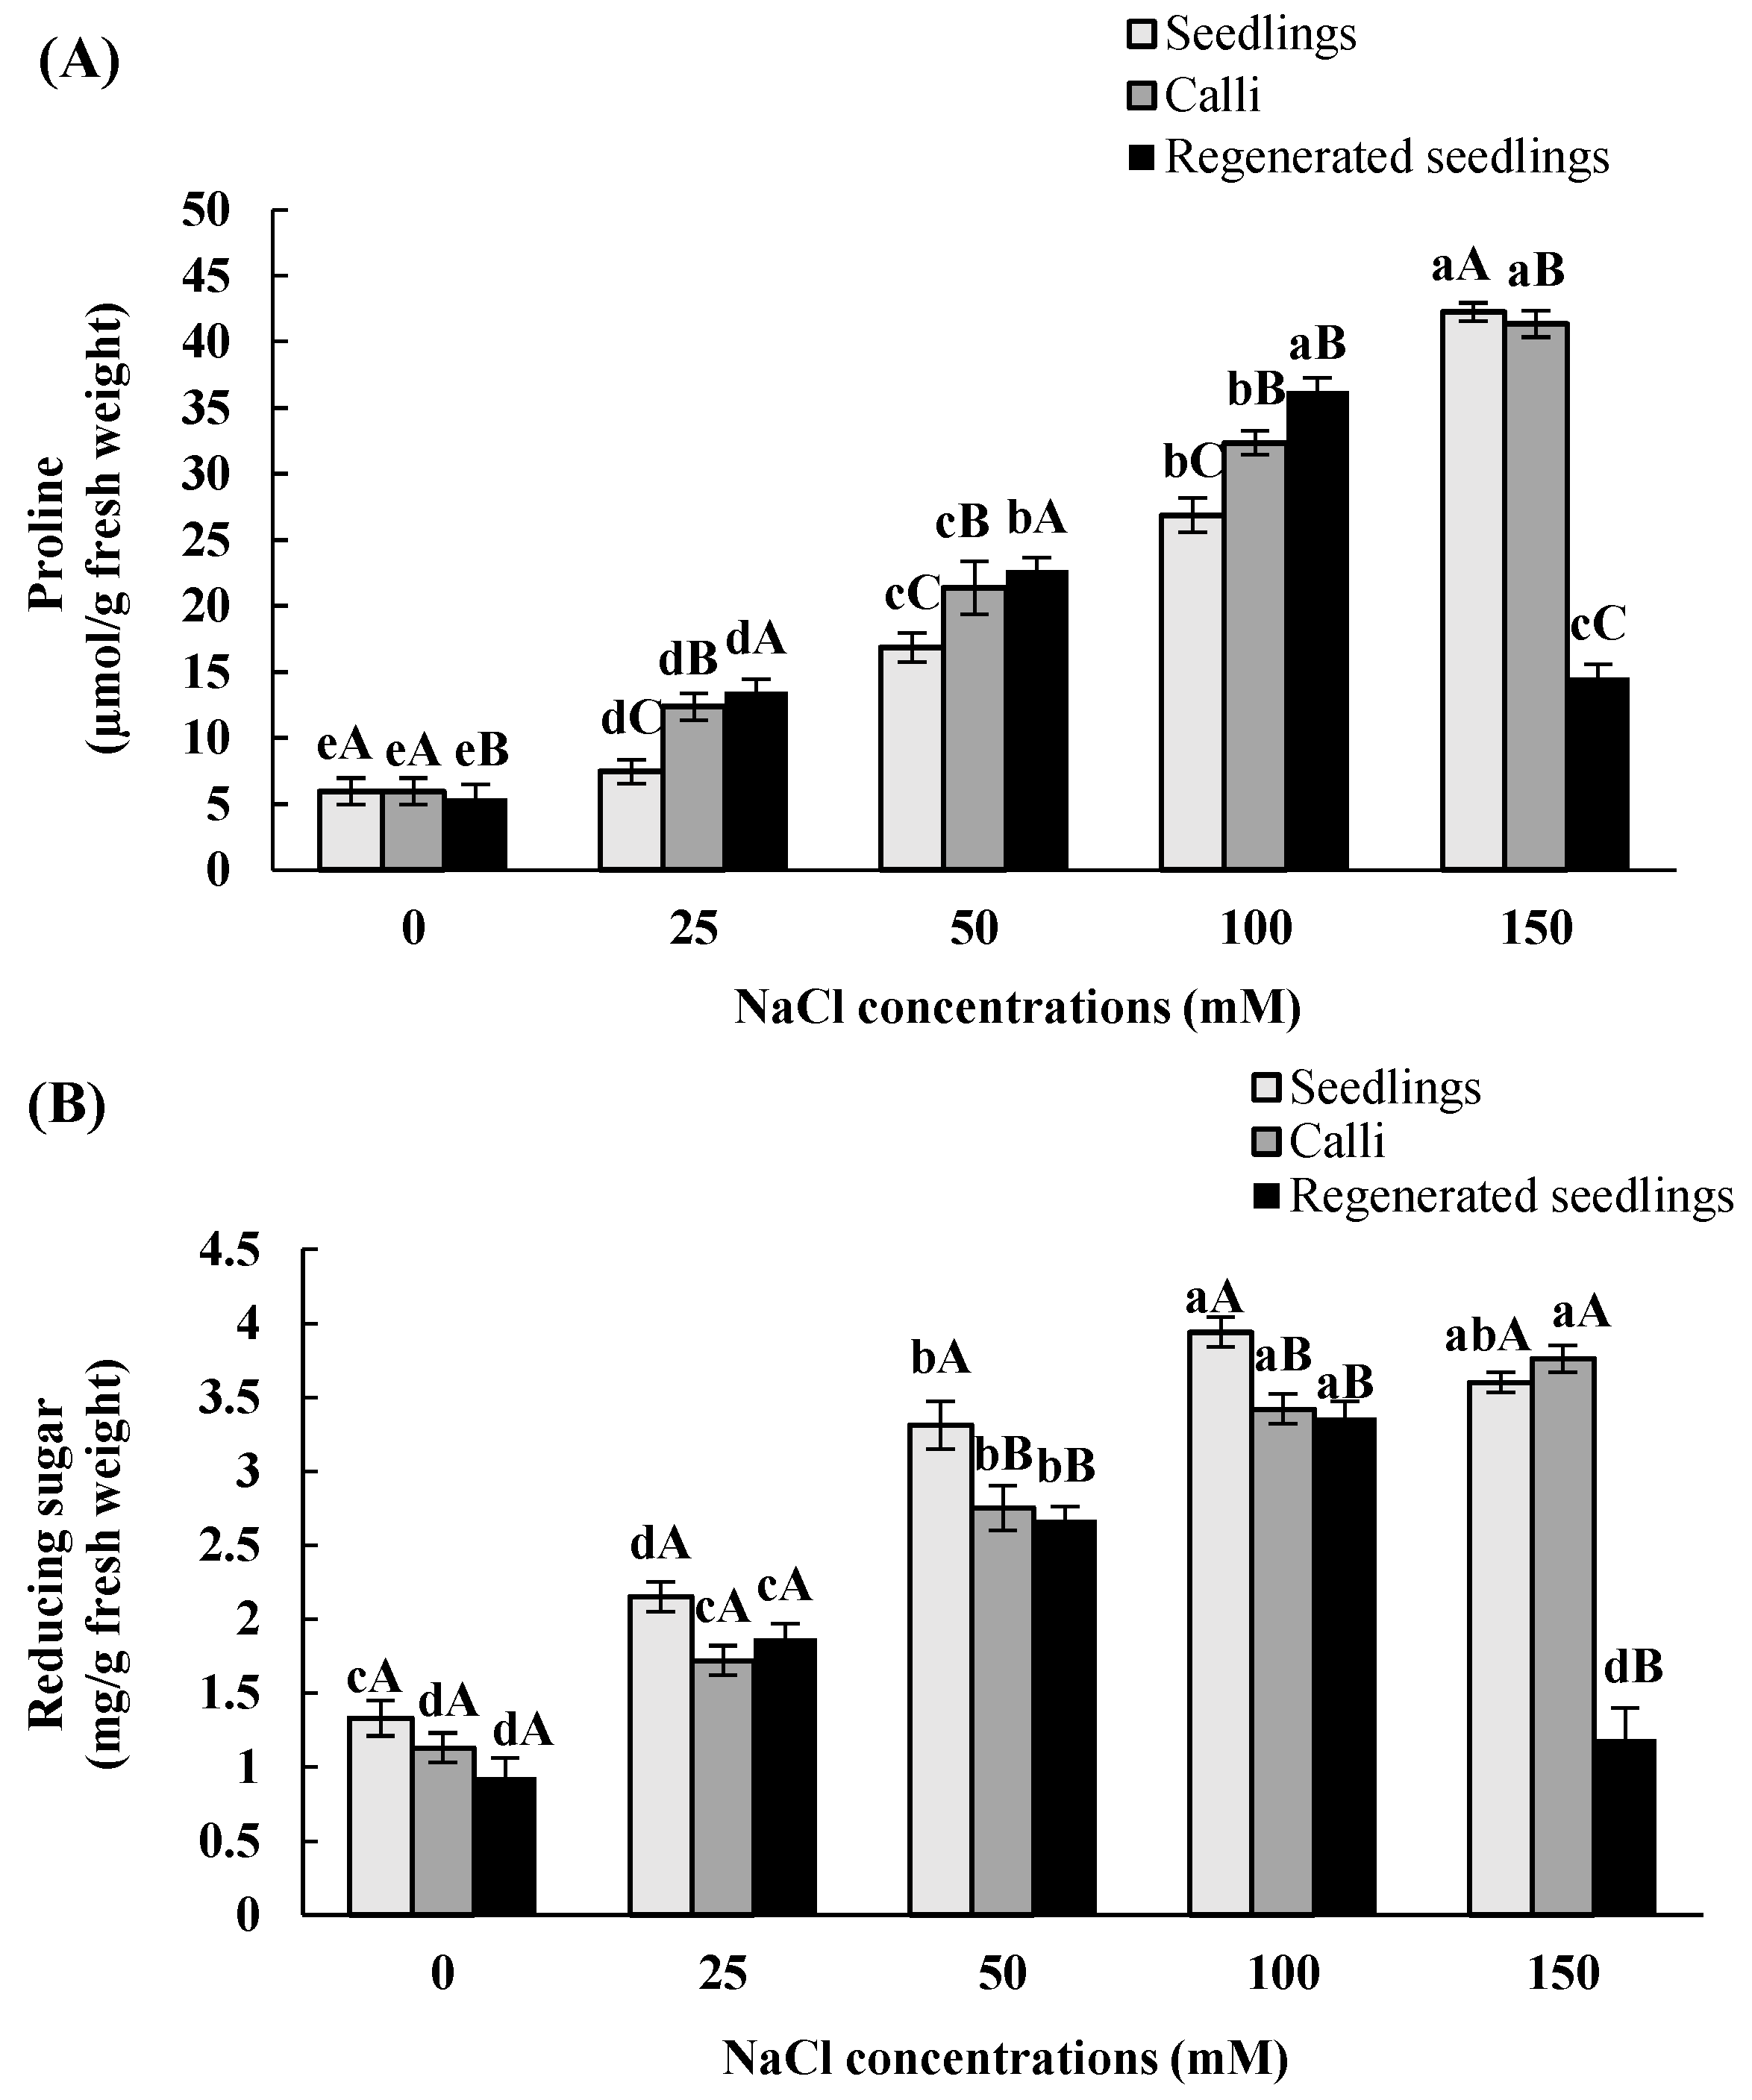
3.3. Effects of In Vitro Salt Stress on Accumulation of Proline and Reducing Carbohydrate

Statistical analysis of the data showed significant differences among NaCl concentrations, explants, and their interaction effects (Table 5).
To determine the osmotic adjustment of the seedlings and callus under salinity, the contents of proline and soluble sugar were analyzed. Proline contents in shoots of seedlings and calli of C. copticum significantly increased in relation to the severity of salt stress. The highest proline content (about sevenfold increases) was found when seedlings and calli were subjected to 150 mM NaCl treatment as compared with the control (Figure 4A). As shown in Figure 2A, the maximum proline contents in the regenerated seedlings were observed at 100 mM, which then decreased at 150 mM NaCl. The results revealed the proline accumulation in shoots of seedlings was the highest compared to callus and regenerated seedlings.
It was clearly observed from Figure 4B that NaCl significantly affected the reduced sugar content of seedlings and callus of C. copticum. These contents in the callus increased in a NaCl concentration-dependent manner. The highest content in callus was observed at 150 mM NaCl, which was 3.3 times higher than that of the control sample, while the highest level of reducing sugar was observed at 100 mM NaCl by 196% in seedlings and by 261% in regenerated seedlings in comparison with the controls (Figure 4B). The detailed results of the different NaCl concentrations’ impact on proline and reducing sugar contents in three explants of Carum copticum are presented in Table 6.

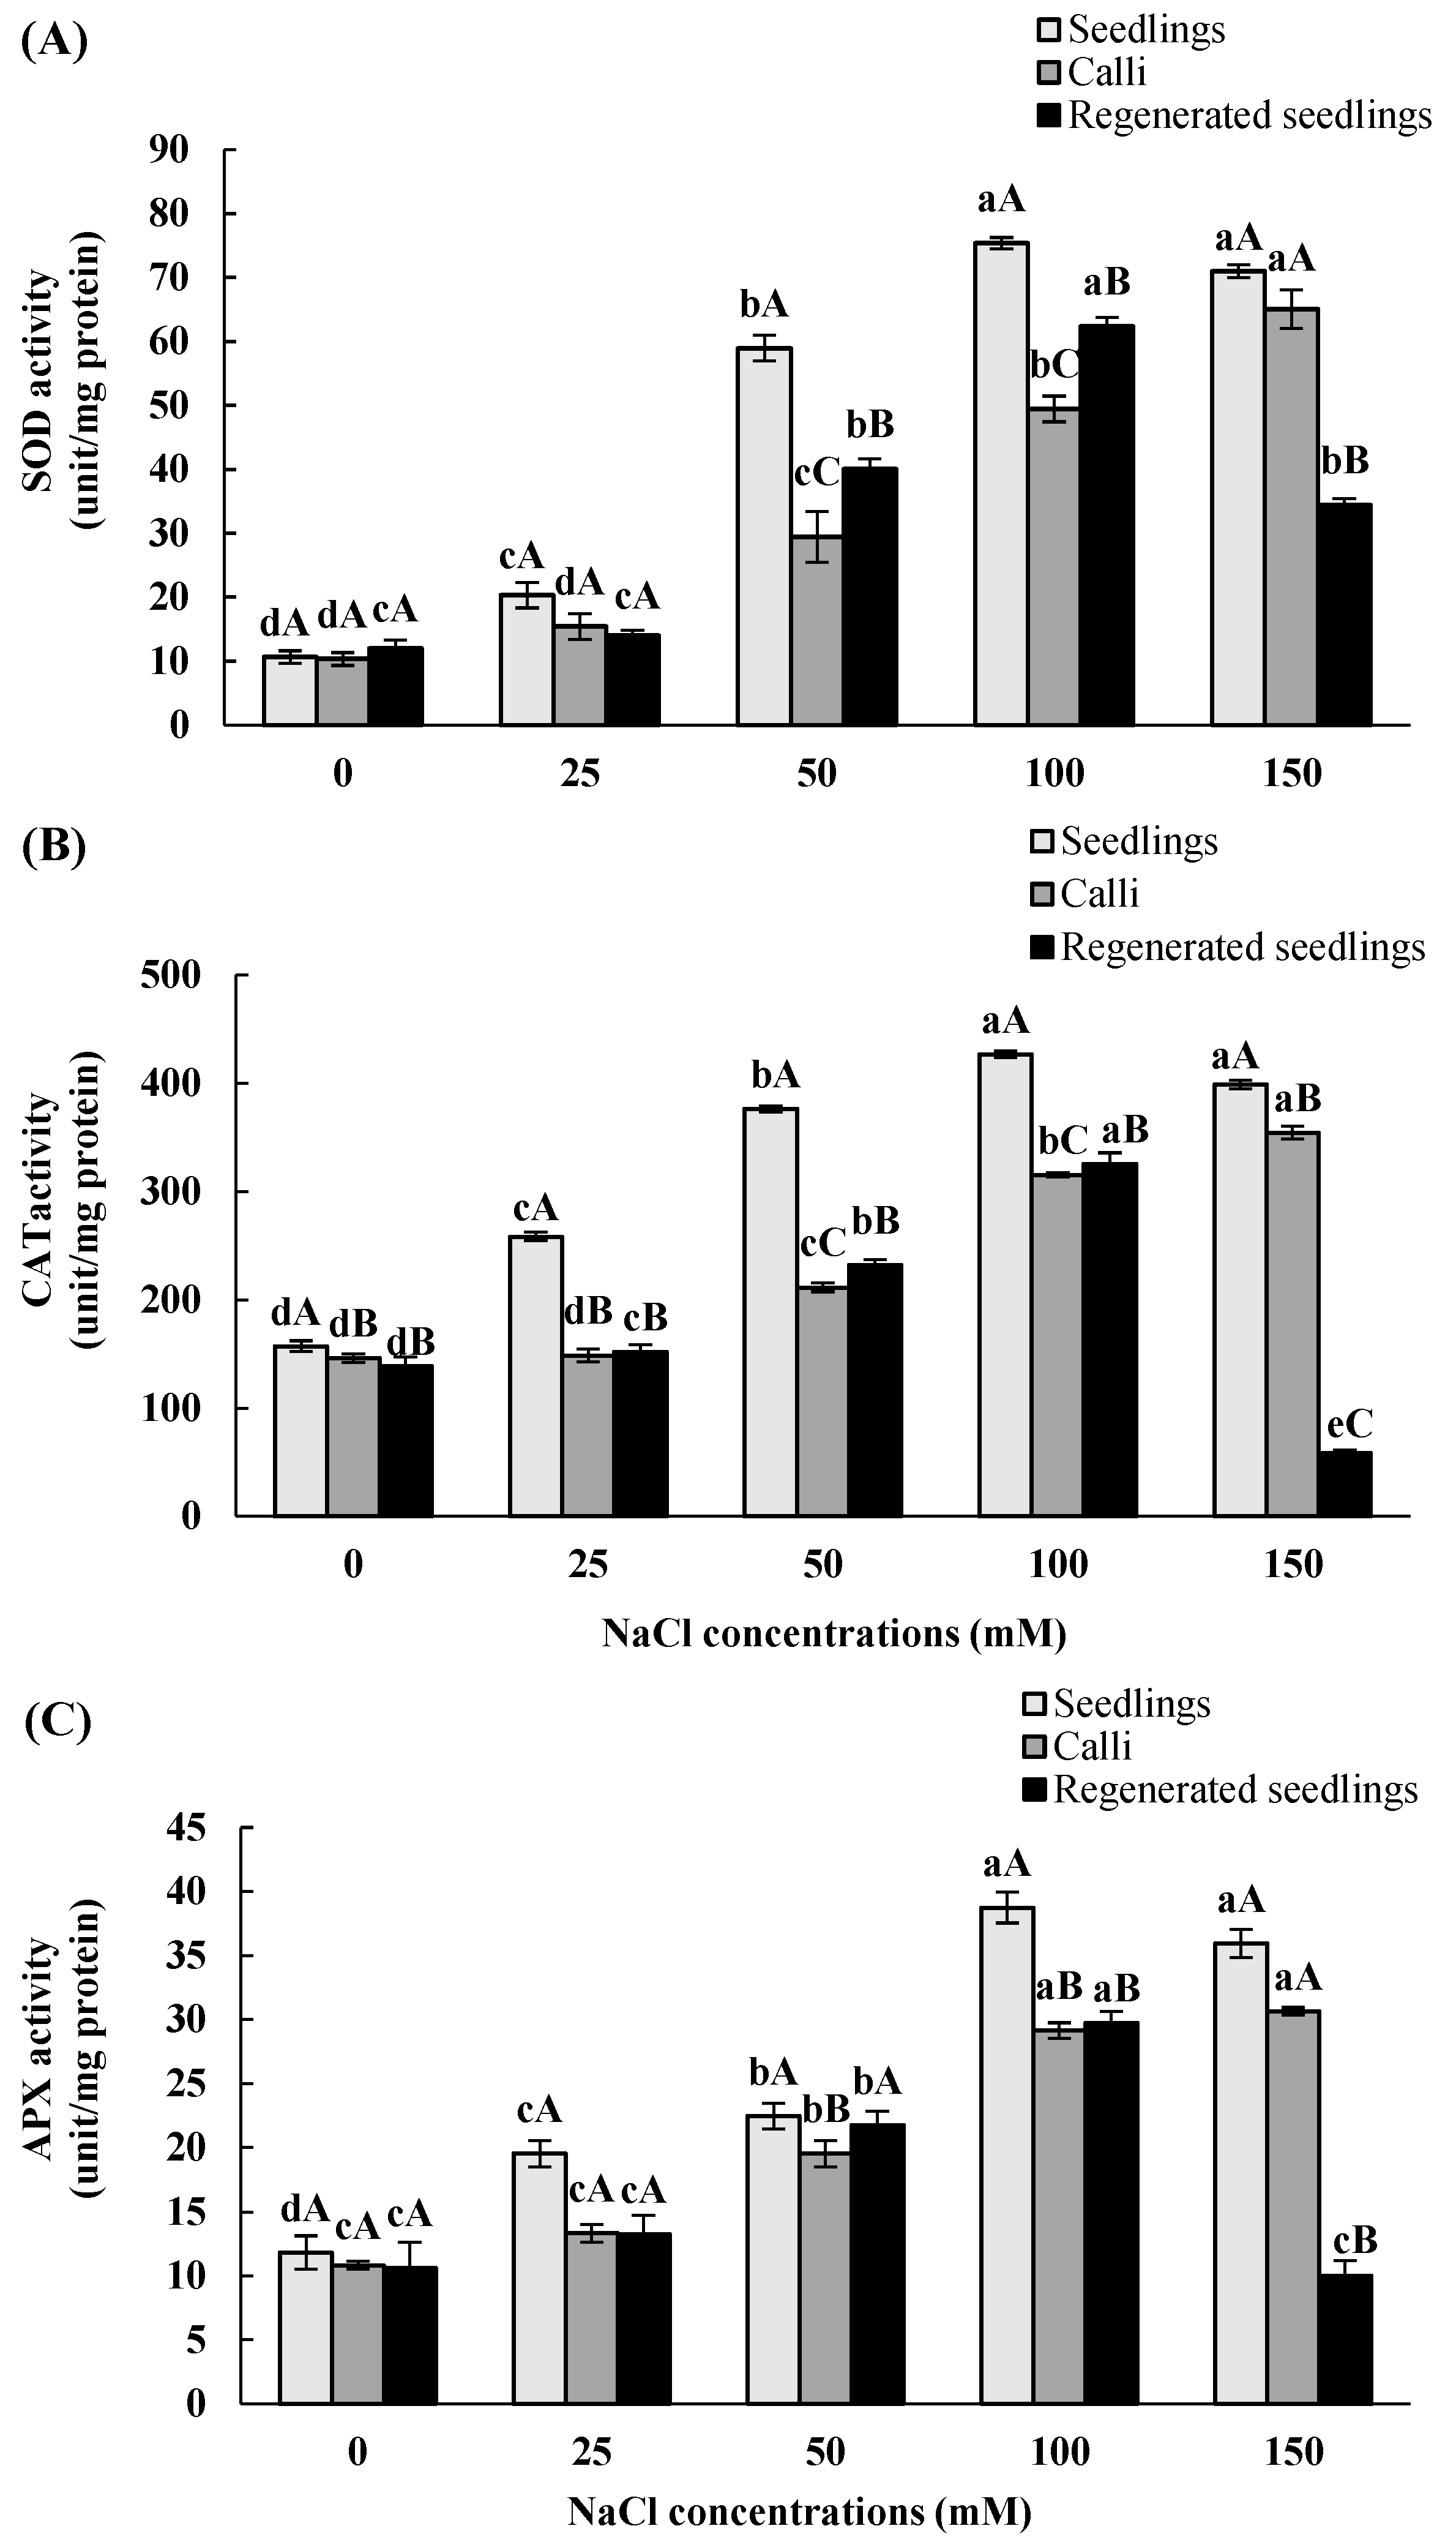
3.4. Effects of In Vitro Salt Stress on Antioxidant Enzyme Activities

Under salinity conditions, the SOD activity significantly increased in all samples as compared to the controls. Compared to the controls, the highest salinity levels contributed to a significant increase in callus SOD activity, about a 6.3-fold increase, whereas the SOD activity showed a 6.6- and 2.8-fold increase at salt stress levels of 100 mM in seedlings and regenerated seedlings, respectively. The observed decrease in activity at 150 mM NaCl in regenerated seedlings was still 1.8-fold more than the control (Figure 5A).
The CAT activity at 100 mM NaCl increased by about 172% in the treated seedlings and 134% in the regenerated seedlings, in comparison to the controls. However, the decreases at 150 mM NaCl in seedlings resulted in regenerated seedlings with a value that was still significantly higher than the control (154% increase), while in regenerated seedlings, the value dropped even below that of the control (Figure 5B). 150 mM NaCl also caused a significant increase in the CAT activity of calli of C. copticum by 143% as compared to the controls.
Salt stress caused a significant increase in the activity of APX in C. copticum leaves and calli compared to the controls. Of different concentrations tested, 100 mM NaCl had a maximum increasing effect on the APX activity in the seedlings and regenerated seedlings. While a significant increase in callus APX activity was obtained at 150 mM NaCl by 183% compared to the control (Figure 5C).
The effect of salinity on antioxidant enzyme activity in the Carum copticum seedlings, calli, and regenerated seedlings treated with different concentrations of NaCl is also presented in Table 7.

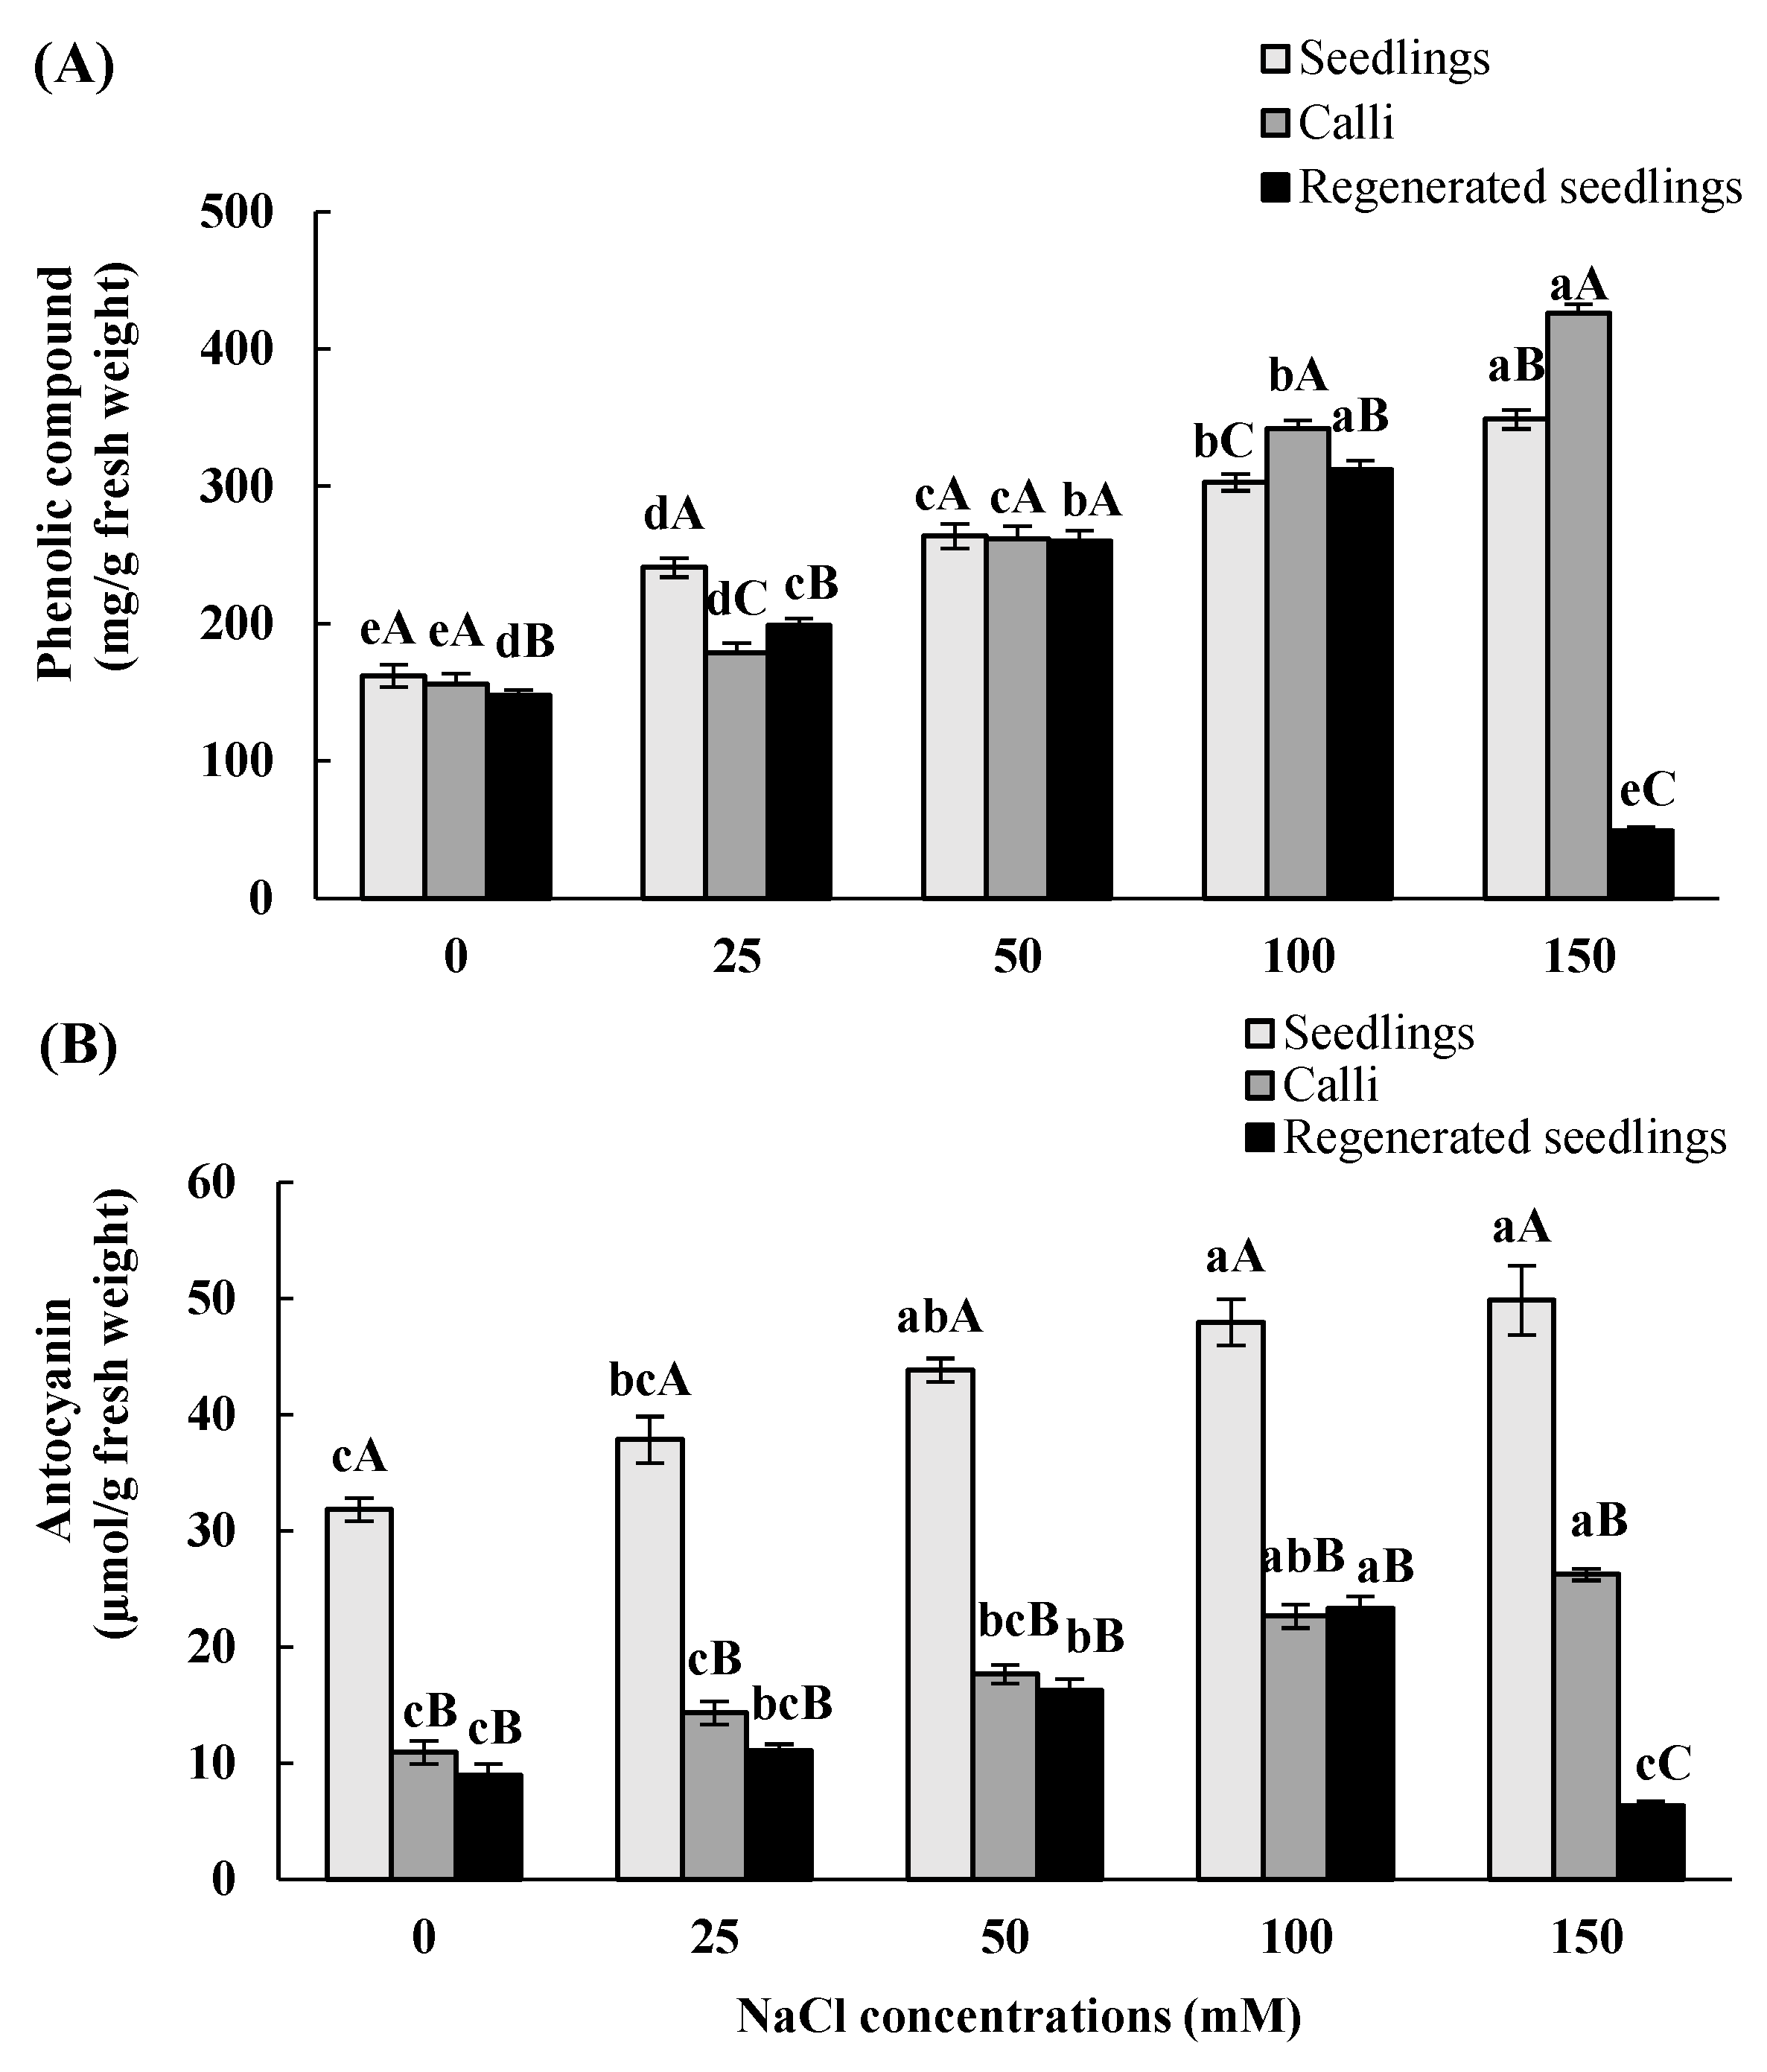
3.5. Effects of In Vitro Salt Stress on Accumulation of Total Phenolic and Anthocyanin Contents

The changes in the phenolic and anthocyanin contents of seedlings and calli under NaCl treatments were analyzed (Figure 6 and Table 8). In comparison with the controls, the total phenolic content of shoots of seedlings and callus increased progressively with an increase in the concentration of NaCl, whereas the highest NaCl concentration caused a significant reduction in this content in shoots of the regenerated seedlings (Figure 6A). This increase was more accentuated in callus than in seedlings after four weeks of salt stress. The highest phenolic content was achieved by 115% and 173% following exposure of seedlings and callus to 150 mM NaCl, respectively. The regenerated seedlings treated with 100 mM NaCl had meaningfully higher phenolic content when compared to the controls (by 110% over control), while this content was lowered by 67% in the regenerated seedlings, which received 150 mM NaCl treatment.
Salt stress led to a significant increase in the anthocyanin content of C. copticum (Figure 6B). The highest salt concentration caused an increase in the anthocyanin content of 56.5% in seedling shoots and 140% in callus compared to their respective controls. In regenerated seedlings, 100 mM NaCl treatment contributed to a significant increase of 161% in the anthocyanin content, while 150 mM NaCl caused a significant decrease in this content of 29% relative to their control.

3.6. Effects of In Vitro Salt Stress on Essential Oil Components

In the study of the oil composition of C. copticum seedlings by the GC/MS analysis, 34 components were identified (Table 9). Thymol, γ-terpinene, p-cymene, and α-pinene make up the most important components of the oil in seedlings. The treatment of seedlings with 100 mM NaCl significantly affected the main essential oils. Among the main aroma constituents, the content of α-pinene, γ-terpinene, and thymol was increased at 100 mM NaCl by 68%, 41%, and 38%, respectively, while p-cymene was lowered by 39% in the salt-treated seedlings, in comparison to the controls (Table 9).
The same oil compositions were identified in regenerated seedlings. However, in contrast with the seedlings, 100 mM NaCl decreased α-pinene and γ-terpinene in regenerated seedlings when compared to the respective controls. Carvacrol, limonene, and α-terpinene were other important compounds with strong biological and pharmacological properties in regenerated seedling oils that were increased to a level of 1.5 times higher than that of the control by 100 mM NaCl. In addition, thymol was raised by about 53% under 100 mM NaCl treatment, in comparison to the controls.
The oil composition produced in the callus of C. copticum included about 25 components. The results showed that 100 mM NaCl had a positive impact on the main components of the callus oil. For instance, with respect to the control, the amount of thymol (43%), γ-terpinene (54%), α-terpinene (54.39%), p-cymene (5.8%), and limonene (21.43%) was increased in salt-treated callus. In contrast, 100 mM NaCl in the culture media led to reducing linalool by 52.3% and carvacrol by 9% compared to the control.

4. Discussion

Many reports in the past decades showed that during in vivo growth conditions, adverse environmental stress influence plant physiology with a stimulatory effect on secondary metabolites in medicinal plants and crops [4,27]. Additionally, a similar trend in enhancing the production of the metabolites was observed in in vitro cultures using biotic and abiotic elicitors [28,29]. Since the higher production of most of the secondary metabolites is a defensive response associated with increased resistance to stress, the present study aimed to improve the secondary metabolite production of C. copticum by in vitro salt stress. Therefore, the dose-dependent experiments were conducted to examine the impact of salt stress on the secondary metabolites, the antioxidant responses, and the accumulation of compatible osmolytes in seedlings, calli, and regenerated seedlings of C. copticum.
In vitro cultures provide a feasible approach to studying the response of plants to stress conditions. Among in vitro techniques, callus culture, which can regenerate into a whole plant, is undoubtedly the most effective tool in the development of salt-tolerant plants and in enhancing the production of secondary metabolites. There are numerous reports of physiological alterations in calli under salinity [30,31]. According to previous reports, the success of callus induction and plantlet regeneration determines by the types of explants, the media constituents, including PGRs, and the nature of the genotype [32]. The present study successfully established a protocol for C. copticum callogenesis and regeneration. Additionally, in order to determine a suitable in vitro culture with mass production of medicinal metabolites of C. copticum, the effect of salt on physiological and biochemical changes in callus and regenerated seedlings from calli were also evaluated.
The impact of salinity on plant secondary metabolites through the induction of oxidative stress and defense responses involves ROS generation, which plays an important role in altering the synthesis of these metabolites in medicinal plants [33]. It was well established that low ROS levels are necessary for various biological processes, including cellular proliferation and differentiation. In contrast, at higher levels, ROS is a significant threat to cells by causing oxidation of proteins, damage to nucleic acids, peroxidation of lipids, enzyme inhibition, and activation of programmed cell death [34,35]. The damaging or signaling roles of ROS depend on the equilibrium between ROS production and scavenging. To control the ROS level to avoid any oxidative damage and not eliminate them entirely under stress conditions, plants respond and adapt with complex mechanisms, including morphological and physiological strategies, osmolyte biosynthesis, the nonenzymic, and enzymic antioxidants system [36]. Overall, the physiological and biochemical changes in response to stress affect primary metabolism, which provides precursors to the secondary metabolites.
One of the essential physiological changes determining the survival of a plant and the production of the metabolites under salt stress is an osmotic adjustment, which involves the accumulation of organic osmolytes, such as proline, sugars, proteins, polyamines, and glycine betaine [6]. These osmolytes, with their compatible nature, counteract the harmful effects of osmotic and ionic stress by balancing the osmotic potentials and maintaining the low intracellular water potential of plants [37]. In the present study, the osmotic adjustment in response to salt stress was estimated by measuring the accumulation of proline and sugars in the leaf and calli of C. copticum. It is well known that proline plays a crucial role in free radical scavenging and the protection of proteins and membrane structures under stress [38]. This study confirmed that the salt-stressed plants accumulated proline compared to the controls. The elevated level of proline seems to be related to the proline transport and overexpression of Δ1-pyrroline-5-carboxylate synthetase (P5CS). Moreover, P5CS genes of Arabidopsis play distinct roles in stress regulation and developmental control of proline biosynthesis and strongly induce under high salinity [39]. Increased proline content in response to salt stress was reported in numerous plants [40,41]. Like proline, the accumulation of sugars is another adaptive mechanism to balance the osmotic potential and acquire resistance to stress. The sugars serve as the buffering of the cellular redox potential and a source of sufficient energy under severe stress [42]. The results of this study were consistent with previous studies, which increased sugar content under salinity conditions [43,44]. These results suggested that the accumulation of proline and soluble sugars is one of the strategies of C. copticum cells for salt tolerance.
Increased activities of many antioxidant enzymes in plants are another defensive response to cope with ROS such as O2˙ and H2O2, which may be over-accumulated under salinity conditions [45]. Various workers reported the induction of specific enzymes of the antioxidant defense system to scavenge the excess ROS, which has been linked to greater tolerance to salt stress [46,47]. Moreover, it has been claimed that antioxidant enzymes such as SOD, CAT, and APX are involved in plant secondary metabolism by converting salt-induced ROS into H2O2 and maintaining H2O2 at an optimum level as a signal molecule. For instance, PaSOD and RaAPX genes in salt-resistant plants could enhance lignin biosynthesis and compatible solutes [48]. In our experiment, the seedlings and calli treated with NaCl showed a considerable increase in SOD, CAT, and APX activities as an adaptive reaction to salt stress. Along with our study, other studies have also shown a correlation between increased antioxidant enzyme levels and salt tolerance [49]. Generally, it is suggested that the activation of antioxidant enzymes contributes to the secondary metabolites production and physiological stability of plants under the saline growth condition.
There is much evidence of the induction of secondary metabolites with antioxidant properties and free radical scavenging in plants during exposure to salinity stress as a defensive response to stress [6,50]. For instance, phenolic content in virgin olive oil [51], total flavonoids and phenols in Cordyline fruticosa leaves [52], and anthocyanins in rice [53] increased in response to salinity. The synthesis of high amounts of phenolic compounds and the association of antioxidant activity under salinity has also been proven by Waskiewicz et al. [54]. Likewise, Ramakrishna et al. [55] showed the significant synthesis of secondary metabolites such as polyphenols, tannins, and anthocyanins in response to salinity. The previous report indicated that salt stress increased the phenolic compounds through disturbances in the secondary metabolic pathways [56]. In this study, the anthocyanin and phenolic contents increased essentially with increasing intensity of salinity in seedlings and calli of C. copticum. A similar trend in phenolic content in Cynara cardunculus [57] and Echinacea angustifolia [58] was reported. An increase in anthocyanin as another potent antioxidant compound by salinity treatment has been reported in many plant species [59,60]. However, in the present study, regenerated seedlings showed an increase in these compounds in low or moderate saline conditions and then had a decreasing rate in the highest concentration. These results are by previous findings [61,62]. It is established that these compounds, because of the hydroxyl groups of their structure, can directly scavenge ROS into relatively nontoxic and stable macromolecular radicals and can chelate transition metal ions. Additionally, it is well known that they inhibit lipid peroxidation by trapping the lipid alkoxyl radicals and decreasing the fluidity of the membranes. All these changes strictly hinder the diffusion of free radicals and limit peroxidative reactions [63]. Nowadays, despite the defensive role of these compounds in plants against environmental stresses, their therapeutic characteristics, such as antihypertensive, anti-inflammatory, and anticancer effects in biological systems received particular attention [64]. Therefore, increasing the metabolism of phenolic compounds with different biotic and abiotic stresses can be crucial. However, it has been demonstrated that the severity, duration, and timing of the salinity and other stresses affect the quality and quantity of secondary metabolites. Assaf et al. [65] showed that moderate salt stress had the most effect on the induction of secondary metabolites of Lamiaceae species.
One of the most significant achievements of this research is the induction of the main constituents of the oils in the seedlings, calli, and regenerated seedlings of C. copticum. Here, α-pinene, γ-terpinene, thymol, p-cymene, carvacrol, limonene, and α-terpinene were strongly influenced by in vitro salt treatment. For instance, 100 mM NaCl treatment induced a significant increase in the content of γ-terpinene, and thymol in the seedlings and calli, while this concentration increased carvacrol, limonene, and α-terpinene in the regenerated seedlings. Alteration in the essential oil yield and composition is considered an adaptation trait to salinity, which. The effects of salinity on essential oil composition have been shown in numerous studies [66,67]. The previous report declared that free volatiles, which are glycosylated and stored in cells, contribute to a decrease in the effect of osmotic stress inherent to salinity by increasing cellular swelling [68]. Furthermore, the increase in soluble sugars as the most critical direct organic product of photosynthesis utilized in essential oil biosynthesis could lead to a rise in the production of essential oil [69]. Possibly, to equilibrate between the carbohydrate source and sink, the plant shifted extra carbohydrates toward producing these metabolites, which confirmed our findings. These results conformed with the previous studies that indicated the increase of essential oil production in response to salinity in several plants [70,71]. Conversely, the reduction in bioactive compound content under salt stress was observed in several aromatic plants [72,73].
Overall, this study suggests the addition of salinity to the growth medium at a certain concentration as a suitable way to improve the plant secondary metabolites synthesis.

5. Conclusions

This research demonstrated an antioxidant defense system, such as enhancing phenolic contents and essential oils, activated under high salinity conditions in C. copticum. The compatible osmolytes accumulation, maximal antioxidant enzyme activity, phenolic, anthocyanin contents, and essential oil components were measured by applying 100 mM NaCl. These results indicate that understanding the relationship between the production of secondary metabolites and salinity tolerance can lead to improving the yield of functional secondary metabolites. Moreover, in vitro cultures provide a valuable method for the successful production of essential and valuable secondary metabolites. These findings suggest that the callus culture is the most reliable for producing secondary metabolites of C. copticum under salt stress.

Author Contributions

R.R., Project administration, design of the study, and writing; F.A., Writing original draft; M.R.C., Investigation, data curation, and formal analysis; S.K., Reviewing and editing. All authors have read and agreed to the published version of the manuscript.

Funding

This research received no external funding.

Data Availability Statement

Not applicable.

Conflicts of Interest

The authors declare no conflict of interest.

References

  1. Lucini, L.; Borgognone, D.; Rouphael, Y.; Cardarelli, M.; Bernardi, J.; Colla, G. Mild potassium chloride stress alters the mineral composition, hormone network, and phenolic profile in artichoke leaves. Front. Plant. Sci. 2016, 7, 948. [Google Scholar] [CrossRef] [PubMed] [Green Version]
  2. Javed, H.; Nagoor Meeran, M.F.; Kumar Jha, N.; Ojha, S.H. Carvacrol, a plant metabolite targeting viral protease (Mpro) and ACE2 in host cells can be a possible candidate for COVID-19. Front. Plant. Sci. 2020, 11, 601335. [Google Scholar] [CrossRef] [PubMed]
  3. Isah, T. Stress and defense responses in plant secondary metabolites production. Biol. Res. 2019, 52, 39. [Google Scholar] [CrossRef] [PubMed] [Green Version]
  4. Espinosa-Leal, C.A.; Puente-Garza, C.A.; García-Lara, S. In vitro plant tissue culture: Means for production of biological active compounds. Planta 2018, 248, 1–18. [Google Scholar] [CrossRef] [PubMed]
  5. Sytar, O.; Barki, S.; Zivcak, M.; Brestic, M. The involvement of different secondary metabolites in salinity tolerance of crops. In Salinity Responses and Tolerance in Plants; Kumat, V., Ed.; Springer: Cham, Switzerland, 2018; Volume 2, pp. 21–48. [Google Scholar]
  6. Bourgaud, F.; Gravot, A.; Milesi, S.; Gontier, E. Production of plant secondary metabolites: A historical perspective. Plant Sci. 2001, 161, 839–851. [Google Scholar] [CrossRef]
  7. Xu, C.; Tang, X.; Shao, H.; Wang, H. Salinity tolerance mechanism of economic halophytes from physiological to molecular hierarchy for improving food quality. Curr. Genom. 2016, 17, 207–214. [Google Scholar] [CrossRef] [PubMed] [Green Version]
  8. Atkinson, N.J.; Urwin, P.E. The interaction of plant biotic and abiotic stresses: From genes to the field. J. Exp. Bot. 2012, 63, 3523–3543. [Google Scholar] [CrossRef] [PubMed] [Green Version]
  9. Gupta, P.; Sharma, S.; Saxena, S. Effect of abiotic stress on growth parameters and steviol glycoside content in Stevia rebaudiana (Bertoni) raised in vitro. J. Appl. Res. Med. Aromat. Plants 2016, 3, 160–167. [Google Scholar] [CrossRef]
  10. Tari, I.; Kiss, G.; Deer, A.K.; Csiszar, J.; Erdei, L.; Galle, A.; Gémes, K.; Horváth, F.; Poór, P.; Szepesi, Á.; et al. Salicylic acid increased aldose reductase activity and sorbitol accumulation in tomato plants under salt stress. Biol. Plant 2010, 54, 677–683. [Google Scholar] [CrossRef]
  11. Altpeter, F.; Springer, N.M.; Bartley, L.E.; Blechl, A.E.; Brutnell, T.P.; Citovsky, V.; Conrad, L.; Gelvin, S.B.; Jackson, D.P.; Kausch, A.P.; et al. Advancing crop transformation in the era of genome editing. Plant Cell 2016, 28, 1510–1520. [Google Scholar] [CrossRef]
  12. Karakas, F.P.; Turker, A.U. Improvement of shoot proliferation and comparison of secondary metabolites in shoot and callus cultures of Phlomis armeniaca by LC-ESI-MS/MS analysis. In Vitro Cell Dev. Biol.-Plant 2016, 52, 608–618. [Google Scholar] [CrossRef]
  13. Zarshenas, M.M.; Moein, M.; Mohammadi Samani, M.; Petramfar, P. An overview on Ajwain (Trachyspermum ammi) pharmacological effects; modern and traditional. J. Nat. Remedies. 2013, 14, 98–105. [Google Scholar]
  14. Boskabady, M.H.; Alitaneh, S.; Alavinezhad, A. Carum copticum L.: A herbal medicine with various pharmacological effects. Biomed. Res. Int. 2014, 2014, 569087. [Google Scholar] [CrossRef] [PubMed] [Green Version]
  15. Cimanga, K.; Kambu, K.; Tona, L.; Apers, S.; De Bruyne, T.; Hermans, N. Correlation between chemical composition and antibacterial activity of essential oils of some aromatic medicinal plants growing in the Democratic Republic of Congo. J. Ethnopharmacol. 2002, 79, 213–220. [Google Scholar] [CrossRef]
  16. Murashige, T.; Skoog, F. A revised medium for rapid growth and bioassays with tobacco tissue cultures. Plant. Physiol. 1962, 15, 473–497. [Google Scholar] [CrossRef]
  17. Bates, L.S.; Waldern, R.P.; Teare, I.D. Rapid determination of free proline for water stress studies. Plant. Soil 1973, 39, 205–207. [Google Scholar] [CrossRef]
  18. Somogyi-Nelson, M. Notes on sugar determination. J. Biol. Chem. 1952, 195, 19–29. [Google Scholar] [CrossRef]
  19. Bradford, M.M. A rapid and sensitive method for the quantification of microgram quantities of protein utilizing the principle of proteindye binding. Annu. Rev. Biochem. 1976, 72, 248–254. [Google Scholar] [CrossRef]
  20. Giannotolitis, C.N.; Ries, S.K. Superoxide dismutase: II. Purification and quantitative relationship with water-soluble protein in seedling. Plant Physiol. 1997, 59, 315–318. [Google Scholar] [CrossRef] [Green Version]
  21. Aebi, H. Catalases. In Methods of Enzymatic Analysis; Bergmeyer, H.U., Ed.; Academic Press: New York, NY, USA, 1974; pp. 673–684. [Google Scholar]
  22. Nakano, Y.; Asada, K. Hydrogen peroxide is scavenged by ascorbate-specific peroxidase in spinach chloroplasts. Plant Cell Physiol. 1981, 22, 867–880. [Google Scholar]
  23. Adabavazeh, F.; Pourseyedi, S.; Nadernejad, N.; Razavizadeh, R.; Mozafari, H. Evaluation of synthesized magnetic nanoparticles and salicylic acid effects on improvement of antioxidant properties and essential oils of Calotropis procera hairy roots and seedlings. Plant Cell Tiss. Organ Cul. 2022, 151, 133–148. [Google Scholar] [CrossRef]
  24. Wagner, G.J. Content and vacuole/extra vacuole distribution of neutral sugars, free amino acids and anthocyanins in protoplast. Plant Physiol. 1979, 64, 88–93. [Google Scholar] [CrossRef] [PubMed]
  25. Li, X.M.; Tian, S.L.; Pang, Z.C. Extraction of Cuminum cyminum essential oil by combination technology of organic solvent with low boiling point and system distillation. Food Chem. 2009, 115, 1114–1119. [Google Scholar] [CrossRef]
  26. Davies, N.W. Gas chromatographic retention indices of monoterpenes and sesquiterpenes on methylsilicon and carbowax 20M Phases. J. Chromatogr. A 1990, 503, 1–24. [Google Scholar] [CrossRef]
  27. El-Hendawy, S.E.; Al-Suhaibani, N.A.; Hassan, W.M.; Dewir, Y.H.; Elsayed, S.; Ashkar, I.; Abdella, K.A.; Schmidhalter, U. Evaluation of wave lengths and spectral reflectance indices for high-throughput assessment of growth, water relations and ion contents of wheat irrigated with saline water. Agric. Water Manag. 2019, 212, 358–377. [Google Scholar] [CrossRef]
  28. Narayani, M.; Srivastava, S. Elicitation: A stimulation of stress in in vitro plant cell/tissue cultures for enhancement of secondary metabolite production. Phytochem. Rev. 2018, 16, 1227–1252. [Google Scholar] [CrossRef]
  29. Rejeb, I.B.; Pastor, V.; Mauch-Mani, B. Plant responses to simultaneous biotic and abiotic stress: Molecular mechanisms. Plants 2014, 3, 458–475. [Google Scholar] [CrossRef] [Green Version]
  30. Dogan, M. Effect of salt stress on in vitro organogenesis from nodal explant of Limnophila aromatica (Lamk.) Merr. And Bacopa monnieri (L.) Wettst. and their physio-morphological and biochemical responses. Physiol. Mol. Biol. Plants 2020, 26, 803–816. [Google Scholar] [CrossRef]
  31. Zhang, Y.; Zhang, Y.; Yu, J.; Zhang, H.; Wang, L.; Wang, S.; Guo, S.; Miao, Y.; Chen, S.; Li, Y.; et al. NaCl-responsive ROS scavenging and energy supply in alkaligrass callus revealed from proteomic analysis. BMC Genom. 2019, 20, 990. [Google Scholar] [CrossRef] [Green Version]
  32. Benderradji, L.; Brini, F.; Kellou, K.; Ykhlef, N.; Djekoun, A.; Masmoudi, K.; Bouzerzour, H. Callus induction, proliferation, and plantlets Regeneration of two bread wheat (Triticum aestivum L.) genotypes under saline and heat stress conditions. Int. Sch. Res. Notices 2012, 2012, 1–8. [Google Scholar] [CrossRef] [Green Version]
  33. Parihar, P.; Singh, S.; Singh, R.; Singh, V.P.; Prasad, S.M. Effect of salinity stress on plants and its tolerance strategies: A review. Environ. Sci. Poll. Res. 2015, 22, 4056–4075. [Google Scholar] [CrossRef]
  34. Tsukagoshi, H.; Busch, W.; Benfey, P.N. Transcriptional regulation of ROS controls transition from proliferation to differentiation in the root. Cell 2010, 143, 606–616. [Google Scholar] [CrossRef] [PubMed]
  35. Xie, H.T.; Wan, Z.Y.; Li, S.; Zhang, Y. Spatiotemporal production of breactive oxygen species by NADPH oxidase is critical for tapetal programmed bcell death and pollen development in Arabidopsis. Plant Cell 2014, 26, 2007–2023. [Google Scholar] [CrossRef] [PubMed] [Green Version]
  36. Flowers, T.J.; Colmer, T.D. Salinity tolerance in halophytes. New Phytol. 2008, 179, 945–963. [Google Scholar] [CrossRef] [PubMed]
  37. Verslues, P.E.; Agarwal, M.; Katiyar-Agarwal, S.; Zhu, J.; Zhu, J.K. Methods and concepts in quantifying resistance to drought, salt and freezing, abiotic stresses that affect plant water status. Plant J. 2006, 45, 523–539. [Google Scholar] [CrossRef] [PubMed]
  38. Ashraf, M.; Foolad, M.R. Roles of glycine betaine and proline in improving plant abiotic stress resistance. Environ. Exp. Bot. 2007, 59, 206–216. [Google Scholar] [CrossRef]
  39. Székely, G.; Abrahám, E.; Cséplo, A.; Rigó, G.; Zsigmond, L.; Csiszár, J.; Ayaydin, F.; Strizhov, N.; Jásik, J.; Schmelzer, E.; et al. Duplicated P5CS genes of Arabidopsis play distinct roles in stress regulation and developmental control of proline biosynthesis. Plant J. 2008, 53, 11–28. [Google Scholar] [CrossRef] [PubMed] [Green Version]
  40. Patade, V.Y.; Bhargava, S.; Suprasanna, P. Salt and drought tolerance of sugarcane under iso-osmotic salt and water stress: Growth, osmolytes accumulation, and antioxidant defense. J. Plant Interact. 2011, 6, 275–282. [Google Scholar] [CrossRef] [Green Version]
  41. Errabii, T.; Gandonou, C.B.; Essalmani, H.; Abrini, J.; Idaomar, M.; Senhaji, N.S. Effects of NaCl and mannitol induced stress on sugarcane Saccharum sp. callus cultures. Acta Physiol. Plant 2007, 29, 95–102. [Google Scholar] [CrossRef]
  42. Keunen, E.L.S.; Peshev, D.; Vangronsveld, J.; van den Ende, W.I.M.; Cuypers, A.N.N. Plant sugars are crucial players in the oxidative challenge during abiotic stress: Extending the traditional concept. Plant Cell Environ. 2013, 36, 1242–1255. [Google Scholar] [CrossRef]
  43. Hannachi, S.; Steppe, K.; Eloudi, M.; Mechi, L.; Bahrini, I.; Van Labeke, M.C. Salt stress induced changes in photosynthesis and metabolic profiles of one tolerant (‘Bonica’) and one sensitive (‘Black beauty’) eggplant cultivars (Solanum melongena L.). Plants 2022, 11, 590. [Google Scholar] [CrossRef] [PubMed]
  44. Xu, H.; Zhai, J.; Liu, Y.; Cheng, X.; Xia, Z.; Chen, F.; Cui, D.; Jiang, X. The response of Mo-hydroxylases and abscisic acid to salinity in wheat genotypes with differing salt tolerances. Acta Physiol. Plant 2012, 34, 1767–1778. [Google Scholar] [CrossRef]
  45. Dvořák, P.; Krasylenko, Y.; Zeiner, A.; Šamaj, J.; Takáč, T. Signaling toward reactive oxygen species-scavenging enzymes in plants. Front. Plant. Sci. 2021, 11, 618835. [Google Scholar] [CrossRef] [PubMed]
  46. Zhang, P.; Wang, R.; Yang, X.; Ju, Q.; Li, W.; Lü, S.; Tran, L.S.P.; Xu, J. The R2R3-MYB transcription factor AtMYB49 modulates salt tolerance in Arabidopsis bymodulating the cuticle formation and antioxidant defence. Plant Cell Environ. 2020, 43, 1925–1943. [Google Scholar] [CrossRef] [PubMed]
  47. Zhang, H.; Zhang, Y.; Deng, C.; Deng, S.; Li, N.; Zhao, C.; Zhao, R.; Liang, S.; Chen, S. The Arabidopsis Ca2+-dependent protein kinase CPK12 is involved in plant response to salt stress. Int. J. Mol. Sci. 2018, 19, 4062. [Google Scholar] [CrossRef] [Green Version]
  48. Liu, J.; Fu, C.; Li, G.; Khan, M.N.; Wu, H. ROS homeostasis and plant salt tolerance: Plant nanobiotechnology updates. Sustainability 2021, 13, 3552. [Google Scholar] [CrossRef]
  49. Feki, K.; Tounsi, S.; Brini, F. Comparison of an antioxidant system in tolerant and susceptible wheat seedlings in response to salt stress. Span. J. Agric. Res. 2017, 15, e0805. [Google Scholar] [CrossRef] [Green Version]
  50. Jdey, A.; Falleh, H.; Jannet, S.B.; Mkadmini Hammi, K.; Dauvergne, X.; Magné, C.; Ksouri, R. Anti-aging activities of extracts from Tunisian medicinal halophytes and their aromatic constituents. EXCLI J. 2017, 16, 755–769. [Google Scholar]
  51. Ben Ahmed, C.; Rouina, B.B.; Sensoy, S. Saline water ırrigation effects on fruit development, quality, and phenolic composition of virgin olive oils, cv. Chemlali. J. Agric. Food Chem. 2009, 57, 2803–2811. [Google Scholar] [CrossRef]
  52. Plaza, B.M.; Jimenez, S.; Segura, M.L. Physiological stress caused by salinity in Cordyline fruticosa and its indicators. Commun. Soil Sci. Plant Anal. 2009, 40, 473–484. [Google Scholar] [CrossRef]
  53. Daiponmak, W.; Theerakulpisut, P.; Thanonkao, P.; Vanavichit, A.; Prathepha, P. Changes of anthocyanin cyanidin-3- glucoside content and antioxidant activity in Thai rice varieties under salinity stress. Sci. Asia 2010, 36, 286–291. [Google Scholar] [CrossRef]
  54. Waskiewicz, A.; Muzolf-Panek, M.; Golinski, P. Phenolic content changes in plants under salt stress. In Ecophysiology and Responses of Plants under Salt Stress; Springer: New York, NY, USA, 2013; pp. 283–314. [Google Scholar]
  55. Ramakrishna, A.; Ravishankar, G.A. Influence of abiotic stress signals on secondary metabolites in plants. Plant Signal. Behav. 2011, 6, 1720–1731. [Google Scholar] [PubMed]
  56. Ksouri, R.; Megdiche, W.; Debez, A. Salinity effects on polyphenol content and antioxidant activities in leaves of the halophyte Cakile maritima. Plant Physiol. Biochem. 2007, 45, 244–249. [Google Scholar] [CrossRef] [PubMed]
  57. Hanen, F.; Ksouri, R.; Megdiche, W. Effect of salinity on growth, leaf-phenolic content and antioxidant scavenging activity in Cynara cardunculus L. In Biosaline Agriculture and High Salinity Tolerance; Abdelly, C., Öztürk, M., Ashraf, M., Grignon, C., Eds.; Birkhäuser: Basel, Switzerland, 2008; pp. 335–343. [Google Scholar]
  58. Montanari, M.; Deglnnocenti, E.; Maggini, R. Effect of nitrate fertilization and saline stress on the contents of active constituents of Echinacea angustifolia DC. Food Chem. 2008, 107, 1461–1466. [Google Scholar] [CrossRef]
  59. Slama, I.; MʹRabet, R.; Ksouri, R.; Talbi, O.; Debez, A.; Abdelly, C. Effects of salt treatment on growth, lipid membrane peroxidation, polyphenol content, and antioxidant activities in leaves of Sesuvium portulacastrum L. Arid Land Res. Manag. 2017, 31, 404–417. [Google Scholar] [CrossRef]
  60. Eryılmaz, F. The relationships between salt stress and anthocyanin content in higher plants. Biotechnol. Biotechnol. Equip. 2006, 20, 47–52. [Google Scholar] [CrossRef]
  61. Valifard, M.; Mohsenzadeh, S.; Kholdebarin, B.; Rowshan, V. Effects of salt stress on volatile compounds, total phenolic content and antioxidant activities of Salvia mirzayanii. S. Afr. J. Bot. 2014, 93, 92–97. [Google Scholar] [CrossRef] [Green Version]
  62. El-Mashad, A.A.A.; Mohamed, H.I. Brassinolide alleviates salt stress and increases antioxidant activity of cowpea plants (Vigna sinensis). Protoplasma 2012, 249, 625–635. [Google Scholar] [CrossRef]
  63. Sharma, P.; Jha, A.B.; Dubey, R.S.; Pessarakli, M. Reactive oxygen species, oxidative damage, and antioxidative defense mechanism in plants under stressful conditions. J. Bot. 2012, 2012, 217037. [Google Scholar] [CrossRef] [Green Version]
  64. Babbar, N.; Oberoi, H.S.; Sandhu, S.K. Therapeutic and nutraceutical potential of bioactive compounds extracted from fruit residues. Crit. Rev. Food Sci. Nutr. 2015, 55, 319–337. [Google Scholar] [CrossRef]
  65. Assaf, M.; Korkmaz, A.; Karaman, Ş.; Kulak, M. Effect of plant growth regulators and salt stress on secondary metabolite composition in Lamiaceae species. S. Afr. J. Bot. 2022, 144, 480–493. [Google Scholar] [CrossRef]
  66. Tounekti, T.; Vadel, A.M.; Oñate, M.; Khemira, H.; Munné-Bosch, S. Salt-induced oxidative stress in rosemary plants: Damage or protection? Environ. Exp. Bot. 2011, 71, 298–305. [Google Scholar] [CrossRef]
  67. Sarmoum, R.; Haid, S.; Biche, M.; Djazouli, Z.; Zebib, B.; Merah, O. Effect of salinity and water stress on the essential oil components of Rosemary (Rosmarinus officinalis L.). Agronomy 2019, 9, 214. [Google Scholar] [CrossRef]
  68. Pichersky, E.; Noel, J.P.; Dudareva, N. Biosynthesis of plant volatiles: Nature’s diversity and ingenuity. Science 2006, 311, 808–811. [Google Scholar] [CrossRef] [Green Version]
  69. Dubey, V.S.; Bhalla, R.; Luthra, R. Sucrose mobilization in relation to essential oil biogenesis during palmarosa (Cymbopogon martinii Roxb. Wats. Var. Motia) inflorescence development. J. Biosci. 2003, 28, 479–487. [Google Scholar] [CrossRef]
  70. Neffati, M.; Sriti, J.; Hamdaoui, G.; Kchouk, M.E.; Marzouk, B. Salinity impact on fruit yield, essential oil composition and antioxidant activities of Coriandrum sativum fruit extracts. Food Chem. 2011, 124, 221–225. [Google Scholar] [CrossRef]
  71. Karray-Bouraoui, N.; Ksouri, R.; Falleh, H.; Rabhi, M.; Grignon, C.; Lachaal, M. Effects of environment and development stage on phenolic content and antioxidant activities of Tunisian Mentha pulegium L. J. Food Biochem. 2010, 34, 79–89. [Google Scholar] [CrossRef]
  72. Ben Taarit, M.; Msaada, K.; Hosni, K.; Marzouk, B. Physiological changes and essential oil composition of clary sage (Salvia sclarea L.) rosette leaves as affected by salinity. Acta Physiol. Plant 2011, 33, 153–162. [Google Scholar] [CrossRef]
  73. Baatour, O.; Kaddour, R.; Aidi Wannes, W.; Lachaa, M.; Marzouk, B. Salt effects on the growth, mineral nutrition, essential oil yield and composition of marjoram (Origanum majorana). Acta Physiol. Plant 2010, 32, 45–51. [Google Scholar] [CrossRef]
Figure 1. Plant regeneration of Carum copticum. (A) Shoot development from callus on MS medium supplemented with 0.25 mg L−1 2,4-D and 1.5 mg L−1 BAP. (B) Root development on regenerated shoots after 4 weeks on MS medium supplemented by 1 mg L−1 IAA. Sidebar in the picture shows 1 cm.
Horticulturae 09 00022 g001
Figure 2. Effect of salinity on callus induction and callus fresh weight of Carum copticum. Stem explants were cultured on MS medium containing 1 mg L−1 BAP, 0.25 mg L−1 2,4-D, and 0, 25, 50, 100, 150, and 200 mM NaCl. Callus induction (A) and callus fresh weight (B) were measured after 4 weeks of salt treatment. Values represent the mean of three replicates with error bars indicating ± standard errors, and dissimilar letters are significantly different according to Duncan’s test (p ≤ 0.05).
Horticulturae 09 00022 g002
Figure 3. Callus phenotype of Carum copticum under salt treatment. The photographs were taken 4 weeks after the start of treatment. Sidebar in each picture shows 1 cm.
Horticulturae 09 00022 g003
Figure 4. Effect of salinity on compatible osmolytes of Carum copticum. Mature sterilized seeds and regenerated seedlings were grown on MS medium containing 0, 25, 50, 100, and 150 mM NaCl. Calli were cultured on MS medium containing 1 mg L−1 BAP, 0.25 mg L−1 2,4-D, and the above-mentioned concentrations of NaCl. The amount of proline (A) and reducing sugars (B) were measured using four-week shoots of salt treatment. Values represent the mean of three replicates with error bars indicating ± standard errors. Different lowercase letters indicate significant differences among the 5 NaCl concentrations in an explant of Carum copticum, and different uppercase letters indicate significant differences among 3 explants of Carum copticum within the same NaCl level according to Duncan’s test p ≤ 0.05.
Horticulturae 09 00022 g004
Figure 5. Effect of salinity on antioxidant enzyme activity of Carum copticum. Mature sterilized seeds and regenerated seedlings were grown on MS medium containing 0, 25, 50, 100, and 150 mM NaCl. Calli were cultured on MS medium containing 1 mg L−1 BAP, 0.25 mg L−1 2,4-D, and the above-mentioned concentrations of NaCl. The activities of SOD (A), CAT (B), and APX (C) were measured using 4-week shoots of salt treatment. Values represent the mean of three replicates with error bars indicating ± standard errors. Different lowercase letters indicate significant differences among the 5 NaCl concentrations in an explant of Carum copticum, and different uppercase letters indicate significant differences among 3 explants of Carum copticum within the same NaCl level according to Duncan’s test p ≤ 0.05.
Horticulturae 09 00022 g005
Figure 6. Effect of salinity on secondary metabolites of Carum copticum. Mature sterilized seeds and regenerated seedlings were grown on MS medium containing 0, 25, 50, 100, and 150 mM NaCl. Calli were cultured on MS medium containing 1 mg L−1 BAP, 0.25 mg L−1 2,4-D, and the above-mentioned concentrations of NaCl. Total phenolic (A) and anthocyanin (B) contents of shoots were measured after 4 weeks of salt treatment. Values represent the mean of three replicates with error bars indicating ± standard errors. Different lowercase letters indicate significant differences among the 5 NaCl concentrations in an explant of Carum copticum, and different uppercase letters indicate significant differences among 3 explants of Carum copticum within the same NaCl level according to Duncan’s test p ≤ 0.05.
Horticulturae 09 00022 g006
Table 1. Effect of different concentrations of 2,4-D and BAP on callus induction and callus fresh weight derived from Carum copticum stem explants on MS medium.
Callus Selection Medium (MS)Days for Callus
Initiation
Callus Induction (%)Callus Fresh Weight (g)Morphology
2,4-D mg L−1BAP mg L−1
0.00.00.00.00.0-
0.00.250.00.00.0-
0.00.50.00.00.0-
0.010.00.00.0-
0.01.50.00.00.0-
0.020.00.00.0-
0.250.00.00.00.0-
0.250.251124 ± 100.1 ± 0.1Greenish–Yellow Friable
0.250.5890 ± 100.4 ± 0.2Greenish–Yellow Friable
0.2518100 ± 0.01.0 ± 0.2Greenish–Yellow Friable
0.251.5880 ± 340.9 ± 0.1Greenish–Yellow Friable
0.252993.3 ± 110.7 ± 0.2Greenish–Yellow Friable
0.50.00.00.00.0-
0.50.251086.6 ± 60.2 ± 0.0Greenish–Yellow Friable
0.50.5990 ± 100.4 ± 0.0Greenish–Yellow Friable
0.511285 ± 130.7 ± 0.1Greenish–Yellow Friable
0.51.515100 ± 0.00.7 ± 0.1Greenish–Yellow Friable
0.5214100 ± 0.00.8 ± 0.1Greenish–Yellow Friable
10.00.00.00.0-
10.2511100 ± 0.00.4 ± 0.1Yellowish–White Friable
10.51071.6 ± 240.4 ± 0.0Yellowish–White Friable
11975.3 ± 130.3 ± 0.1Yellowish–White Friable
11.51080 ± 0.00.5 ± 0.0Yellowish–White Friable
1210100 ± 0.00.5 ± 0.2Yellowish–White Friable
1.50.00.00.00.0-
1.50.251193.3 ± 110.6 ± 0.1Yellowish–White Compact
1.50.5980 ± 0.00.2 ± 0.0Yellowish–White Compact
1.51990 ± 100.4 ± 0.1Yellowish–White Compact
1.51.5980 ± 0.00.3 ± 0.0Yellowish–White Compact
1.521160 ± 260.2 ± 0.1Yellowish–White Compact
20.00.00.00.0-
20.251083.3 ± 5.60.1 ± 0.1White Compact
20.51190 ± 100.1 ± 0.1White Compact
21890 ± 100.6 ± 0.1White Compact
21.51090 ± 100.4 ± 0.1White Compact
221366.6 ± 110.5 ± 0.0White Compact
Values represented the mean of three replicates ± standard error.
Table 2. Effect of different concentrations of 2,4-D and BAP on callus induction and callus fresh weight derived from Carum copticum leaf explants on MS medium.
Callus Selection Medium (MS)Days for Callus
Initiation
Callus Induction (%)Callus Fresh Weight (g)Morphology
2,4-D mg L−1BAP mg L−1
0.00.00.00.00.0-
0.00.250.00.00.0-
0.00.50.00.00.0-
0.010.00.00.0-
0.01.50.00.00.0-
0.020.00.00.0-
0.250.00.00.00.0-
0.250.25943.3 ± 5.70.2 ± 0.0Greenish–Yellow Friable
0.250.5851.6 ± 270.2 ± 0.1Greenish–Yellow Friable
0.251863.3 ± 320.3 ± 0.1Greenish–Yellow Friable
0.251.5880 ± 0.00.2 ± 0.2Greenish–Yellow Friable
0.252973.3 ± 5.70.2 ± 0.0Greenish–Yellow Friable
0.50.00.00.00.0-
0.50.250.00.00.0-
0.50.51023.3 ± 5.70.2 ± 0.2Greenish–Yellow Friable
0.51973.3 ± 110.1 ± 0.0Greenish–Yellow Friable
0.51.51140 ± 0.00.1 ± 0.0Greenish–Yellow Friable
0.521076.6 ± 5.70.3 ± 0.2Greenish–Yellow Friable
10.00.00.00.0-
10.250.00.00.0-
10.51053.3 ± 5.70.1 ± 0.1Yellowish–White Friable
111133.3 ± 5.70.003 ± 0.0Yellowish–White Friable
11.5953.3 ± 5.70.1 ± 0.0Yellowish–White Friable
121040 ± 00.2 ± 0.1Yellowish–White Compact
1.50.00.00.00.0-
1.50.251056.6 ± 5.70.2 ± 0.1Yellowish–White Compact
1.50.51160 ± 0.00.2 ± 0.2Yellowish–White Compact
1.511066.6 ± 5.70.2 ± 0.0Yellowish–White Compact
1.51.51096.6 ± 3.70.2 ± 0.1Yellowish–White Compact
1.521140 ± 340.4 ± 0.1Yellowish–White Compact
20.00.00.00.0-
20.251233.3 ± 5.70.1 ± 0.0White Compact
20.51266.6 ± 200.1 ± 0.0White Compact
211276.6 ± 200.6 ± 0.1White Compact
21.51256.6 ± 5.70.2 ± 0.1White Compact
221123.3 ± 5.70.2 ± 0.02White Compact
Values represented the mean of three replicates ± standard error.
Table 3. Effect of different concentrations of 2,4-D and BAP on shoot regeneration from Carum copticum callus on MS medium.
Culture Medium (MS)Callus with
Shoots (%)
Number of Shoots Per ExplantShoot Length
(cm)
2,4-D mg L−1BAP mg L−1
0.00.00.00.00.0
0.00.255 ± 14 ± 0.70.5 ± 0.01
0.00.525 ± 17 ± 0.70.6 ± 0.02
0.0156 ± 319 ± 0.70.8 ± 0.01
0.01.547 ± 217 ± 1.00.7 ± 0.01
0.0252 ± 318 ± 0.90.7 ± 0.02
0.250.00.00.00.0
0.250.257 ± 26 ± 0.80.9 ± 0.03
0.250.563 ± 222 ± 0.90.9 ± 0.4
0.25175 ± 227 ± 11 ± 0.02
0.251.580 ± 131 ± 0.51.0 ± 0.02
0.25250.1 ± 221 ± 1.10.9 ± 0.02
0.50.00.00.00.0
0.50.255 ± 16 ± 0.50.5 ± 0.02
0.50.58 ± 25 ± 0.20.7 ± 0.02
0.5152 ± 319 ± 0.90.8 ± 0.02
0.51.549 ± 218 ± 0.70.7 ± 0.02
0.5241 ± 316 ± 1.00.6 ± 0.02
Values represented the mean of three replicates ± standard error.
Table 4. Effect of different concentrations of IBA and IAA on root formation of in vitro regenerated shoots of Carum copticum on MS medium.
Culture Medium (MS)Rooting (%)Number of Roots Per ShootRoot Length
(cm)
IBA mg L−1IAA mg L−1
0.00.00.00.00.0
0.00.545 ± 34 ± 10.5 ± 0.03
0.0175 ± 39.9 ± 0.51.1 ± 0.02
0.50.031 ± 53.5 ± 0.40.8 ± 0.01
0.50.561 ± 47.4 ± 0.80.8 ± 0.01
0.5145 ± 55.8 ± 0.30.7 ± 0.02
10.063 ± 37.7 ± 0.30.9 ± 0.01
10.58 ± 32 ± 0.30.3 ± 0.02
10.14 ± 12 ± 0.10.3 ± 0.02
Values represented the mean of three replicates ± standard error.
Table 5. Analysis of variance to assess the impacts of NaCl concentrations, explants, and their interaction on compatible osmolytes, antioxidant enzyme activity, and secondary metabolites in the seedlings, calli, and regenerated seedlings of Carum copticum.
SourcedfMean SquareSig.
ProlineReducing SugarSODCATAPXTotal PhenolicAnthocyanin
Explants266.7192.860984.51182,271.035399.77627,511.1823717.2160.000
NaCl concentrations41316.9208.2374858.42460,983.228712.78236,674.622290.3320.000
Explants × NaCl concentrations8195.8991.073344.63819,213.986147.20123,056.46373.1060.000
Error300.0210.06114.44815.57514.58316.74814.429
Table 6. Comparison of proline and reducing sugar contents in three explants of Carum copticum under five NaCl concentrations.
Proline Reducing Sugar
NaCl Concentrations (mM)SeedlingsCalliRegenerated SeedlingsSeedlingsCalliRegenerated Seedlings
05.6 ± 1eA5.7 ± 1eA5.3 ± 0.9 eB1.3 ± 0.12 cA1.1 ± 0.1 dA0.9 ± 0.13 dA
257.5 ± 0.9 dC12.4 ±1 dB13.4 ± 0.8 dA2.1 ± 0.1 dA1.7 ± 0.1 cA1.9 ± 0.1cA
5016.9 ± 1.1 cC21.3 ± 2 cB22.7 ± 1.2 bA3.3 ± 0.16 bA2.8 ± 0.15 bB2. 7 ± 0.09 bB
10026.9 ± 1.3 bC32.4 ± 0.9 bB36.2 ± 0.8 aA4 ± 0.1 aA3.4 ± 0.1 aB3.7 ± 0.11aB
15042.2 ± 0.7 aA41.3 ± 1 aB14.6 ± 0.2 cC3.6 ± 0.07 abA3.8 ± 0.09 aA1.2 ± 0.21 dB
Different lowercase letters within a column indicate significant differences among the 5 NaCl concentrations in an explant of Carum copticum (Duncan’s test p ≤ 0.05); Different uppercase letters within a row indicate significant differences among 3 explants of Carum copticum within the same NaCl level (Duncan’s test p ≤ 0.05). Each value represents the mean of three replicates ± standard errors.
Table 7. Comparison of the activity of SOD, CAT, and APX in three explants of Carum copticum under five NaCl concentrations.
SODCATAPX
NaCl Concentrations (mM)SeedlingsCalliRegenerated
Seedlings
SeedlingsCalliRegenerated SeedlingsSeedlingsCalliRegenerated Seedlings
010.6 ± 1 dA10.3 ± 1 dA12.1 ± 1.3 cA157.1 ± 5 dA146 ± 4 dB139 ± 8.2 dB11.8 ± 1.3 dA10.8 ± 0.3 cA10.7 ± 2 cA
2520.3 ± 2 cA15.4 ± 2 dA14 ± 0.8 cA258.4 ± 4 cA148.7 ± 6 dB152 ± 6.7 cB19.5 ± 1 cA13.3 ± 0.7 cA13.2 ± 1.5 cA
5058.9 ± 2 bA29.4 ± 4 cC40.1 ± 1.6 bB376.2 ± 3 bA211.4 ± 4 cC232.1 ± 4.9 bB22.4 ± 1 bA19.5 ± 1 bB21.7 ± 1.1 bA
10075.3 ± 0.9 aA49.4 ± 2 bC62.3 ± 1.4 aB426.9 ± 3 aA315.3 ± 2 bC325.5 ± 10.3 aB38.7 ± 1.2 aA29.1 ± 0.6 aB29.8 ± 0.9 aB
15070.9 ± 1 aA65 ± 3 aA34.4 ± 1 bB398.9 ± 4 aA354.6 ± 6 aB58.4 ± 3 eC35.9 ± 1.1 aA30.6 ± 0.3 aA10 ± 1.2 cB
Different lowercase letters within a column indicate significant differences among the 5 NaCl concentrations in an explant of Carum copticum (Duncan’s test p ≤ 0.05); Different uppercase letters within a row indicate significant differences among 3 explants of Carum copticum within the same NaCl level (Duncan’s test p ≤ 0.05). Each value represents the mean of three replicates ± standard errors.
Table 8. Comparison of total phenolic and anthocyanin contents in three explants of Carum copticum under five NaCl concentrations.
Total PhenolicAnthocyanin
NaCl Concentrations (mM)SeedlingsCalliRegenerated SeedlingsSeedlingsCalliRegenerated Seedlings
0162 ± 8 eA155.9 ± 8 eA147.9 ± 4 dB31.8 ± 1 cA11 ± 1 cB8.9 ± 1 cB
25240.8 ± 7 dA178.8 ± 7 dC198.8 ± 5 cB37.8 ± 2 bcA14.3± 1 cB11.03 ± 0.6 bcB
50263.9 ± 9 cA261.7 ± 9 cA259.8 ± 8 bA43.8 ± 1 abA17.6 ± 0.8 bcB16.2 ± 1 b B
100302.7 ± 6 bC341.6 ± 6 bA311.7 ± 7 aB47.9 ± 2 aA22.7 ± 1 abB23.4 ± 1 aB
150348.8 ± 7 aB425.8 ± 6 aA48.8 ± 3 eC49.8 ± 3 aA26.2 ± 0.5 aB6.2 ± 0.4 cC
Different lowercase letters within a column indicate significant differences among the 5 NaCl concentrations in an explant of Carum copticum (Duncan’s test p ≤ 0.05); Different uppercase letters within a row indicate significant differences among 3 explants of Carum copticum within the same NaCl level (Duncan’s test p ≤ 0.05). Each value represents the mean of three replicates ± standard errors.
Table 9. Constituents of essential oil of Carum copticum seedlings, calli, and regenerated seedlings were grown with NaCl using GC/MS.
Essential Oil ComponentsRetention
Time (min)
SeedlingsRegenerated SeedlingsCallus
Control100 mM NaClControl100 mM NaClControl100 mM NaCl
2-pentyl furan9081.4 ± 0.2 0.8 ± 0.11.1 ± 0.11.4 ± 0.2--
Tricyclene9220.9 ± 0.01.4 ± 0.10.9 ± 0.1---
α-thujene9361.2 ± 0.11.0 ± 0.01.3 ± 0.11.0 ± 0.11.4 ± 0.11.3 ± 0.1
α-pinene9482.5 ± 0.14.2 ± 0.54.5 ± 0.21.8 ± 0.14.1 ± 0.21.7 ± 0.1
Hexanol9591.1 ± 0.2 0.9 ± 0.10.9 ± 0.01.2 ± 0.2-0.8 ± 0.1
Sabinene9710.9 ± 0.01.1 ± 0.11.6 ± 0.00.8 ± 0.020.8 ± 0.01.2 ± 0.1
ß-pinene9851.3 ± 0.21.0 ± 0.21.2 ± 0.11.3 ± 0.11.1 ± 0.12.1 ± 0.1
3-octanone9930.9 ± 0.11.2 ± 0.01.1 ± 0.21.0 ± 0.13.8 ± 0.11.2 ± 0.1
Myrcene9982.2 ± 0.13.9 ± 0.11.8 ± 0.23.2 ± 0.22.0 ± 0.12.4 ± 0.2
2-caren10061.3 ± 0.11.0 ± 0.11.2 ± 0.21.0 ± 0.11.4 ± 0.13.5 ± 0.1
a-phylandrene10110.8 ± 0.01.2 ± 0.20.9 ± 0.21.5 ± 0.24.1 ± 0.21.0 ± 0.1
α-fenchen10161.7 ± 0.20.9 ± 0.11.1 ± 0.01.7 ± 1.11.1 ± 0.11.3 ± 0.2
α-terpinene10271.1 ± 0.21.4 ± 0.21.4 ± 0.0 1.6 ± 0.02.2 ± 0.12.0 ± 0.1
p-cymene103425.1 ± 4.215.4 ± 2.122.5 ± 7.719.1 ± 0.612.1 ± 1.412.8 ± 1.2
β-phylandrene10431.3 ± 0.11.0 ± 0.01.3 ± 0.20.9 ± 0.01.8 ± 0.10.9 ± 1.2
Limonene10501.1 ± 0.10.9 ± 0.01.0 ± 0.011.6 ± 0.21.4 ± 0.11.7 ± 0.6
γ-terpinene106615.2 ± 1.421.5 ± 1.123.2 ± 1.317.1 ± 1.118.2 ± 2.728.1 ± 1.7
Cis-sabinen hydrate10791.2 ± 0.10.9 ± 0.21.0 ± 0.071.4 ± 0.0 2.0 ± 0.11.9 ± 0.2
Terpinolene10921.8 ± 0.21.2 ± 0.11.4 ± 0.1 1.3 ± 0.11.1 ± 0.12.1 ± 0.1
Linalool11521.4 ± 0.21.1 ± 0.21.1 ± 0.00.9 ± 1.12.1 ± 0.11.0 ± 0.1
Terpinene-4-ol11781.0 ± 0.0-0.8 ± 0.51.6 ± 0.21.9 ± 0.11.1 ± 0.1
Thymol methyl ether12350.8 ± 0.10.9 ± 0.1 1.2 ± 12.0 ± 0.1--
Verbenone12600.9 ± 0.01.3 ± 0.21.6 ± 0.11.1 ± 0.01.2 ± 0.11.0 ± 0.1
Bronyl acetate12811.3 ± 0.10.9 ± 0.21.1 ± 0.10.8 ± 0.1--
Thymol129619.3 ± 2.126.6 ± 2.214.6 ± 0.622.4 ± 2.617.0 ± 0.124.4 ± 4.5
Carvacrol13101.2 ± 0.21.0 ± 0.10.9 ± 0.01.4 ± 0.17.7 ± 2.17.0 ± 2.2
Candinol13380.9 ± 0.00.8 ± 0.21.3 ± 0.13.0 ± 0.50.9 ± 0.12.0 ± 0.1
Hexadecanoeic acid13701.5 ± 0.21.0 ± 0.11.4 ± 0.11.6 ± 0.22.7 ± 0.13.1 ± 0.5
Cedrene13980.9 ± 0.01.3 ± 0.00.8 ± 0.11.3 ± 0.8--
β-caryophyllene14181.1 ± 0.10.9 ± 0.00.9 ± 0.01.0 ± 0.10.8 ± 0.11.3 ± 0.1
γ-elemene14400.9 ± 0.01.2 ± 0.41.2 ± 0.11.4 ± 0.1 --
α-humulene14631.7 ± 0.11.0 ± 0.2-0.8 ± 0.11.0 ± 0.11.1 ± 0.1
Germacren D14901.0 ± 0.00.9 ± 0.01.3 ± 0.01.1 ± 0.0--
β-bisabolene15370.8 ± 0.0-0.8 ± 0.0---
Values represented the mean of three replicates ± standard error.
Disclaimer/Publisher’s Note: The statements, opinions and data contained in all publications are solely those of the individual author(s) and contributor(s) and not of MDPI and/or the editor(s). MDPI and/or the editor(s) disclaim responsibility for any injury to people or property resulting from any ideas, methods, instructions or products referred to in the content.

