Article

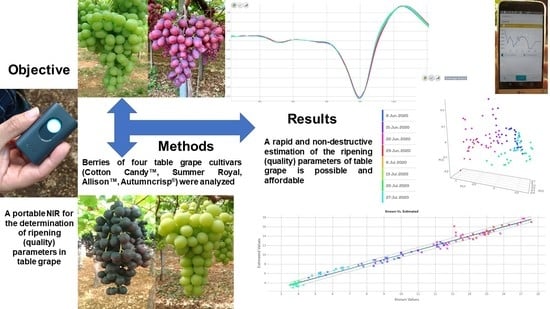
Ripeness Prediction in Table Grape Cultivars by Using a Portable NIR Device

1
Department of Soil, Plant and Food Sciences, University of Bari “Aldo Moro”, Via G. Amendola 165/A, 70126 Bari, Italy
2
Department of Mechanical Engineering, Politecnico di Milano, Via Privata Giuseppe La Masa 1, 20156 Milano, Italy
3
Food Agri Service, Traversa IV Paolo VI, 14, 70016 Noicattaro, Italy
*
Author to whom correspondence should be addressed.
Horticulturae 2022, 8(7), 613; https://doi.org/10.3390/horticulturae8070613
Submission received: 26 April 2022 / Revised: 18 June 2022 / Accepted: 24 June 2022 / Published: 7 July 2022

Abstract

:
In the past years, near infrared (NIR) spectroscopy has been applied to the agricultural industry as a non-destructive tool to predict quality parameters, e.g., ripeness of fruit, dry matter content, and acidity. In two years, 2019 and 2020, berries of four table grape cultivars (Cotton Candy™, Summer Royal, Allison™, and Autumncrisp®) were collected during the season to obtain spectral measurements and quality data for developing predictive models based on NIR spectroscopy to be practically used in the vineyard. A SCiO™ sensor was used in 2019 for predicting the ripening parameters of Cotton Candy™; in particular, total soluble solids (TSS) (R2 = 0.95; RMSE = 0.60, RPD = 13.13), titratable acidity (R2 = 0.97; RMSE = 0.40, RPD = 7.31), and pH (R2 = 0.96; RMSE = 0.07, RPD = 26.06). With these promising results, in the year 2020, the above-mentioned table grape cultivars were all tested for TSS prediction with successful outcomes: Cotton Candy™ (R2 = 0.97; RMSE = 0.68, RPD = 7.48), Summer Royal (R2 = 0.96; RMSE = 0.83, RPD = 7.13), Allison™ (R2 = 0.97; RMSE = 0.72, RPD = 8.70) and Autumncrisp® (R2 = 0.96; RMSE = 0.60, RPD = 9.73). In conclusion, a rapid and economic sensor such as the SCiO™ device can enable a practical application in the vineyard to assess ripening (quality) parameters of table grapes. Thus, this device or similar ones can be also used for a fast sorting and screening of quality throughout the supply chain, from vineyard to cold storage.

Graphical Abstract

1. Introduction

In the horticultural industry, in particular for fruits, the rapid and non-destructive determination of ripening is a very important aspect. A powerful tool in this field is represented by reflectance spectroscopy, a non-destructive technique which is based on measuring the electromagnetic radiations reflected at different wavelengths by target surfaces, especially in the visible (400–700 nm), near infrared (700–1300 nm), and thermal infrared regions (7500–15,000 nm) [1]. The chemical characteristics of the sample influence directly the absorption or reflectance of the radiations so that it is possible to monitor specific elements by analyzing the spectrum response.
In particular, near infrared (NIR) spectroscopy studies the spectral properties of an object exposed to an electromagnetic radiation in the range between 780 nm and 2500 nm [2]. In the regions of NIR suitable for food analysis, short-wave NIR (at 700–1100 nm) allows a deeper penetration through the sample during measurement if compared with the long-wave NIR (at 1100–2500 nm) [3]; moreover, short-wave NIR, contrary to long-wave NIR, is demonstrated to reduce the measurement time and avoid interference from water absorption [4]. In general, the physical characteristics and chemical constituents of an object can reflect, absorb, or transmit the NIR radiation hitting it and thus the total light absorbed or reflected depends on the properties of the sample [5]. Consequently, by analyzing reflectance or absorbance spectra it is possible to build mathematical models aiming to predict a target variable of interest. For example, fruit tissue presents vitamins, water, proteins, and carbohydrates which contain a wide spectrum of NIR-active chemical groups [6]. NIR spectroscopic techniques have been used as non-destructive and rapid tools to evaluate various quality attributes of fruits and vegetables [7]. Studies demonstrated the ability of NIR to estimate the quality of fruit at the time of measurement in the orchards [5,8] and even at post-harvest [9,10]. The estimation on the spectrum response follows the empirical Beer-Lambert law, which relates the absorption of a sample to the concentration of the constituents within it [11].
NIR spectroscopy with a wavelength below 1100 nm has been widely applied on studies regarding fruit such as apple [12,13,14,15], mandarins [16,17], peaches [18], mangoes [19], and tomatoes [20]. In particular, NIR spectroscopy can be a valid tool for simultaneous measurements of the total soluble solids/soluble solids content (TSS/SSC), pH, titratable acidity (TA), and anthocyanin concentration of the samples [11,21] or even the total antioxidant capacity in gluten-free grains [22]. This technology offers a fast response without damaging the samples (fruits, vegetables, grains, etc.) or affecting the growth [23]. In fact, NIR radiation can be absorbed by fundamental vibrations of molecular bonds (O–H, C–H, and N–H) in organic compounds [24]. The spectrum may provide both chemical and physical information of the samples such as hardness, total soluble solids, firmness, total acids, and internal disorders [25,26,27].
In recent years, some low-cost and portable NIR spectrometers were developed. These spectrometers can allow easy measurements (from field to lab), sending the acquired data to cloud databases for instantaneous or further analyses. The integration of these sensors into smartphones and other handheld devices can make the NIR technology easy to use and affordable for trained people or even to general users [28] for possible worldwide applications to assess fruit quality in different conditions and time (supermarkets, stores, field, orchards, home, etc.).
The most used portable NIR spectrometers are Tellspec® Food Sensor (Tellspec Inc., Toronto, ON, Canada), LinkSquare (Stratio Inc., Seoul, Korea), and SCiO™ molecular sensor (Consumer Physics Inc., Tel Aviv, Israel). The SCiO™ sensor has recently been used for the identification of many cultivars of some important species (barley, chickpeas, and sorghum). The data acquired with the spectrometers were analyzed through predictive multiclass algorithms, returning an identification accuracy of 89% for barley (on 24 cultivars), 96% for chickpeas (on 19 cultivars), and 87% for sorghum (on 10 cultivars) [29]. McVey et al. [30] evaluated and compared the performance of three spectrometer devices, including the SCiOTM sensor, which resulted to have a good prediction ability even though it had a limited NIR spectrum range (up to 1070 nm) with respect to the other devices. Li et al. [5] used the SCiOTM sensor in the study of quality prediction for kiwifruit, apple, feijoa, and avocado. The results were comparable with other commercial products but the authors highlighted the need for better calibration models and a wider variety of fruit samples. Kaur et al. [31] tested the performance of SCiOTM (version 1.1) in quality predictions of kiwifruit and apple and obtained lower results compared with lab NIR spectrometers which, on the other hand, are not portable and cannot be used in the field.
Among the fresh fruits, grape is currently the 4th most cultivated fruit species (after banana, watermelon, and apple) in the world with a level of production (more than 78 million tons in 2020) in gradual increase in the last years [32]. Establishment of the correct harvesting time of table grape is a time consuming and destructive process and the possibility to speed up this activity in a non-destructive and easy way would be a step forward in the technological evolution of fresh fruit industry. Moreover, sorting of table grape with different ripening grades in the supply chain would be better managed by workers in this case.
Quality data useful to be assessed by producers, technicians, traders, and consumers include sweetness (total soluble solids (TSS)), titratable acidity (TA), firmness, and pH. Nowadays, conventional techniques for determining such internal quality parameters of table grape and other fruits involve destructive and time-consuming means. For these analyses, a representative sample is used to predict the quality of cluster/vine/vineyard and this usually brings variable values depending on the sampling adopted. Therefore, a rapid non-destructive prediction of TSS (plus pH, TA) for table grape is of great value for the determination of the best harvesting time with positive effects on the eating quality tasted by consumers. Moreover, the possibility to check the ripening values in precise positions of the orchard/vineyard would support the optimal harvesting time for the fruit to carry on an accurate harvest. This would also meet the demand of consumers for high-quality fruits perfectly ripened in the different areas of the world. NIR spectroscopy has also been applied to detect nitrate levels in some fruits such as pineapple [33], soluble solids content and acidity in kiwifruit [8], pear internal quality indices [34], maturation levels in Fuji apple [15], and TSS and dry matter of table grape and peach cultivars [35]. Portable NIR spectrometers have been used to determine fruit quality parameters such as TSS, TA, sugar content, firmness, or other quality parameters in pear, apple, mango, orange, or nectarine [36,37,38,39,40] but less is known about the application for table grape cultivars [35].
In this research, the SCiO™ sensor produced by Consumer Physics Inc. was tested on the table grape for evaluating ripening parameters in a two-year trial. Berries of seedless table grape cultivars were collected during the growing season and the NIR spectral measurements and quality variables were analyzed for developing predictive models.
Once data were collected, the challenge regards the choice of the data analysis method. Partial Least Square Regression (PLSR) and Multiple Linear Regression (MLR) are the most commonly used methods for prediction of a target variable using a multivariate set of predictors variables [41,42]. These two methods are highly affected by the presence of environmental noises during the acquisition phase (i.e., temperature and light) and instrument degradation (mechanical and electrical components aging) which introduce non-linearities in the spectra. These disturbances can be managed by means of pre-processing operation based on statistical methods such as logarithmic transformation, first and second derivatives, and the SNV method [5,43].
On the basis of these considerations, this work focused on the application of an NIR spectroscopy for assessing table grape quality parameters for four cultivars for the best time of harvest by means of the SCiOTM portable device. This is the first step to successively monitor the ripening of the grape in the different blocks of the vineyard by using a specific application.

2. Materials and Methods

2.1. Table Grape Cultivars

In the present trial, four table grape cultivars were used. The table grapes were collected in four different vineyards located in the Puglia region, Southern Italy, the most important region for table grape cultivation in the country. The region has an extension of 19.330 km2, flat for 50% of the territory. More than 60% of the region is used as agricultural area, mostly for the production of olive oil, cherries, vegetables, and wine and table grapes. Puglia has short surface water courses and a very extensive underground water system due to the presence of limestone and dolomitic rocks. The agricultural economy and culture of the area is supported by the Mediterranean climate characterized by warm summers and moderate winters, with low rainfall spread over all seasons [44]. The characteristics of the tested cultivars are described below.
Allison™, also known as Sheegene 20, belongs to the SNFL GROUP. It is a seedless cultivar obtained in 2000 from the cross Princess × Red Globe. It is characterized by the red color of the skin, with a round to slightly ellipsoidal shape and with about 18% TSS at ripening. In Italy it is generally harvested between September and November, around 2–3 weeks after Crimson Seedless and with a diameter >22 mm. Allison™ was collected from a vineyard in the countryside of Noicattaro (Ba).
Autumncrisp® or Sugra35 is a cultivar obtained by SunWorld. This is also a late seedless cultivar, harvested in Italy between September and October. It was obtained by the cross Italia × Dzhidzhigi Kara (from Turkmenistan), and the program started in the 1980s, until the first commercialization in 2012. The berries have a green-yellowish skin color with a large size and a Moscato aroma and with about 15–16% TSS at ripening. Autumncrisp® was collected from a vineyard in the countryside of Mola di Bari (Ba).
Cotton Candy™ or IFG7, is a seedless IFG cultivar characterized by a unique flavor reminiscent of cotton candy, which makes it very popular among children. It was obtained in 2003 through the cross A2674 × Princess. It is generally harvested between the end of July and the beginning of September. The berries have a green-yellowish skin color, a medium-large size with about 18% TSS at ripening. Cotton Candy™ was collected from a vineyard in the countryside of Noicattaro (Ba).
Summer Royal (USDA selection B74–99) is a seedless black grape cultivar obtained by crossing a seeded cultivar A69–190 and a seedless cultivar C20–149 in 1985, then it was released in 1999. The berries are round, black, of medium-large size, and this cultivar is harvested between July and August in Italy, with around 18% TSS. Summer Royal was collected from a vineyard in the countryside of Noicattaro (Ba).

2.2. SCiO™ Sensors

SCiO™ sensors (Consumer Physics Inc., Tel-Aviv, Israel) were used to acquire the spectral data of table grape berries in the wavelength range of 740–1070 nm with a wavelength resolution <10 cm−1 and a sampling interval of 1 nm. Then, the SCiO™ Lab online application produced by the same company of the sensor device (Consumer Physics Inc., Tel-Aviv, Israel) was used on a smartphone for collecting, storing, and analyzing the data. On detached berries, collected at different fruit growth and ripening stages in both experimental years (2019 and 2020), spectral readings were acquired. Details on sampling are reported in the following paragraphs. The radiation emitted by the instrument hit the berry and the reflected light was detected by the SCiO™ sensor. The acquired response spectrum (740–1070 nm) was visible on the smartphone (Bluetooth acquisition) and sent to the SCiO™ cloud database for successive analyses. The calibration operation was performed daily by means of the reference tool (a white tile present inside the sensor cover) provided by the producer [5].

2.3. Berry Sampling and Analyses

The trial was performed over two years: in the first year (2019) the analyses were carried out only on Cotton Candy™ in order to conduct a pre-investigation for the affordability of the data. A total of 300 berries were collected and analyzed from 12 July to 2 September 2019; 200 berries were used for model calibration and 100 berries for the external model validation. In the second year (2020), the trial was carried out on the four cultivars and 235 berries for each cultivar were collected from June until September (during the whole season); for each cultivar, 175 berries were used for model calibration and the remaining 60 berries for the external model validation. In both years the berries were collected at various development and maturity stages at 7–10 days interval from the stage of berry growth until ripened for harvesting. Berries to be picked up were chosen to be representative of the conditions observed (color, size, TSS) in the vineyard at each sampling time. Spectral data of each single berry were acquired under laboratory conditions by means of the SCiO™ sensor (v1.2), followed by destructive analysis for the determination of berry quality parameters (TSS, TA, and pH). For each sample acquisition, three scans per berry were performed at different locations around the equator, approximately 120° apart, at a distance <0.5 cm from the device. Regression models were developed through the combination of both quality parameters and spectral data in order to verify the measured quality attributes with an instant estimation. The predicted (SCiO™ sensor) and measured (chemical analysis) quality parameters were compared to assess the model prediction performances.
The TSS (%) of the juice collected from each berry was measured by means of a hand-held, digital refractometer HI96814 (Hanna Instruments, Woonsocket, RI, USA). For titratable acidity (TA) expressed as grams of tartaric acid per liter of juice and pH, 1 mL of juice extracted from each berry was diluted with 49 mL of distilled water, and then the mixture was titrated against 0.1 N standard NaOH to reach an end point of pH 8.1 with an automatic titrator (PH-Burette 24, Crison Instruments, Barcelona, Spain).

2.4. Data Analysis

The analysis of the spectral data was performed by means of the SCiO™ Lab online interface. To develop a model for the quality attribute of interest, the data for the pre-processing techniques are first identified and then through the option “Create Model”, model generation is initiated [5]. The software includes the selection of some pre-processing techniques such as mean centering, first or second order derivation, logarithmic transformation, and standard normal variate (SNV). In addition, the software allows creating prediction models through different multivariate statistics and machine learning methods such as partial least squares regression (PLSR), clustering analysis and Random Forest. In a previous study, model performance of the SCiO™ Lab online interface was compared with that obtained with the widely used software for chemometric analysis and a similar predictive performance was obtained [5].
Common pre-processing operations for spectral data are smoothing, denoising, detrending, logarithmic transformation, differentiation, and scatter correction methods such as first- and second-order derivatives, multiplicative signal correction (MSC) and standard normal variate (SNV) transformation. Logarithmic transformation is widely used in biometry when data are strongly skewed and follow a log-normal distribution. In this case, the log transformation reduces the skewness effectively, while when the dataset is far from a log-normal distribution, the transformation can even introduce more skewness [6].
Differentiation is widely applied in spectroscopic studies to enhance spectral resolution and to eliminate background effects [45]. The standard normal variate (SNV) method aims to transform each spectrum data obtaining a new variable with zero mean and standard deviation equal to one [43]. Each spectrum is first centered in zero and then divided by its standard deviation so absorbance levels can be easily analyzed and compared. This is extremely useful in presence of changes in optical path length and light scattering since the standard deviation of the spectra represent these changes [46]. On the other hand, the multiplicative effects are not uniform over the absorbance response, so SNV can introduce false artifacts [46]. In general, the first derivative allows removing additive baselines; meanwhile the second derivative eliminates a multiplicative one. The SNV transformation also removes the additive and multiplicative baselines with no shape change in the spectra, but it results more sensitive to the chemical composition [46].
In this study, different combinations of pre-processing techniques were compared on data collected during the first year (2019) and the best combinations were selected for the model calibration considering the best performance.
The model was then developed on the cloud database through the partial least squares regression (PLSR) algorithm. PLSR is a multivariate regression method combining features from Principal Components Analysis) (PCA) and multiple linear regression [42].
The method aims to find the relationship, by means of a linear multivariate model, between one (PLS1) or multiple dependent variables (PLS2), named response variables, and a set of independent variables, named predictors. Then, the prediction is based on a set of orthogonal factors which are a linear combination of the original variables, named latent variables, with the best predictive potential. For this reason, this method is also called projection to latent structures, and it was first applied in social sciences, then in chemometrics and sensory evaluation [47]. The definition of the optimal number of latent variables is critical for the method efficiency. The adaptation goodness of the model on the response data increases with a high number of elements as long as there is a risk of overfitting.
The SCiO™ software can select the number of latent variables automatically for each model, so it is possible to compare the number of the chosen components in the different models.
Once the model is calibrated using a training/calibration dataset, it requires a validation phase in which another dataset is tested in order to evaluate the predictive accuracy [48]. The performance of the calibration models was evaluated by means of Root Mean Square Error (RMSE), coefficient of determination (R2), and Residual Prediction Deviation (RPD) as well as the number of latent variables.
Specifically, the Root Mean Square Error (RMSE), also known as the Root Mean Square Deviation, is referred to as the distances, in vertical direction, between the original dataset and the prediction model; the lower the value, the better the performance of the model.
The R2 indicator or coefficient of determination is used to measure how the model fits the data assuming a zero value in case the model is completely far from the data distribution and a value equal to one in case the model describes the data perfectly. An R2 value between 0.66 and 0.81 provides approximate quantitative predictions, meanwhile a value above 0.82 indicates good predictions [49,50].
The RPD refers the prediction accuracy and is expressed by the standard deviation of the dataset over the RMSE [51].
RPD = i = 1 n ( y i y ¯ ) 2 n 1 RMSE
The higher the RPD values the greater the power of the model to predict unknown samples accurately [5]. Usually, an RPD value below 1.5 indicates that the model cannot be used to describe the dataset, while values between 1.5 and 2.0 indicate that the model is able to discriminate low from high values of the response variable adequately; values between 2 and 2.5 indicate that approximate quantitative predictions are possible. For values between 2.5 and 3.0 and above 3.0, the prediction is classified as good and excellent, respectively [5,52,53,54].
The 2019 study was focused on the comparison between the model performance obtained with the raw spectra and the transformed spectra after the application of a combination of the above-mentioned pre-processing techniques for the estimation of TSS, pH and titratable acidity in Cotton Candy™. This analysis was performed five times on four sample groups (3 for the calibration and one for the prediction) The four combinations of the pre-processing techniques considered the use of the first or second derivative with or without the logarithmic transformation:
  • Logarithmic transformation (LOGT), first derivative (FD), and SNV;
  • Logarithmic transformation (LOGT), second derivative (SD), and SNV;
  • First derivative (FD) and SNV;
  • Second derivative (SD) and SNV.
From the results of this analysis, the two best combinations for each parameter were used to build the prediction model. Specifically, the first three sample groups were used to build the model and the fourth to validate it.
The 2020 experiment was focused on the study of the evolution of the TSS (%) in the four cultivars. For this analysis, TSS were monitored from June to September, providing ripening curves of each cultivar and the relative datasets for the prediction models.

3. Results and Discussion

The SCiO™ Lab online interface allows to visualize raw and pre-processed spectral data, to duplicate and merge datasets, and data download and upload. However, the interface presents limited capability for manipulation and statistical analysis of spectra data. Nonetheless, the application of NIR spectroscopy for predicting the table grape ripening quality parameters during the two seasons by means of the portable device SCiO™ sensor allowed to reach promising results.
The data of the 2019 experiment about the comparison between pre-processing operations and data collected on TSS, pH, and TA of Cotton Candy™ are shown in Table 1. The predictive performance for TSS estimation of Cotton Candy™ in 2019 from NIR spectral data collected by means of the SCiO™ sensor was acceptable. In the calibration set of 2019, the TSS (%) values for Cotton Candy™ ranged from 12.3 up to 19.8, acidity from 9.15 down to 3.30 (g/L of tartaric acid) and pH from 3.35 to 4.20. In the validation set, TSS values were from 12.5 up to 19.2, acidity from 9.63 down to 3.30 (g/L of tartaric acid) and pH from 3.31 to 4.20.
Generally, a good predictive model should have low RMSE values, an R2 as close as possible to 1.0, and a RPD over 2.5; therefore the results in Table 1 showed that the parameter with the lowest value of RMSE was pH, with a mean value around m ¯ R M S E 0.07 . The acidity is the parameter with the R2 closest to 1.0, with an average R2 of m ¯ R 2 0.95 , and with the highest mean RPD value of m ¯ R P D 4.77 .
The R2 value for TSS (0.93; Table 1) was much better with respect to previous studies on other fruit such as feijoa and apple and similar to kiwifruit [5] and other table grape cultivars [35]. Using NIR sensors in wavelength ranges of 780–1700 nm and 680–1000 nm on pear studies, the correlation coefficients resulted of 0.60 and 0.68, respectively, for TSS [55,56]. Higher R2 values (>0.9) similar to this trial have been reported for kiwifruit using a spectral range from 800 to 1100 nm in McGlone and Kawano [57] and for grape using a spectral range from 800 to 2500 nm [58] but with non-portable devices. The RMSE (0.68) was similar to that reported by McGlone et al. [25] for Royal Gala apple (0.72) and by Donis-González et al. [35] for table grape, but higher than the values obtained by Nicolaï et al. [55] for pear (0.44), Travers et al. [56] for pear (0.62), and McGlone and Kawano [57] for kiwifruit (0.39). However, comparisons between models calibrated with different datasets should be carefully considered even if the same spectral range is covered. In order to ensure a more robust comparison, the same calibration conditions must be kept, i.e., similar number of samples, same cultivar, and same TSS range. Thus, the results of the present study with four cultivars during the ripening process should be carefully compared with other studies with different cultivars and sample size when using different NIR devices [59]. In fact, the present data are in agreement with what was recently reported for three table grape cultivars, Autumn Royal, Timpson Seedless, and Sweet Scarlett [35], using the same SCiO™ sensor.
All combinations of pre-processing operations guaranteed good results with no large differences even though the use of the first derivative followed by the SNV revealed the best results as reported by Donis-González et al. [35] for other seedless table grape cultivars. Looking at the number of latent variables, it decreases evidently by means of the second derivative, which consequently offers lower computational resources maintaining the same level of performances.
From Table 1, the two highlighted rows with the best performances for each parameter were extracted and used for the evaluation of PLSR accuracy, obtaining the results presented in Table 2.
Table 2 showed that the best accuracy belongs to pH with low STD and RMSE, an R2 close to 1 and a RPD over 20. The good estimation of table grape TSS is probably a consequence of the thin skin of the berry which allowed a good accuracy of the measurements because of appropriate light penetration in the pulp of the berry (where sugars are mainly located) with respect to fruits with thicker skin (feijoa, orange, etc.). Similar values have been reported for other table grape cultivars [35].
The depth of penetration of NIR applied on fruits is about 2–3 mm in the range of 900–1900 nm but it can reach up to 4 mm at a shorter wavelength (i.e., 700–900 nm). In the present study, the depth is consequently around 3–4 mm considering the wavelength region of the sensor (740–1070 nm). Hence, the obtained spectra data were directly correlated to the properties of fruit pulp (outer layers) and skin with a positive effect on the accuracy of both calibration and prediction performance.
The correlation between NIR measurements and the pH was even better than for TSS with a higher R2 (0.96) and very low RMSE (0.06) values (Table 1). These results were much better than those reported by Gómez et al. [60] in mandarin (R2 = 0.8; RMSE = 0.18) or reported for Fuji apple (R2 = 0.87; RMSE = 0.21) by Pourdarbani et al. [14] but using different NIR devices.
The goodness of fit observed for the model estimating the TA was also very high (Table 1). McGlone et al. [25] obtained lower significance for apple (R2 = 0.38; RMSE = 11.1), whereas Maniwara et al. [61] reported promising results (R2 = 0.68–0.83; RMSE = 0.22–0.29) in passion fruit but lower than what we found in our data, probably for the thicker skin of passion fruit with respect to berry grape. The good pH and TA predictions are also consequence of the thin skin and presence of organic acids also in the skin and outer layers of the pulp.
The obtained calibration models resulted suitable for characterizing the ripening of Cotton Candy™, since the variations in the quality parameters observed in this study resulted sufficiently wide for an optimal harvesting of the grapes.
In 2020, the TSS measurements were collected for each of the four cultivars, then the datasets were used to calibrate and validate the relative models. Data were also used to create the ripening curves of each cultivar (see Figure 1 and Figure 2).
A comparison between the pre-processing techniques for the four cultivars is presented in Table 3; the PLSR accuracy of the best combinations is shown in Table 4. In the calibration set in 2020, the TSS values for Cotton Candy™ ranged from 3.5 up to 17.6%, for Allison™ ranged from 3.3 up to 19.7%, for Autumncrisp® ranged from 4.5 up to 17.9%, and for Summer Royal ranged from 4.0 up to 17.6%. In the validation tests, values of TSS were 3.6–16.4% for Cotton Candy™, 3.9–19.3% for Allison™, 5.0–16.9% for Autumncrisp®, and 4.1–19.2% for Summer Royal. In the calibration models, it is possible to note that the best performances are reported for Autumncrisp®, with an RMSE average of m ¯ R M S E ,   A u t = 0.50 and consequently a high RPD over 2.5. Nonetheless, all cultivars showed an excellent R2 value ranging between 0.97 and 0.98. From the computational point of view, all the pre-processing techniques increased the efficiency of the prediction decreasing the number of latent variables successfully. The best combinations among the pre-processing techniques always include the logarithmic transformation (LOGT), first (FD) and second (SD) derivative, and standard normal variate (SNV). The major peaks are present at 950–1000 nm in correspondence of a wavelength range of O-H 2nd overtone and N-H 2nd overtone, that represents NH2 functional groups and H2O, ROH, and ArOH (with OH bond on the aromatic group) [62,63].
These groups are related to major constituents of water and sugars such as glucose, fructose, and sucrose of grape. TSS mainly represents sugars but also, to a less extent, other organic molecules (i.e., vitamins, amino acids, hormones, etc.) containing C–C, C–O, O–H, and C–H bonds, and an NIR spectroscopy can be used for a non-destructive measurement [62,64]. After pre-processing of the spectra data, a separation among the different sampling dates appeared in the pre-treatment spectra profiles for each cultivar, as shown in Figure 3. This suggests that the growing and ripening stages (indicated by the TSS values) of table grape berries can be successfully differentiated in the range of 740–1070 nm by pre-treatment processes.
The principal component analysis (PCA) was used to detect cluster trend in the spectra data while the pre-processing identified a separation with clear cluster trend as reported in Figure 4 for each cultivar. PCA was able to either separate berries collected at different times during ripening, with differences also among the cultivars, or to determine the primary phenomena in the spectra dataset [65]. Table grape cultivars change their chemical compositions during ripening which allow a discrimination either among the stages or cultivars.
A partial least squares regression (PLSR) model was used for the determination of TSS for all the cultivars (Figure 5) and the measured values reported a linear correlation with NIR predictions. As reported in Table 4, the best pre-processing combinations resulted LOGT-FD-SNV for both Cotton Candy™ and Allison™, and LOGT-SD-SNV for both Autumncrisp® and Summer Royal. These data for the four cultivars indicate that proper pre-processing techniques are useful to improve the accuracy of the PLS model [66]. After the pre-processing techniques used (LOGT, FD or SD, SNV), the multivariate models obtained with NIR measurements predicted the TSS (%) values.
Autumncrisp® resulted in the cultivar with the lowest RMSE and the highest RPD (Table 4) in the prediction model, whereas Summer Royal was the cultivar presenting the lowest prediction accuracy. Nevertheless, all the cultivars allowed to build excellent PLSR models with a RPD value over 6. In line with the results of the TSS range analysis, it seems clear that absolute error indexes such as RMSE are able to provide a higher reliability than R2 in the evaluation of the model performance through different datasets. Therefore, the RMSE can be preferred to R2 when the prediction accuracy is evaluated for short time periods [59,67].
Since we did not use internal cross validation to assess the performance of the models, but instead an independent dataset (test) from a sample apart from the calibration dataset, the results provide a more realistic reliability of the device for the prediction of unknown samples of ripening table grape berries. The robustness of calibration models across orchard blocks and between seasons represents a critical issue for determining the use of non-destructive techniques [68] and consequently should not be overlooked. The predictive accuracy of the SCiO™ sensor can be affected by the homogeneity and surface properties of the fruit, the nature of the data collected, and wavelength range; hence a large sample should be used across the orchard and the point of illumination should be carefully chosen avoiding points with damages, diseases, sunburn, etc. SCiO™ sensor performed well for the determination of dry matter in apple fruit with an RMSEP value of 0.45, very close to a benchtop spectrophotometer (0.451), but poorly with dry matter of kiwifruit [31]. However, for the four table grape cultivars investigated in the current study, qualitative analysis of ripening showed interesting results. The capability of this device to distinguish berries for TSS, pH and acidity demonstrated the potential for portable NIR spectroscopy to be used as a sorting/grading tool both in the field and in the factory. From a farmer’s point of view, the spatial variability of TSS accumulation during the season, when used in combination with a GPS system, can allow the geo-referencing of the measurements for the different locations/cultivars/blocks of the vineyard/farm. This information can also be very important in the application of precision viticulture strategies aimed at performing selective harvesting, not only for table grape but also for wine grape cultivars. Data on two tomato selections indicated that the SCiO™ can be also used for the prediction of firmness, dry matter and TSS with good to high accuracy for TSS with R2 of 0.92 and RMSE of 0.453 [69] and dry matter content was recently predicted in avocado fruit where a prediction R2 of 0.71 was obtained [70]. The SCiO™ correctly predicted 100% of adulterated samples (with salt, sawdust, or starch) and 95.6% of the authentic coriander samples in a recent study in order to be used as screening and rapid technique directly on site rather than in lab [30].
The SCiO™ sensor, when compared with lab spectrophotometers, showed good performances, generally with lower R2 or higher RMSEP, and can be considered to predict some fruit quality parameters as recently reported for mango firmness [71]. The laboratory-based spectrophotometers have lower errors because of a broader spectral range captured, covering the 1st, 2nd, and 3rd overtones of the N–H, O–H and C–H bonds whereas the SCiO™ is able to capture only the 740–1070 nm range thus explaining 3rd overtones of bonds [71]. Despite the positive aspects of the handheld SCiO™ sensor, its spectral range is limited with a consequent lack of absorption information related to the presence of carbohydrates, starch, or other possible components which can be better detected by laboratory NIRS instruments [72], and it probably limits the predictive ability for complex nutritional parameters [73], such as mineral content in fruits. Minerals, unlike organic molecules, can only be detected if chelated in organic complexes or indirectly in case there is an effect on hydrogen bonds [74]; however, when their form is inorganic, the identification and prediction is difficult [72].
However, when a good model performance is associated with portability, ease-of-use, low cost, ability to use with mobile phones and a connected cloud framework, the SCiO™ sensor (or similar devices) can be a valid alternative to traditional laboratory-based spectrophotometers [70] to be used by a wide number of users.
The chemometric indexes for TSS models of the four cultivars indicated that the NIR spectra region (740–1070 nm) was able to predict the TSS across the range of 3.6–19.3% and can be used for non-destructive determination of TSS quality attributes in fresh table grape cultivars. More chemometrical information is also available at the higher end of the NIR spectrum (1150 to 2500 nm), but although the SCiO™ is not able to acquire such wavelengths, data resulted affordable for some qualitative characteristics of table grape cultivars.
Apart for prediction for fruits and other horticultural products, the SCiO™ can provide a rapid prediction for the content of both intact casein and total protein in cheddar cheese [75]. The SCiO™ sensor was also successfully applied for the determination of total and gelatinized starch in dog food and partially for S and K content, whereas it was not useful for insoluble fibers and other mineral elements which showed RPD values much lower than what we found in our data [72].
The model failure for fresh fruit is commonly related to a high biological variability which can be related to several factors such as: cultivars, sites of cultivation, cultural practices, season of harvest, ripening stages of fruit, and storage conditions [37,76,77]. Consequently, a natural solution to deal with the calibration failure is to measure a wide range of samples from different cultivars and harvesting seasons (2–3 seasons) and developing/ripening stages to calibrate global models to be used worldwide.

4. Conclusions

A portable device such as SCiO™ can support the non-destructive prediction of table grape TSS, together with pH and TA. Rapid estimation of such quality and ripening parameters with portable sensors are effective tools for the ripening protocols of table grape, thus, improving the whole supply chain and reducing both costs and fruit losses along the supply chain. Predictive models can be used for estimate quality/ripening parameters thus supporting agronomical consultants, farmers, and retailers to obtain clear information of the ripening status of the grapes with fast and on-site monitoring. Moreover, this method is non-destructive, therefore it allows to collect many data without losing or destroying the berry. Generally, the most robust combination with the best performances was represented by the use of the logarithmic transformation, the first/second derivative, and SNV operation.
The use of these models, which can be easily imported into mobile phone technology, definitely has a high potential for effective, rapid, and simple application in many fields (orchards, post-harvest, retailers, etc.), and may be the road to the future.

Author Contributions

Conceptualization, G.F., M.P. and A.M.; Methodology, G.F., A.D. and V.M.; Software, A.D. and A.M.; Validation A.D. and A.M.S.; Formal Analysis, A.D. and V.M.; Data Curation, V.M., M.P. and G.F.; Writing—Original Draft Preparation, G.F., A.D. and V.M.; Writing—Review and Editing, G.F., A.M.S. and M.P. All authors have read and agreed to the published version of the manuscript.

Funding

This research received no external funding.

Institutional Review Board Statement

Not applicable.

Informed Consent Statement

Not applicable.

Data Availability Statement

The data presented in this study are available on demand from the first author at giuseppe.ferrara@uniba.it.

Acknowledgments

The authors wish to thank the academic spin-Agridatalog of the University of Bari ‘Aldo Moro’ for the use and technical support with the SCiO™ device.

Conflicts of Interest

The authors declare no conflict of interest.

References

  1. Shyam Narayan, J.H.A.; Matsuoka, T. Non-Destructive Techniques for Quality Evaluation of Intact Fruits and Vegetables. Food Sci. Technol. Res. 2000, 6, 248–251. [Google Scholar] [CrossRef] [Green Version]
  2. Dufour, É. Principles of infrared spectroscopy. In Infrared Spectroscopy for Food Quality Analysis and Control; Sun, D.W., Ed.; Academic Press: Cambridge, MA, USA, 2009; pp. 1–27. [Google Scholar]
  3. Wu, D.; He, Y.; Feng, S. Short-wave near-infrared spectroscopy analysis of major compounds in milk powder and wavelength assignment. Anal. Chim. Acta 2008, 610, 232–242. [Google Scholar] [CrossRef]
  4. Reeves, J.B. Effects of water on the spectra of model compounds in the short- wavelength near infrared spectral region (14,000–9091 cm−1 or 714–1100 nm). J. Near Infrared Spectrosc. 1994, 2, 199–212. [Google Scholar] [CrossRef]
  5. Li, M.; Qian, Z.; Shi, B.; Medlicott, J.; East, A. Evaluating the performance of a consumer scale SCiOTM molecular sensor to predict quality of horticultural products. Postharvest Biol. Technol. 2018, 145, 183–192. [Google Scholar] [CrossRef]
  6. Feng, C.; Wang, H.; Lu, N.; Tu, X.M. Log transformation: Application and interpretation in biomedical research. Stat. Med. 2013, 32, 230–239. [Google Scholar] [CrossRef]
  7. Shyam Narayan, J.H.A. Near infrared spectroscopy. In Nondestructive Evaluation of Food Quality: Theory and Practice; Jha, S.N., Ed.; Springer: Berlin/Heidelberg, Germany, 2010; pp. 141–212. [Google Scholar]
  8. Moghimi, A.; Aghkhani, M.H.; Sazgarnia, A.; Sarmad, M. Vis/NIR spectroscopy and chemometrics for the prediction of soluble solids content and acidity (pH) of kiwifruit. Biosyst. Eng. 2010, 106, 295–302. [Google Scholar] [CrossRef]
  9. Ignat, T.; Lurie, S.; Nyasordzi, J.; Ostrovsky, V.; Egozi, H.; Hoffman, A.; Friedman, H.; Weksler, A.; Schmilovitch, Z. Forecast of Apple Internal Quality Indices at Harvest and During Storage by VIS-NIR Spectroscopy. Food Bioprocess. Tech. 2014, 7, 2951–2961. [Google Scholar] [CrossRef]
  10. Li, M.; Pullanagari, R.R.; Pranamornkith, T.; Yule, I.J.; East, A.R. Quantitative prediction of post storage ‘Hayward’ kiwifruit attributes using at harvest Vis-NIR spectroscopy. J. Food Eng. 2017, 202, 46–55. [Google Scholar] [CrossRef]
  11. Larraín, M.; Guesalaga, A.R.; Agosin, E. A multipurpose portable instrument for determining ripeness in wine grapes using NIR spectroscopy. IEEE Trans. Instrum. Meas. 2008, 57, 294–302. [Google Scholar] [CrossRef]
  12. Nturambirwe, J.F.I.; Nieuwoudt, H.H.; Perold, W.J.; Opara, U.L. Non-destructive measurement of internal quality of apple fruit by a contactless NIR spectrometer with genetic algorithm model optimization. Sci. Afr. 2019, 3, e00051. [Google Scholar] [CrossRef]
  13. Zhang, Y.; Nock, J.F.; Al Shoffe, Y.; Watkins, C.B. Non-destructive prediction of soluble solids and dry matter contents in eight apple cultivars using near-infrared spectroscopy. Postharvest Biol. Technol. 2019, 151, 111–118. [Google Scholar] [CrossRef]
  14. Pourdarbani, R.; Sabzi, S.; Kalantari, D.; Karimzadeh, R.; Ilbeygi, E.; Arribas, J.I. Automatic non-destructive video estimation of maturation levels in Fuji apple (Malus Malus pumila) fruit in orchard based on colour (Vis) and spectral (NIR) data. Biosyst. Eng. 2020, 195, 136–151. [Google Scholar] [CrossRef]
  15. Pourdarbani, R.; Sabzi, S.; Kalantari, D.; Arribas, J.I. Non-destructive visible and short-wave near-infrared spectroscopic data estimation of various physicochemical properties of Fuji apple (Malus pumila) fruits at different maturation stages. Chemom. Intell. Lab. Syst. 2020, 206, 104147. [Google Scholar] [CrossRef]
  16. Kawano, S.; Fujiwara, T.; Iwamoto, M. Nondestructive Determination of Sugar Content in Satsuma Mandarin using Near Infrared (NIR) Transmittance. J. Jpn. Soc. Hortic. Sci. 1993, 62, 465–470. [Google Scholar] [CrossRef]
  17. McGlone, V.A.; Fraser, D.G.; Jordan, R.B.; Künnemeyer, R. Internal quality assessment of mandarin fruit by vis/NIR spectroscopy. J. Near Infrared Spectrosc. 2003, 11, 323–332. [Google Scholar] [CrossRef]
  18. Kawano, S.; Watanabe, H.; Iwamoto, M. Determination of Sugar Content in Intact Peaches by Near Infrared Spectroscopy with Fiber Optics in Interactance Mode. J. Jpn. Soc. Hortic. Sci. 1992, 61, 445–451. [Google Scholar] [CrossRef] [Green Version]
  19. Saranwong, S.; Sornsrivichai, J.; Kawano, S. Improvement of PLS calibration for Brix value and dry matter of mango using information from MLR calibration. J. Near Infrared Spectrosc. 2001, 9, 287–295. [Google Scholar] [CrossRef]
  20. Shyam Narayan, J.H.A.; Matsuoka, T. Non-destructive determination of acid-brix ratio of tomato juice using near infrared spectroscopy. Int. J. Food Sci. Technol. 2004, 39, 425–430. [Google Scholar] [CrossRef]
  21. Kemps, B.; Leon, L.; Best, S.; De Baerdemaeker, J.; De Ketelaere, B. Assessment of the quality parameters in grapes using VIS/NIR spectroscopy. Biosyst. Eng. 2010, 105, 507–513. [Google Scholar] [CrossRef]
  22. Verena, W.; Huck, C.W. Evaluation of the performance of three hand-held near- infrared spectrometer through investigation of total antioxidant capacity in gluten- free grains. Talanta 2018, 189, 233–240. [Google Scholar] [CrossRef]
  23. Porep, J.U.; Kammerer, D.R.; Carle, R. On-line application of near infrared (NIR) spectroscopy in food production. Trends Food Sci. Technod. 2015, 46, 211–230. [Google Scholar] [CrossRef]
  24. Nicolaï, B.M.; Beullens, K.; Bobelyn, E.; Peirs, A.; Theron, K.I.; Lammertyn, J. Nondestructive measurement of fruit and vegetable quality by means of NIR spectroscopy: A review. Postharvest Biol. Technol. 2007, 46, 99–118. [Google Scholar] [CrossRef]
  25. McGlone, V.A.; Jordan, R.B.; Martinsen, P.J. Vis/NIR estimation at harvest of pre- and post-storage quality indices for “Royal Gala” apple. Postharvest Biol. Technol. 2002, 25, 135–144. [Google Scholar] [CrossRef]
  26. Nicolaï, B.M.; Theron, K.I.; Lammertyn, J. Kernel PLS regression on wavelet transformed NIR spectra for prediction of sugar content of apple. Chemometr. Intell. Lab. Syst. 2006, 85, 243–252. [Google Scholar] [CrossRef]
  27. Sun, T.; Huang, K.; Xu, H.; Ying, Y. Research advances in nondestructive determination of internal quality in watermelon/melon: A review. J. Food Eng. 2010, 100, 569–577. [Google Scholar] [CrossRef]
  28. Haughey, S.A.; Galvin-King, P.; Malechaux, A.; Elliott, C.T. The use of handheld near-infrared reflectance spectroscopy (NIRS) for the proximate analysis of poultry feed and to detect melamine adulteration of soya bean meal. Anal. Methods 2015, 7, 181–186. [Google Scholar] [CrossRef]
  29. Kosmowsky, F.; Worku, T. Evaluation of a miniaturized NIR spectrometer for cultivar identification: The case of barley, chickpea and sorghum in Ethiopia. PLoS ONE 2018, 13, e0193620. [Google Scholar] [CrossRef] [PubMed]
  30. McVey, C.; Gordon, U.; Haughey, S.A.; Elliott, C.T. Assessment of the Analytical Performance of Three Near-Infrared Spectroscopy Instruments (Benchtop, Handheld and Portable) through the Investigation of Coriander Seed Authenticity. Foods 2021, 10, 956. [Google Scholar] [CrossRef]
  31. Kaur, H.; Künnemeyer, R.; McGlone, A. Comparison of hand-held near infrared spectrophotometers for fruit dry matter assessment. J. Near Infrared Spectrosc. 2017, 25, 267–277. [Google Scholar] [CrossRef]
  32. FAOSTAT (2021). Available online: https://www.fao.org/faostat/en/#compare (accessed on 14 May 2022).
  33. Srivichien, S.; Terdwongworakul, A.; Teerachaichayut, S. Quantitative prediction of nitrate level in intact pineapple using Vis–NIRS. J. Food Eng. 2015, 150, 29–34. [Google Scholar] [CrossRef]
  34. Liu, Y.; Chen, X.; Ouyang, A. Nondestructive deermination of pear internal quality indices by visible and near-infrared spectrometry. LWT 2008, 41, 1720–1725. [Google Scholar] [CrossRef]
  35. Donis-González, I.R.; Valero, C.; Momin, M.A.; Kaur, A.; Slaughter, D.C. Performance evaluation of two commercially available portable spectrometers to non-invasively determine table grape and peach quality attributes. Agronomy 2020, 10, 148. [Google Scholar] [CrossRef] [Green Version]
  36. Li, J.; Wang, Q.; Xu, L.; Tian, X.; Xia, Y.; Fan, S. Comparison and optimization of models for determination of sugar content in pear by portable Vis-NIR spectroscopy coupled with wavelength selection algorithm. Food Anal. Methods 2019, 12, 12–22. [Google Scholar] [CrossRef]
  37. Bobelyn, E.; Serban, A.S.; Nicu, M.; Lammertyn, J.; Nicolai, B.M.; Saeys, W. Postharvest quality of apple predicted by NIR-spectroscopy: Study of the effect of biological variability on spectra and model performance. Postharvest Biol. Technol. 2010, 55, 133–143. [Google Scholar] [CrossRef]
  38. Marques, E.J.N.; de Freitas, S.T.; Pimentel, M.F.; Pasquini, C. Rapid and non-destructive determination of quality parameters in the ‘Tommy Atkins’ mango using a novel handheld near infrared spectrometer. Food Chem. 2016, 197, 1207–1214. [Google Scholar] [CrossRef]
  39. Cayuela, A.; Weiland, C. Intact orange quality prediction with two portable NIR spectrometers. Postharvest Biol. Technol. 2010, 58, 113–120. [Google Scholar] [CrossRef] [Green Version]
  40. Sánchez, M.T.; De la Haba, M.J.; Guerrero, J.E.; Garrido-Varo, A.; Pérez-Marín, D. Testing of a local approach for the prediction of quality parameters in intact nectarines using a portable NIRS instrument. Postharvest Biol. Technol. 2011, 60, 130–135. [Google Scholar] [CrossRef]
  41. Bayer, A.; Bachmann, M.; Müller, A.; Kaufmann, H. A Comparison of Feature-Based MLR and PLS Regression Techniques for the Prediction of Three Soil Constituents in a Degraded South African Ecosystem. Appl. Environ. Soil Sci. 2012, 2012, 971252. [Google Scholar] [CrossRef] [Green Version]
  42. Chauchard, F.; Cogdill, R.; Roussel, S.; Roger, J.M.; Bellon-Maurel, V. Application of LS-SVM to non-linear phenomena in NIR spectroscopy: Development of a robust and portable sensor for acidity prediction in grapes. Chemometr. Intell. Lab. Syst. 2004, 71, 141–150. [Google Scholar] [CrossRef] [Green Version]
  43. Barnes, R.J.; Dhanoa, M.S.; Lister, S.J. Standard normal variate transformation and de-trending of near-infrared diffuse reflectance spectra. Appl. Spectrosc. 1989, 43, 772–777. [Google Scholar] [CrossRef]
  44. Ruggiero, G.; Parlavecchia, M.; Dal Sasso, P. Typological charcterisation and territorial distribution of traditional rural buildings in the Apulian territory (Italy). J. Cult. Herit. 2019, 39, 278–287. [Google Scholar] [CrossRef]
  45. Viscarra Rossel, R.A. ParLeS: Software for chemometric analysis of spectroscopic data. Chemom. Intell. Lab. Syst. 2008, 90, 72–83. [Google Scholar] [CrossRef]
  46. Sandak, J.; Sandak, A.; Meder, R. Assessing trees, wood and derived products with near infrared spectroscopy: Hints and tips. J. Near Infrared Spectrosc. 2016, 24, 485–505. [Google Scholar] [CrossRef] [Green Version]
  47. Wold, S.; Sjöström, M.; Eriksson, L. PLS-regression: A basic tool of chemometrics. Chemom. Intell. Lab. Syst. 2001, 58, 109–130. [Google Scholar] [CrossRef]
  48. Barca, E.; Porcu, E.; Bruno, D.; Passarella, G. An Automated Decision Support System for Aided Assessment of Variogram Models. Environ. Model. Softw. 2017, 87, 72–83. [Google Scholar] [CrossRef]
  49. Pillonel, L.; Dufour, E.; Schaller, E.; Bosset, J.O.; De Baerdemaeker, J.; Karoui, R. Prediction of colour of European Emmental cheeses by using near infrared spectroscopy: A feasibility study. Eur. Food Res. Technol. 2007, 226, 63–69. [Google Scholar] [CrossRef]
  50. Janik, L.J.; Forrestera, S.T.; Rawsonb, A. The prediction of soil chemical and physical properties from mid-infrared spectroscopy and combined partial least-squares regression and neural networks (PLS-NN) analysis. Chemom. Intell. Lab. Syst. 2009, 97, 179–188. [Google Scholar] [CrossRef]
  51. Camacho-Tamayo, J.H.; Rubiano, S.Y.; Maria del Pilar Hurtado, S. Near-infrared (NIR) diffuse reflectance spectroscopy for the prediction of carbon and nitrogen in an Oxisol. Agron. Colomb. 2014, 32, 86–94. [Google Scholar] [CrossRef]
  52. Saeys, W.; Mouazen, A.M.; Ramon, H. Potential for onsite and online analysis of pig manure using visible and near infrared reflectance spectroscopy. Biosyst. Eng. 2005, 91, 393–402. [Google Scholar] [CrossRef]
  53. Mouazen, A.M.; De Baerdemaeker, J.; Ramon, H. Effect of wavelength range on the measurement accuracy of some selected soil constituents using visual-near infrared spectroscopy. J. Near Infrared Spectrosc. 2006, 14, 189–199. [Google Scholar] [CrossRef]
  54. Colombo, C.; Palumbo, G.; Di Iorio, E.; Sellitto, V.M.; Comolli, R.; Stellacci, A.M.; Castrignanò, A. Soil organic carbon variation in alpine landscape (Northern Italy) as evaluated by diffuse reflectance spectroscopy. Soil Sci. Soc. Am. J. 2014, 78, 794–804. [Google Scholar] [CrossRef]
  55. Nicolaï, B.M.; Verlinden, B.E.; Desmet, M.; Saevels, S.; Saeys, W.; Theron, K.; Cubeddu, R.; Pifferi, A.; Torricelli, A. Time-resolved and continuous wave NIR reflectance spectroscopy to predict soluble solids content and firmness of pear. Postharvest Biol. Technol. 2008, 47, 68–74. [Google Scholar] [CrossRef]
  56. Travers, S.; Bertelsen, M.G.; Kucheryavskiy, S.V. Predicting apple (cv. Elshof) postharvest dry matter and soluble solids content with near infrared spectroscopy. J. Sci. Food Agric. 2014, 94, 955–962. [Google Scholar] [CrossRef]
  57. McGlone, V.A.; Kawano, S. Firmness, dry-matter and soluble-solids assessment of postharvest kiwifruit by NIR spectroscopy. Postharvest Biol. Technol. 1998, 13, 131–141. [Google Scholar] [CrossRef]
  58. Jarén, C.; Ortuño, J.C.; Arazuri, S.; Arana, J.I.; Salvadores, M.C. Sugar determination in grapes using NIR technology. Int. J. Infrared Millim. Waves 2001, 22, 1521–1530. [Google Scholar] [CrossRef]
  59. Urraca, R.; Sanz-Garcia, A.; Tardaguila, J.; Diago, M.P. Estimation of total soluble solids in grape berries using a hand-held NIR spectrometer under field conditions. J. Sci. Food Agric. 2016, 96, 3007–3016. [Google Scholar] [CrossRef]
  60. Gómez, A.H.; He, Y.; Pereira, A.G. Non-destructive measurement of acidity, soluble solids and firmness of Satsuma mandarin using Vis/NIR-spectroscopy techniques. J. Food Eng. 2006, 77, 313–319. [Google Scholar] [CrossRef]
  61. Maniwara, P.; Nakano, K.; Boonyakiat, D.; Ohashi, S.; Hiroi, M.; Tohyama, T. The use of visible and near infrared spectroscopy for evaluating passion fruit postharvest quality. J. Food Eng. 2014, 143, 33–43. [Google Scholar] [CrossRef]
  62. Amuah, C.L.Y.; Teye, E.; Lamptey, F.P.; Nyandey, K.; Opoku-Ansah, J.; Osei-Wusu Adueming, P. Feasibility Study of the Use of Handheld NIR Spectrometer for Simultaneous Authentication and Quantification of Quality Parameters in Intact Pineapple Fruits. J. Spectrosc. 2019, 2019, 5975461. [Google Scholar] [CrossRef] [Green Version]
  63. Cen, H.; He, Y. Theory and application of near infrared reflectance spectroscopy in determination of food quality. Trends Food Sci. Technod. 2007, 18, 72–83. [Google Scholar] [CrossRef]
  64. Ma, T.; Li, X.; Inagaki, T.; Yang, H.; Tsuchikawa, S. Noncontact evaluation of soluble solids content in apples by near-infrared hyperspectral imaging. J. Food Eng. 2018, 224, 53–61. [Google Scholar] [CrossRef]
  65. Sun, M.; Zhang, D.; Liu, L.; Wang, Z. How to predict the sugariness and hardness of melons: A near-infrared hyper-spectral imaging method. Food Chem. 2017, 218, 413–421. [Google Scholar] [CrossRef] [PubMed]
  66. Guan, X.; Liu, J.; Huang, K.; Kuang, J.; Liu, D. Evaluation of moisture content in processed apple chips using NIRS and wavelength selection techniques. Infrared Phys. Technol. 2019, 98, 305–310. [Google Scholar] [CrossRef]
  67. Kuhn, M.; Johnson, K. Applied Predictive Modelling; Springer: New York, NY, USA, 2013. [Google Scholar]
  68. Magwaza, L.S.; Tesfay, S.Z. A Review of Destructive and Non-destructive Methods for Determining Avocado Fruit Maturity. Food Bioprocess. Technol. 2015, 8, 1995–2011. [Google Scholar] [CrossRef]
  69. Goisser, S.; Fernandes, M.; Ulrichs, C.; Mempel, H. Non-destructive measurement method for a fast quality evaluation of fruit and vegetables by using food-scanner. DGG-Proceedings 2018, 8, 1–5. [Google Scholar] [CrossRef]
  70. Subedi, P.P.; Walsh, K.B. Assessment of avocado fruit dry matter content using portable near infrared spectroscopy: Method and instrumentation optimisation. Postharvest Biol. Technol. 2020, 161, 111078. [Google Scholar] [CrossRef]
  71. Kasim, N.F.M.; Mishra, P.; Schouten, R.E.; Woltering, E.J.; Boer, M.P. Assessing firmness in mango comparing broadband and miniature spectrophotometers. Infrared Phys. Technol. 2021, 115, 103733. [Google Scholar] [CrossRef]
  72. Goi, A.; Simoni, M.; Righi, F.; Visentin, G.; De Marchi, M. Application of a Handheld Near-Infrared Spectrometer to Predict Gelatinized Starch, Fiber Fractions, and Mineral Content of Ground and Intact Extruded Dry Dog Food. Animals 2020, 10, 1660. [Google Scholar] [CrossRef]
  73. Pérez-Marín, D.; Paz, P.; Guerrero, J.E.; Garrido-Varo, A.; Sánchez, M.T. Miniature handheld NIR sensor for the on-site non-destructive assessment of post-harvest quality and refrigerated storage behavior in plums. J. Food Eng. 2010, 99, 294–302. [Google Scholar] [CrossRef]
  74. Büning-Pfaue, H. Analysis of water in food by near infrared spectroscopy. J. Food Chem. 2003, 82, 107–115. [Google Scholar] [CrossRef]
  75. Ma, Y.B.; Babu, K.S.; Amamcharla, J.K. Prediction of total protein and intact casein in cheddar cheese using a low-cost handheld short-wave near-infrared spectrometer. LWT 2019, 109, 319–326. [Google Scholar] [CrossRef]
  76. Walsh, K.B.; McGlone, V.A.; Han, D.H. The uses of near infra-red spectroscopy in postharvest decision support: A review. Postharvest Biol. Technol. 2020, 163, 111139. [Google Scholar] [CrossRef]
  77. Zheng, W.; Bai, Y.; Luo, H.; Li, Y.; Yang, X.; Zhang, B. Self-adaptive models for predicting soluble solid content of blueberries with biological variability by using near-infrared spectroscopy and chemometrics. Postharvest Biol. Technol. 2020, 169, 111286. [Google Scholar] [CrossRef]
Figure 1. TSS (°Brix) evolution in Cotton Candy™ and Summer Royal in the season 2020.
Horticulturae 08 00613 g001
Figure 2. TSS (°Brix) evolution in Allison™ and Autumncrisp® in the season 2020.
Horticulturae 08 00613 g002
Figure 3. NIR spectra after the pre-treatments for Allison™ (A) Autumncrisp® (B) Cotton Candy™ (C) and Summer Royal (D) in the season 2020. The different colors indicate the various sampling times for each cultivar as shown in the legends.
Horticulturae 08 00613 g003
Figure 4. PCA after the pre-treatments for Allison™ (A), Autumncrisp® (B), Cotton Candy™ (C) and Summer Royal (D). The different colors indicate the various sampling times for each cultivar as shown in the legends.
Horticulturae 08 00613 g004
Figure 5. Measured versus predicted TSS values in the calibration set and prediction set for Allison™ (A), Autumncrisp® (B), Cotton Candy™ (C) and Summer Royal (D). The different colors indicate the various sampling times for each cultivar as shown in the legends.
Horticulturae 08 00613 g005
Table 1. Comparison between pre-processing operations on TSS, pH, and titratable acidity (TA) of Cotton Candy™ in the season 2019. In grey background the best pre-processing combinations.
ParameterSTDPre-Processing CombinationRMSER2RPDN Latent Variables
TSS2.63Raw Spectra0.690.933.8010
LOGT, FD, SNV0.680.933.9010
LOGT, SD, SNV0.690.933.836
FD, SNV0.680.933.8810
SD, SNV0.960.932.747
pH0.32Raw Spectra0.070.954.3710
LOGT, FD, SNV0.060.964.9812
LOGT, SD, SNV0.070.954.626
FD, SNV0.060.955.0612
SD, SNV0.070.964.767
TA2.38Raw Spectra0.470.965.0612
LOGT, FD, SNV0.510.964.729
LOGT, SD, SNV0.520.954.596
FD, SNV0.490.964.9010
SD, SNV0.520.954.5910
Table 2. PLSR accuracy on grape parameters by means of the best combinations of pre-processing techniques in the season 2019.
ParameterSTDPre-Processing CombinationRMSER2RPD
°Brix7.88LOGT, FD, SNV0.600.9513.10
FD, SNV0.620.9412.70
pH1.82LOGT, FD, SNV0.070.9626.05
FD, SNV0.070.9626.05
TA2.92Raw Spectra0.460.976.35
FD, SNV0.400.977.30
Table 3. Comparison between pre-processing techniques for each cultivar in the season 2020. In grey background the best pre-processing combinations.
ParameterSTDPre-Processing CombinationRMSER2RPDN Latent Variables
Cotton Candy™4.37Raw Spectra0.670.986.536
LOGT, FD, SNV0.600.987.293
LOGT, SD, SNV0.630.986.883
FD, SNV0.590.987.423
SD, SNV0.610.987.214
Allison™5.07Raw Spectra0.960.975.267
LOGT, FD, SNV0.770.986.564
LOGT, SD, SNV0.870.975.824
FD, SNV0.880.975.775
SD, SNV0.910.975.575
Autumncrisp®3.43Raw Spectra0.610.975.646
LOGT, FD, SNV0.440.987.754
LOGT, SD, SNV0.430.988.064
FD, SNV0.540.986.384
SD, SNV0.500.986.834
Summer Royal4.41Raw Spectra0.720.976.147
LOGT, FD, SNV0.570.977.694
LOGT, SD, SNV0.590.987.555
FD, SNV0.610.987.304
SD, SNV0.660.987.705
Table 4. PLSR accuracy for each cultivar by means of the best combinations of pre-processing techniques in the season 2020. In grey background the best pre-processing combinations.
Cultivar STDPre-Processing CombinationRMSER2RPD
Cotton Candy™5.09LOGT, FD, SNV0.680.977.48
FD, SNV0.690.977.37
Allison™6.26LOGT, FD, SNV0.720.978.70
LOGT, SD, SNV0.840.967.45
Autumncrisp®5.83LOGT, FD, SNV0.660.958.84
LOGT, SD, SNV0.600.969.72
Summer Royal5.91LOGT, FD, SNV0.880.956.72
LOGT, SD, SNV0.830.967.12
Publisher’s Note: MDPI stays neutral with regard to jurisdictional claims in published maps and institutional affiliations.

