Article

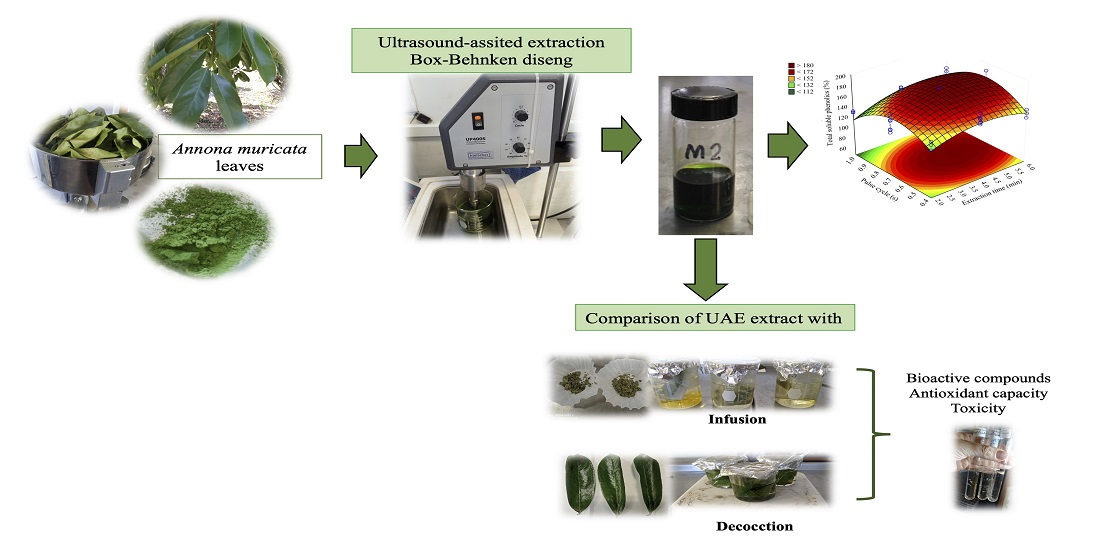
Annona muricata Leaves as a Source of Bioactive Compounds: Extraction and Quantification Using Ultrasound

by
Yolanda Nolasco-González
1,2,
Martina Alejandra Chacón-López
1,
Rosa Isela Ortiz-Basurto
1,
Selene Aguilera-Aguirre
1,
Gustavo Adolfo González-Aguilar
3,
Cristian Rodríguez-Aguayo
4,
Merle Catalina Navarro-Cortez
5,
Hugo Sergio García-Galindo
6,
María de Lourdes García-Magaña
1,*,
Libier Meza-Espinoza
5,* and
Efigenia Montalvo-González
1,*
1
Laboratorio Integral de Investigación en Alimentos, Tecnológico Nacional de México/Instituto Tecnológico de Tepic, Tepic 63175, Nayarit, Mexico
2
Instituto Nacional de Investigaciones Forestales, Agricolas y Pecuarias, Santiago Ixcuintla 63300, Nayarit, Mexico
3
Coordinación de Tecnología de Alimentos de Origen Vegetal, Centro de Investigación en Alimentación y Desarrollo, A.C., Hermosillo 83304, Sonora, Mexico
4
Department of Experimental Therapeutics, The University of Texas MD Anderson Cancer Center, Houston, TX 77030, USA
5
Dirección de Ciencias Agropecuarias, Universidad Tecnológica de la Costa, Santiago Ixcuintla 63300, Nayarit, Mexico
6
UNIDA, Tecnológico Nacional de México/Instituto Tecnológico de Veracruz, Veracruz 91897, Veracruz, Mexico
*
Authors to whom correspondence should be addressed.
Horticulturae 2022, 8(7), 560; https://doi.org/10.3390/horticulturae8070560
Submission received: 17 May 2022 / Revised: 2 June 2022 / Accepted: 10 June 2022 / Published: 21 June 2022

Abstract

:
In this work, the ultrasound-assisted extraction (UAE) (operating conditions of sonication amplitude, pulse-cycle, and extraction time) was investigated to obtain an extract rich in biologically active compounds from Annona muricata leaves. In addition, the content of bioactive compounds from the extract by the optimal UAE conditions (UAE extract) was compared with extracts prepared by decoction and infusion. Moreover, Artemia salina toxicity was evaluated in all extracts. UAE extract (using optimal conditions: 80% amplitude, 0.7 s pulse-cycle, for 4.54 min) contained 178.48 mg/100 mL of soluble phenols, 20.18 mg/100 mL of total flavonoids, 27.81 mg/100 mL of hydrolyzable polyphenols, 167.07 mg/100 mL of condensed tannins, 30.44 mg/100 mL of total alkaloids and 14.62 mg/100 mL of total acetogenins. The UAE extract exhibited a high antioxidant capacity and a higher content of bioactive compounds from ~6 to ~927-fold than decoction or infusion, depending on the type of compound. Twenty-four different phenolic compounds were identified in the samples, and UAE extract produced the highest concentration. All extracts were considered non-toxic using the A. salina test. The UAE extract from A. muricata leaves is a rich source of bioactive compounds and can be utilized to formulate therapeutic drugs or nutraceutical foods.

Graphical Abstract

1. Introduction

Annona muricata L. is a native tree of America that has stirred great interest due to its various therapeutic effects. In traditional medicine, bark, fruit, seed, and leaves have been used to treat fever, pain, headache, insomnia, rheumatism, parasitic and bacterial infections, hypertension, inflammation, diabetes, cancer, respiratory, and skin diseases [1]. In native regions, infusions from dry leaves and decoctions from fresh leaves are used as sedatives for chronic diarrhea, dysentery, hypertension, kidney, and biliary ailments. In addition, the consumption of these beverages has increased in the past few years because they have been attributed to anticancer properties [2].
The biological activities from infusions, decoctions, or extracts from A. muricata leaves are related to their content of bioactive compounds, such as phenolics, alkaloids, and acetogenins [3]. Some identified phenolic compounds are phenolic acids, flavonoids, and gallotannins [4,5,6]. On the other hand, the A. muricata leaves and peels have the highest content of alkaloids than stem bark or fresh pulp. The reported alkaloids from A. muricata leaves are aporphines, isoquinolines, imino sugars, and protoberberines [7,8]. About acetogenins, over forty compounds have been isolated from A. muricata leaves, and annonacin has been reported as the most abundant [9].
Given the ethnomedicinal importance of A. muricata leaves, it is relevant to consider an appropriate extraction method of bioactive compounds. The most critical factors are raw materials, solvents, temperature, time, matrix: solvent ratio, and extraction methods [10]. Different authors have used maceration, percolation, homogenization, and heat (Soxhlet method) to extract bioactive compounds from A. muricata leaves. However, these traditional or conventional methods have disadvantages; they use high amounts of solvents, high temperatures, and long extraction times that may affect the stability, yield, and performance of thermolabile compounds such as phenolic compounds and alkaloids [11,12]. Non-conventional extraction is studied to extract bioactive compounds from plants to substitute traditional methods. These methods use a low amount of solvents, short extraction times with high yields, and improve the extraction of heat-sensitive compounds [13]. Some non-conventional methods include pulsed electric fields, microwave, ohmic heating, and ultrasound. Ultrasound technology is considered an inexpensive, fast, and efficient alternative for extracting bioactive compounds. Ultrasound produces accelerated cavitation when employed at high intensities (200–800 W, 24 kHz) that can cause physical and mechanical changes in the raw material and facilitates the extraction of bioactive compounds [14,15]. However, to obtain efficient and effective yields by ultrasound assisted-extraction (UAE) in each raw material, it is necessary to evaluate different factors that affect the extraction process, such as solvents, ratios, particle size, temperature, frequency, amplitude, pulses, and extraction time among others [13].
Only two reports describe the extraction of alkaloids and phenolic compounds by UAE from A. muricata leaves. Lee et al. [16] demonstrated that alkaloids extraction from A. muricata leaves by a digital ultrasonic bath (280 W, 30 min, 47 °C) combined with a stirrer promoted a considerable yield of alkaloids and antioxidant activity compared to Soxhlet extraction. Recently, Leal et al. [17] extracted the highest content of phenolic compounds (~42 mg/g) from A. muricata leaves using UAE (45 °C, 2 h). However, the authors failed to mention the power of the ultrasonic application. Ultrasound methodology is rapid and offers high extraction efficiency compared with the steeping or soxhlet method.
Nevertheless, it has been demonstrated that the ultrasound equipment with an ultrasonic probe can be more effective in extracting bioactive compounds than an ultrasonic bath because the generated energy from cavitation is in direct contact with the matrix and increases the fragmentation, as well as solvent transfer into plant cells [18]. Additionally, response surface methodology (RSM) can be employed together with suitable experimental designs as an excellent tool to predict and estimate the significant effects of processing factors on response variables [19]. Therefore, it is necessary to investigate UAE conditions using an ultrasonic probe to optimize the best extraction process, increase the yield and consider the A. muricata leaves as a rich source of bioactive compounds.
The objective of this work was to obtain an extract rich in bioactive compounds from A. muricata leaves using optimal UAE conditions. Also, to compare the content of bioactive compounds from the extract obtained with the optimal UAE conditions (UAE extract) with extracts obtained by decoction and infusion.

2. Materials and Methods

2.1. Chemicals and Reagents

The chemicals and reagents were of analytical grade or better. Polyphenol standards, Folin-Ciocalteu reagent, 1,1-diphenyl-2-picrylhydrazyl, 2′-Azinobis-(3-ethylbenzothiazoline-6-sulfonic acid), 2,4,6-tripyridyl-s-triazine, HPLC solvents (water, trifluoroacetic acid acetonitrile) were obtained from Sigma-Aldrich Chemical Co., Ltd. (St. Louis, MO, USA). Chloroform, acetone, sodium hydroxide, dichloromethane, and petroleum ether were purchased from Jalmek Scientific S.A., Nuevo Leon, Mexico.

2.2. Plant Material

Mature leaves of A. muricata (dark green color and leathery texture) with an average size of 13.7 cm long and 5 cm wide were collected from a pesticide-free orchard in Camichin de Jauja, Nayarit, Mexico, in February 2021. The plant material was classified by the National Laboratory for Plant Identification and Characterization (LANIVEG) of the University of Guadalajara under the voucher specimen number SIST-TRA-2022-4 and preserved in the Luz María Villarreal de Puga Herbarium of the Botanical Institute of the University of Guadalajara (#213959). The leaves were washed with running water and dried in an oven (Memmert 854, Schwalbach, Western Germany) at 40 °C for 36 h. Then, dried leaves were ground with a mill (CGoldenWall HC-2000, San Francisco, CA, USA) to a particle size range from 55–177 μm. The samples were placed in plastic bags and kept at −20 °C until used.

2.3. Ultrasound-Assisted Extraction (UAE) of Phenolic Compounds

A Box–Behnken design (sonication amplitude (XA: 40%, 60%, 80% or 6 W/mL, 9 W/mL or 12 W/mL), pulse cycle (XPC: 0.4 s, 0.7 s, 1 s), and extraction time (XTE: 2 min, 4 min, 6 min)) was employed to extract phenolic compounds from A. muricata leaves by ultrasonic-assisted extraction. The extracts were analyzed by measuring total soluble phenols (TSP) and yield. Table 1 shows all the treatments evaluated, considering a randomized experimental design.
TSP were extracted using 0.5 g of dried leaves powder and 20 mL of acetone: water (80:20 v/v). Ultrasound was applied with an ultrasonic generator (Hielscher, UP400S, Teltow, Germany) of high intensity (maximal nominal output power of the device, 400 W) at a frequency of 24 kHz and with an ultrasonic probe H7 Tip 7 (acoustic intensity 300 W/cm2 and Hielscher, Teltow, Germany) that was immersed 2 cm into the extraction solution. The UAE conditions were applied according to the experimental design. A cold-water bath was employed to maintain the extraction temperature at 25 ± 2 °C. The samples were extracted twice, and the extracts were centrifuged (Hermle Z32HK, Wehingen, Germany) at 9380× g for 10 min at 4 °C. The supernatants were concentrated in a rotary evaporator (Yamato Scientific Co., Ltd., RE301, Tokyo, Japan) at 40 °C to a volume of 8 mL (acetone-free extract). TSP were measured in the concentrated extracts.

2.4. Total Soluble Phenols (TSP)

The TSP content was determined using the Montreau method [20] with slight modifications. The concentrated extracts (12 µL) were mixed with 12 µL of Folin-Ciocalteu reagent (Sigma-Aldrich, St. Louis, MI, USA), 116 µL of sodium carbonate solution (75 g/L), and 164 µL of distilled water; the mixture was stirred for 15 min in darkness. Absorbance was measured at 750 nm with a microplate reader (800TS, Biotek, Winooski, VT, USA). The results were calculated as milligrams of gallic acid equivalents per gram of dry extract or 100 mL extract (mg/g DW or mg/100 mL).

2.5. Yield of Total Soluble Phenols

The yield was calculated in percentage from the total weight of the sample (g) according to Equation (1) [21].
Yield ( % ) = Total   soluble   phenols ( g ) Sample ( g ) × 100  

2.6. Response Surface Methodology Analysis (RSM) to Obtain the Optimal UAE Conditions

The TSP and yield data were analyzed for RSM to achieve the optimal extraction conditions. A second-order polynomial equation was used to calculate the predicted response (Equation (2)),
Y = β 0 + i = A E β iXi + i = A E j = A i E β ijXi + E
where Y is the predicted response (TSP or Yield), Xi is the value of each factor (XA, XPC, and XET), β0 is a constant, and βi are the principal effect coefficients for each variable, and βij are the interaction effect coefficients. Model adequacy was assessed by analysis of variance (ANOVA) using the Statsoft® statistical software v. 10 (Tulsa, OK, USA) to determine the effects of significant interactions in the model (p < 0.05) and by quantification of the coefficient of determination (R-squared and R-adjusted). The Fisher-LSD test assessed the differences between means (p < 0.05).

2.7. Model Reliability and Comparison of the Content of Bioactive Compounds from A. muricata Leaf Extract Using Optimal UAE Conditions with Extracts by Decoction and Infusion

The optimal conditions by UAE were performed experimentally to examine the model accuracy, and the TSP content was measured again. Moreover, the bioactive compound content was compared between UAE, decoction, and infusion extracts from A. muricata leave.
Thermal treatments were made as the consumers usually prepare the infusion and decoction from A. muricata leaves. The infusion was prepared by placing 2.5 g of dried crushed leaves wrapped into filter paper in 250 mL of hot water (98 °C) for 10 min. The decoction was performed with 5 g of fresh leaves placed in boiling water (98 °C) for 10 min [22]. The extracts were cooled down and analyzed. Response variables were: phenolic compounds, antioxidant capacity (AOX), total alkaloids, total acetogenins, and toxicity. Also, the effectiveness of the UAE concerning thermal treatments was calculated.

2.7.1. Phenolic Compounds

TSP were performed as was described in Section 2.4. The total flavonoid content was measured by a spectrophotometric assay [23]. The reaction consisted of 1 mL of extract, 1 mL of methanol, and 1 mL of 2%AlCl3 solution. The mixture was maintained in the dark with continuous stirring for 10 min. The absorbance was measured at 415 nm in the microplate reader. Results were calculated as milligrams of quercetin equivalents per gram of dry extract or 100 mL extract (mg/g DW or mg/100 mL extract).
After soluble phenols, hydrolyzable polyphenols and condensed tannins were analyzed only in the dried extracts (200 mg). The samples were hydrolyzed with methanol/H2SO4, 90:10 (v/v) at 85 °C for 20 h. After the samples were centrifuged (10 min, 25 °C, 5000× g) and the precipitates were resuspended twice with 10 mL of methanol and centrifuged. The supernatants were combined, and hydrolyzable polyphenols were measured by the Folin-Ciocalteu reagent [20,24]. To measure condensed tannins, the dried extracts were treated with 10 mL of a butanol/HCl/FeCl3 (97.5:2.5, v/v) solution at 100 °C for 3 h. Afterward, they were centrifuged (10 min, 4 °C, 6000× g), and the residues were rewashed with the same solution. The supernatants were combined, and the absorbance was read at 555 nm in the microplate reader. Condensed tannins were calculated with a standard curve of pro-anthocyanidins from Mediterranean carob pods (Ceratonia siliqua L.) [25]. The results were expressed as mg/g DW or mg/100 mL.

2.7.2. Total Alkaloids

The extracts (38 mL) were added to 1.8 mL HCl (3%), and they were moderately shaken for 4 h at room temperature and kept in refrigeration (4 °C) overnight. The extract was centrifuged (21,105× g, 10 min at 4 °C), the supernatants were placed on ice, and the pH was adjusted to 10 with NaOH (15%). Then, CH2Cl2 in a 1:2 ratio (extract:CH2Cl2, v/v) was added, and the organic layer was recovered. Next, CH2Cl2 was added two times more, and the organic layers were combined. The organic phase was kept at 4 °C and concentrated in a rotary evaporator at room temperature to a volume of 8 mL. The samples (100 µL) were mixed with 1000 µL of Dragendorff reagent. The absorbance was measured at 530 nm in a spectrophotometer (Jenway 6705, Dunmow, UK). The results were expressed as milligrams of quinine equivalents per gram of dry extract or 100 mL of extract (mg/g DW or mg/100 mL) [26].

2.7.3. Total Acetogenins

Total acetogenins were determined as described by Aguilar-Hernández et al. [27] with slight modifications. The UAE, decoction, and infusion extracts were freeze-dried (Labconco FreeZone 2.5 Plus cascade benchtop 7670020, Kansas City, MO, USA). Freeze-dried samples (0.2 g) were mixed with 10 mL of chloroform and shaken moderately for 2 h. Then, the mixtures were centrifuged (9380× g, 10 min at 4 °C). The supernatant was saved, and the residues were resuspended with 10 mL chloroform, shaken for 1 h, and centrifuged again. The supernatants were combined and cleaned through a chromatographic column (25 cm long × 2.5 cm diameter) loaded with activated carbon (2.5 g) using chloroform (10 mL). Subsequently, petroleum ether (5 mL) was added to the samples, and the organic phase was discarded. The cleaned samples (250 µL) were mixed with Kedde’s reagent (2 mL). The absorbance was measured at 505 nm in the spectrophotometer. The results were expressed in mg/g DW or mg/100 mL extract.

2.7.4. Identification of Phenolic Compounds

Identification of phenolic compounds was performed by HPLC according to Aguilar-Hernández et al. [28] with some modifications. The extracts (10 µL) were injected into the HPLC system (Agilent Technologies 1260 Infinity, Waldbronn, Germany) equipped with a photodiode array detector fitted with a Poroshell 120 EC-C18 reverse-phase column (2.7 µm particle size, 4.6 mm in diameter, 100 mm long; Agilent Technologies). The mobile phase consisted of acidified water with 0.10% trifluoroacetic acid (eluent A) and acetonitrile (eluent B). The standards and extracts were analyzed with a gradient program: 0% B, 0–10 min 10% B, 10–15 min 20% B, 15–20 min 25% B, 20–35 min 35% B, 35–55 min 75% B, 55–57 min 100% B, 57–62 min 65% B, 62–65 min 35% B, and 65–70 min 0% B, at a flow rate of 0.5 mL/min. The peak areas were detected at 270–320 nm. Quantification of phenolic compounds was realized by calibration curves of standards (0.5–300 µg/mL). The results were expressed in mg/100 mL.

2.7.5. Effectiveness of Ultrasound to Extract Bioactive Compounds Compared with Decoction and Infusion

The UAE effectiveness [26] was calculated with Equation (3):
Effectiveness ( n fold ) = ( BC Content UAE BC Content decoction   or   infusion )
where:
  • BC-ContentUAE = Bioactive compound content measured in UAE extract.
  • BC-Contentdecoction or infusion = Bioactive compound content measured in infusion or decoction extract.

2.7.6. Antioxidant Capacity (AOX)

Three essays of AOX were performed [ABTS (2,2′-Azinobis-(3-ethylbenzothiazoline-6-sulfonic acid), DPPH (1,1-diphenyl-2-picrylhydrazyl), and FRAP (Ferric-ion reducing antioxidant power) assays] from extracts. The ABTS+ solution (7 mM, 265 µL) was reacted with the extracts (35 µL) and shaken in the dark for 7 min. The absorbance was measured at 730 nm [29]. DPPH radical scavenging assay was performed according to the method described by Prior et al. [30]. The extracts (40 µL) were mixed with 260 µL of DPPH solution (190 µM), and the absorbance was measured at 517 nm. For the FRAP assay, 264 µL of FRAP solution (10:1:1, sodium acetate buffer (0.3 M, pH 3.6), 10 mM 2,4,6-tripyridyl-s-triazine, and 20 mM hexahydrate ferric chloride) was mixed with 36 µL of the extracts and 9 µL distilled water. The absorbance was measured at 595 nm after 30 min stirring in the dark [31]. All absorbances were measured in the microplate reader. The results were expressed as millimole Trolox (6-hydroxy-2,5,7,8-tetramethylchroman-2-carboxylic acid) equivalents per 100 mL of extract (mmol/100 mL).

2.7.7. Toxicity with the Brine Shrimp Lethality Test

Toxicity was evaluated from UAE, decoction, and infusion extracts according to the Anaya-Esparza et al. [32] method. The test was performed using the A. salina in the early stage (3 weeks of growth, 2 cm in length). Ten adult organisms for each treatment were placed into a tube containing 10 mL of saline water (30 mg/mL, non-iodized sea salt). Each dried extract was resuspended in 1 mL of saline water. A. salina were exposed to 1500, 1000, 500, and 100 μg/mL for 24 h at 28 °C in darkness. A negative control (1 mL saline water) was used. Each concentration was tested in triplicate in three replicated experiments. The number of survivors was counted after 24 h of exposure, and dead A. salina was considered those that did not exhibit any internal or external movement during several seconds of observation.

2.8. Statistical Analysis

In the first stage, RSM was used. The experimental data were analyzed in a unifactorial design in the second stage. Data analyses were performed using analysis of variance (ANOVA) (p < 0.05) with the STATISTICA v.10 software (Stat soft, Tulsa, OK, USA). The LSD-Fisher test was employed (α = 0.05) to examine the significant difference between means.

3. Results and Discussion

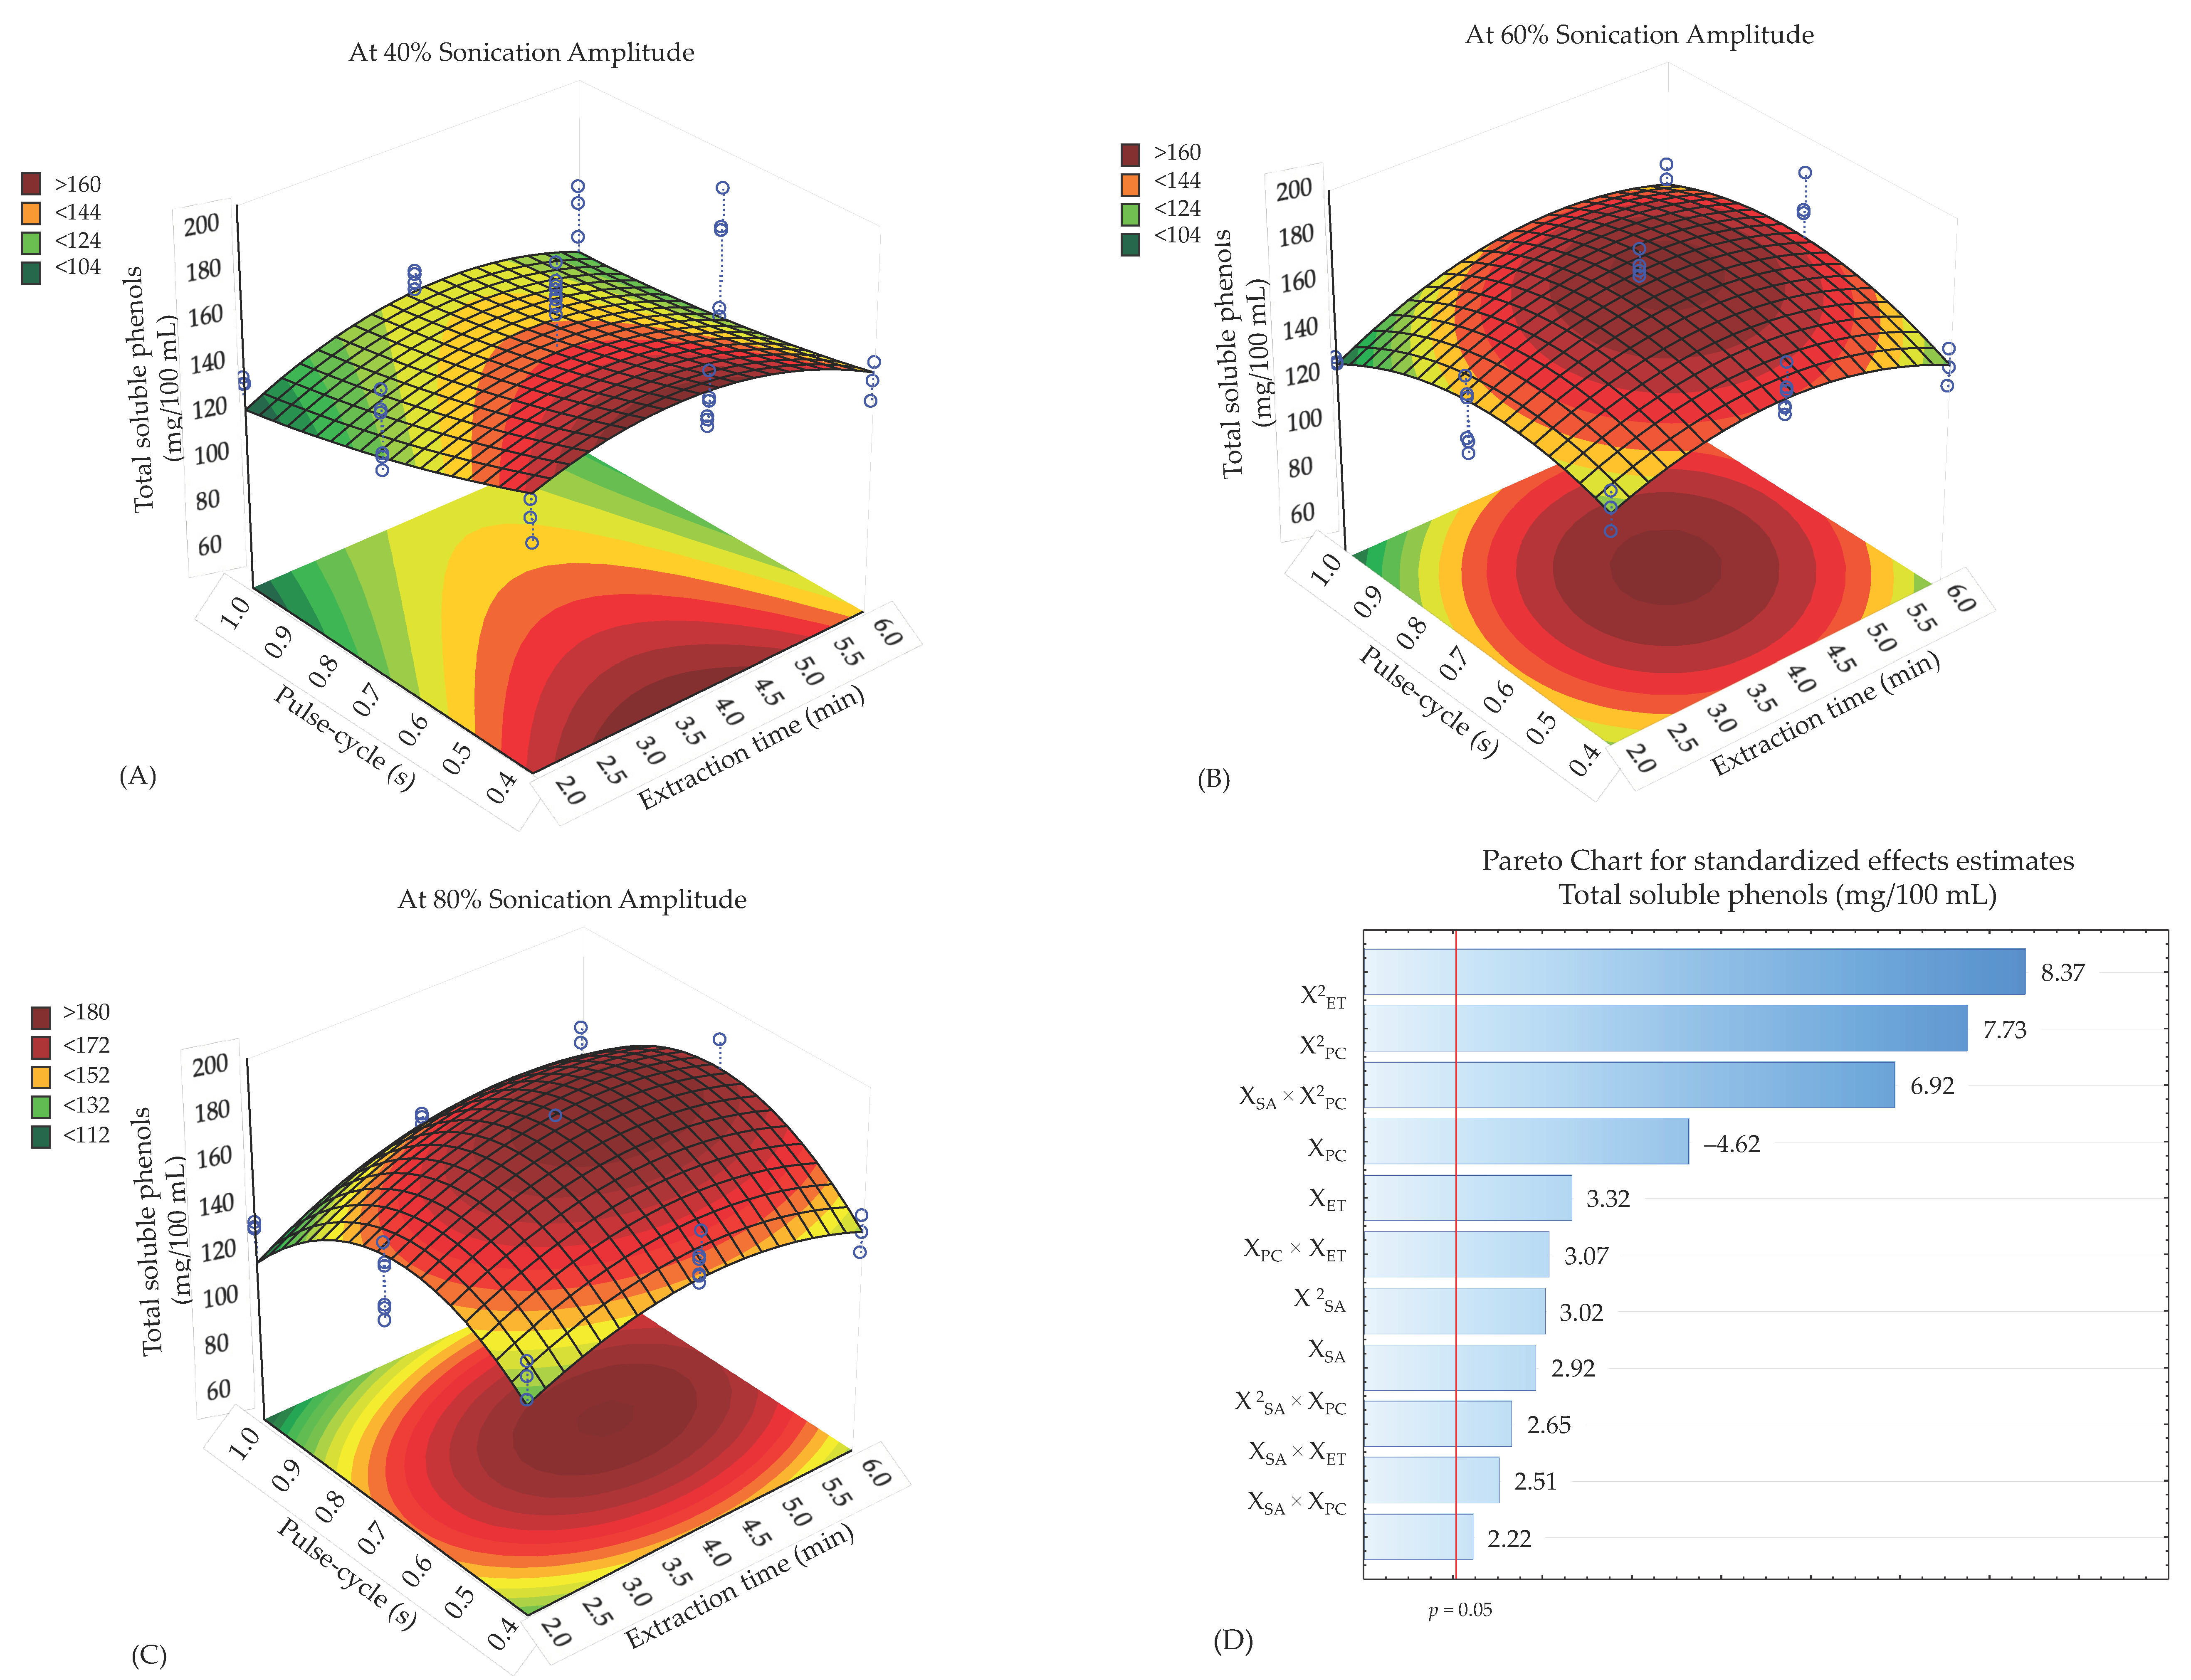
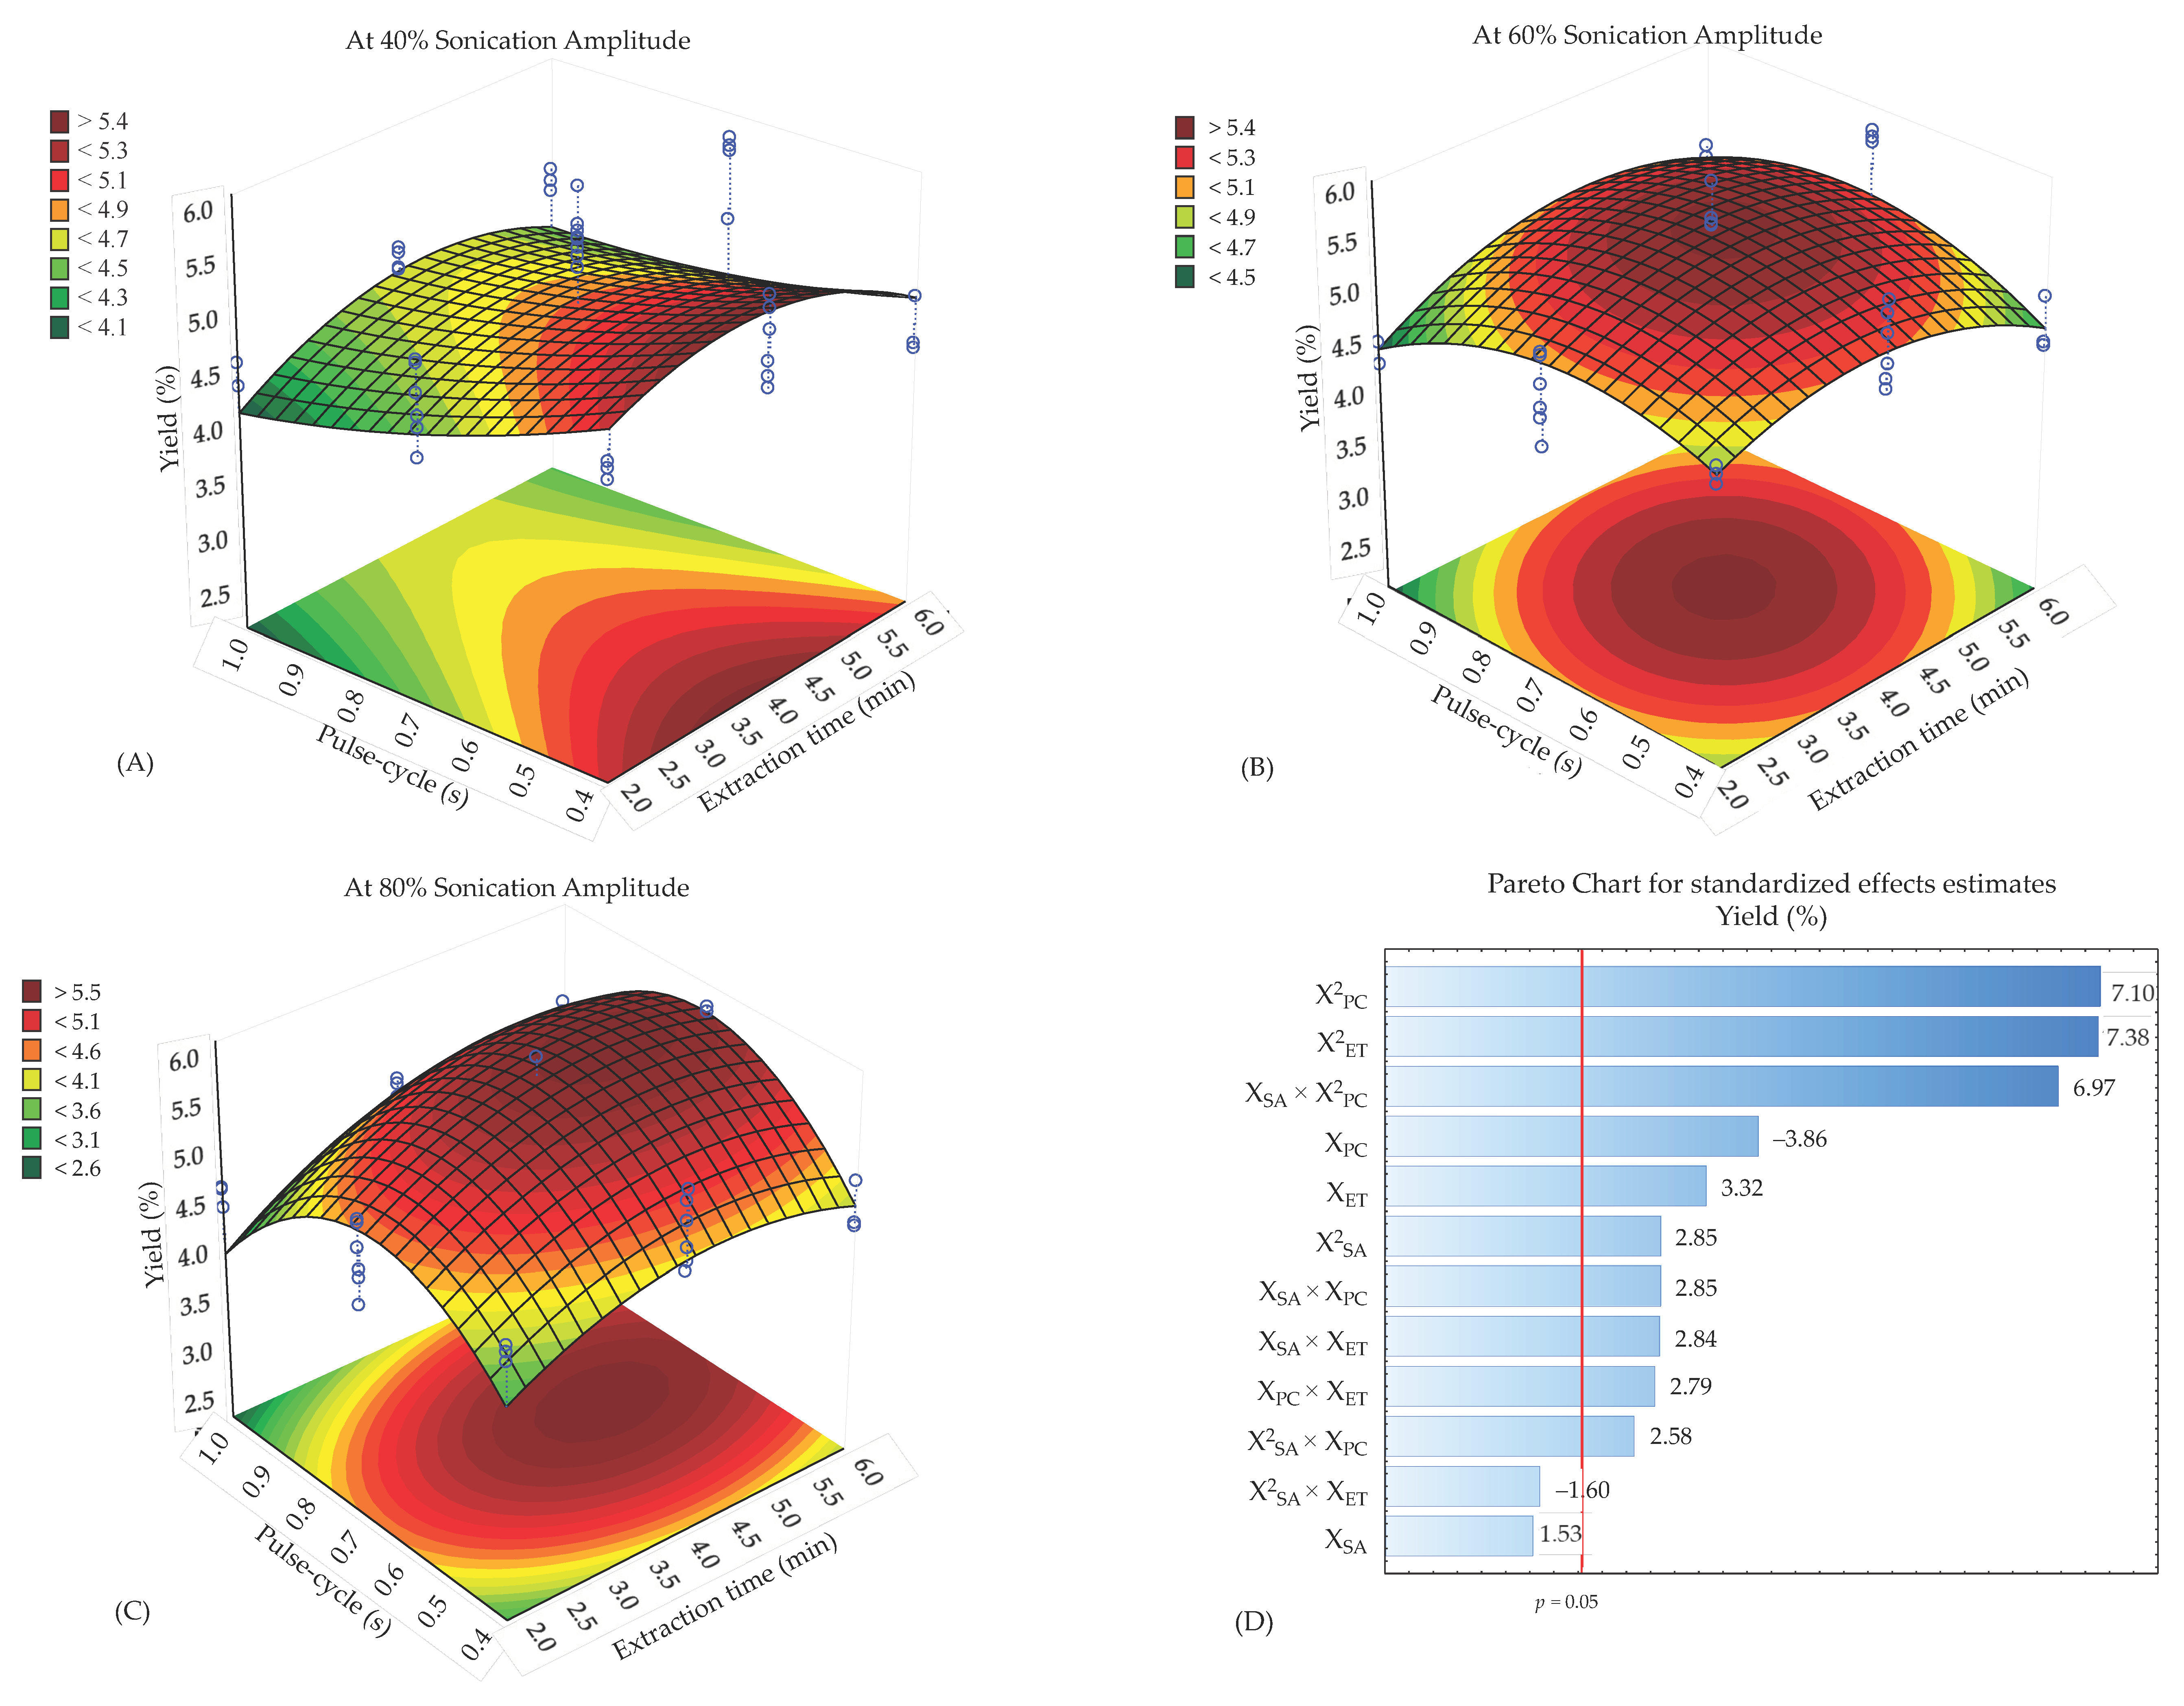
3.1. Total Soluble Phenols and Yield from A. muricata Leaves by Ultrasound-Assisted Extraction

Table 1 shows significant statistical differences (p < 0.05) between treatments. Results showed a dependence on the experimental conditions. During UAE, the temperature was maintained at 25 ± 2 °C. The highest content of TSP and yield were 174.32 mg/100 mL (or 236.85 mg/g of dry extract) and 5.68% with a 0.7 s pulse-cycle and a sonication amplitude of 60% for 4 min. However, the conditions that produced the lowest TSP and yield values were 60% sonication amplitude, 1 s pulse-cycle, and 2 min. According to the suggested classification by Vasco et al. [33], phenolic compound levels can be divided into (i) low (5 mg/g DW), (ii) intermediate (5–25 mg/g DW), and (iii) high, when they are greater than 25 mg/g DW. A. muricata leaves contained an intermediate polyphenol level, with a phenolic content higher than the green tea infusion (66.77 mg/100 mL) [34].
In this study, the TSP values from aqueous UAE extract were three times greater than the soluble phenols reported as gallic acid equivalents from aqueous extracts by stirring (68.37 mg/100 mL), maceration (26.2 mg/g of extract), and ultrasonic bath (42 mg/g of extract) from A. muricata leaves, [6,17,35]. It is attributed to the direct contact of the ultrasonic probe with the samples, which generate high-intensity ultrasonic waves. The energy released by the implosion of the microbubbles impacts the plant material dispersed in the solvent. The cell wall is thus broken, and larger pores are produced that facilitate mass transfer from plant material to the solvent, thus increasing the yield [18,36]. However, sometimes UAE causes adverse effects, although it is dependent on operating conditions [31].

3.2. Optimal UAE Conditions to Extract Total Soluble Phenols from Annona muricata Leaves

The response surface analysis on the TSP content and yield as a function of the independent variables (XSA, XPC, XTE) was performed using multiple regression. The ANOVA proved that most of the parameters and their combinations were significant (p < 0.05) on TSP (Table S1). Also, ANOVA confirmed that experimental data had significant correlation coefficients (R2 = 0.886 an R2 = 0.873, respectively) and adjusted correlation coefficients (adjusted R2 = 0.848 and 0.826) with the calculated models (quadratic polynomials). Moreover, b-coefficients of the fitted quadratic polynomial models for TSP and yield were significant (p < 0.05), except X2SA. The lack of fit test showed the adequacy of the model (p > 0.05), indicating a good approximation to the real system.
The regression model predicted the TSP content and yield with the quadratic polynomial equations (Table S2) 95% confidence level. The predicted values exhibited a close relationship to the experimental data (see Table 1). It is the first report where a Box-Behnken design and RSM are employed to attain optimal UAE conditions (sonication amplitude, pulse-cycle, and extraction time) of phenolic compounds from A. muricata leaves. However, some authors have evaluated the same independent variables in starfruit leaves [37] and Justicia spicigera leaves [38]. They found high correlation coefficients (R2 = 0.884 and R2 = 0.978, respectively), concluding that RSM is an efficient tool to optimize UAE conditions in extracting phenolic compounds from leaves.
The significant interactions of the UAE parameters on TSP content and yield are depicted in Figure 1 and Figure 2. The three-dimensional (3D) response surface plots show elliptical contour shapes attributed to the interactions between the corresponding variables. At 40% sonication amplitude, the highest TSP (Figure 1A) and yield (Figure 2A) extraction were obtained with a 0.3 s pulse-cycle and 3.5 min extraction time. For 60% sonication amplitude, the highest TSP content (Figure 1B) and yield (Figure 2B) are observed with a 0.7 s pulse cycle with 4 min extraction time, while at 80% amplitude, the highest TSP content (Figure 1C) and yield (Figure 2C) are observed with 0.7 s pulse cycle and 4.5 min extraction time. Figures 1D and 2D (Pareto plots) validate the effect of the independent variables and their interaction on TSP and yield at a 95% confidence level. The main effects of linear or quadratic parameters were X2PC > X2ET > XSA × X2PC.
Pulse-cycle, extraction time, and sonication amplitude were the most critical factors involved in phenolics extraction and yield from starfruit leaves [37], Justicia spicigera leaves [38], and guava leaves [39]. However, 100% sonication amplitude, constant acoustic irradiation (1 s pulse-cycle), and long extraction times (>5 min) caused a high cavitation phenomenon and sonolysis that degraded thermolabile bioactive compounds [10,40].
In this study, the UAE application at 1 s pulse-cycle (constant ultrasonic waves), any extraction time, and sonication amplitude tends to extract low TSP content from A. muricata leaves. The results coincided with the study by Anaya-Esparza et al. [38]. These authors reported that the highest extraction time (12 min), 1 s pulse-cycle, and 100% sonication amplitude caused the lowest TSP content from Justicia spicigera leaves. In contrast, 0.4 s and 0.7 s pulse-cycle are pulsed acoustic irradiations that decrease the ultrasonic energy and the effect of sonolysis [10]. Therefore, the optimal UAE conditions (80% sonication amplitude, 0.7 s pulse-cycle, and 4.54 min) to extract the highest TSP content and yield from A. muricata leaves are shown in Table 2. The predicted optimal response of TSP was 180.52 mg/100 mL within the permitted confidence limit (95%) of 166.47 to 184.55 mg/100 mL of extract. With respect to yield, it was 5.86%, within the permissible confidence limit (95%) of 5.43 to 6.30%.

3.3. Model Reliability and Comparison of the Content of Bioactive Compounds from A. muricata Leaf Extract Using Optimal UAE Conditions with Extracts by Decoction and Infusion

The optimal UAE conditions were conducted experimentally to verify the model reliability, resulting in an extract with 178.48 mg/100 mL (or 237.92 mg/g of dry extract) (Table 3). In addition, flavonoids (20.18 mg/100 mL or 27.31 mg/g of dry extract), alkaloids (30.44 mg/100 mL or 51.21 mg/g of dry extract), and total acetogenins (14.62 mg/100 mL or 19.44 mg/g of dry extract) were mostly extracted (p < 0.05) from A. muricata leaves by the optimal UAE conditions compared with decoction and infusion (Table 3). The hydrolyzable polyphenols have not been reported in A. muricata leaf extracts; however, they were quantified in the UAE extract (27.81 mg/100 mL or 38.80 mg/g of dry extract) as well as condensed tannins (167.07 mg/100 mL or 224.87 mg/g of dry extract). Furthermore, decoction and infusion showed low hydrolyzable polyphenols and condensed tannins content. It is inferred that these phenolic compounds (hydrolyzable and condensed tannins) are poorly extractable with water and conventional methods because they are embedded in the cell wall. However, heat modifies cellular structure, and some compounds are released due to the leaching effect [24,25]. However, ultrasound breaks the cell walls to remove non-extractable polyphenols and causes a UAE extract rich in phenolic compounds (extractable and non-extractable).
The reported flavonoid content from A. muricata leaves using three days of maceration was 19.14 mg/100 mL [41], although the extraction time was shortened with UAE in this experiment. In contrast, tannins (1.22 mg/g of dry extract) [42], alkaloids (39.37 mg/g of dry extract) [16], and acetogenins (0.318–15.05 mg/g of dry extract) [43,44] from A. muricata leaves are lower than found in this work using maceration, ultrasonic bath, decoction, and infusions; therefore, it can be inferred that the use of a direct ultrasonic probe to the matrix is much more effective to extract these bioactive compounds than conventional methods or ultrasonic bath.
In addition, the UAE was more effective in extracting bioactive compounds from ~7-fold to ~927-fold, dependent on each type of measured compound (Table 3). These findings agree with Anaya-Esparza et al. [38] when different methods for extraction (ultrasound and thermal decoction) of phenolic compounds from Justicia spicigera leaves were performed. They reported an 11-fold increase in total polyphenols when the sample was treated by UAE (55% amplitude, 0.7 s pulse-cycle, and 3 min) than thermal decoction. On the other hand, Aguilar-Hernández et al. [30] compared UAE (100% amplitude, 0.7 pulse-cycle and 15 min) and maceration for ACGs extraction from A. muricata seeds. They reported that ~UAE extracted 10-fold more ACGs than maceration. Lee et al. [16] reported 2.3-fold more alkaloids from A. muricata leaves extract with UAE (340 W, 56 °C, 30 min) than soxhlet extraction (7 h, 80 °C).
The highest extraction of bioactive compounds by UAE adapted with an ultrasonic probe generates high-intensity waves with a high disrupting effect on the plant cell walls [14]. At the same time, thermal treatments (decoction or infusion) did not extract a high content of bioactive compounds. It can be attributed to elevated extraction temperatures, which degrade these compounds [45,46]. In addition, using whole fresh leaves or dried crushed leaves did not allow for good mass transfer compared with powdered leaves used in UAE [13].
Figure 3 shows that AOX was higher in the UAE extract than in decoction and infusion extracts. The order of AOX was as follows FRAP > DPPH > ABTS. Documented studies of A. muricata leaf extracts have exhibited AOX by FRAP > ABTS or DPPH assays using maceration and Soxhlet methods [6,47]; however, it is difficult to compare data because the reported units are different. The highest AOX by FRAP assay is attributed to flavonoids and tannins with chelating capacity. The hydroxyl groups (-OH) in the B ring of flavonoids (catechins, quercetins, and kaempferol derivates) and tannins (proanthocyanins) strongly support the hypothesis that these phenol families are responsible for the highest antioxidant activity through the hydrogen transfer mechanism [48], metal-chelating ability (Fe+) and radical scavenging [49,50]. However, the reducing or chelating activities depend not only on the total polyphenol content but also on the specific chemical structure and the number and position of hydrogen donating hydroxyl groups on the aromatic cycles of the phenolic molecules [49,51]. On the other hand, the extract by decoction exhibited more TSP than the extract by infusion; thus, AOX was greater in decoction extract. This result was attributed to when preparing the infusion; the leaves were previously dried (40 °C) and then subjected to hot water (80 °C); therefore, the soluble phenolic compounds decreased most likely because they were more thermo-sensitive [51].

3.4. Phenolic Profile

In the extract by UAE, twenty-four phenolic compounds were identified and quantified (Figure 4), while in the decoction and infusion extracts, twenty-three and twenty-two were identified. The phenolic compounds found in the highest contents in the UAE extract were epigallocatechin (14.80 mg/100 mL), gallocatechin (7.59 mg/100 mL), gallic acid (6.80 mg/100 mL), ρ-coumaric acid (6.79 mg/100 mL) and 4-hydroxyphenyl acetic acid (6.28 mg/100 mL), while in the decoction and infusion extracts, the phenolic compounds detected in the highest proportion were gallocatechin with 7.59 mg/100 mL and 7.01 mg/100 mL respectively, followed by the 4-hydroxyphenyl acetic acid, homovanillic acid, ρ-coumaric acid and neochlorogenic acid (Table 4). Similarly, some phenolic compounds have been reported from an infusion of A. muricata leaves, such as rutin (1.78 µg/mg), chlorogenic acid (1.40 µg/mg), catechin (1.11 µg/mg), and gallic acid (0.27 µg/mg) [52], but in much lesser concentrations than those found in this work. The effect of the extraction method was notable; the UAE extract exhibited higher content of phenolic compounds than infusion and decoction extracts (p < 0.05). It can be explained because the thermal extraction methods could induce the degradation of phenolic acids [51]. However, this depends on the type of polyphenol moieties because there were some exceptions. The content of protocatechuic acid, chlorogenic acid, gallocatechin, and catechin was statistically similar between extracts (p > 0.05). UAE extract resulted rich in phenolic compounds, which coincided with antioxidant capacity.
In this experiment, the obtained UAE extract from A. muricata leaves is considered a source of bioactive compounds with potential health benefits. The phenolic compounds (extractable or non-extractable) are potent antioxidants. Also, it has been demonstrated that these same compounds exhibited antibacterial, anti-inflammatory, antiaging, anticarcinogenic, antidiabetic, hepatoprotective, and immunostimulatory activities [53,54].
Catechins (gallocatechin, epigallocatechin, epicatechin, catechins, and other isomers) have been reported to have antibacterial activity by binding to the cell membrane causing the membrane to burst by damaging the lipid layer and releasing its cytoplasmic contents, with subsequent cell death [55]. Other studies demonstrated that gallic acid and its derivatives have a potential anticancer activity due to the pro-oxidant action of the gallate compounds, whose mechanism of action is associated with oxidative stress, causing mitochondrial dysfunction and an increase in the level of intracellular Ca2+, which induces the death of tumor cells, since these cells lack the protection system of catalase [56].
On the other hand, reported isoquinoline alkaloids in A. muricata have exhibited anti-depressant, analgesic, and dopaminergic activities [7]. Acetogenins, correspondingly, are the specific compounds mainly studied in the Annonaceae family by their anticancer activity on different cancer cell lines such as breast, prostate, and liver, among others [2]. The UAE extract, rich in phenolic compounds, alkaloids, and acetogenins, is a potential source for alternative medicine.

3.5. Toxicity with the Brine Shrimp Lethality Test

The UAE, decoction, and infusion extracts did not manifest any alteration of motility and behavior of A. salina larvae in any of the concentrations; therefore, the 100% A. salina survived. González-Esquinca et al. [57] demonstrated that the toxicity of the ethanolic dried extract (LC50 = 831 µg/mL) was higher than the aqueous extract obtained by boiling 20 min (LC50 > 1000 µg/mL) from A. muricata leaves against A. salina nauplii. The differences in the toxicity reports from A. muricata leaves extracts with this experiment can be by the age of larvae, solvents to obtain extracts, and extraction methods that can influence the type and quantity of bioactive compounds extracted.
According to the Clarkson´s toxicity index, the plant extracts are considered toxic when LC50 is <100 µg/mL, intermediate toxic when LC50 is 100–500 µg/mL, low toxic when LC50 is 500–1000 µg/mL and non-toxic when LC50 is >1000 µg/mL) [58]; therefore, the evaluated extracts are considered non-toxic.

4. Conclusions

An aqueous extract rich in bioactive compounds (phenolic compounds, alkaloids, acetogenins, and antioxidant capacity) was obtained from A. muricata leaves using ultrasound-assisted extraction. In addition, UAE was more effective in extracting bioactive compounds from A. muricata leaves and increasing the antioxidant capacity of the extract than decoction and infusion extracts. UAE extract exhibited the presence of eighteen phenolic acids, five flavonoids, and one ellagic tannin. All extracts were assessed as non-toxic according to the brine shrimp lethality test. The present study highlights that ultrasound applied directly to the raw material with an ultrasonic probe is an efficient technology to obtain an extract from A. muricata leaves as a source of bioactive compounds. Thus, these extracts can be incorporated into capsules, food, and beverages to increase the content of phenolic compounds, antioxidant capacity, and other bioactive compounds that can contribute to consumer health.

Supplementary Materials

The following are available online at https://www.mdpi.com/article/10.3390/horticulturae8070560/s1, Table S1: Analysis of variance and regression coefficients of quadratic polynomial models with ultrasonic-assisted extraction on total soluble phenols and yield from extracts of Annona muricata leaves. Table S2: The predicted mathematical models for the extraction of soluble polyphenols (mg/100 mL) and yield from extracts of Annona muricata leaves after ultrasound-assisted extraction.

Author Contributions

Conceptualization, Y.N.-G.; M.d.L.G.-M., L.M.-E. and E.M.-G.; methodology, Y.N.-G., R.I.O.-B. and M.A.C.-L.; validation, Y.N.-G. and S.A.-A.; formal analysis, Y.N.-G. and M.C.N.-C.; data curation, C.R.-A., G.A.G.-A. and E.M.-G.; writing—original draft preparation, Y.N.-G., R.I.O.-B., M.A.C.-L., M.d.L.G.-M. and E.M.-G.; writing—review and editing, H.S.G.-G., L.M.-E. and E.M.-G.; project administration, E.M.-G.; funding acquisition, L.M.-E. and E.M.-G. All authors have read and agreed to the published version of the manuscript.

Funding

This research received no external funding.

Institutional Review Board Statement

Not applicable.

Informed Consent Statement

Not applicable.

Data Availability Statement

Not applicable.

Acknowledgments

The authors thank CONACYT-MEXICO for scholarship 780496 for Yolanda Nolasco González. This research is part of the activities of the National Networks “Anonáceas” and “Reduce and Valorize Food Losses and Waste Towards Sustainable Food Systems (294768)”.

Conflicts of Interest

The authors declare no conflict of interest.

References

  1. Hernández-Fuentes, G.A.; Peraza Campos, A.L.; Ceballos-Magaña, S.G.; Muñiz-Valencia, R.; Parra-Delgado, H. HPLC-DAD method for the detection of five annopurpuricins in root samples of Annona Purpurea. Phyt. Anal. 2020, 31, 472–479. [Google Scholar] [CrossRef] [PubMed]
  2. Coria-Téllez, A.V.; Montalvo-González, E.; Yahia, E.M.; Obledo-Vázquez, E.N. Annona muricata: A comprehensive review on its traditional medicinal uses, phytochemicals, pharmacological activities, mechanisms of action and toxicity. Arab. J. Chem. 2018, 11, 662–691. [Google Scholar] [CrossRef] [Green Version]
  3. Hernández-Fuentes, G.A.; García-Argáez, A.N.; Peraza Campos, A.L.; Delgado- Enciso, I.; Muñiz-Valencia, R.; Martínez-Martínez, F.J.; Toninello, A.; Gómez-Sandoval, Z.; Mojita-Sánchez, J.P.; Via, L.D.; et al. Cytotoxic acetogenins from the roots of Annona purpurea. Int. J. Mol. Sci. 2021, 20, 1870. [Google Scholar] [CrossRef] [PubMed] [Green Version]
  4. Nawwar, M.; Ayoub, N.; Hussein, S.; Hashim, A.; El-Sharawy, R.; Wende, K.; Harms, M.; Lindequist, U. A flavonol triglycoside and investigation of the antioxidant and cell-stimulating activities of Annona muricata Linn. Arch. Pharm. Res. 2012, 35, 761–767. [Google Scholar] [CrossRef] [PubMed]
  5. George, V.C.; Kumar, D.R.; Suresh, P.K.; Kumar, R.A. Antioxidant, DNA protective efficacy and HPLC analysis of Annona muricata (soursop) extracts. J. Food Sci. Technol. 2015, 52, 2328–2335. [Google Scholar] [CrossRef] [PubMed]
  6. Justino, A.B.; Miranda, N.V.C.; Franco, R.R.; Martins, M.M.; Da Silva, N.M.; Espindola, F.S. Annona muricata Linn. Leaf as a source of antioxidant compounds with in vitro antidiabetic and inhibitory potential against α-amylase, α-glucosidase, lipase, non-enzymatic glycation and lipid peroxidation. Biomed. Phamacother. 2018, 100, 83–92. [Google Scholar] [CrossRef]
  7. Hasrat, J.A.; De Bruyne, T.; De Backer, J.P.; Vauquelin, G.; Vlietinck, A.J. Isoquinoline derivatives isolated from the fruit of Annona muricata as 5-HTergic 5-HT(1A) receptor agonists in rats: Unexploited antidepressive (lad) products. J. Pharm. Pharmacol. 1997, 49, 1145–1149. [Google Scholar] [CrossRef]
  8. Fofana, S.; Keita, A.; Balde, S.; Ziyaev, R.; Aripova, S.F. Alkaloids from leaves of Annona muricata. Chem. Nat. Compd. 2012, 48, 714. [Google Scholar] [CrossRef] [Green Version]
  9. Champy, P.; Guérineau, V.; Laprévote, O. MALDI-TOF MS profiling of annonaceous acetogenins in Annona muricata products for human consumption. Molecules 2009, 14, 5235–5246. [Google Scholar] [CrossRef] [Green Version]
  10. Chemat, F.; Rombaut, N.; Sicaire, A.G.; Meullemiestre, A.; Fabiano-Tixier, A.S.; Abert-Vian, M. Ultrasound assisted extraction of food and natural products. Mechanisms, techniques, combinations, protocols and applications. A review. Ultrason. Sonochem. 2017, 34, 540–560. [Google Scholar] [CrossRef]
  11. Syakirah, H.; Rahman, A.; Wan-Ibrahim, W.S.; Ismail, N.; Nadrah, T.; Ismail, N.T.; Mohd-salleh, S.F.; Wong, M.P.; Abdul, M.R.; Hashim, M.N. Phytocompounds of Anonna muricata leaves extract and cytotoxic effects on breast cancer cells. Asian Pacif. J. Trop. Med. 2018, 11, 659–665. [Google Scholar]
  12. Gavamukulya, Y.; Maina, E.N.; Meroka, A.M.; El-Shemy, H.A.; Magoma, G.; Wamunyokoli, F. In search of new anticancer drugs: Data for cytotoxic activities of green synthesized silver nanoparticles from ethanolic extracts of fruits and leaves of Annona muricata and 5-Fluorouracil against HeLa, PC3 and PNT1A cell lines. J. Data Brief. 2019, 26, 104442. [Google Scholar] [CrossRef] [PubMed]
  13. Azmir, J.; Zaidul, I.S.M.; Rahman, M.M.; Sharif, K.M.; Mohamed, A.; Sahena, F.; Jahurul, M.H.A.; Ghafoor, K.; Norulaini, N.A.N.; Omar, A.K.M. Techniques for extraction of bioactive compounds from plant materials: A review. J. Food Eng. 2013, 117, 426–436. [Google Scholar] [CrossRef]
  14. Guimarães, J.T.; Silva, E.K.; Alvarenga, V.O.; Costa, L.R.; Cunha, R.L.; Sant’Ana, A.S.; Freitas, M.Q.; Meireles, M.A.A.; Cruz, A.G. Physicochemical changes and microbial inactivation after high-intensity ultrasound processing of prebiotic whey beverage applying different ultrasonic power levels. Ultrason. Sonochem. 2018, 44, 251–260. [Google Scholar] [CrossRef] [PubMed]
  15. Guimarães, J.T.; Silva, E.K.; Ranadheera, C.S.; Moraes, J.; Raices, R.S.; Silva, M.C.; Ferreira, M.S.; Freitas, M.Q.; Meireles, M.A.A.; Cruz, A.G. Effect of high-intensity ultrasound on the nutritional profile and volatile compounds of a prebiotic soursop whey beverage. Ultrason. Sonochem. 2019, 55, 157–164. [Google Scholar] [CrossRef]
  16. Lee, C.H.; Lee, T.H.; Ong, P.Y.; Wong, S.L.; Hamdan, N.; Elgharbawy, A.A.M.; Azmi, N.A. Integrated ultrasound-mechanical stirrer technique for extraction of total alkaloid content from Annona muricate. Proc. Biochem. 2021, 109, 104–116. [Google Scholar] [CrossRef]
  17. Leal, F.C.; Farias, F.O.; do Amaral, W.; Toci, A.T.; Mafra, M.R.; Igarashi-Mafra, L. Green solvents to value Annona muricata L. leaves as antioxidants source: Process optimization and potential as a natural food additive. Waste Biomass. Valori. 2022, 13, 1233–1241. [Google Scholar] [CrossRef]
  18. Chemat, F.; Khan, M.K. Applications of ultrasound in food technology: Processing, preservation and extraction. Ultrason. SonoChem. 2011, 18, 813–835. [Google Scholar] [CrossRef]
  19. Kadam, S.U.; Tiwari, B.K.; Smyth, T.J.; O’Donnell, C.P. Optimization of ultrasound-assisted extraction of bioactive components from brown seaweed Ascophyllum nodosum using response surface methodology. Ultrason. Sonochem. 2015, 23, 308–316. [Google Scholar] [CrossRef]
  20. Montreau, F.R. Sur le dosage des composés phénoliques totaux dans les vins par la méthode Folin-Ciocalteu. Connaiss Vigne Vin. 1972, 24, 397–404. [Google Scholar] [CrossRef]
  21. Aydar, A.Y.; Bağdatlıoğlu, N.; Köseoğlu, O. Effect on olive oil extraction and optimization of ultrasound-assisted extraction of extra virgin olive oil by response surface methodology (RSM). Grasas Aceites 2017, 68, 189. [Google Scholar] [CrossRef]
  22. Coria-Téllez, A.V.; Obledo-Vázquez, E.N.; Padilla-Camberos, E.; González-Ávila, M.; Martínez-Velázquez, M. Bioactivity, nutritional property, and rapid chemical characterization of aqueous extract of Annona muricata leaf from Mexico. Trop. J. Pharm. Res. 2019, 18, 611–617. [Google Scholar] [CrossRef]
  23. Bonvehí, J.S.; Coll, F.V. Phenolic composition of propolis from China and from South America. Zeitschrift für Naturforschung C 1994, 49, 712–718. [Google Scholar] [CrossRef]
  24. Hartzfeld, P.W.; Forkner, R.; Hunter, M.D.; Hagerman, A.E. Determination of hydrolyzable tannins (gallotannins and ellagitannins) after reaction with potassium iodate. J. Agric. Food Chem. 2002, 50, 1785–1790. [Google Scholar] [CrossRef] [PubMed]
  25. Reed, J.D.; McDowell, R.T.E.; Van Soest, P.J.; Horvath, P.R.J. Condensed tannins: A factor limiting the use of cassava forage. J. Sci. Food Agric. 1982, 33, 213–220. [Google Scholar] [CrossRef]
  26. Aguilar-Hernández, G.; Zepeda-Vallejo, L.G.; García-Magaña, M.L.; Vivar-Vera, M.A.; Pérez-Larios, A.; Girón-Pérez, M.I.; Coria-Tellez, A.V.; Rodríguez-Aguayo, C.; Montalvo-González, E. Extraction of alkaloids using ultrasound from pulp and by-products of soursop fruit (Annona muricata L.). Appl. Sci. 2020, 10, 4869. [Google Scholar] [CrossRef]
  27. Aguilar-Hernández, G.; Vivar-Vera, M.A.; García-Magaña, M.L.; González-Silva, N.; Pérez-Larios, A.; Montalvo-González, E. Ultrasound-assisted extraction of total acetogenins from the soursop fruit by response surface methodology. Molecules 2020, 25, 1139. [Google Scholar] [CrossRef] [Green Version]
  28. Aguilar-Hernández, G.; García-Magaña, M.L.; Vivar-Vera, M.A.; Sáyago-Ayerdi, S.G.; Sánchez-Burgos, J.A.; Morales-Castro, J.; Anaya-Esparza, L.M.; Montalvo-González, E. Optimization of ultrasound-assisted extraction of phenolic compounds from Annona muricata. Molecules 2019, 24, 904. [Google Scholar] [CrossRef] [Green Version]
  29. Re, R.; Pellegrini, N.; Proteggente, A.; Pannala, A.; Yang, M.; Rice-Evans, C. Antioxidant activity applying an improved ABTS radical cation decolorization assay. Free Rad. Biol. Med. 1999, 26, 1231–1237. [Google Scholar] [CrossRef]
  30. Prior, R.L.; Wu, X.; Schaich, K. Standardized methods for the determination of antioxidant capacity and phenolics in foods and dietary supplements. J. Agric. Food Chem. 2005, 53, 4290–4302. [Google Scholar] [CrossRef]
  31. Benzie, I.F.F.; Strain, J.J. Ferric reducing/antioxidant power assay: Direct measure of total antioxidant activity of biological fluids and modified version for simultaneous measurement of total antioxidant power and ascorbic acid concentration. Meth. Enzymol. 1996, 299, 15–27. [Google Scholar]
  32. Anaya-Esparza, L.M.; González-Silva, N.; Yahia, E.M.; González-Vargas, O.A.; Montalvo-González, E.; Pérez-Larios, A. Effect of TiO2-ZnO-MgO mixed oxide on microbial growth and toxicity against Artemia salina. Nanomaterials 2019, 9, 992. [Google Scholar] [CrossRef] [PubMed] [Green Version]
  33. Vasco, C.; Ruales, J.; Kamal-Eldin, A. Total phenolic compounds and antioxidant capacities of major fruits from Ecuador. Food Chem. 2008, 111, 816–823. [Google Scholar] [CrossRef]
  34. Preciado-Saldaña, A.M.; Domínguez-Avila, J.A.; Ayala-Zavala, J.F.; Villegas-Ochoa, M.A.; Sáyago-Ayerdi, S.G.; Wall-Medrano, A.; González-Cordova, A.F.; González-Aguilar, G.A. Formulation and characterization of an optimized functional beverage from hibiscus (Hibiscus sabdariffa L.) and green tea (Camellia sinensis L.). Food Sci. Technol. Inter. 2019, 25, 547–561. [Google Scholar] [CrossRef] [PubMed]
  35. Gavamukulya, Y.; Abou-Elella, F.; Wamunyokoli, F.; Ael-Shemy, H. Phytochemical screening, antioxidant activity and in vitro anticancer potential of ethanolic and water leaves extracts of Annona muricata (Graviola). As. Pac. J. Trop. Med. 2014, 7, 355–363. [Google Scholar] [CrossRef] [Green Version]
  36. Saleh, I.A.; Vinatoru, M.; Mason, T.J.; Abdel-Azim, N.S.; Aboutabl, E.A.; Hammouda, F.M. A possible general mechanism for ultrasound-assisted extraction (UAE) suggested from the results of UAE of chlorogenic acid from Cynara scolymus L. (artichoke) leaves. Ultrason. Sonochem. 2016, 31, 330–336. [Google Scholar] [CrossRef]
  37. Zamora-Gasga, V.M.; Serafín-García, M.S.; Sánchez-Burgos, J.A.; Velázquez-Estrada, R.M.; Sáyago-Ayerdi, S.G. Optimization of ultrasonic-assisted extraction of antioxidant compounds from starfruit (Averroha carambola L) leaves. J. Food Proc. Preserv. 2016, 41, e13093. [Google Scholar] [CrossRef]
  38. Anaya-Esparza, L.M.; Ramos-Aguirre, D.; Zamora-Gasga, V.M.; Yahia, E.; Montalvo-González, E. Optimization of ultrasonic-assisted extraction of phenolic compounds from Justicia spicigera leaves. Food Sci. Biotech. 2018, 27, 1093–1102. [Google Scholar] [CrossRef]
  39. Díaz-de-Cerio, E.; Aguilera-Saez, L.M.; Gómez-Caravaca, A.M.; Verardo, V.; Fernández-Gutiérrez, A.F.; Fernández, I.; Arráez-Román, D. Characterization of bioactive compounds of Annona cherimola L. leaves using a combined approach based on HPLC-ESI-TOF-MS and NMR. Anal. Bioanal. Chem. 2017, 410, 3607–3619. [Google Scholar] [CrossRef]
  40. Ghitescu, R.E.; Volf, I.; Carausu, C.; Bühlmann, A.M.; Gilca, I.A.; Popa, V.I. Optimization of ultrasound-assisted extraction of polyphenols from spruce wood bark. Ultrason. Sonochem. 2015, 22, 535–541. [Google Scholar] [CrossRef]
  41. Najmuddin, S.U.F.; Alitheen, N.B.; Hamid, M.; Nik Abd Rahman, N.M.A. Comparative study of antioxidant level and activity from leaf extracts of Annona muricata Linn obtained from different locations, Pertanika. J. Trop. Agric. Sci. 2017, 40, 119–130. [Google Scholar]
  42. Minari, J.B.; Okeke, U. Chemopreventive effect of Annona muricata on DMBA-induced cell proliferation in the breast tissues of female albino mice. Egypt J. Med. Hum. Genet. 2014, 15, 327–334. [Google Scholar] [CrossRef] [Green Version]
  43. Champy, P.; Melot, A.; Guérineau, V.; Gleye, C.; Fall, D.; Höglinger, G.U.; Ruberg, M.; Lannuzel, A.; Laprévote, O.; Laurens, A.; et al. Quantification of acetogenins in Annona muricata linked to atypical parkinsonism in Guadeloupe. Move Disorders: Official J. Intern. Parkinson Movem. Disord. Soc. 2005, 20, 1629–1633. [Google Scholar] [CrossRef] [PubMed]
  44. Machado, A.R.T.; Lage, G.A.; Medeiros, F.S.; Filho, J.D.S.; Pimenta, L.P.S. Total α, β-unsaturated-γ-lactone acetogenins in Annona muricata by proton NMR spectroscopy. Appl. Magn. Reson. 2015, 46, 153–160. [Google Scholar] [CrossRef]
  45. Neske, A.; Hidalgo, J.R.; Cabedo, N.; Cortes, D. Acetogenins from Annonaceae family. Their potential biological applications. Phytochemistry 2020, 174, 112332. [Google Scholar]
  46. Cao, Q.; Teng, J.; Wei, B.; Huang, L.; Xia, N. Phenolic compounds, bioactivity, and bioaccessibility of ethanol extracts from passion fruit peel based on simulated gastrointestinal digestion. Food Chem. 2021, 356, 129682. [Google Scholar] [CrossRef]
  47. Roduan, M.R.M.; Hamid, R.A.; Cheah, Y.K.; Mohtarrudin, N. Cytotoxicity, antitumor-promoting and antioxidant activities of Annona muricata in vitro. J. Herb. Med. 2019, 15, 100219. [Google Scholar] [CrossRef]
  48. Pérez-González, A.; Rebollar-Zepeda, A.M.; León-Carmona, J.R.; Galano, A. Reactivity indexes and OH bond dissociation energies of a large series of polyphenols: Implications for their free radical scavenging activity. J. Mexican Chem. Soc. 2012, 56, 241–249. [Google Scholar]
  49. Rice-Evans, C.A.; Miller, N.J.; Paganga, G. Structure-antioxidant activity relationships of flavonoids and phenolic acids. Free Radical Biol. Med. 1996, 20, 933–956. [Google Scholar] [CrossRef]
  50. Loizzo, M.R.; Tundis, R.; Bonesi, M.; Menichini, F.; Mastellone, V.; Avallone, L.; Menichini, F. Radical scavenging, antioxidant and metal chelating activities of Annona cherimola Mill (cherimoya) peel and pulp in relation to their total phenolic and total flavonoid contents. J. Food Comp. Anal. 2012, 25, 179–184. [Google Scholar] [CrossRef]
  51. Kim, D.O.; Lee, K.W.; Lee, H.J.; Lee, C.Y. Vitamin C equivalent antioxidant capacity (VCEAC) of phenolic phytochemicals. J. Agri. Food Chem. 2002, 50, 3713–3717. [Google Scholar] [CrossRef] [PubMed]
  52. Cercato, L.M.; Araújo, J.M.D.; Oliveira, A.S.; Melo, A.J.; Lima, B.S.; Dos Santos, E.W.P.; Dos, A.G.; Neto, S.; Albuquerque-Junior, R.L.C.; Duarte, M.C.; et al. Reduced cutaneous inflammation associated with antioxidant action after topical application of the aqueous extract of Annona muricata leaves. Inflammopharmacology 2021, 29, 307–315. [Google Scholar] [CrossRef] [PubMed]
  53. Da Silva Barros, B.R.; do Nascimento, D.K.D.; de Araújo, D.R.C.; da Costa Batista, F.R.; de Oliveira Lima, A.M.N.; da Cruz Filho, I.J.; de Oliveira, M.L.; de Melo, C.M.L. Phytochemical analysis, nutritional profile and immunostimulatory activity of aqueous extract from Malpighia emarginata DC leaves. Biocat. Agri. Biotech. 2020, 23, 101442. [Google Scholar] [CrossRef]
  54. Palacz-Wrobel, M.; Borkowska, P.; Paul-Samojedny, M.; Kowalczyk, M.; Fila-Danilow, A.; Suchanek-Raif, R.; Kowalski, J. Effect of apigenin, kaempferol and resveratrol on the gene expression and protein secretion of tumor necrosis factor alpha (TNF-α) and interleukin-10 (IL-10) in RAW-264.7 macrophages. Biomed. Pharmacother. 2017, 93, 1205–1212. [Google Scholar] [CrossRef] [PubMed]
  55. Renzetti, A.; Betts, J.W.; Fukumoto, K.; Rutherford, R.N. Antibacterial green tea catechins from a molecular perspective: Mechanisms of action and structure–activity relationships. Food Funct. 2020, 11, 9370–9396. [Google Scholar] [CrossRef]
  56. Badhani, B.; Sharma, N.; Kakkar, R. Gallic acid: A versatile antioxidant with promising therapeutic and industrial applications. RSC Adv. 2015, 5, 27540–27557. [Google Scholar] [CrossRef]
  57. González-Esquinca, A.R.; Cazáres, L.M.L.; Guzmán, M.A.S.; De la Cruz-Chacón, I.; Hernández, G.L.; Breceda, S.F.; Gerardo, P.M. In vitro larvicidal evaluation of Annona muricata L., A. diversifolia Saff. and A. lutescens Saff. extracts against Anastrepha ludens larvae (Diptera, Tephritidae). Interciencia 2012, 37, 284–289. [Google Scholar]
  58. Clarkson, C.; Maharaj, V.J.; Crouch, N.R.; Grace, O.M.; Pillay, P.; Matsabisa, M.G.; Bhagwandin, N.; Smith, P.J.; Folb, P.I. In vitro antiplasmodial activity of medicinal plants native to or naturalized in South Africa. J. Ethnopharm. 2004, 92, 177–191. [Google Scholar] [CrossRef]
Figure 1. Response surface plots indicating the effect of ultrasound-assisted extraction on total soluble phenols (TSP) content from A. muricata leaves using 40% (A), 60% (B) and 80% (C) sonication amplitude and Pareto chart (D). XTE = extraction time. XPC = pulse cycle. XSA = sonication amplitude.
Horticulturae 08 00560 g001
Figure 2. Response surface plots indicating the effect of ultrasound-assisted extraction on Yield (%) of phenolic compounds from A. muricata leaves using 40% (A), 60% (B), and 80% (C) of sonication amplitude and Pareto chart (D). XTE = extraction time. XPC = pulse cycle. XSA = sonication amplitude.
Horticulturae 08 00560 g002
Figure 3. Antioxidant capacity of extracts obtained by the optimal conditions of ultrasound-assisted extraction (UAE), decoction, and infusion. Different letters indicate significant statistical differences between treatments using the LSD test with α = 0.05.
Horticulturae 08 00560 g003
Figure 4. HPLC chromatogram of phenolic compounds from UAE extract of Annona muricata leaves. (1) shikimic acid, (2) gallic acid, (3) protocatechuic acid, (4) neochlorogenic acid, (5) 3,4-dihydroxyphenylacetic, (6) 4-hydroxybenzoic acid, (7) chlorogenic acid, (8) 4-hydroxyphenyl acetic, (9) vanillic acid, (10) syringic acid, (11) 3-hydroxybenzoic acid, (12) caffeic acid, (13) 4-hydroxybenzaldehyde, (14) homovanillic acid, (15) 3-(4-hydroxyphenyl), 916) ρ-coumaric acid, (17) trans-ferulic acid, (18) trans-cinnamic acid, (19) gallocatechin, (20) epigallocatechin, (21) catechin, (22) epicatechin, (23) rutin, (24) ellagic acid.
Horticulturae 08 00560 g004
Table 1. Experimental values of total soluble phenols and yield after ultrasonic-assisted (Box-Behnken design) from extracts of Annona muricata leaves also showed predicted values and error rates after the response surface analysis.
RunPredictorsFinal Temperature (°C)Total Soluble Phenols (mg/100 mL)Yield (%)
X PC (s)X SA (%)XET (min)Experimental1 PredictedError Rate (%)Experimental1 PredictedError Rate (%)
10.440424 ± 0.04163.16 ± 6.54 cde163.160.005.44 ± 0.16 abc5.440.00
20.480423 ± 2.00151.02 ± 1.88 bcd151.020.004.87 ± 0.12 de4.870.00
31.040424 ± 1.15137.78 ± 5.98 ab137.780.004.65 ± 0.17 de4.650.00
41.080424 ± 1.00141.93 ± 4.01 ab141.930.004.73 ± 0.12 de4.730.00
50.740222 ± 2.08130.36 ± 3.44 a131.56−0.924.46 ± 0.19 de4.460.00
60.780224 ± 0.01153.09 ± 5.18 bcd154.29−0.785.01 ± 0.16 bcd5.010.00
70.740623 ± 1.73132.18 ± 1.95 a130.98−0.914.50 ± 0.45 de4.500.00
80.780624 ± 1.15173.33 ± 9.46 e172.130.695.70 ± 0.06 a5.700.00
90.460224 ± 0.01142.51 ± 8.45 ab141.310.844.78 ±0.09 de4.780.00
101.060224 ± 0.58127.77 ± 1.59 a126.570.944.41 ± 0.12 e4.410.00
110.460623 ± 2.65137.47 ± 8.10 ab138.67−0.874.57 ± 0.26 de4.570.00
121.060625 ± 1.00145.26 ± 10.99 abc146.46−0.834.84 ± 0.11 de4.840.00
130.760425 ± 0.01174.32 ± 6.09 e169.023.045.68 ± 0.26 a5.532.72
140.760423 ± 1.58164.51 ± 4.30 de169.02−2.745.43 ± 0.18 abc5.53−1.70
150.760424 ± 0.58168.24 ± 5.31 de169.02−0.465.46 ± 0.15 ab5.53−1.13
XPC = Pulse-cycle. XSA = Sonication Amplitude. XET = Extraction time. All entries represent the means ± standard deviation of three determinations and three replicates (n = 9). Different letters by column indicate significant statistical differences between treatments (α = 0.05). 1 The values were predicted using secondary polynomial equations, R2 = 0.886.
Table 2. Optimal conditions by ultrasonic-assisted extraction of total soluble phenols and yield from the extract of Annona muricata leaves obtained by the predicted models.
ParameterTotal Soluble Phenols (mg/100 mL)Yield (%)
Extraction time (min)4.544.79
Pulse-Cycle (s)0.700.70
Sonication amplitude (%)8080
Predicted optimal value180.525.86
−95% Confidence166.475.43
+95% Confidence184.556.30
Confidence limits of −95% lower limit, +95% confidence limit upper limit. The confidence interval is the difference between upper and lower limits.
Table 3. Phenolic compounds, total alkaloids, and total acetogenins obtained by optimal conditions of ultrasound-assisted extraction (UAE), decoction, and infusion from extracts of Annona muricata leaves and UAE effectiveness.
Parameter
(mg/100 mL of Extract)
1 UAE2 Decoction3 InfusionEffectiveness (n-Fold)
UAE vs. DecoctionUAE vs. Infusion
Soluble phenols178.48 ± 2.72 a25.66 ± 3.69 b17.55 ± 0.64 c710
Total flavonoids20.18 ± 0.30 a0.83 ± 0.06 b0.98 ± 0.01 b2420
Hydrolyzable polyphenols27.81 ± 2.62 a0.06 ± 0.01 b0.03 ± 0.01 c464927
Condensed tannins167.07 ± 68.10 a24.22 ± 0.49 b6.49 ± 0.16 c726
Total alkaloids30.44 ± 1.67 a0.57 ± 0.12 b0.45 ± 0.07 b5368
Total acetogenins14.62 ± 0.72 aNDND
ABTS = 2,2′-azino-bis (3-ethylbenzothiazoline-6-sulfonic acid. DPPH = 2,2-diphenyl-1-picrylhydrazyl. FRAP = Ferric ion reducing antioxidant power. All entries are means ± standard deviation of three determinations and three replicates (n = 9). Different letters in each file indicate significant statistical differences between treatments (α = 0.05). 1 UAE Optimal conditions: 4.54 min, 0.68 s pulse-cycle, 79.99% sonication amplitude. 2 Decoction: Fresh leaves in boiling water for 10 min. 3 Infusion: Dried leaves in hot water at 98 °C for 10 min. ND = not detected.
Table 4. Phenolic compounds profile from extracts of Annona muricata leaves obtained by optimal conditions of ultrasound-assisted extraction (UAE), decoction, and infusion.
No.CompoundRT (min)Content (mg/100 mL of Extract)
1 UAE Extract2 Decoction3 Infusion
Phenolic acids
1Shikimic acid3.783.05 ± 0.02 a0.35 ± 0.01 b0.38 ± 0.02 b
2Gallic acid11.196.80 ± 1.21 a0.62 ± 0.01 b0.61 ± 0.20 b
3Protocatechuic acid15.10.18 ± 0.02 ab0.15 ± 0.01 b0.20 ± 0.01 a
4Neochlorogenic acid18.093.52 ± 0.62 a0.51 ± 0.01 b0.95 ± 0.06 b
53,4-Dihydroxyphenylacetic acid18.471.11 ± 0.59 a0.25 ± 0.01 b0.24 ± 0.07 b
64-Hydroxybenzoic acid18.760.85 ± 0.22 a0.23 ± 0.22 b0.19 ± 0.03 b
7Chlorogenic acid19.550.72 ± 0.28 a0.72 ± 0.28 a0.49 ± 0.03 a
84-Hydroxyphenylacetic acid19.896.28 ± 0.16 a1.89 ± 0.02 b2.14 ± 0.06 b
9Vanillic acid20.360.99 ± 0.12 a0.28 ± 0.01 b0.22 ± 0.01 b
10Syringic acid20.941.17 ± 0.19 a0.10 ± 0.01 b0.11 ± 0.01 b
113-Hydroxybenzoic acid20.981.33 ± 0.18 a0.56 ± 0.01 b0.21 ± 0.02 c
12Caffeic acid21.460.26 ± 0.02 a0.09 ± 0.01 bND
134-Hydroxybenzaldehyde acid22.060.61 ± 0.25 a0.05 ± 0.01 b0.05 ± 0.01 b
14Homovanillic acid22.321.14 ± 0.10 a3.40 ± 0.07 b0.66 ± 0.16 c
153-(4-Hydroxyphenyl) propionic acid23.215.96 ± 0.12 a0.54 ± 0.01 b0.15 ± 0.05 c
16p-Coumaric acid23.996.79 ± 0.66 a0.99 ± 0.02 b0.82 ± 0.02 b
17Trans-ferulic acid24.435.47 ± 0.91 a0.66 ± 0.02 b0.48 ± 0.01 b
18trans-cinnamic acid34.690.25 ± 0.03NDND
Total (mg/100 mL) 46.4811.397.9
Flavonoids
19Gallocatechin17.77.59 ± 1.60 a7.01 ± 0.04 a5.43 ± 0.27 a
20Epigallocatechin20.5414.80 ± 0.71 a0.74 ± 0.04 b0.52 ± 0.34 b
21Catechin21.551.51 ± 0.57 a0.57 ± 0.03 ab0.18 ± 0.01 b
22Epicatechin22.315.64 ± 1.12 a0.32 ± 0.01 b0.14 ± 0.01 b
23Rutin23.420.47 ± 0.01 a0.14 ± 0.01 b0.08 ± 0.01 c
Total (mg/100 mL) 30.018.786.35
Ellagic tannins
24Ellagic acid25.644.31 ± 0.31 a0.62 ± 0.02 b0.48 ± 0.01 b
Total phenolic compounds (mg/100 mL) 80.820.7914.73
All values are means ± standard deviation of three determinations and three replicates (n = 9). Different letters in each file indicate significant statistical differences between treatments (α = 0.05). ND = not detected. 1 UAE Optimal conditions: 4.54 min, 0.68 s pulse-cycle, 79.99% sonication amplitude. 2 Decoction: Fresh leaves in boiling water for 10 min. 3 Infusion: Dried leaves in hot water at 98 °C for 10 min.
Publisher’s Note: MDPI stays neutral with regard to jurisdictional claims in published maps and institutional affiliations.

