Article

A One-Step Polyphenol Removal Approach for Detection of Multiple Phytohormones from Grape Berry

1
Center for Viticulture & Enology, College of Food Science and Nutritional Engineering, China Agricultural University, Beijing 100083, China
2
Key Laboratory of Viticulture and Enology, Ministry of Agricultural and Rural Affairs, Beijing 100083, China
*
Author to whom correspondence should be addressed.
Horticulturae 2022, 8(6), 548; https://doi.org/10.3390/horticulturae8060548
Submission received: 26 April 2022 / Revised: 12 June 2022 / Accepted: 17 June 2022 / Published: 18 June 2022

Abstract

:
Phytohormones play an important role in regulating the maturation process and the quality-related metabolite accumulation of fruits, and their concentration variation has always been concerned during fruit development. However, berry fruits, such as grape berries, are rich in a large number of secondary metabolites, which brings great challenges to the isolation and determination of hormones. In this work, we used grapes as experimental materials and proposed a solid-phase extraction (SPE) protocol to efficiently isolate multiple hormones from phenol-rich matrix using a mixture of dichloromethane, methanol and formic acid as eluent. A highly sensitive method based on ultra-high-performance liquid chromatography–tandem mass spectrometry (UHPLC-MS/MS) was developed to quantify a total of 11 plant growth regulators, including the recognized phytohormones, in grape pericarp and seed. The established method showed satisfactory precision (RSD < 11.3%) and linearity (R2 > 0.9980). The limits of detection (LOD) and the limit of quantification (LOQ) were 0.001–0.75 ng/mL and 0.004–2.5 ng/mL, respectively. The recovery for the three levels of analytes spiked ranged from 63% to 118%, and the matrix effect was between 73% and 119%. Finally, the proposed method was applied to investigate the dynamic hormone concentration in Vitis vinifera L. cv. Cabernet Sauvignon berries from different vineyards, and assess the changes in endogenous hormones in grapes after treatment with exogenous growth regulators. We found that the contents of IP, ABA and IAA in pericarp and IP, IAA, IBA and SA in seed were significantly down-regulated after 10 days of treatment with NAA concentrations of 10 mg/L and 40 mg/L. In conclusion, this method helps to elucidate the role played by phytohormones in the maturation process and the accumulation of quality-related metabolites in phenol-rich fruits.

1. Introduction

Phytohormones are a class of structurally diverse small molecular compounds, which play an important role in plant growth, development and resistance to biological and abiotic stresses [1,2,3,4]. They are generally recognized in the following categories: abscisic acid (ABA), auxin (IAA), cytokinins (CKs), gibberellins (GAs), ethylene (ET), salicylic acid (SA), jasmonic acid (JA), brassinosteroids (BRs) and strigolactones (SL). A large number of studies have reported the functions of these hormones alone, and more and more studies have shown that there will be superimposition, promotion, antagonism and other interactions between them. This effect is called crosstalk. Examples include the complex interaction between JA and GA [5], ABA [6], SA [7], IAA [8], BR [9] and ET [10] in plant defense; the antagonism of JA and CK in the development of plant organs [11,12]; the multi-level interaction of IAA, CK and ET [13]; and the interaction between IAA and JA [14], BR and GA [15] in growth regulation. The detection of a single family of phytohormones does not provide complete information about plant status, because phytohormone responses are usually the product of an interaction network involving multiple hormones [16]. Therefore, it is important to establish a method for the detection and accurate quantification of various classes of endogenous phytohormones.
Wine is an alcoholic beverage that is fermented from fresh grapes. It is favored by consumers all over the world because of its excellent sensory quality and anti-oxidation and anti-cardio-cerebrovascular diseases effects. The quality of wine largely depends on the quality of the grape materials. The accumulation of secondary metabolites (anthocyanins, tannins, volatile substances and their precursors) during grape ripening has a direct impact on the color, taste and aroma of wine. In fact, phytohormones play an important role in regulating the ripening process and secondary metabolism of grape berries. Previous studies have shown that the application of ABA, BRs and JA on grape berries before the color transition period can promote the accumulation of phenylpropanoid metabolites [17,18,19,20,21,22]. The spraying of IAA and Forchlorfenuron (CPPU) can delay the maturation process and change the flow of phenylpropane metabolic pathways [23,24]. In addition, there is a lot of evidence from the transcriptome and metabolome that ABA can respond to environmental signals such as solar ultraviolet-B (UV-B) radiation [25], water deficit [26,27] and high temperature [28], and greatly affect the ripening and quality of grape fruits [29,30,31]. However, there is still a lack of accurate quantification of multiple phytohormones and investigation of the trends of phytohormone changes in grape berries. A sensitive method for multiple endogenous hormones can provide new insights into the accumulation and regulation of quality-related metabolites.
Phytohormones are usually present in trace amounts (usually ng/g FW) in different tissues of plants, which poses a great challenge for accurate qualitative and quantitative analysis [32]. Researchers have developed a variety of methods for the detection of phytohormones. Enzyme-linked immunosorbent assay (ELISA) and other immune assays are based on the ligand binding of the antibody to detect phytohormones with high sensitivity and specificity [33,34,35,36,37]. However, the specific recognition involved in immunoassays means that it is difficult to measure multiple types of hormones at the same time. Instead, they focus on analyzing one compound at a time [38]. Chromatographic methods, including gas chromatography (GC) and liquid chromatography (LC) connected in series with different types of mass spectrometry (MS), have excellent sensitivity and separation ability, and meet the requirements for simultaneous detection of multiple hormones in complex matrices [39,40,41,42,43]. Compared with GC-MS, LC-MS has the advantage of facilitating the analysis of thermally labile compounds and does not require derivatization, so it has become the most important method for detecting phytohormones [38,44]. In recent years, ultra-high-performance liquid chromatography combined with triple quadrupole mass spectrometry (UHPLC-QqQ-MS) has achieved great success in the fields of pharmaceutical, biochemical, food and environmental analysis. Compared with traditional HPLC-MS/MS, UHPLC-QqQ-MS has higher resolution. It also has high specificity, sensitivity, accuracy and reproducibility, and is currently the most suitable method for quantification. Some methods for measuring phytohormones using UHPLC-QqQ-MS have been reported, and its advantages have been proven [38,45,46].
Isolation of phytohormones from complex matrices is a challenging work. Many sample preparation methods have been applied to enrich and purify phytohormones, including solid-phase extraction (SPE) [47,48,49,50], liquid–liquid extraction (LLE) [38,51], dispersive liquid–liquid microextraction (DLLME) [52,53,54], QuEChERS [55,56] and their mixed use. Almost all the above methods use the isotope internal standard to correct the signal loss caused by the pretreatment process and the matrix effect, which reduces the requirements on the purity of the sample. In addition, some pre-processing methods rely heavily on isotope internal standards. For example, liquid–liquid extraction methods require isotope internal standards to correct the extraction distribution coefficient [38,51], and direct injection of crude plant extracts requires isotope internal standards to compensate matrix effects [57]. The use of isotope internal standards undoubtedly makes the methods more accurate, but it cannot be ignored that isotope internal standards are expensive and not easy to obtain, which makes it difficult for most laboratories to use these methods.
Therefore, with the present study, we aimed to develop and validate an analysis method for the accurate quantification of major phytohormones in phenol-rich fruits of different periods. Specifically, we (i) optimized the chromatographic and MS/MS conditions, (ii) compared the recovery of different sample pretreatments (including sample purification and enrichment process) and (iii) selected the method with the highest recovery for validation and sample detection.

2. Materials and Methods

2.1. Chemicals and Materials

The standards including indole-3-acetic acid (IAA), indole-3-butyric acid (IBA), gibberellin A3 (GA3), N6-(2-Isopentenyl) adenine (IP), brassinolide (BL) and salicylic acid (SA) were purchased from Solarbio (Beijing, China). Abscisic acid (ABA) was from Psaitong (Beijing, China). Jasmonic acid (JA), indole-methyl acetate (MeIAA), methyl jasmonate (MeJA), methyl salicylate (MeSA) and triphenyl phosphate (TPP) were purchased from Sigma-Aldrich (St. Louis, MO, USA). HPLC-grade methanol (MeOH), acetonitrile (ACN) and dichloromethane (CH2Cl2) were purchased from Mreda (Beijing, China). HPLC-MS-grade formic acid (FA) was purchased from Thermo Fisher (Waltham, MA, USA). The Oasis HLB (3cc, 100 mg) cartridges were purchased from Waters (Milford, MA, USA). The ZORBAX Eclipse Plus C18 column (95 Å, 1.8 μm, 2.1 × 50 mm) was purchased from Agilent Technologies (Santa Clara, CA, USA).

2.2. Plant Materials

2.2.1. Method Application Materials

Vitis vinifera L. cv. Cabernet Sauvignon berries used for verification were collected from the Zhihui vineyard of Chateau Yuanshi (38°28′ N, 106°12′ E) and Tianfu vineyard of Chateau GreatWall Terroir (38°23′ N, 105°56′ E) in Yingchuan city, Ningxia, China. Both vineyards are located at the Eastern Foot of the Helan Mountains, a well-known wine-producing region in China. Grapevines were trained to a modified vertical shoot-positioned (M-VSP) spur-pruned training system. Vines were in row orientated nearly south–north and spaced at 4.0 m × 1.2 m (vine × row) in the Zhihui vineyard and at 4.0 m × 0.8 m (vine × row) in the Tianfu vineyard. In each of the two vineyards, nine rows of uniformly growing vines were selected for the experiment, and every three rows were used as a set of biological replicates. We collected grape berries at −10, 0, 10, 20, 30, 40, 50 and 57 days after 50% color change (véraison), a total of eight growth and development stages. The sample collection time was concentrated from 8 a.m. to 10 a.m., and 300 berries were randomly collected for each biological replicate. Fifty berries were used for the physicochemical index analysis, and the rest were frozen in liquid nitrogen and stored at −80 °C until analysis.
1-Naphthylacetic acid (NAA) application was performed in Vitis vinifera L. cv. Cabernet Sauvignon of Zhihui vineyard of Chateau Yuanshi in 2020. 1-Naphthylacetic acid was dissolved in an aqueous solution with a concentration of 0.05% (v/v) Tween 20 to produce 10 mg/L NAA and 40 mg/L NAA solutions, named NAA10 and NAA40. The water with 0.05% (v/v) Tween 20 solution was taken as the control. When berries began to soften (E-L 34) [58], we sprayed the solution directly onto the grape berries. To avoid rapid evaporation of the solution, it was applied at sunset for two consecutive days. The berries were harvested 10 days after treatment. The basic situation of the vineyard and the way of collecting and storing grapes were the same as described in the previous paragraph.

2.2.2. Method Optimization Materials

All materials used for method optimization were Vitis vinifera L. cv. Cabernet Sauvignon of Zhihui vineyard of Chateau Yuanshi in 2020, and the grapes were collected and stored as previously described.

2.3. Physicochemical Index Analysis

A total of 50 berries were weighed and pressed manually. The total soluble solid (TSS) of the juice was measured using a pocket Brix refractometer (PAL-1, ATAGO, Tokyo, Japan).

2.4. Sample Preparation

The pericarp and seed of the grape samples were separated in liquid nitrogen and ground into fine powder using IKA A11 basic analytical mill (IKA, Koenigswinter, Germany) before use. We weighed 0.5 g grape pericarp powder or 0.2 g grape seed powder into a 5 mL centrifuge tube, added 2.5 mL 50% cold acetonitrile ACN solution and 10 μL internal standard solution (0.1 mg/L TPP solution) and mixed with the sample by vortexing for 1 min. Afterwards, the target compounds were extracted by ultrasound in an ice water bath for 15 min, and the extracts were centrifuged at 14,800× g for 5 min at 4 °C. The precipitants were extracted again by the above steps. The supernatants obtained from two extractions were combined and the volume was approximately 5 mL. Following that, the supernatant was diluted to 50 mL with water to obtain a 5% ACN mixture.
After the Oasis HLB SPE cartridges were activated by 3 mL MeOH and 3 mL water, the above extracts were loaded continuously onto the SPE column and washed with 5 mL of water. Then, all target compounds were eluted with 3 mL CH2Cl2 containing 0.5% FA and 2.5% MeOH. The SPE process was performed by a high-throughput automatic solid-phase extractor (Fotector-08HT, Raykol, Xiamen, China), and the flow rate of loading samples was kept at 3 mL/min. The flow rates of activation, washing and elution were kept at 1 mL/min.
The collected eluents were mixed with 1 mL MeOH and then concentrated to 200 μL under a gentle nitrogen flow. The final extracts were filtered through a 0.22 μm polytetrafluoroethylene membrane filter and used for ultra-high-performance liquid chromatography–tandem mass spectrometry (UHPLC-MS/MS) analysis.

2.5. UHPLC-MS/MS Conditions

All detections were performed on a 1260 Infinity II UHPLC instrument combined with a 6470B MS/MS system equipped with an Agilent jet stream electrospray ionization source (AJS-ESI, Agilent, Santa Clara, CA, USA).
The UHPLC separation was performed at 35 °C on a Zorbax Eclipse Plus C18 column (95 Å, 1.8 mm, 2.1 × 50 mm, Agilent, Santa Clara, CA, USA), with a mobile phase flow rate of 0.4 mL/min. The mobile phase was composed of (A) water containing 0.1% FA and (B) ACN containing 0.1% FA. A linear gradient elution program with the following proportions (v/v) of solvent B was applied: 0–1 min at 10%, 1–13 min from 10% to 60%, 13–14 min from 60% to 100%, 14–17 min at 100%, 17–18 min from 100% to 10% and held for 2 min post-running time, giving a total run time of 20 min. The injection volume was 3 μL.
Phytohormones were monitored by multiple reaction monitoring (MRM) in a fast-switching positive/negative mode of electrospray ionization (ESI) with different retention time windows. The ion source conditions were as follows: gas temperature, 300 °C; gas flow, 7 L/min; nebulizer, 45 psi; sheath gas temperature, 275 °C; sheath gas flow, 11 L/min; positive capillary, 4000 V; negative capillary, 3500 V; nozzle voltage, 500 V. The specific MRM parameters for each analyte and IS are listed in Table 1.
The liquid-phase conditions and ion source conditions for the method used to detect phenolic compounds are consistent with those used to detect plant hormones when checking the cleanliness of pretreated substrates. The ion pair information of anthocyanins and non-anthocyanin phenols are listed in Table S1 and Table S2, respectively.

2.6. Evaluation of Matrix Effects

Endogenous phytohormones are present at all stages of grape berry development. In the absence of blank matrix, background subtraction was used to evaluate the matrix effect. Certain quantities of hormone standards and internal standard TPP were added to the substrate, which had undergone the entire sample pretreatment process. The peak area ratio of the detected hormones to TPP was recorded as SM. The same amounts of hormone standard and internal standard were dissolved in blank solution, and the peak area ratio was denoted as S. No hormone standard was added; only the same content of internal standard was added to the matrix, and the peak area ratio was denoted as SB. The matrix effect can be calculated as (SM − SB)/S.

2.7. Evaluation of the Overall Recovery

The overall recovery was evaluated in a manner similar to that used to assess matrix effects, requiring a deduction for the background of endogenous phytohormones. Prior to the entire pre-treatment process, specific amounts of hormone standard and internal standard TPP were added to the plant material (pericarp and seed powder), and the detected peak area ratio was denoted as SR. S and SB were obtained in the same manner as described in the evaluation of matrix effects. The overall recovery rate was calculated as (SR − SB)/S.

2.8. Standard Curve

Phytohormones were quantified by establishing an external standard curve for each compound, and the concentration was calculated by the ratio of the corresponding hormone to the peak area of the internal standard. The concentrations in the standard curve were 0.1, 0.25, 0.5, 1, 2.5, 5, 10, 25, 50, 100, 250 and 500 ng/mL, and the internal standard was fixed with 500 ng/mL. The limit of detection (LOD) and quantitation (LOQ) of each analyte were calculated at the concentrations with signal-to-noise ratios equal to 3 and 10, respectively.

3. Results and Discussion

3.1. Optimization of the MS/MS Conditions

According to the structure of the compounds, the phytohormones to be tested are classified as acidic, basic and neutral. Acidic hormones include GA3, IAA, IBA, SA, JA and ABA. Alkaline hormones include IP, and neutral hormones include BL, MeIAA, MeJA and MeSA. Their chemical structures are shown in Figure S1. Because of different ionization efficiency, negative ion mode was used to detect acidic hormones, while positive ion mode was performed to test basic and neutral hormones. Standard solution comprising 11 hormones and an internal standard (TPP) of 1 μg/mL was prepared to optimize MS/MS parameters. MassHunter Optimizer Software (Agilent, Santa Clara, CA, USA) was used to obtain the best precursor ions, product ions, fragmentor voltage and college energy voltage (CE) for each analyte. The MRM parameters of 11 hormones and internal standards are listed in Table 1.

3.2. Optimization of the Chromatographic Conditions

To detect the representatives of each phytohormone family in a single injection by quickly switching ion source mode, many mobile-phase gradients were attempted. A clear separation of the compounds was finally achieved within 13 min, as shown in Figure 1. We also increased the organic solvent exposure time after this elution procedure and maintained the initial conditions for 2 min at the end to clean the column for residual high retention compounds to ensure stability with each injection. The final mobile-phase gradient is described in Section 2.5.
Previous studies have shown that the composition of the mobile phase can affect the ionization efficiency of the ion source and thus affect the analytic sensitivity [59]. Considering that ACN has a better separation effect and stronger elution ability than MeOH, ACN was selected as the organic phase. When optimizing MS/MS conditions for hormones, we found that methyl hormones could be detected only under acidic mobile-phase conditions, so water and ACN with FA concentrations of 0.01%, 0.05% and 0.1% were compared subsequently. Results from different injections showed that increased FA content in the mobile phase significantly inhibited the MS signal response of acidic hormones in negative ion mode (Figure 2). FA of 0.01% (v/v) proved to be the modifier resulting in the best sensitivity.

3.3. Optimization of Sample Pretreatment

3.3.1. Design of Sample Pretreatment

This research aimed at developing a simple-to-operate and economical pretreatment method that could be easily reproduced in different laboratories. Triphenyl phosphate is used as a single internal standard for internal calibration to replace the isotope internal standard, which is expensive and difficult to obtain [60]. Triphenyl phosphate is added to the sample before extraction to correct errors caused by solution loss during extraction and nitrogen blowing. However, different from the isotope internal standard, TPP cannot correct the instrument response under different matrices because it does not have the same structure as the analyte [60,61]. This puts forward a high requirement for the extraction and purification process in which impurities should be excluded as much as possible from final test sample.
The extraction process of phytohormones usually uses MeOH or ACN aqueous solution, but the specific proportion is a perplexing problem [62]. The increasing organic phase ratio in the extract could produce a two-sided effect: it helps to extract the neutral hormones and also extracts some of the nonpolar impurities, such as chlorophyll. Šimura and colleagues assessed the extraction effects of ACN aqueous solutions of different concentrations in detail (ranging from 0% to 100%), and found that the extraction with 50% ACN solution could obtain the most hormones and the least chlorophyll [48]. Considering that green grapes at the early developmental stage contain many chlorophylls, these pigments should be extracted as little as possible, which is conducive to reducing the matrix effect. Therefore, 50% ACN solution was selected as the extraction solvent.

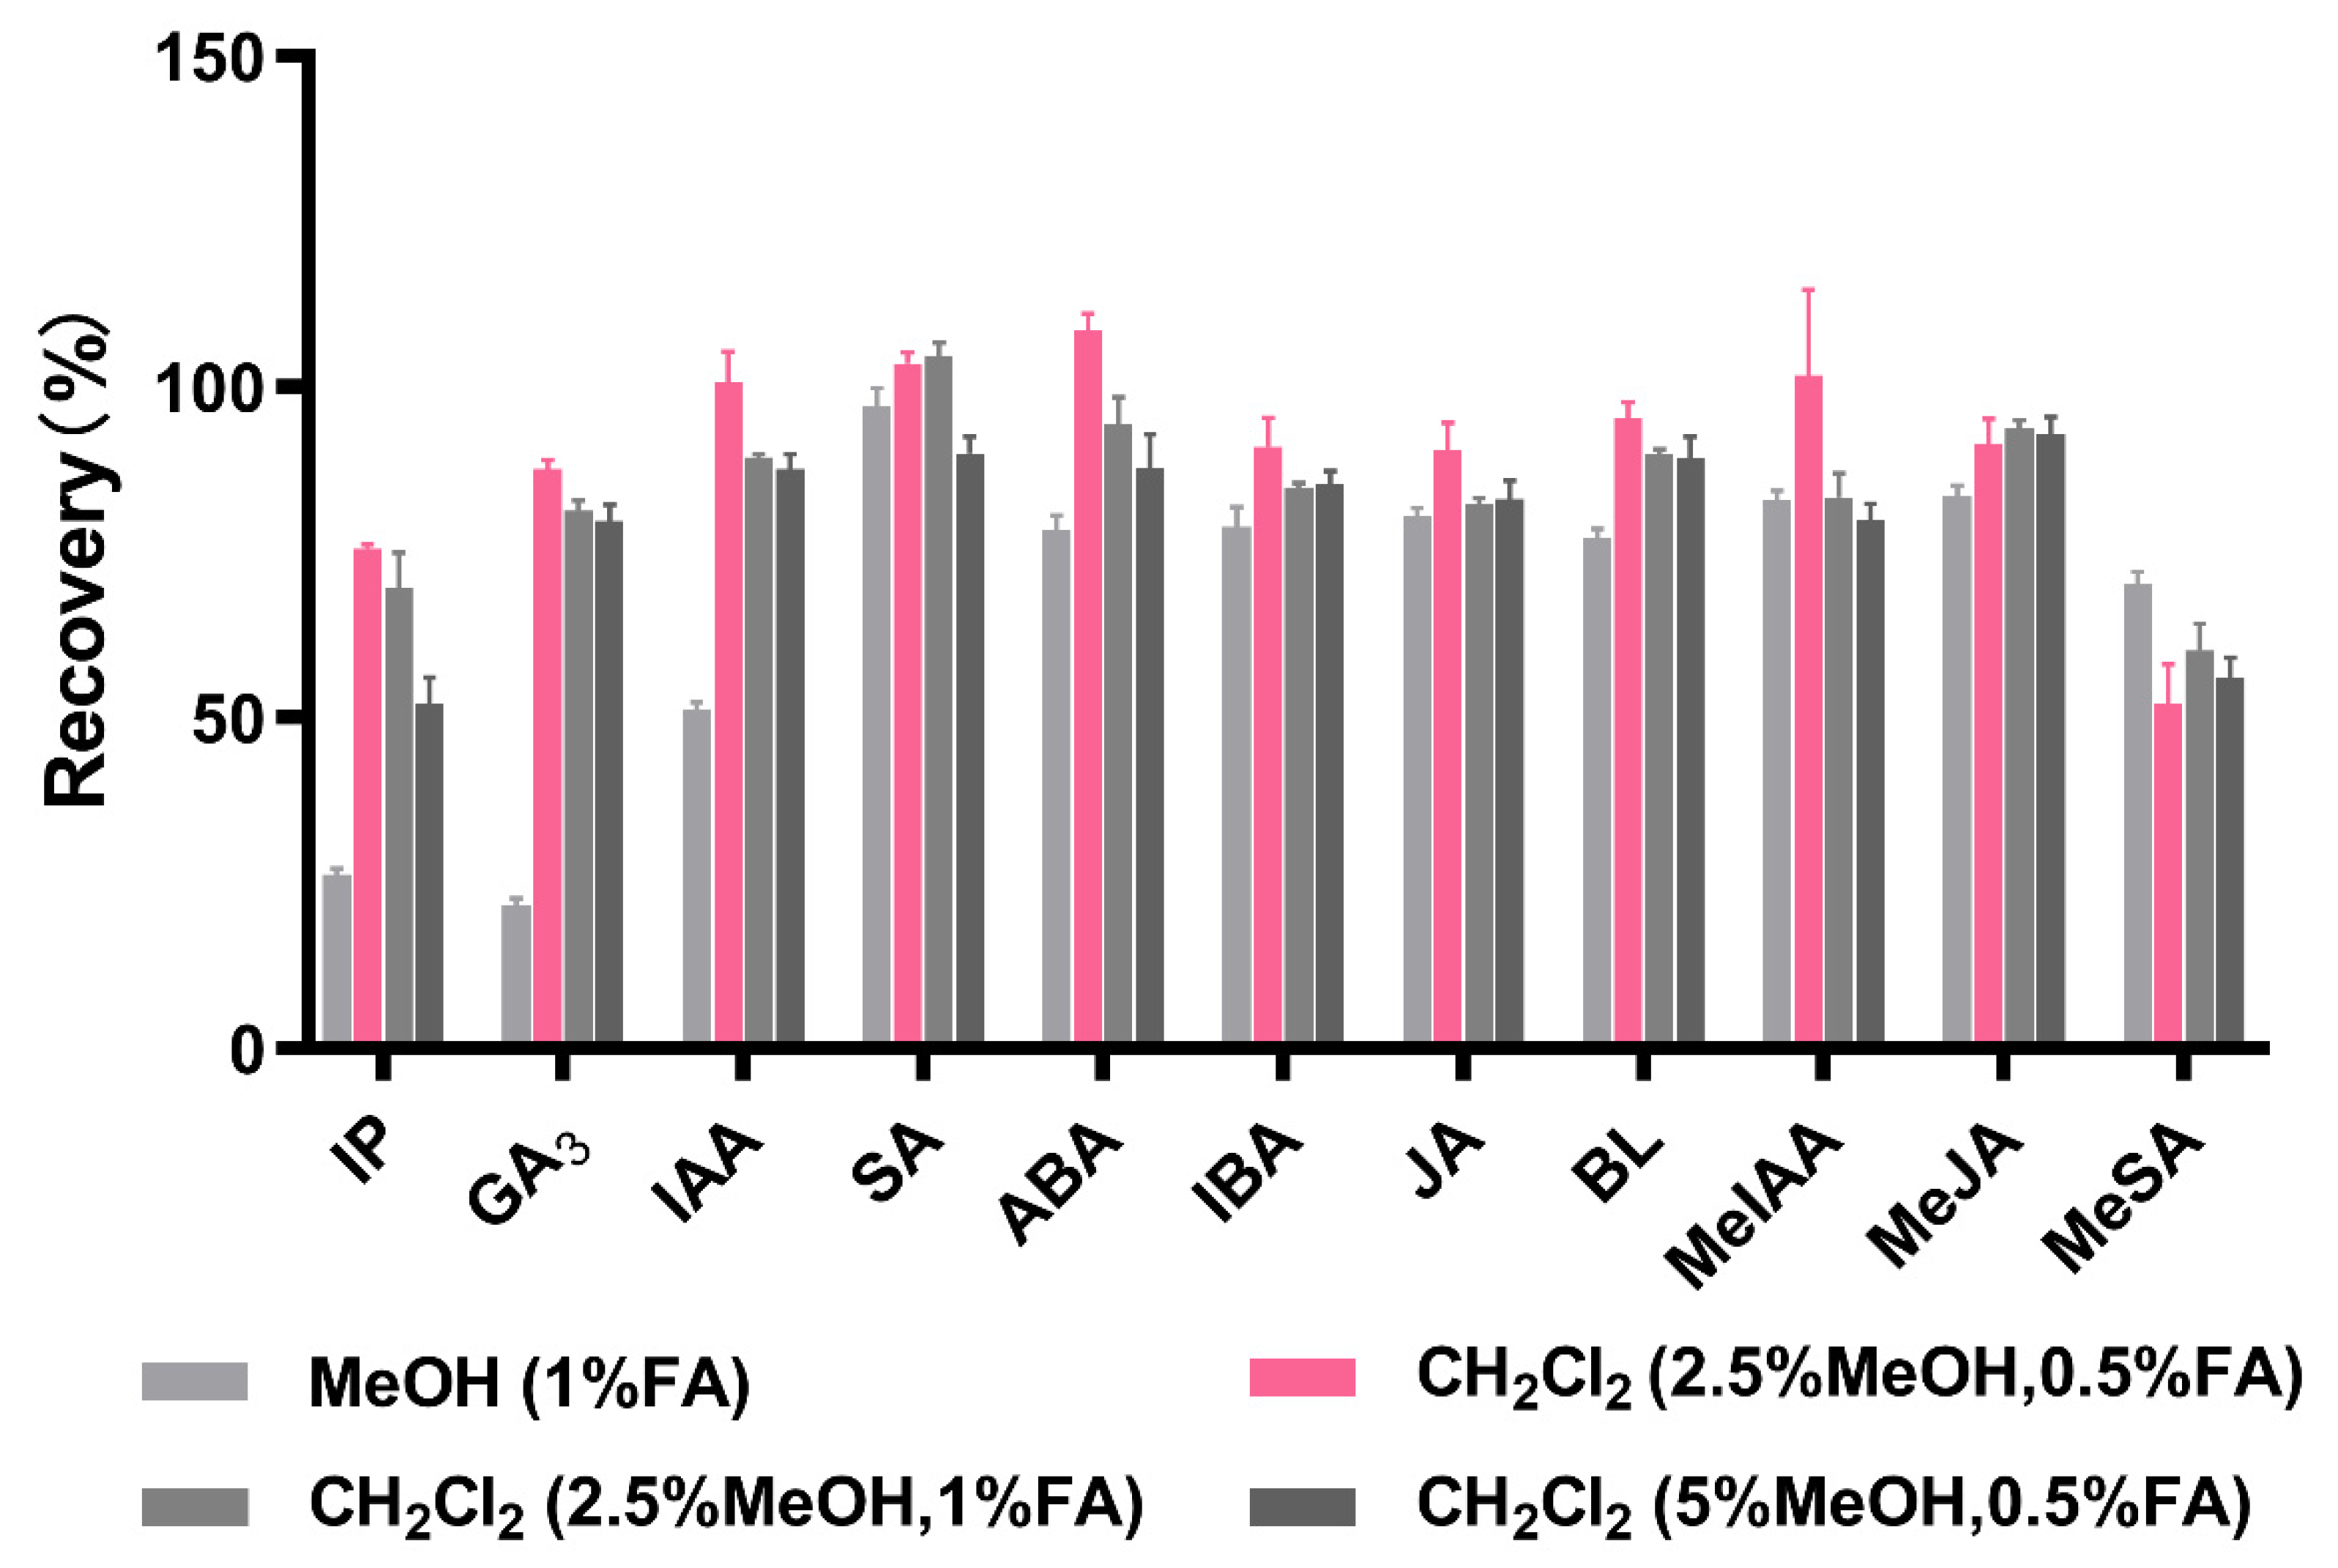
3.3.2. Purification Strategy

Grapes accumulate a large amount of phenolic substances during the maturation period, including anthocyanins, flavonols and phenolic acids. Due to the high polarity of these phenolics, they will inevitably be extracted along with phytohormones during the extraction process. Therefore, the main goal of the purification process is to eliminate the phenolic substances. As mentioned in the introduction, liquid–liquid extraction (LLE) relies heavily on the correction of the extraction efficiency by the isotope internal standard. In our preliminary experiments, we used the LLE method proposed by PAN et al. [51], which could not remove anthocyanins completely.
Solid-phase extraction (SPE) has been widely used for sample purification because of its simplicity of operation, reproducibility and ease of automation. In a study of the detection of cytokinin, auxin and gibberellin in grape berry, the researchers compared the purification efficiency of eight commercially available SPE cartridges, and found that HLB cartridge had the best recovery rate for each hormone [63]. However, when using the SPE protocol mentioned in the above study (MeOH with 1% FA for elution), hormones and polyphenols were eluted at the same time. The diode array detector (DAD) showed absorption peaks at 280 nm and 520 nm (characteristic wavelength of flavonoids [64,65]) for the first 5 min of eluted substances (Figure 3C). Using the multiple reaction monitoring (MRM) mode to detect the ion transition of polyphenols, it was found that anthocyanins were present in the first 3 min, and non-anthocyanin phenolics were present in 2–5 min (Figure 3C and Tables S2 and S3). Obvious color can also be observed in the eluted solution (Figure 3A). The matrix effects of 11 hormones were investigated, and it was found that the signals of IP, GA3 and IAA all were significantly suppressed due to the co-eluting with these polyphenols (Figure 4). A similar situation was mentioned by Šimura and colleagues, who used HLB cartridges for sample purification; their SPE protocol could not effectively remove anthocyanins, either [48].
As a result, it was necessary to design an SPE protocol which could isolate hormones from polyphenols. For this purpose, two strategies were employed: (1) during the wash step, the anthocyanins are eluted out and the hormones are retained in the column; (2) during the elution step, the hormones are eluted out and the anthocyanins are retained in the column. In implementing the first strategy, we tried to use a strong polar solution mainly consisting of water and MeOH to isolate polyphenols and hormones. However, we found that elution using more than 10% MeOH aqueous solution resulted in partial loss of IP, and conversely, less than 50% MeOH aqueous solution could not completely remove anthocyanins, so this strategy was not adopted. When implementing the second strategy, we tried to use weak polar organic solvents, including acetone, ethyl acetate and dichloromethane, respectively, for the elution of hormones. We found that using dichloromethane can adequately obtain neutral and alkaline hormones (IP, BL, MeIAA, MeJA, MeSA), but cannot obtain acidic hormones (GA3, IAA, SA, ABA, IBA, JA). Meanwhile, the eluted solution contained a certain concentration of anthocyanins. Given that the HLB cartridge is a hydrophilic–lipophilic-balanced column, the pH value of the eluent will affect the retention of the compound. Therefore, FA is added to the elution solution, so that the acidic compounds can bind to H+ and transform from an ionic state to a molecular state, which can be better eluted by a weak polar solution. According to the principle of “like dissolves like”, we also considered mixing MeOH in dichloromethane to increase the polarity of the eluent, so that the strongly polar compounds, such as acidic hormones, can be better eluted. The ratio of FA and MeOH added to dichloromethane was studied (Figure 4). We found that when the eluent was dichloromethane mixed with 0.5% FA and 2.5% MeOH, phenolic compounds were successfully retained in the extraction column, whereas the targeted hormones were adequately eluted out (Figure 3 and Figure 5). On this condition, the highest recovery rate was obtained for each hormone (higher than 70%). Moreover, the purified extracts were relatively clean for the content of polyphenols in the sample, much lower than those using MeOH as eluent (Figure 3 and Table S3).

3.3.3. Enrichment Process

In the step of concentrating phytohormones, chemists prefer nitrogen blowing rather than rotary evaporation [44,52,54,63]. Carolina et al. compared these two methods, and observed that although rotary evaporation took a shorter time, the loss of the targeted hormones was twice that of nitrogen blowing [38]. In this study, nitrogen blowing was chosen as the concentration method. Conventionally, the nitrogen blowing procedure is to dry the solvent and subsequently re-dissolve it with injection solvent. However, we found that drying with nitrogen blowing resulted in the loss of various hormones to different extents, especially methyl salicylate, which lost approximately 80% possibly because of its strong volatility (Figure 5). Accordingly, we tried to blow the solvent to a final volume of 200 μL from 3 mL, and directly loaded the sample through the membrane filter prior to instrumental analysis. This enrichment process significantly increases the recovery rate of hormone methyl ester (Figure 5).
Due to the lack of solvent replacement after nitrogen blow, some hormones had bi-peaks. The main reason is the mismatch between the injection solvent (dichloromethane) and the mobile phase (water and ACN). Considering that dichloromethane volatilizes faster than MeOH during nitrogen blowing, we added 1 mL MeOH before nitrogen blowing, so that the final 200 μL solution had higher MeOH content. To the end, the purpose of solvent replacement without blowing dry was achieved. The chromatograms with and without MeOH during nitrogen blowing are shown in Figure 6.

3.4. Method Verification

3.4.1. Matrix Effect

Grape pericarp and seeds vary greatly in compound composition and content at different growth stages, resulting in different matrix effects. To ensure the applicability of the method at different growth stages, matrix effects should be tested separately. We evaluated the matrix effect of the pericarp and seed at the green fruit stage and the mature stage. As shown in Table 2, the matrix effect was in the acceptable range of 73–119%, indicating that the method is available for either green or red berry fruits.

3.4.2. Recovery and Precision

The recoveries of various hormones in grape pericarp were evaluated by adding their standards of three concentrations using the method described in Section 2.7. The recovery rates of 11 phytohormones ranged from 63% to 118% (Table 3). In fact, the recovery rates of most hormones were above 80%, which proves that the analytic method has a suitable accuracy. Apart from ABA (11.3%), the coefficients of variation for other 11 hormones were all less than 5%, indicating that this method has an acceptable precision (Table 3).

3.4.3. Linearity

The standard curves were made as described in Section 2.8. The same amount of internal standard (TPP) was added into the standard curve solution and in the detection of the sample. In the equation of linear regression (Table 4), y refers to the concentration of the hormone, and x refers to the ratio of the peak area of the hormone to the internal standard. A suitable linear relationship was attained, and the linearly dependent coefficient (R2) was greater than 0.9980. The limits of detection (LOD) were between 0.001 and 1.66 ng/mL, and the limits of quantization (LOQ) were between 0.004 and 5 ng/mL. The LOD and LOQ of IAA and IBA were too high, so we changed their detection modes. The optimization of the method was described in Section 3.5.2, and the results are presented in Table S2. By comparison, the LOD and LOQ of most hormones were lower than the current methods for detecting hormones in plants [44,53,57,63,66].

3.5. Method Application

3.5.1. Profiling Phytohormones during Grape Development from Different Vineyards

To verify the feasibility of the method developed, we tested the changes in 11 phytohormones in the pericarp and seed during the development of Cabernet Sauvignon grape berries from two vineyards (Tianfu and Zhihui). The accumulation of TSS during grape berry development was similar in these two vineyards, but at 10 days before véraison (DAV−10) and at véraison (DAV0), the grape berries from Tianfu had larger volume compared to those from Zhihui (Figure 7B). IP is closely related to the expansion of plant cells (Figure 7A,B). In grape pericarp, IP increased rapidly from the véraison stage (DAV0), and was 37-fold (Tianfu) and 11-fold (Zhihui) higher than the initial concentration at DAV20, which is consistent with the increasing fruit volume in this period (Figure 7A). IP showed a downward trend near véraison (DAV−10, 0, 10) in grape seeds, and then stabilized in the subsequent maturation process. In grape pericarp, ABA rises sharply from a lower level to a peak during the véraison period (DAV−10–DAV0), then drops rapidly within 20 days and returns to the initial lower level.
Figure 7C,D shows the changes in the content of the remaining acid hormones and methyl ester hormones. The results show significant tissue specificity for both hormonal content and dynamics throughout the growing season. The accumulation patterns of SA and JA were opposite. SA presented a higher content in grape pericarp, while JA accumulated more in seed, and their content showed a downward trend throughout the maturation. MeSA in grape pericarp decreased near the véraison period (DAV−10, 0, 10), then increased at the end of the season, while it kept decreasing in the seed. The hormones with lower content in the tissues are stable throughout the tested season, such as JA and MeJA in the pericarp and SA, GA3 and MeIAA in the seed.
The trends of hormone changes between the grape berries from Tianfu and Zhihui vineyards were similar, but there were differences in some periods. IP at DAV10 and DAV20 as well as ABA at DAV−10 in grape pericarp of Tianfu vineyard were significantly higher than those of Zhihui vineyard. This was consistent with our observation that Cabernet Sauvignon grapes in the Tianfu vineyard started the ripening process earlier. Interestingly, the MeIAA in grape pericarp showed a considerable difference between the two vineyards. In almost all periods (DAV−10, 10, 20, 30, 40, 50, 57), the grape pericarp of Tianfu vineyard accumulated more MeIAA. This will be further studied in the future.

3.5.2. Profiling Phytohormones in Grape after Exogenous Hormone Treatment

It should be noted that IAA and IBA were not detected in the samples from the two vineyards mentioned above. Considering that these are very important hormones in fruit, afterwards, we optimized the detection methods of the two hormones. The Dynamic Multiple Reaction Monitoring (dMRM) mode was adopted instead of the original MRM mode to detect IAA and IBA in the positive ion mode (Table S4). The ion transitions were IAA (176 > 130), IBA (204.1 > 186). The results show that the current LOQ of 0.16 ng/mL was 10 times lower than the original method (Table S5).
NAA is a synthetic auxin analogue, which can be used to spray grape berries before véraison to delay the maturation process [67,68,69]. In this study, we used the Cabernet Sauvignon grape berries treated with NAA 10 days prior to véraison to verify the optimized detection method. Figure 8 shows the hormone contents in the pericarp and seed 10 days after treatment, including untreated control, 10 mg/L NAA-treated (NAA10) grape berry samples and 40 mg/L NAA-treated (NAA40) grape berry samples. The results show that both concentrations of NAA treatment significantly reduced ABA levels in the pericarp, which may be due to the fact that NAA affected the biosynthesis of endogenous IAA, while the reduction in the latter caused the down-regulation of ABA synthesis gene expression [70]. This implies that the inhibition of grape berry ripening may be due to the effect of crosstalk between IAA and ABA. As expected, the IAA levels of the two treatment groups were also lower than those of the control group, which is consistent with previous findings in Arabidopsis [71]. It is speculated that there is also a feedback regulatory mechanism of auxin similar to Arabidopsis in grapes.
Interestingly, even if the seeds are not directly exposed to the NAA spraying, their hormone levels are still greatly affected. The levels of IP and IAA in the two treatment groups in the seeds are lower than those in the control group, which is consistent with the results in the pericarp. This result implies a potential antagonistic effect of NAA and IP in affecting grape pericarp and seed expansion, as well as the existence of the same feedback regulatory mechanism of auxin in seed. Different from the variation in the pericarp, the ABA level of the NAA40-treated group in the seeds was significantly higher than that of the control group and NAA10-treated group. This could accelerate the maturation of the seeds, but the reason is unknown. We speculate the existence of a signaling pathway that allows external environmental signals to be transmitted through the pericarp to the seeds to regulate their growth and developmental processes through hormonal responses.

4. Conclusions

In this work, we developed, optimized and validated a UHPLC-MS/MS method for the analysis of 11 phytohormones in grape skin and seeds. The developed UHPLC-MS/MS method efficiently isolated phytohormones from polyphenols using a one-step SPE method, providing a rapid, cost-effective and accurate option for the detection of phytohormones in phenol-rich fruits. The novel method was applied to profile phytohormones in pericarp and seed during grape development, as well as hormonal differences under different vineyard and exogenous hormone treatments. In the subsequent study, we will perform further detection experiments in grape samples from different terroirs and we will also apply the method to other phenol-rich fruits such as mulberries and cherries.

Supplementary Materials

The following supporting information can be downloaded at: https://www.mdpi.com/article/10.3390/horticulturae8060548/s1, Figure S1: Chemical structures of IP, GA3, SA, JA, IAA, IBA, MeIAA, MeSA, MeJA and BL as representative phytohormones; Table S1: The MRM parameters of 5 anthocyanins; Table S2: The MRM parameters of non-anthocyanin phenolics; Table S3: Abundance of anthocyanins and non-anthocyanin phenols in sample solution using different elution solution; Table S4: The dMRM parameters of 11 hormones and internal standard; Table S5: Linearity, LODs and LOQs of IAA and IBA in dMRM mode.

Author Contributions

Conceptualization, Q.P.; methodology, X.Y.; validation, X.Y.; formal analysis, X.Y., N.X. and X.M.; resources, C.D.; data curation, X.Y.; writing—original draft preparation, X.Y.; writing review and editing, Q.P.; visualization, X.Y., N.X. and X.M.; supervision, Q.P.; project administration, Q.P. and. C.D. All authors have read and agreed to the published version of the manuscript.

Funding

This research was funded by the National Nature Science Foundation of China, grant numbers 32072513 to Q.P. and U20A2042 to C.D.

Institutional Review Board Statement

Not applicable.

Informed Consent Statement

Not applicable.

Data Availability Statement

The data used for the analysis in this study are available within the article and the Supplementary Materials.

Acknowledgments

The authors sincerely thank Chateau Yuanshi and Chateau GreatWall Terroir for grape sampling support.

Conflicts of Interest

The authors declare no conflict of interest.

References

  1. Bari, R.; Jones, J.D.G. Role of Plant Hormones in Plant Defence Responses. Plant Mol. Biol. 2009, 69, 473–488. [Google Scholar] [CrossRef]
  2. Zhao, B.; Liu, Q.; Wang, B.; Yuan, F. Roles of Phytohormones and Their Signaling Pathways in Leaf Development and Stress Responses. J. Agric. Food Chem. 2021, 69, 3566–3584. [Google Scholar] [CrossRef] [PubMed]
  3. Pieterse, C.M.J.; Van der Does, D.; Zamioudis, C.; Leon-Reyes, A.; Van Wees, S.C.M. Hormonal Modulation of Plant Immunity. Annu. Rev. Cell Dev. Biol. 2012, 28, 489–521. [Google Scholar] [CrossRef] [PubMed] [Green Version]
  4. Godoy, F.; Kühn, N.; Muñoz, M.; Marchandon, G.; Gouthu, S.; Deluc, L.; Delrot, S.; Lauvergeat, V.; Arce-Johnson, P. The Role of Auxin during Early Berry Development in Grapevine as Revealed by Transcript Profiling from Pollination to Fruit Set. Hortic. Res. 2021, 8, 140. [Google Scholar] [CrossRef]
  5. Jang, G.; Chang, S.H.; Um, T.Y.; Lee, S.; Kim, J.-K.; Choi, Y.D. Antagonistic Interaction between Jasmonic Acid and Cytokinin in Xylem Development. Sci. Rep. 2017, 7, 10212. [Google Scholar] [CrossRef] [PubMed] [Green Version]
  6. Chen, Q.; Sun, J.; Zhai, Q.; Zhou, W.; Qi, L.; Xu, L.; Wang, B.; Chen, R.; Jiang, H.; Qi, J.; et al. The Basic Helix-Loop-Helix Transcription Factor MYC2 Directly Represses PLETHORA Expression during Jasmonate-Mediated Modulation of the Root Stem Cell Niche in Arabidopsis. Plant Cell 2011, 23, 3335–3352. [Google Scholar] [CrossRef] [PubMed] [Green Version]
  7. Zander, M.; Chen, S.; Imkampe, J.; Thurow, C.; Gatz, C. Repression of the Arabidopsis thaliana Jasmonic Acid/Ethylene-Induced Defense Pathway by TGA-Interacting Glutaredoxins Depends on Their C-Terminal ALWL Motif. Mol. Plant 2012, 5, 831–840. [Google Scholar] [CrossRef] [Green Version]
  8. Pérez, A.C.; Goossens, A. Jasmonate Signalling: A Copycat of Auxin Signalling? Plant Cell Environ. 2013, 36, 2071–2084. [Google Scholar] [CrossRef]
  9. Choudhary, S.P.; Yu, J.-Q.; Yamaguchi-Shinozaki, K.; Shinozaki, K.; Tran, L.-S.P. Benefits of Brassinosteroid Crosstalk. Trends Plant Sci. 2012, 17, 594–605. [Google Scholar] [CrossRef]
  10. Zhu, Z.; Lee, B. Friends or Foes: New Insights in Jasmonate and Ethylene Co-Actions. Plant Cell Physiol. 2015, 56, 414–420. [Google Scholar] [CrossRef]
  11. Liu, L.; Li, H.; Zeng, H.; Cai, Q.; Zhou, X.; Yin, C. Exogenous Jasmonic Acid and Cytokinin Antagonistically Regulate Rice Flag Leaf Senescence by Mediating Chlorophyll Degradation, Membrane Deterioration, and Senescence-Associated Genes Expression. J. Plant Growth Regul. 2016, 35, 366–376. [Google Scholar] [CrossRef]
  12. Nitschke, S.; Cortleven, A.; Iven, T.; Feussner, I.; Havaux, M.; Riefler, M.; Schmülling, T. Circadian Stress Regimes Affect the Circadian Clock and Cause Jasmonic Acid-Dependent Cell Death in Cytokinin-Deficient Arabidopsis Plants. Plant Cell 2016, 28, 1616–1639. [Google Scholar] [CrossRef] [PubMed] [Green Version]
  13. Liu, J.; Moore, S.; Chen, C.; Lindsey, K. Crosstalk Complexities between Auxin, Cytokinin, and Ethylene in Arabidopsis Root Development: From Experiments to Systems Modeling, and Back Again. Mol. Plant 2017, 10, 1480–1496. [Google Scholar] [CrossRef] [PubMed] [Green Version]
  14. Saniewski, M.; Ueda, J.; Miyamoto, K. Relationships between Jasmonates and Auxin in Regulation of Some Physiological Processes in Higher Plants. Acta Physiol. Plant 2002, 24, 211–220. [Google Scholar] [CrossRef]
  15. Hofmann, N.R. Taking Hormone Crosstalk to a New Level: Brassinosteroids Regulate Gibberellin Biosynthesis. Plant Cell 2015, 27, 2081. [Google Scholar] [CrossRef] [Green Version]
  16. Chandler, J.W. Auxin as Compère in Plant Hormone Crosstalk. Planta 2009, 231, 1–12. [Google Scholar] [CrossRef]
  17. Xi, Z.; Zhang, Z.; Huo, S.; Luan, L.; Gao, X.; Ma, L.; Fang, Y. Regulating the Secondary Metabolism in Grape Berry Using Exogenous 24-Epibrassinolide for Enhanced Phenolics Content and Antioxidant Capacity. Food Chem. 2013, 141, 3056–3065. [Google Scholar] [CrossRef]
  18. Lacampagne, S.; Gagné, S.; Gény, L. Involvement of Abscisic Acid in Controlling the Proanthocyanidin Biosynthesis Pathway in Grape Skin: New Elements Regarding the Regulation of Tannin Composition and Leucoanthocyanidin Reductase (LAR) and Anthocyanidin Reductase (ANR) Activities and Expression. J. Plant Growth Regul. 2010, 29, 81–90. [Google Scholar] [CrossRef]
  19. Xi, Z.-M.; Meng, J.-F.; Huo, S.-S.; Luan, L.-Y.; Ma, L.-N.; Zhang, Z.-W. Exogenously Applied Abscisic Acid to Yan73 (V. vinifera) Grapes Enhances Phenolic Content and Antioxidant Capacity of Its Wine. Int. J. Food Sci. Nutr. 2013, 64, 444–451. [Google Scholar] [CrossRef]
  20. Paladines-Quezada, D.F.; Moreno-Olivares, J.D.; Fernández-Fernández, J.I.; Bautista-Ortín, A.B.; Gil-Muñoz, R. Influence of Methyl Jasmonate and Benzothiadiazole on the Composition of Grape Skin Cell Walls and Wines. Food Chem. 2019, 277, 691–697. [Google Scholar] [CrossRef]
  21. Martins, V.; Unlubayir, M.; Teixeira, A.; Gerós, H.; Lanoue, A. Calcium and methyl jasmonate cross-talk in the secondary metabolism of grape cells. Plant Physiol. Biochem. 2021, 165, 228–238. [Google Scholar] [CrossRef] [PubMed]
  22. Su, Z.; Wang, X.; Xuan, X.; Sheng, Z.; Jia, H.; Emal, N.; Liu, Z.; Zheng, T.; Wang, C.; Fang, J. Characterization and Action Mechanism Analysis of VvmiR156b/c/d-VvSPL9 Module Responding to Multiple-Hormone Signals in the Modulation of Grape Berry Color Formation. Foods 2021, 10, 896. [Google Scholar] [CrossRef] [PubMed]
  23. Tyagi, K.; Maoz, I.; Kochanek, B.; Sela, N.; Lerno, L.; Ebeler, S.E.; Lichter, A. Cytokinin but Not Gibberellin Application Had Major Impact on the Phenylpropanoid Pathway in Grape. Hortic. Res. 2021, 8, 51. [Google Scholar] [CrossRef] [PubMed]
  24. Davies, C.; Boss, P.K.; Robinson, S.P. Treatment of Grape Berries, a Nonclimacteric Fruit with a Synthetic Auxin, Retards Ripening and Alters the Expression of Developmentally Regulated Genes. Plant Physiol. 1997, 115, 1155–1161. [Google Scholar] [CrossRef] [Green Version]
  25. Berli, F.J.; Bottini, R. UV-B and Abscisic Acid Effects on Grape Berry Maturation and Quality. J. Berry Res. 2013, 3, 1–14. [Google Scholar] [CrossRef] [Green Version]
  26. Chaves, M.M.; Zarrouk, O.; Francisco, R.; Costa, J.M.; Santos, T.; Regalado, A.P.; Rodrigues, M.L.; Lopes, C.M. Grapevine under Deficit Irrigation: Hints from Physiological and Molecular Data. Ann. Bot. 2010, 105, 661–676. [Google Scholar] [CrossRef] [Green Version]
  27. Guo, S.-H.; Yang, B.-H.; Wang, X.-W.; Li, J.-N.; Li, S.; Yang, X.; Ren, R.-H.; Fang, Y.-L.; Xu, T.-F.; Zhang, Z.-W.; et al. ABA signaling plays a key role in regulated deficit irrigation-driven anthocyanins accumulation in ‘Cabernet Sauvignon’ grape berries. Environ. Exp. Bot. 2021, 181, 104290. [Google Scholar] [CrossRef]
  28. Ryu, S.; Han, J.H.; Cho, J.G.; Jeong, J.H.; Lee, S.K.; Lee, H.J. High temperature at veraison inhibits anthocyanin biosynthesis in berry skins during ripening in ‘Kyoho’ grapevines. Plant Physiol. Biochem. 2020, 157, 219–228. [Google Scholar] [CrossRef]
  29. Alonso, R.; Berli, F.J.; Fontana, A.; Piccoli, P.; Bottini, R. Abscisic Acid’s Role in the Modulation of Compounds That Contribute to Wine Quality. Plants 2021, 10, 938. [Google Scholar] [CrossRef]
  30. Li, D.; Pang, Y.; Li, H.; Guo, D.; Wang, R.; Ma, C.; Xu, W.; Wang, L.; Wang, S. Comparative analysis of the gene expression profile under two cultivation methods reveals the critical role of ABA in grape quality promotion. Sci. Hortic. 2021, 281, 109924. [Google Scholar] [CrossRef]
  31. Pilati, S.; Bagagli, G.; Sonego, P.; Moretto, M.; Brazzale, D.; Castorina, G.; Simoni, L.; Tonelli, C.; Guella, G.; Engelen, K.; et al. Abscisic Acid Is a Major Regulator of Grape Berry Ripening Onset: New Insights into ABA Signaling Network. Front. Plant Sci. 2017, 8, 1093. [Google Scholar] [CrossRef] [PubMed] [Green Version]
  32. Du, F.; Ruan, G.; Liu, H. Analytical Methods for Tracing Plant Hormones. Anal. Bioanal. Chem. 2012, 403, 55–74. [Google Scholar] [CrossRef] [PubMed]
  33. Granda, V.; Cuesta, C.; Álvarez, R.; Ordás, R.; Centeno, M.L.; Rodríguez, A.; Majada, J.P.; Fernández, B.; Feito, I. Rapid Responses of C14 Clone of Eucalyptus Globulus to Root Drought Stress: Time-Course of Hormonal and Physiological Signaling. J. Plant Physiol. 2011, 168, 661–670. [Google Scholar] [CrossRef] [PubMed]
  34. Ju, S.; Ji, L.; Xu, D. Dynamic Changes in Endogenous Hormones in Terminal Buds from Different Crown Positions in Sequoia Sempervirens (Lamb.) Endl. HortScience 2021, 56, 538–542. [Google Scholar] [CrossRef]
  35. Wu, L.; Lan, J.; Xiang, X.; Xiang, H.; Jin, Z.; Khan, S.; Liu, Y. Transcriptome sequencing and endogenous phytohormone analysis reveal new insights in CPPU controlling fruit development in kiwifruit (Actinidia chinensis). PLoS ONE 2020, 15, e0240355. [Google Scholar] [CrossRef]
  36. Yi, M.; Zhao, L.; Wu, K.; Liu, C.; Deng, D.; Zhao, K.; Li, J.; Deng, A. Simultaneous Detection of Plant Growth Regulators Jasmonic Acid and Methyl Jasmonate in Plant Samples by a Monoclonal Antibody-Based ELISA. Analyst 2020, 145, 4004–4011. [Google Scholar] [CrossRef]
  37. Leng, F.; Cao, J.; Wang, S.; Jiang, L.; Li, X.; Sun, C. Transcriptomic Analyses of Root Restriction Effects on Phytohormone Content and Signal Transduction during Grape Berry Development and Ripening. Int. J. Mol. Sci. 2018, 19, 2300. [Google Scholar] [CrossRef] [Green Version]
  38. Delatorre, C.; Rodríguez, A.; Rodríguez, L.; Majada, J.P.; Ordás, R.J.; Feito, I. Hormonal Profiling: Development of a Simple Method to Extract and Quantify Phytohormones in Complex Matrices by UHPLC–MS/MS. J. Chromatogr. B 2017, 1040, 239–249. [Google Scholar] [CrossRef]
  39. He, L.; Meng, N.; Castellarin, S.D.; Wang, Y.; Sun, Q.; Li, X.-Y.; Dong, Z.-G.; Tang, X.-P.; Duan, C.-Q.; Pan, Q.-H. Combined Metabolite and Transcriptome Profiling Reveals the Norisoprenoid Responses in Grape Berries to Abscisic Acid and Synthetic Auxin. Int. J. Mol. Sci. 2021, 22, 1420. [Google Scholar] [CrossRef]
  40. Rawlinson, C.; Kamphuis, L.G.; Gummer, J.P.A.; Singh, K.B.; Trengove, R.D. A Rapid Method for Profiling of Volatile and Semi-Volatile Phytohormones Using Methyl Chloroformate Derivatisation and GC–MS. Metabolomics 2015, 11, 1922–1933. [Google Scholar] [CrossRef] [Green Version]
  41. Engelberth, J.; Schmelz, E.A.; Alborn, H.T.; Cardoza, Y.J.; Huang, J.; Tumlinson, J.H. Simultaneous quantification of jasmonic acid and salicylic acid in plants by vapor-phase extraction and gas chromatography-chemical ionization-mass spectrometry. Anal. Biochem. 2003, 312, 242–250. [Google Scholar] [CrossRef]
  42. Giannarelli, S.; Muscatello, B.; Bogani, P.; Spiriti, M.M.; Buiatti, M.; Fuoco, R. Comparative determination of some phytohormones in wild-type and genetically modified plants by gas chromatography–mass spectrometry and high-performance liquid chromatography–tandem mass spectrometry. Anal. Biochem. 2010, 398, 60–68. [Google Scholar] [CrossRef] [PubMed]
  43. Ma, Z.; Ge, L.; Lee, A.S.Y.; Yong, J.W.H.; Tan, S.N.; Ong, E.S. Simultaneous analysis of different classes of phytohormones in coconut (Cocos nucifera L.) water using high-performance liquid chromatography and liquid chromatography–tandem mass spectrometry after solid-phase extraction. Anal. Chim. Acta 2008, 610, 274–281. [Google Scholar] [CrossRef] [PubMed]
  44. Jiang, C.; Dai, J.; Han, H.; Wang, C.; Zhu, L.; Lu, C.; Chen, H. Determination of Thirteen Acidic Phytohormones and Their Analogues in Tea (Camellia Sinensis) Leaves Using Ultra High Performance Liquid Chromatography Tandem Mass Spectrometry. J. Chromatogr. B 2020, 1149, 122144. [Google Scholar] [CrossRef] [PubMed]
  45. Oklestkova, J.; Tarkowská, D.; Eyer, L.; Elbert, T.; Marek, A.; Smržová, Z.; Novák, O.; Fránek, M.; Zhabinskii, V.N.; Strnad, M. Immunoaffinity chromatography combined with tandem mass spectrometry: A new tool for the selective capture and analysis of brassinosteroid plant hormones. Talanta 2017, 170, 432–440. [Google Scholar] [CrossRef] [PubMed]
  46. Manzi, M.; Gómez-Cadenas, A.; Arbona, V. Rapid and reproducible determination of active gibberellins in citrus tissues by UPLC/ESI-MS/MS. Plant Physiol. Biochem. 2015, 94, 1–9. [Google Scholar] [CrossRef] [PubMed]
  47. Cao, D.; Barbier, F.; Yoneyama, K.; Beveridge, C.A. A Rapid Method for Quantifying RNA and Phytohormones From a Small Amount of Plant Tissue. Front. Plant Sci. 2020, 11, 605069. [Google Scholar] [CrossRef]
  48. Šimura, J.; Antoniadi, I.; Široká, J.; Tarkowská, D.; Strnad, M.; Ljung, K.; Novák, O. Plant Hormonomics: Multiple Phytohormone Profiling by Targeted Metabolomics. Plant Physiol. 2018, 177, 476–489. [Google Scholar] [CrossRef] [Green Version]
  49. Floková, K.; Tarkowská, D.; Miersch, O.; Strnad, M.; Wasternack, C.; Novák, O. UHPLC–MS/MS Based Target Profiling of Stress-Induced Phytohormones. Phytochemistry 2014, 105, 147–157. [Google Scholar] [CrossRef]
  50. Xin, P.; Guo, Q.; Li, B.; Cheng, S.; Yan, J.; Chu, J. A Tailored High-Efficiency Sample Pretreatment Method for Simultaneous Quantification of 10 Classes of Known Endogenous Phytohormones. Plant Commun. 2020, 1, 100047. [Google Scholar] [CrossRef]
  51. Pan, X.; Welti, R.; Wang, X. Quantitative Analysis of Major Plant Hormones in Crude Plant Extracts by High-Performance Liquid Chromatography-Mass Spectrometry. Nat. Protoc. 2010, 5, 986–992. [Google Scholar] [CrossRef] [PubMed]
  52. Lu, Q.; Zhang, W.; Gao, J.; Lu, M.; Zhang, L.; Li, J. Simultaneous Determination of Plant Hormones in Peach Based on Dispersive Liquid–Liquid Microextraction Coupled with Liquid Chromatography–Ion Trap Mass Spectrometry. J. Chromatogr. B 2015, 992, 8–13. [Google Scholar] [CrossRef] [PubMed]
  53. Li, G.; Lu, S.; Wu, H.; Chen, G.; Liu, S.; Kong, X.; Kong, W.; You, J. Determination of Multiple Phytohormones in Fruits by High-Performance Liquid Chromatography with Fluorescence Detection Using Dispersive Liquid–Liquid Microextraction Followed by Precolumn Fluorescent Labeling. J. Sep. Sci. 2015, 38, 187–196. [Google Scholar] [CrossRef] [PubMed]
  54. Campillo, N.; Viñas, P.; Férez-Melgarejo, G.; Hernández-Córdoba, M. Dispersive Liquid—Liquid Microextraction for the Determination of Three Cytokinin Compounds in Fruits and Vegetables by Liquid Chromatography with Time-of-Flight Mass Spectrometry. Talanta 2013, 116, 376–381. [Google Scholar] [CrossRef]
  55. Cai, W.-J.; Ye, T.-T.; Wang, Q.; Cai, B.-D.; Feng, Y.-Q. A Rapid Approach to Investigate Spatiotemporal Distribution of Phytohormones in Rice. Plant Methods 2016, 12, 47. [Google Scholar] [CrossRef] [Green Version]
  56. Flores, M.I.A.; Romero-González, R.; Frenich, A.G.; Vidal, J.L.M. QuEChERS-Based Extraction Procedure for Multifamily Analysis of Phytohormones in Vegetables by UHPLC-MS/MS. J. Sep. Sci. 2011, 34, 1517–1524. [Google Scholar] [CrossRef]
  57. Müller, M.; Munné-Bosch, S. Rapid and Sensitive Hormonal Profiling of Complex Plant Samples by Liquid Chromatography Coupled to Electrospray Ionization Tandem Mass Spectrometry. Plant Methods 2011, 7, 37. [Google Scholar] [CrossRef] [Green Version]
  58. Coombe, B.G. Growth Stages of the Grapevine: Adoption of a System for Identifying Grapevine Growth Stages. Aust. J. Grape Wine Res. 1995, 1, 104–110. [Google Scholar] [CrossRef]
  59. Cho, S.-K.; Abd El-Aty, A.M.; Park, K.H.; Park, J.-H.; Assayed, M.E.; Jeong, Y.-M.; Park, Y.-S.; Shim, J.-H. Simple Multiresidue Extraction Method for the Determination of Fungicides and Plant Growth Regulator in Bean Sprouts Using Low Temperature Partitioning and Tandem Mass Spectrometry. Food Chem. 2013, 136, 1414–1420. [Google Scholar] [CrossRef]
  60. De Nicolò, A.; Cantù, M.; D’Avolio, A. Matrix Effect Management in Liquid Chromatography Mass Spectrometry: The Internal Standard Normalized Matrix Effect. Bioanalysis 2017, 9, 1093–1105. [Google Scholar] [CrossRef]
  61. Wright, M.J.; Wheller, R.; Wallace, G.; Green, R. Internal Standards in Regulated Bioanalysis: Putting in Place a Decision-Making Process during Method Development. Bioanalysis 2019, 11, 1701–1713. [Google Scholar] [CrossRef] [PubMed]
  62. Wang, L.; Zou, Y.; Kaw, H.Y.; Wang, G.; Sun, H.; Cai, L.; Li, C.; Meng, L.-Y.; Li, D. Recent Developments and Emerging Trends of Mass Spectrometric Methods in Plant Hormone Analysis: A Review. Plant Methods 2020, 16, 54. [Google Scholar] [CrossRef] [PubMed] [Green Version]
  63. Han, Z.; Liu, G.; Rao, Q.; Bai, B.; Zhao, Z.; Liu, H.; Wu, A. A Liquid Chromatography Tandem Mass Spectrometry Method for Simultaneous Determination of Acid/Alkaline Phytohormones in Grapes. J. Chromatogr. B 2012, 881–882, 83–89. [Google Scholar] [CrossRef] [PubMed]
  64. Zhao, X.; He, F.; Zhang, X.-K.; Shi, Y.; Duan, C.-Q. Impact of Three Phenolic Copigments on the Stability and Color Evolution of Five Basic Anthocyanins in Model Wine Systems. Food Chem. 2022, 375, 131670. [Google Scholar] [CrossRef] [PubMed]
  65. Crupi, P.; Coletta, A.; Anna Milella, R.; Perniola, R.; Gasparro, M.; Genghi, R.; Antonacci, D. HPLC-DAD-ESI-MS Analysis of Flavonoid Compounds in 5 Seedless Table Grapes Grown in Apulian Region. J. Food Sci. 2012, 77, C174–C181. [Google Scholar] [CrossRef]
  66. Yu, J.-N.; Meng, Q.-Y.; Liu, W.-J.; Lu, Y.-L.; Ren, X.-L. Analysis of Acidic Endogenous Phytohormones in Grapes by Using Online Solid-Phase Extraction Coupled with LC-MS/MS. J. Chromatogr. Sci. 2014, 52, 1145–1149. [Google Scholar] [CrossRef] [PubMed] [Green Version]
  67. He, L.; Ren, Z.-Y.; Wang, Y.; Fu, Y.-Q.; Li, Y.; Meng, N.; Pan, Q.-H. Variation of Growth-to-Ripening Time Interval Induced by Abscisic Acid and Synthetic Auxin Affecting Transcriptome and Flavor Compounds in Cabernet Sauvignon Grape Berry. Plants 2020, 9, 630. [Google Scholar] [CrossRef]
  68. Davies, C.; Nicholson, E.L.; Böttcher, C.; Burbidge, C.A.; Bastian, S.E.P.; Harvey, K.E.; Huang, A.-C.; Taylor, D.K.; Boss, P.K. Shiraz Wines Made from Grape Berries (Vitis vinifera) Delayed in Ripening by Plant Growth Regulator Treatment Have Elevated Rotundone Concentrations and “Pepper” Flavor and Aroma. J. Agric. Food Chem. 2015, 63, 2137–2144. [Google Scholar] [CrossRef]
  69. Böttcher, C.; Johnson, T.E.; Burbidge, C.A.; Nicholson, E.L.; Boss, P.K.; Maffei, S.M.; Bastian, S.E.P.; Davies, C. Use of Auxin to Delay Ripening: Sensory and Biochemical Evaluation of Cabernet Sauvignon and Shiraz. Aust. J. Grape Wine Res. 2022, 28, 208–217. [Google Scholar] [CrossRef]
  70. Jia, H.; Xie, Z.; Wang, C.; Shangguan, L.; Qian, N.; Cui, M.; Liu, Z.; Zheng, T.; Wang, M.; Fang, J. Abscisic Acid, Sucrose, and Auxin Coordinately Regulate Berry Ripening Process of the Fujiminori Grape. Funct. Integr. Genom. 2017, 17, 441–457. [Google Scholar] [CrossRef]
  71. Suzuki, M.; Yamazaki, C.; Mitsui, M.; Kakei, Y.; Mitani, Y.; Nakamura, A.; Ishii, T.; Soeno, K.; Shimada, Y. Transcriptional Feedback Regulation of YUCCA Genes in Response to Auxin Levels in Arabidopsis. Plant Cell Rep. 2015, 34, 1343–1352. [Google Scholar] [CrossRef] [PubMed]
Figure 1. Chromatographic separation of 11 hormones and an internal standard. ABA, abscisic acid; BL, brassinolide; GA3, gibberellin A3; IAA, indole-3-acetic acid; IBA, indole-3-butyric acid; JA, jasmonic acid; MeIAA, methyl indole-3-acetate; MeJA, methyl jasmonate; MeSA, methyl salicylate; SA, salicylic acid; TPP, triphenyl phosphate; IP, N6-(2-isopentenyl) adenine.
Horticulturae 08 00548 g001
Figure 2. Peak area comparison of acidic hormones when using water and ACN with different contents of FA as mobile phase (n = 3).
Horticulturae 08 00548 g002
Figure 3. Comparison of the elution effects of two elution solvents: MeOH (1% FA) and CH2Cl2 (2.5% MeOH, 0.5% FA). (A) The HLB cartridge before and after the elution and the sample solution after the elution using MeOH (0.1% FA) as the elution solvent. (B) The HLB cartridge before and after the elution and the sample solution after the elution using CH2Cl2 (2.5% MeOH, 0.5% FA) as the elution solvent. (C) The three chromatograms detect the sample solution shown in (A) after concentration. The first chromatogram shows the absorption at 280 nm and 520 nm in samples using UHPLC-DAD. The second chromatogram shows the targeted analysis of anthocyanins and the third chromatogram shows the targeted analysis of non-anthocyanin phenolics in samples using UHPLC-QqQ-MS. Several compounds with high peak areas are marked in the chromatogram. (D) The three chromatograms detect the sample solution shown in (B) after concentration. The first chromatogram shows the absorption at 280 nm and 520 nm in samples using UHPLC-DAD. The second chromatogram shows the targeted analysis of anthocyanins and the third chromatogram shows the targeted analysis of non-anthocyanin phenolics in samples using UHPLC-QqQ-MS.
Horticulturae 08 00548 g003
Figure 4. The effect of 4 different elution on recoveries of 11 phytohormones (n = 3).
Horticulturae 08 00548 g004
Figure 5. The effects of nitrogen blowing to dry and to 200 μL on recoveries of 11 phytohormones (n = 3).
Horticulturae 08 00548 g005
Figure 6. The chromatograms of IP, GA3, SA and IAA in different concentration conditions (nitrogen blow with and without 1 mL MeOH).
Horticulturae 08 00548 g006
Figure 7. (A,C,D) The dynamics of IP, ABA, SA, JA, GA3, MeSA, MeJA and MeIAA content in the pericarp and seed of the Cabernet Sauvignon grapes in Tianfu and Zhihui vineyards. (B) The volume of 50 grapes and total soluble solids (TSS) content. Vertical bars indicate standard error of mean (SEM) of 3 biological replicates. Different letters indicate significant differences among developmental stages (Tukey’s test, p < 0.05), and no letters indicate no significant differences. The asterisk indicates a significant difference between the two vineyards (Student’s t test, *, **, *** indicate p < 0.05, 0.01, 0.001).
Horticulturae 08 00548 g007
Figure 8. Scatterplots of phytohormone contents (ng/g FW) in pericarp and seed samples of control, 10 mg/L NAA (NAA10) treated grape berry and 40 mg/L NAA (NAA40) treated grape berry. The asterisk indicates a significant difference between treatments (Holm–Sidak t test, *, **, *** indicate p < 0.05, 0.01, 0.001).
Horticulturae 08 00548 g008
Table 1. The MRM parameters of 11 hormones and an internal standard.
AnalytesTransitionFragmentorCollege EnergyRetention Time (min)Polarity
IP204.13 > 13699162.30Positive
GA3345.13 > 239.1162123.34Negative
SA137 > 9389204.01Negative
IAA174.1 > 1308584.30Negative
ABA263.1 > 15310485.34Negative
JA209.12 > 59.1118126.47Negative
IBA202.1 > 158128126.57Negative
MeIAA190.1 > 13084246.91Positive
MeSA153.1 > 12165167.74Positive
MeJA225.15 > 15195129.45Positive
BL481.36 > 445.4133129.66Positive
TPP327 > 2151703012.60Positive
Table 2. Matrix effects of 11 phytohormones in the pericarp and seed of green and red grape berries (%, n = 3).
PhytohormonesGreen PericarpRed PericarpGreen SeedBrown Seed
IP80.5 ± 0.680.4 ± 7.979.5 ± 0.973.0 ± 3.0
GA392.7 ± 2.595.8 ± 5.889.9 ± 2.591.0 ± 3.3
SA105.8 ± 4.0104.4 ± 8.2104.9 ± 4.9101.2 ± 5.0
IAA88.3 ± 1.393.6 ± 5.087.2 ± 2.486.5 ± 2.9
ABA90.6 ± 1.190.6 ± 0.582.6 ± 6.0104.0 ± 6.6
JA86.1 ± 3.484.0 ± 7.987.0 ± 6.585.9 ± 4.5
IBA88.6 ± 2.785.4 ± 6.183.1 ± 2.587.5 ± 3.3
MeIAA102.8 ± 13.6119.1 ± 8.591.0 ± 9.590.0 ± 2.8
MeSA91.1 ± 1.792.5 ± 7.476.1 ± 2.981.3 ± 5.2
MeJA88.0 ± 3.690.8 ± 4.489.6 ± 1.693.0 ± 2.5
BL92.0 ± 4.094.5 ± 5.592.4 ± 3.293.7 ± 2.8
Table 3. Recoveries and precisions (coefficient of variation) of 11 phytohormones (%, n = 3).
PhytohormonesRecoveryCoefficient of Variation
LowMediumHigh
IP75.1 ± 6.771.6 ± 3.267.2 ± 3.54.4
GA391.4 ± 5.890.2 ± 1.985 ± 1.42.1
SA110.1 ± 3.9102.6 ± 2.3111.4 ± 42.2
IAA96.6 ± 1.799.1 ± 398.1 ± 1.63.0
ABA77 ± 8.793.6 ± 10.6106.1 ± 3.611.3
JA94.4 ± 6.896.8 ± 4.2118.2 ± 1.54.4
IBA93 ± 1.597.5 ± 1.3101.1 ± 1.51.3
MeIAA84.2 ± 9.784.9 ± 3110 ± 1.33.5
MeSA79 ± 5.875.5 ± 2.363.6 ± 4.23.1
MeJA102 ± 5.197 ± 4.691.9 ± 1.64.7
BL101.1 ± 10.391 ± 2.788.9 ± 0.52.9
Table 4. The calibration equations, linearly dependent coefficient (R2), linear range, limit of detection (LOD) and limit of quantization (LOQ) for 11 phytohormones.
PhytohormonesEquation of Linear RegressionR2Linear Range (ng/mL)LOD (ng/mL)LOQ (ng/mL)
IPy = 0.6853x + 0.53830.99850.1–5000.0010.004
GA3y = 240.3742x + 0.01690.99990.25–10000.120.39
SAy = 18.8627x + 0.21290.99970.25–5000.301.00
IAAy = 1330.6574x + 1.18990.99995–10001.665.00
ABAy = 4.0284x − 0.65480.99800.1–2500.0020.007
JAy = 196.3287x + 0.17640.99940.25–5000.100.33
IBAy = 7069.2793x − 2.46750.99875–2501.605.00
MeIAAy = 6.0952x + 0.31780.99930.1–2500.040.25
MeSAy = 1016.6302x + 1.01050.99822.5–5000.752.50
MeJAy = 19.3897x + 0.10520.99950.25–2500.100.25
BLy = 79.2625x + 0.91100.99990.1–10000.160.53
Publisher’s Note: MDPI stays neutral with regard to jurisdictional claims in published maps and institutional affiliations.

