Article

Planting Date and Different N-Fertilization Rates Differently Modulate Agronomic and Economic Traits of a Sicilian Onion Landrace and of a Commercial Variety

by
Giuseppe Di Miceli
,
Davide Farruggia
*,
Nicolò Iacuzzi
,
Simona Bacarella
*,
Salvatore La Bella
and
Beppe Benedetto Consentino
Department of Agricultural, Food and Forest Sciences, Università degli Studi di Palermo, Viale delle Scienze 13, Building 4, 90128 Palermo, Italy
*
Authors to whom correspondence should be addressed.
Horticulturae 2022, 8(5), 454; https://doi.org/10.3390/horticulturae8050454
Submission received: 26 April 2022 / Revised: 12 May 2022 / Accepted: 13 May 2022 / Published: 18 May 2022

Abstract

:
The onion is one of the most widespread bulb vegetables worldwide. Onion cultivation is common in Sicily, as is the use of local genotypes. Cultivation practices are of particular interest in optimizing yield, quality, and profits. The aim of this study was to assess the agronomic response of a Sicilian landrace (Bianca Calda di Comiso, coded L1) and a commercial variety (Bianca di Maggio, coded V1) to different planting dates and N fertilization rates. An economic appraisal was also performed. The two genotypes were assessed using an experimental split-split-plot design with four levels of nitrogen rates (0, 80, 160, and 220 kg N ha−1) and two different planting dates (8 October 2005 to 9 October 2006 for the early planting date, and 27 December 2005 to 30 December 2006 for the traditional planting date). The marketable yield and production parameters were significantly influenced by the nitrogen dose: higher doses led to a higher total yield, with yield peaks above 60 t ha−1 and the marketable yield ranging from 23% to 54%. Simultaneously, decreases in the firmness (from 7% to 19%) and scale content (from 1% to 3%) were also reported. The L1 landrace showed a higher production than the V1 variety. The crop year did not significantly affect the results, and the traditional planting date appeared to be the most suitable choice in obtaining the best agronomic response. Economic analysis showed that the L1 landrace, with high-N application treatments, produced greater net benefits and marginal rates of return. Thus, the L1 landrace exposed to the highest dosages of nitrogen (160 or 220 kg ha−1) and transplanted during the traditional planting period is the best choice from agronomic and economic points of view.

1. Introduction

Plant genetic variability directly affects the yield and quality of vegetables [1]. In this respect, local populations, generated through the selection processes operated by farmers over the years (mass selection), have led to the biodiversity preservation of vegetable crops [1,2,3]. Because of its geographical position, Sicily is considered a center of origin and differentiation of many fruiting and green leafy vegetables grown in open fields and/or protected environments [4,5]. Raimondo et al. [6] found 3252 taxa in Sicily, over an area of 26,000 km2. Research into the recovery and preservation of landraces is imperative to avoid their genetic erosion and, simultaneously, to valorize them within genetic breeding programs [4].
Although Sicily is not the area of origin of the onion, a number of landraces, widespread in Sicily, have been cultivated and maintained by farmers over time. As is usual for landraces, these genotypes are capable of achieving high production rates with low cultivation inputs.
The onion (Allium cepa L.) is a bulb vegetable belonging to the Amaryllidaceae family [7]. It is one of the most widely grown vegetables in the world, with a production level of over 100 million metric tons in a total land area of 5 million hectares. China and India are the biggest producers of onions worldwide, and 65% of the production comes from Asia. In Europe, onion farming covers a little over 330,000 ha, with a production level of over 10 million metric tons [8]. In 2018, data on onion consumption from the Food and Agriculture Organization of the United Nations (the FAO) showed a per capita annual consumption of onions, at a worldwide level, of 11.76 kg; however, consumption in Italy is considerably lower, at 5.75 kg per annum [8].
The high worldwide level of onion farming is due to its pervasive culinary use and to its nutritional value [9]. Greater awareness of functional foods and nutraceuticals is encouraging consumers to search for foods such as the onion which contain natural substances with antioxidant, antibacterial, and antitumor properties, and which have a beneficial effect on the cardiocirculatory and immune systems [10].
Onion morphological, productive, and qualitative features are directly affected by genotype, the environment, agronomic practices, and post-harvest storage methods [11,12,13].
The application and management of agronomic inputs are imperative actions in improving production and profit for any crop. In this respect, nitrogen fertilization is one of the main practices for modulating plant growth and development, yield, and quality. In particular, the onion is characterized by a high nitrogen and potassium uptake during its growing cycle, which is directly related to the genotypes used and to pedoclimatic soil conditions [14,15,16,17]. Hence, the application of fertilizers is a crucial practice for increasing both yield and yield components, and for ensuring that the visual and proximal qualities expected by consumers are maintained. The availability of plant nitrogen greatly affects the marketable yield of onions. Indeed, some authors [18,19] reported that the marketable value of onions is related to morphological characteristics, such as the leaf area, the diameter, and the average bulb weight, which are linked to the absorption of nitrogen during the vegetative stage and the bulbing stage. Buckland et al. [20] and Przygocka-Cyna et al. [16] stated that the onion is sensitive to nutrient deficiency, due to its shallow root system; consequently, it is fundamental that an adequate dosage and an exact application time be established to maximize the bulb yield and quality. On the other hand, an excessive nitrogen supply causes a loss of fertilizer units, due to runoff and gasification, and, thus, contamination of groundwater [20,21,22].
Planting dates and nitrogen fertilization dosages are simple, effective, and practical agronomic practices for onion production. However, since the plant response to planting dates and nitrogen fertilization is affected by genotype and cultivation conditions, specific research is required to evaluate methods and doses.
Agronomic practices, including planting dates, fertilization management, and genotypes, might have an influence on onion growth, yield, and proximal quality. Moreover, there could be an optimal combination of these factors that synergistically enhances the production and quality of the onion bulb. Starting with the above considerations, the aim of this work was to appraise the interactive effect of genotype, planting date, and nitrogen fertilization dosage on the agronomic and economic traits of onions grown in a representative Sicilian production area.

2. Materials and Methods

2.1. Experimental Station, Experimental Design, and Treatments

The trials were carried out at the experimental station Don Pietro, located in a typical area of the Iblea plain (Ragusa) (utm-wgs84 3 N: 4092588 E: 467721, altitude 240 m).
A two-year trial (2005/2006 and 2006/2007) was carried out to appraise the plant performances of 2 onion genotypes (Bianca di Maggio (V1) and Bianca Calda di Comiso (L1)), 4 different doses of nitrogen (0, 80, 160, and 220 kg ha−1) applied in the form of ammonium nitrate, and 2 different planting dates, namely, early (8 October 2005 and 9 October 2006) and traditional (27 December 2005 and 30 December 2006). A split-split-plot experimental design was adopted (year × genotype × planting date × N dose) with plots of 1.6 × 6.0 m.
The V1 genotype is a commercial accession (patented by Isi Sementi) and characterized by a medium-early maturity cycle. It has a flat, medium-large bulb with white flesh. The L1 genotype, however, is a Sicilian onion landrace, also with a medium-early maturity cycle but with a medium-large, round bulb and white flesh. The soil analysis was carried out at the laboratory of the Department of Agricultural, Food and Forestry Sciences; the soil was classified as medium texture (14.8% sand, 37% clay, 48.2% loam) with a pH of 8.0, electrical conductivity of 0.32 dS m−1, organic matter content of 27.6 g kg−1, N content of 1.7 g kg−1, P of 3 mg kg−1, and K of 235 mg kg−1 (USDA classification: Typic Calcixerolls fine, mixed, thermic).
Data on average maximum and minimum temperature (°C) and rainfall (mm) were obtained from a meteorological station of the Agro-Meteorological Information Service of the Sicilian government [23], situated a few kilometers from the experimental field. The station was equipped with an MTX datalogger (model WST1800), an MTX temperature sensor (model TAM platinum PT100 thermo-resistance with anti-radiation screen), and an MTX rainfall sensor (model PPR with a tipping bucket rain gauge).

2.2. Agronomic Management

Sowing was carried out with a pneumatic seeder on 8 October 2005 for the early planting date (PD 1) and 27 December 2005 for the traditional planting date (PD 2), with a density layout of 40 plants m−2 (25 cm interrow and 10 cm on-row spacing). In 2006, sowing was carried using the same layout on 9 October (early planting) and 30 December (traditional planting).
In mid-September of the first year and during the first 10 days of October of the second year, regarding early planting, fertilizer application was carried out at the same time as tillage. Sixty-six kg ha−1 of P2O5 and forty-eight kg ha−1 of K2O were applied together with fifty-five kg ha−1 of nitrogen for those tests involving nitrogen fertilizer; for treatments without nitrogen fertilization, only 66 kg ha−1 of P2O5 and 48 kg ha−1 of K2O were applied. These latter applications were carried out mid-December for the traditional planting date both in the first and the second year. Furthermore, the dose of 80 kg ha−1 of nitrogen was supplied via one fertilization, the dose of 160 kg ha−1 via two fertilizations, and the dose of 220 kg ha−1 via three fertilizations.
In both years, the previous crop was durum wheat.
Irrigation management consisted in the replacement of evapotranspiration, considering actual rainfall levels in both years over the entire biological cycle; the irrigation was carried out using a hose reel sprinkler. The monthly average trend of the daily potential evapotranspiration during the two years of cultivation is reported in Figure S1. Plants were not affected by any disease and pest attacks. Thus, no chemical plant protections were applied.

2.3. Onion Production Traits

At 250 days after transplanting for the early planting date and 180 days after transplanting for the traditional planting date, plants were harvested (at the commercial maturity stage). Immediately after harvest, the number of bulbs, yield of bulbs, and average bulb weight were recorded. The dry weight percentage was also calculated. Furthermore, the length of the growth cycle was measured. Yield was divided into marketable yield (diameter > 40 mm and no defects) and unmarketable yield (diameter < 40 mm, decayed or split bulbs). The scale content, bulb firmness, and number of fleshy leaves were also observed. The bulbs were cut perpendicular to the main axis to enable the number of scales to be counted; the average was calculated from the total number obtained. The firmness of the bulb was measured at 3 points along the equatorial axis using an electronic penetrometer (penetrometer Tr® mod. 53205, Forli, Italy; provided by an 8 mm cylindrical plunger).

2.4. Nitrogen Agronomic Efficiency (NAE)

NAE was determined for each treatment using the following formula [24]:
T Y T Y 0 N
where TY is the total yield for each treatment, TY0 is the control yield (unfertilized), and N is the different levels of nitrogen application.

2.5. Economic Analysis

Cost–benefit analysis was conducted according to the methodology reported by CYMMIT [25] to find out the most advantageous combination of factors in economic terms for each test treatment.
As the test plot was small and more precision and care were given to harvesting compared to normal harvesting conditions, the marketable yield used to calculate the gross return was reduced by 10%, thereby obtaining an adjusted yield. In order to calculate the obtainable gross benefit for each test treatment, average monthly prices at the source (farm gate), referring to 2021, were obtained from Ismea Mercati [26] for white onions, equal to 0.40 EUR kg−1. Adjusted marketable yields were multiplied by the average price per kilo to obtain the obtainable gross benefit from the field. Variable costs were then subtracted from these results to obtain the cost–benefit analysis results. Variable costs included nitrogen fertilizer costs and costs sustained from its application. The nitrogen fertilization was carried out manually. Other costs (tillage, planting, weeding, harvesting) did not differ between treatments and accessions and, therefore, were not considered as variable costs. Furthermore, other costs considered fixed and constant for all treatments were not taken into consideration either. The cost per kilogram to purchase ammonium nitrate was calculated as EUR 0.30 [27], and the hourly cost for labor for fertilizer application as EUR 10 [28].
The marginal rate of return (MRR) was also calculated for the treatments. Methods entailed the ranking of treatments in order from the lowest to the highest cost to determine the most advantageous treatment for farmers. Only undominated treatments were taken into consideration, that is, those treatments in which the net benefit was greater than the next lowest cost treatment, distinguishing between the two cultivation years and the two accessions. Dominated treatments were excluded from the MRR analysis (or rather those treatments for which the net benefit obtained was lower than the next lowest cost treatment), together with treatments with no fertilizer application [25].

2.6. Statistical Analysis

Statistical analysis was carried out using MINITAB 20 for Windows. Data were compared by applying analysis of variance (ANOVA). Tukey’s test was used for comparisons of means. Before proceeding with the statistical analysis, percentages were normalized using angular transformation. Economic analysis and MRR analysis were carried out through data analysis using Excel, Office 365.

3. Results

3.1. Rainfall and Air Temperature Trends at the Experimental Site

Rainfall and air temperature trends at the test site are shown in Supplementary Figures S2 and S3. Over the two cultivation years, annual rainfall levels typical for the test site were found to be 501 mm for the agricultural year 2005/2006, and 462 mm for the agricultural year 2006/2007, with considerable differences in the distribution over the course of the year. Rainfall in the first year (2005/2006) was concentrated in the autumn and winter months (October to February), with peaks during the first 10-day period of October and the first 10-day period of December. During those same months in the second agricultural year, rainfall was lower, with very little rainfall during the months of January and February. Further differences were found in the spring months; during the first year, from the end of February to harvest, rainfall was very low (26 mm for the entire period), whereas the same period in the agricultural year 2006/2007 received over 40% (190 mm) of the rainfall for the entire year, peaking during the last 10-day period of February. Temperature trends were consistent with those of the experimental site, as show in Figures S2 and S3. During the second year (2006/2007), maximum and minimum temperatures of January, February, and March were higher than the previous year (2005–2006).

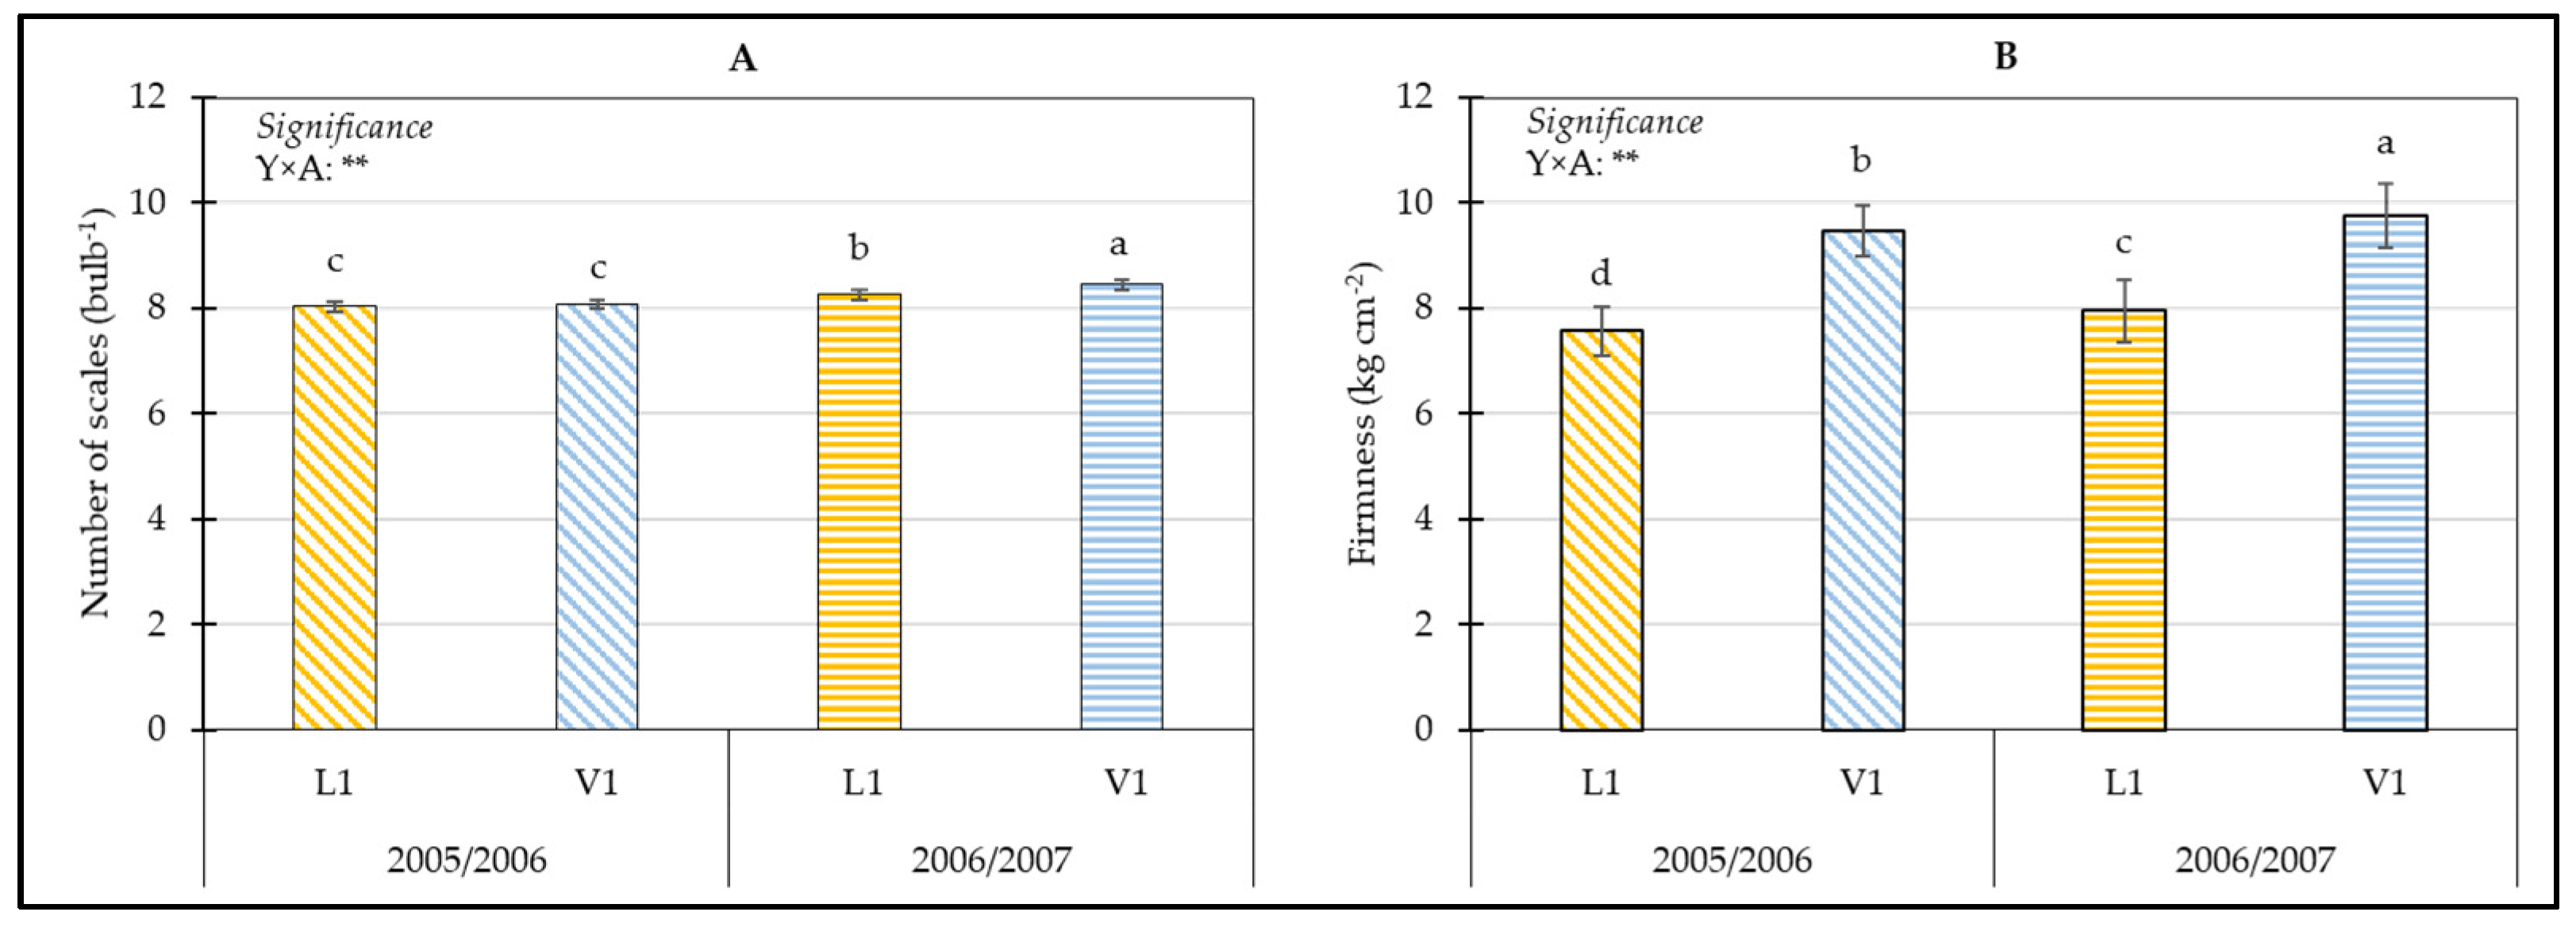
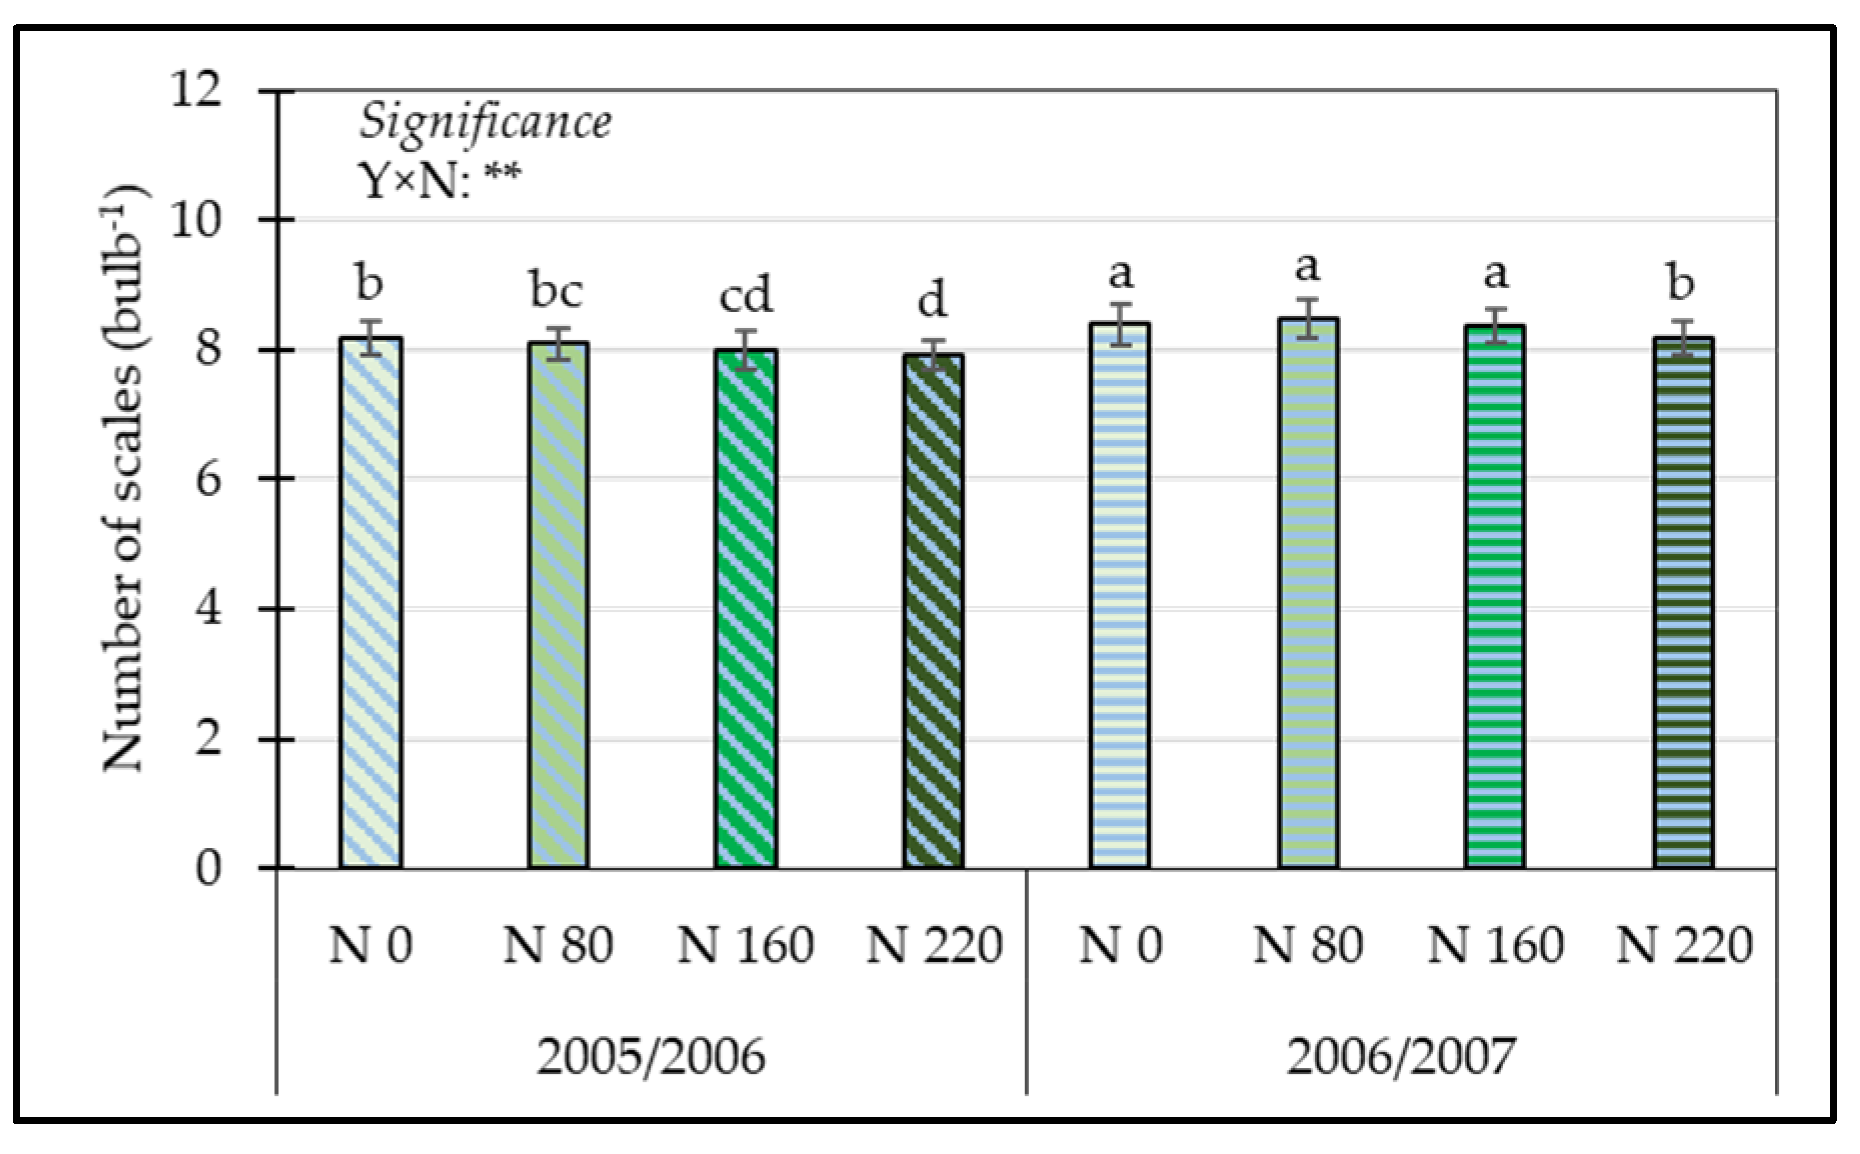
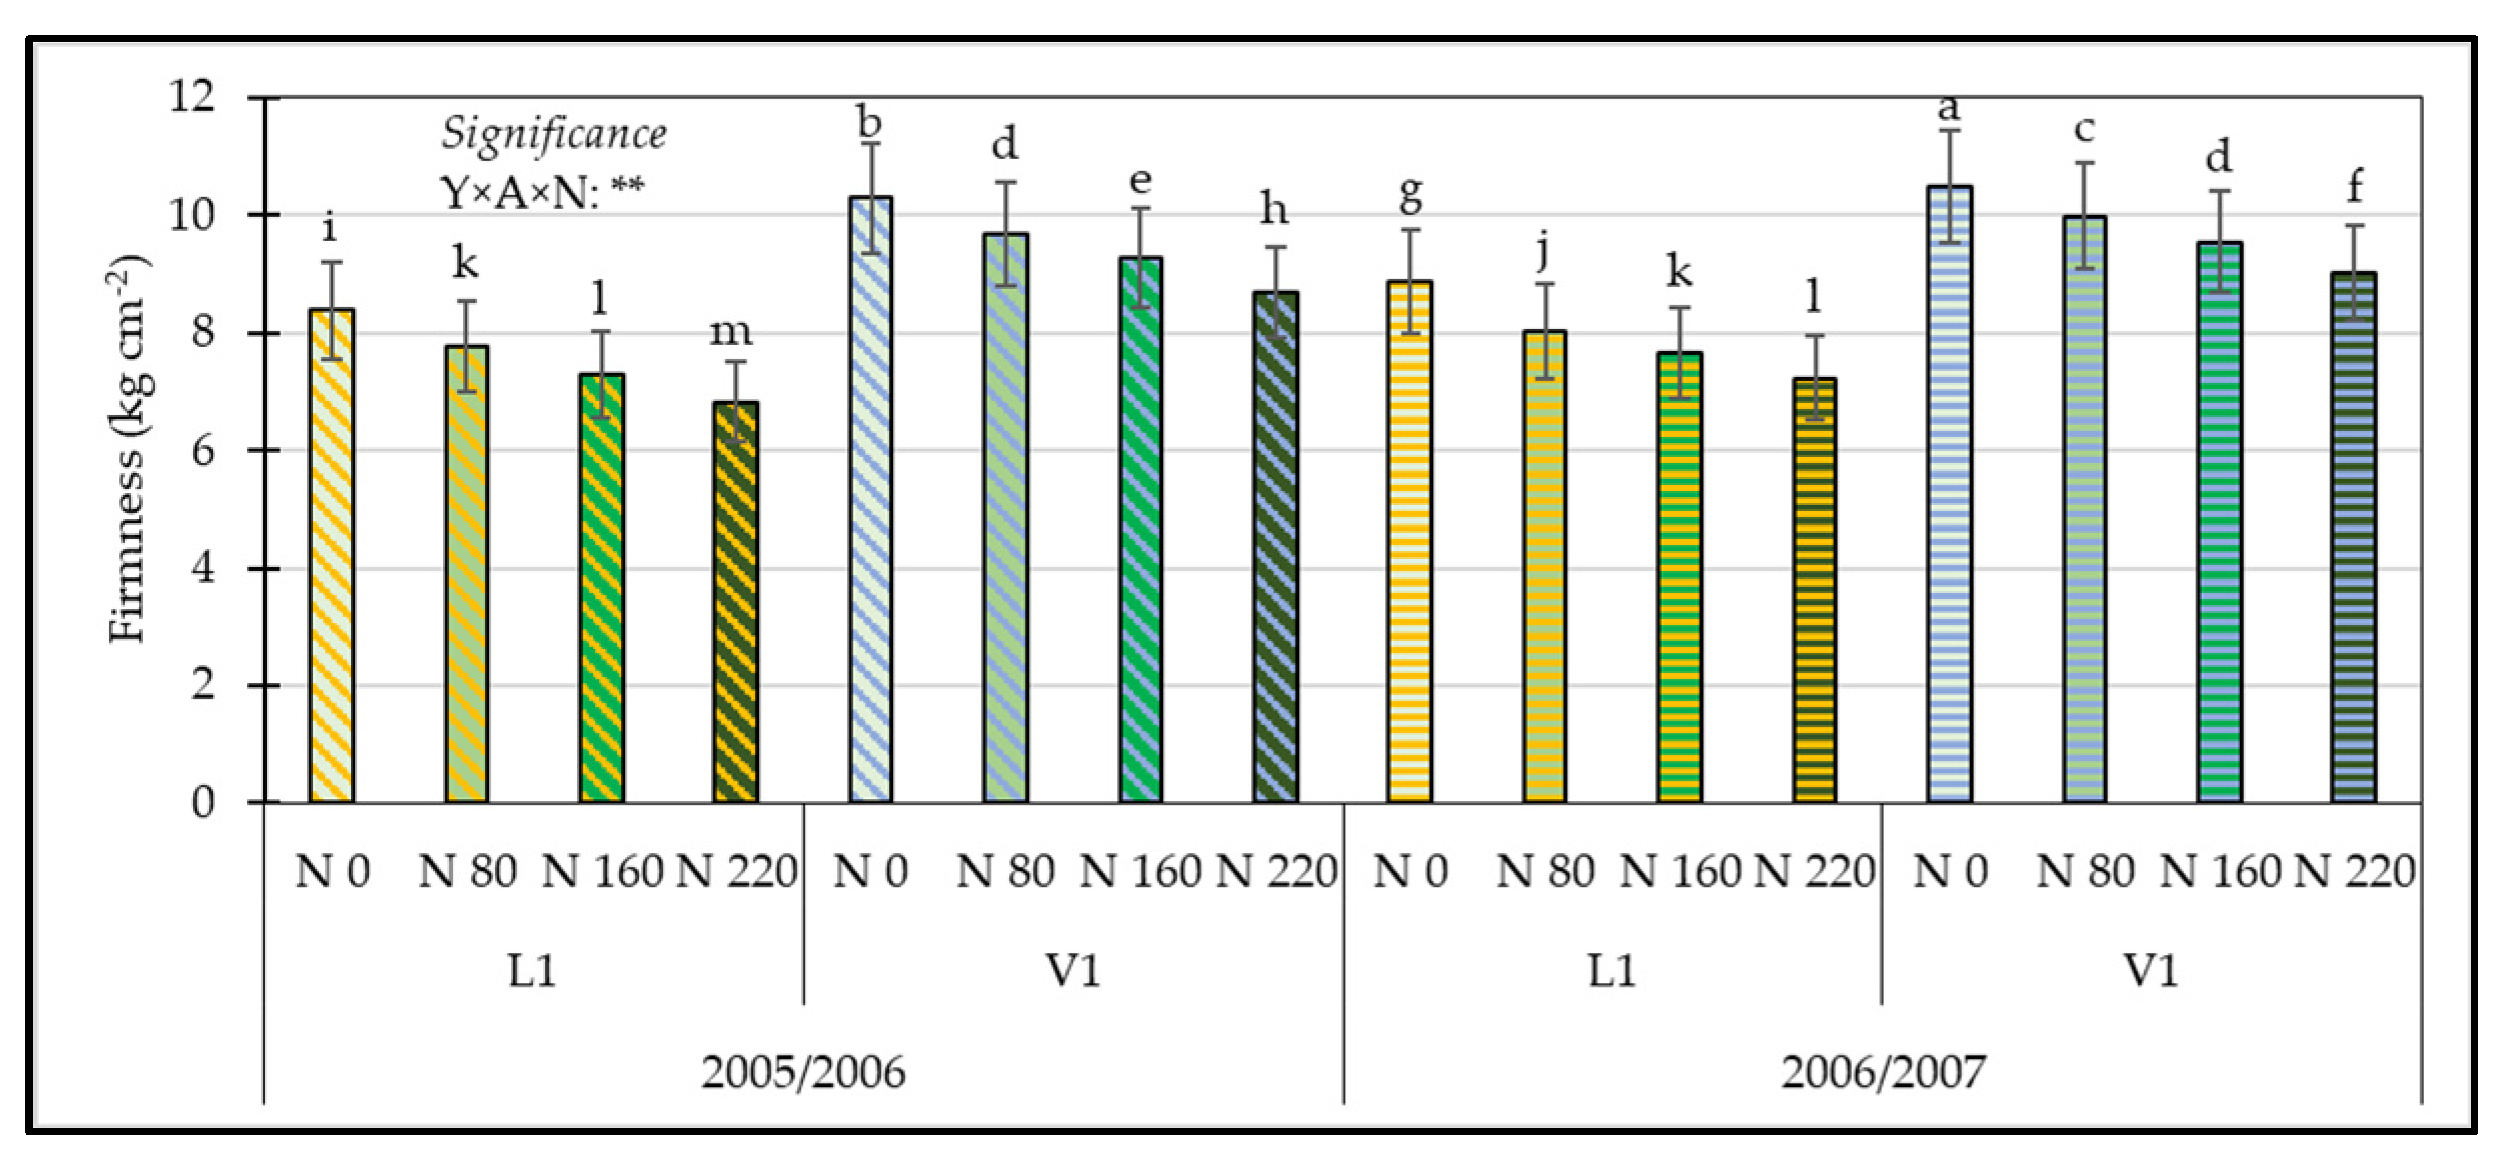
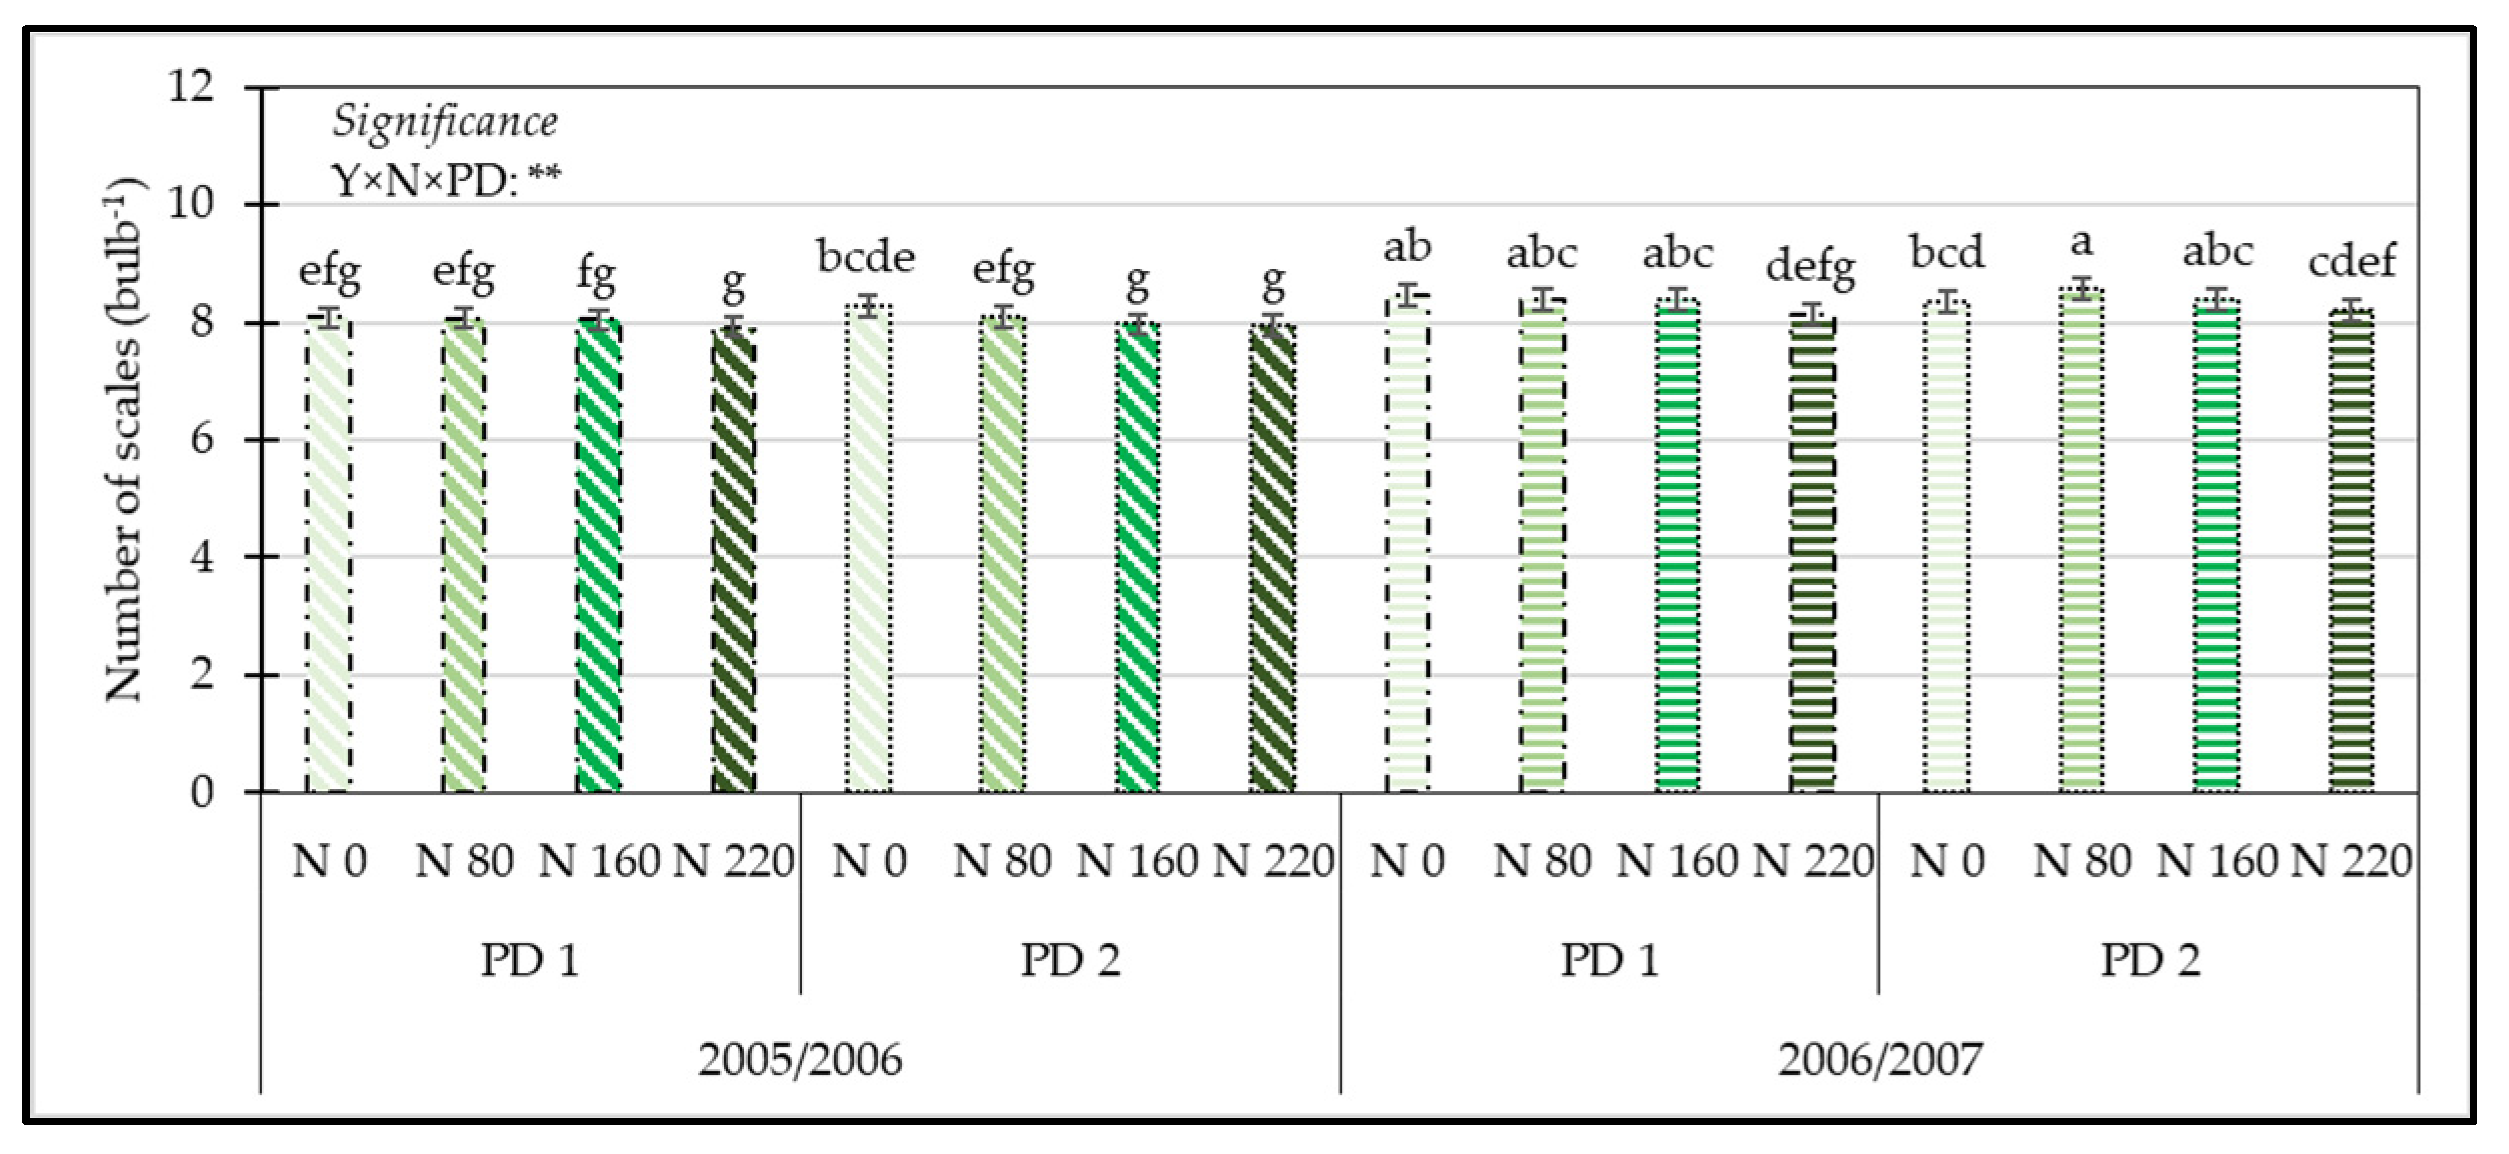
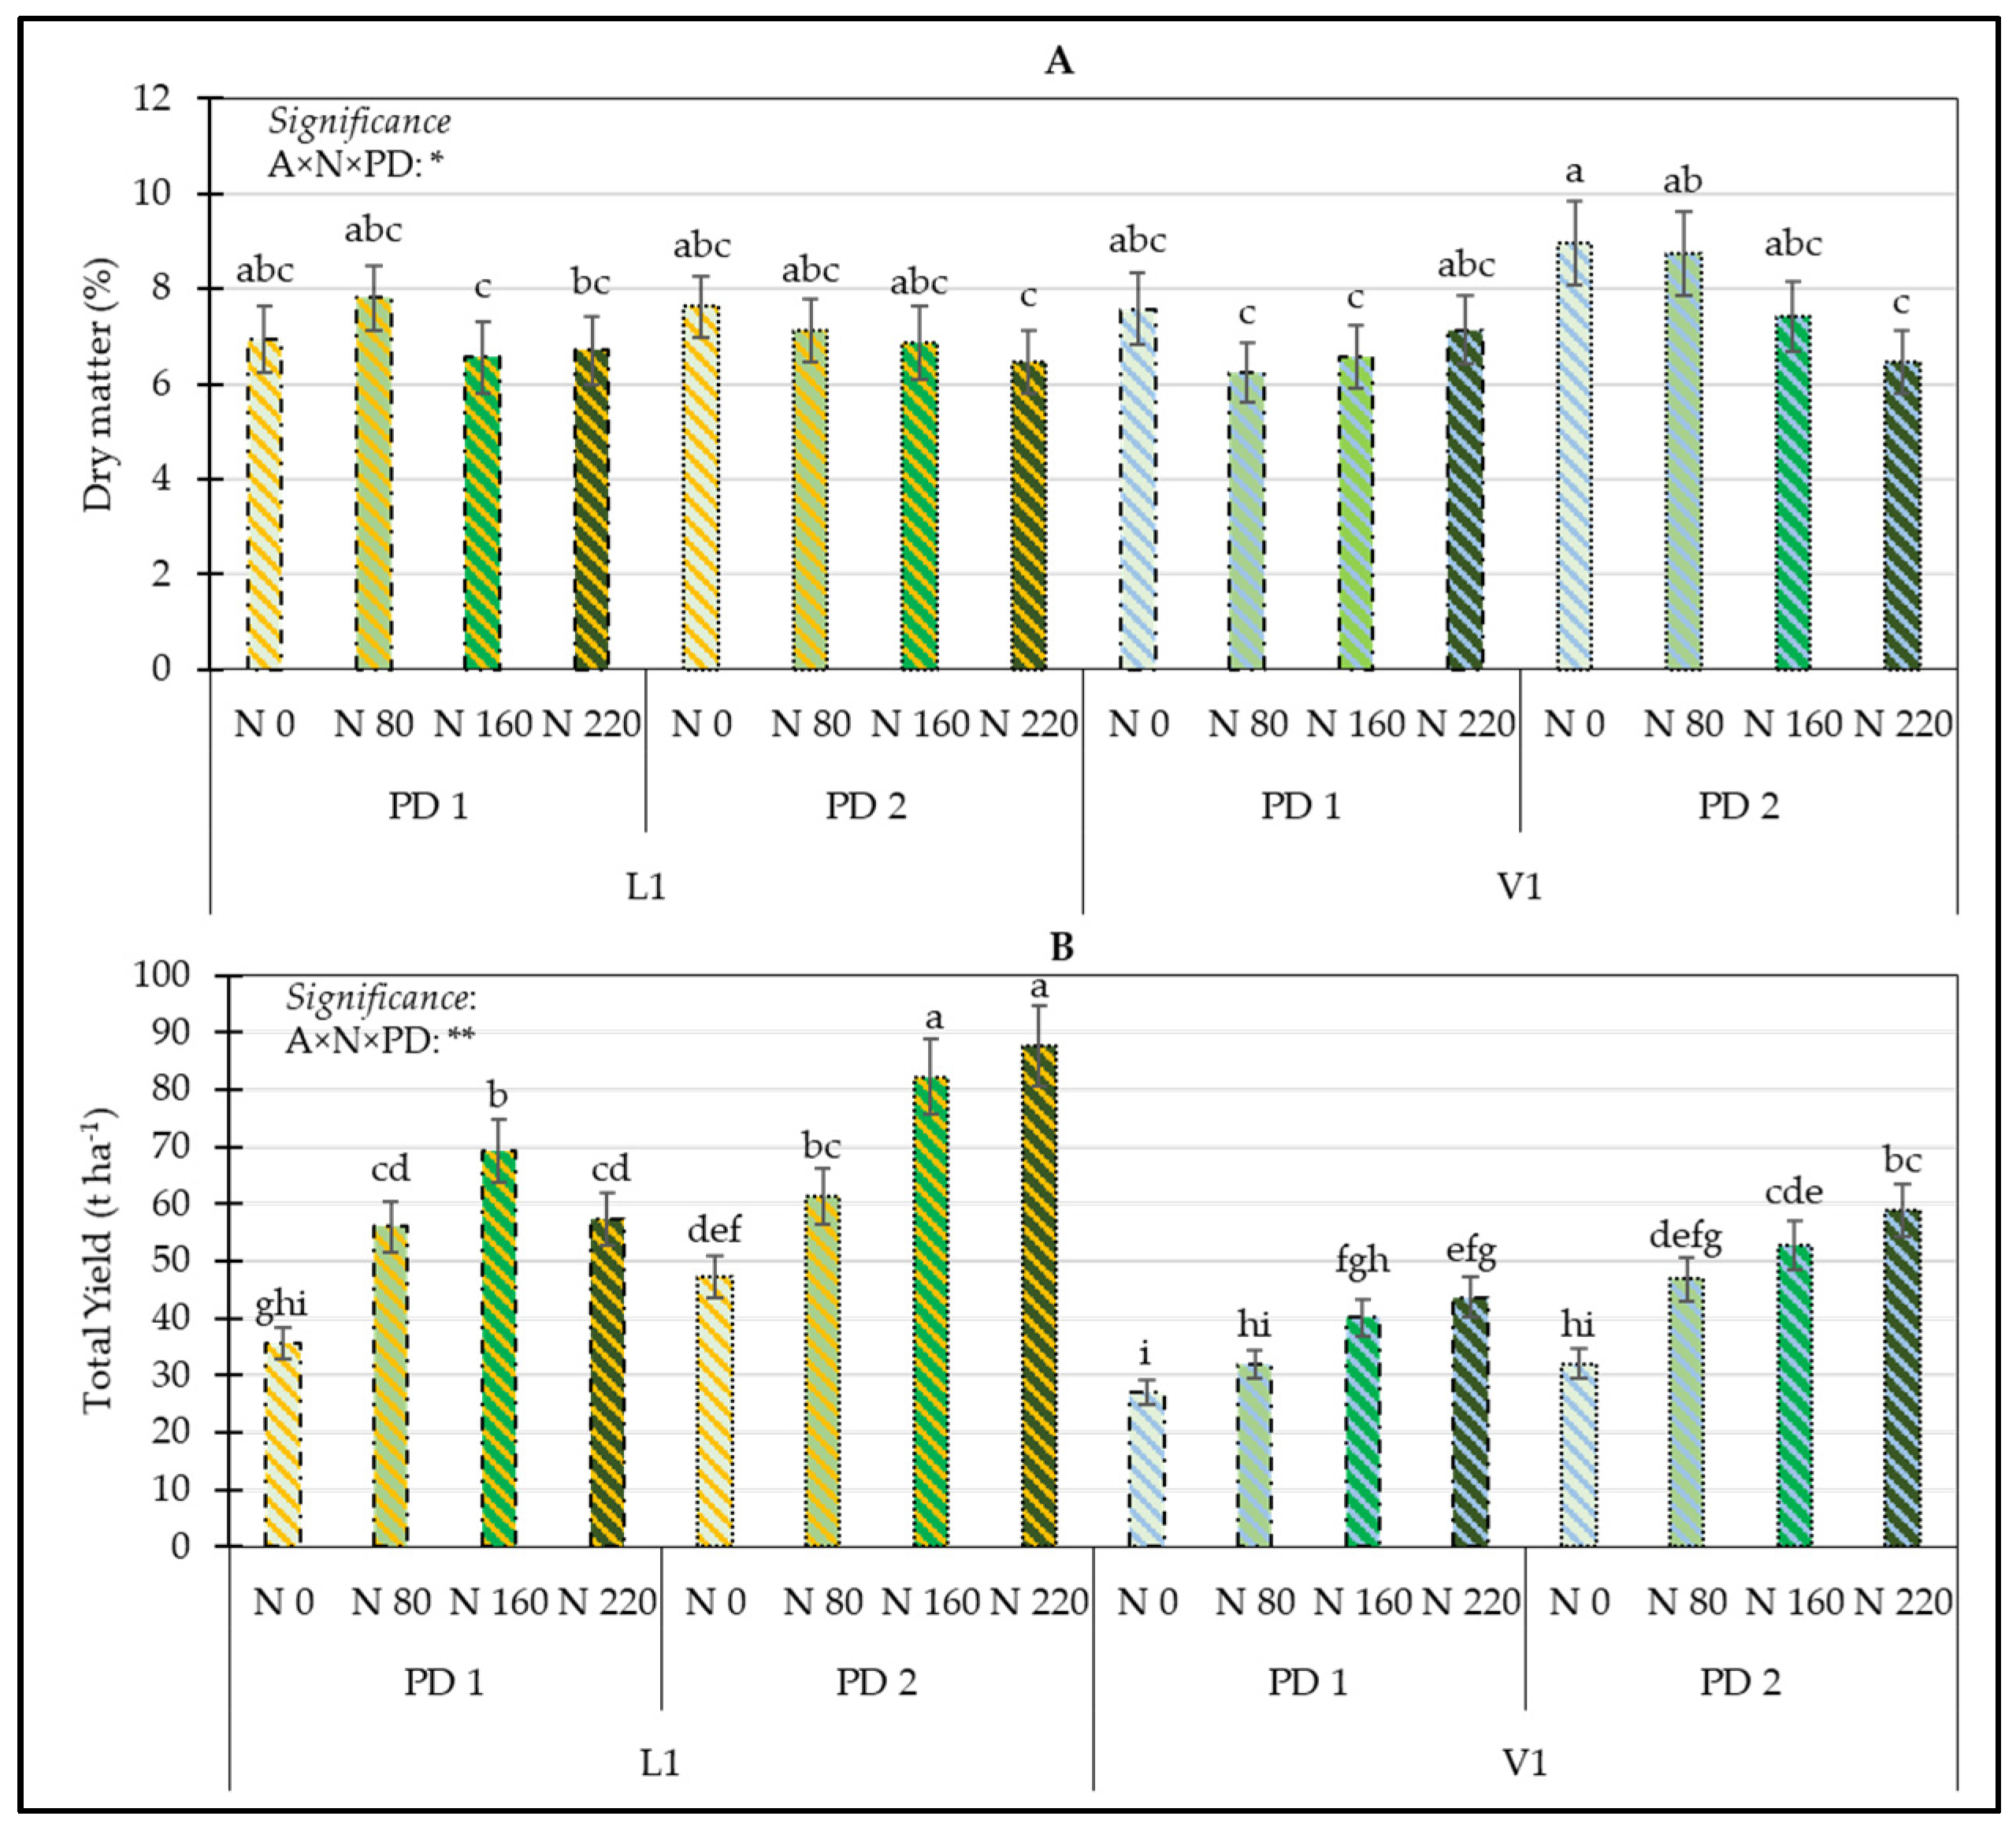
3.2. Yield and Yield-Related Traits
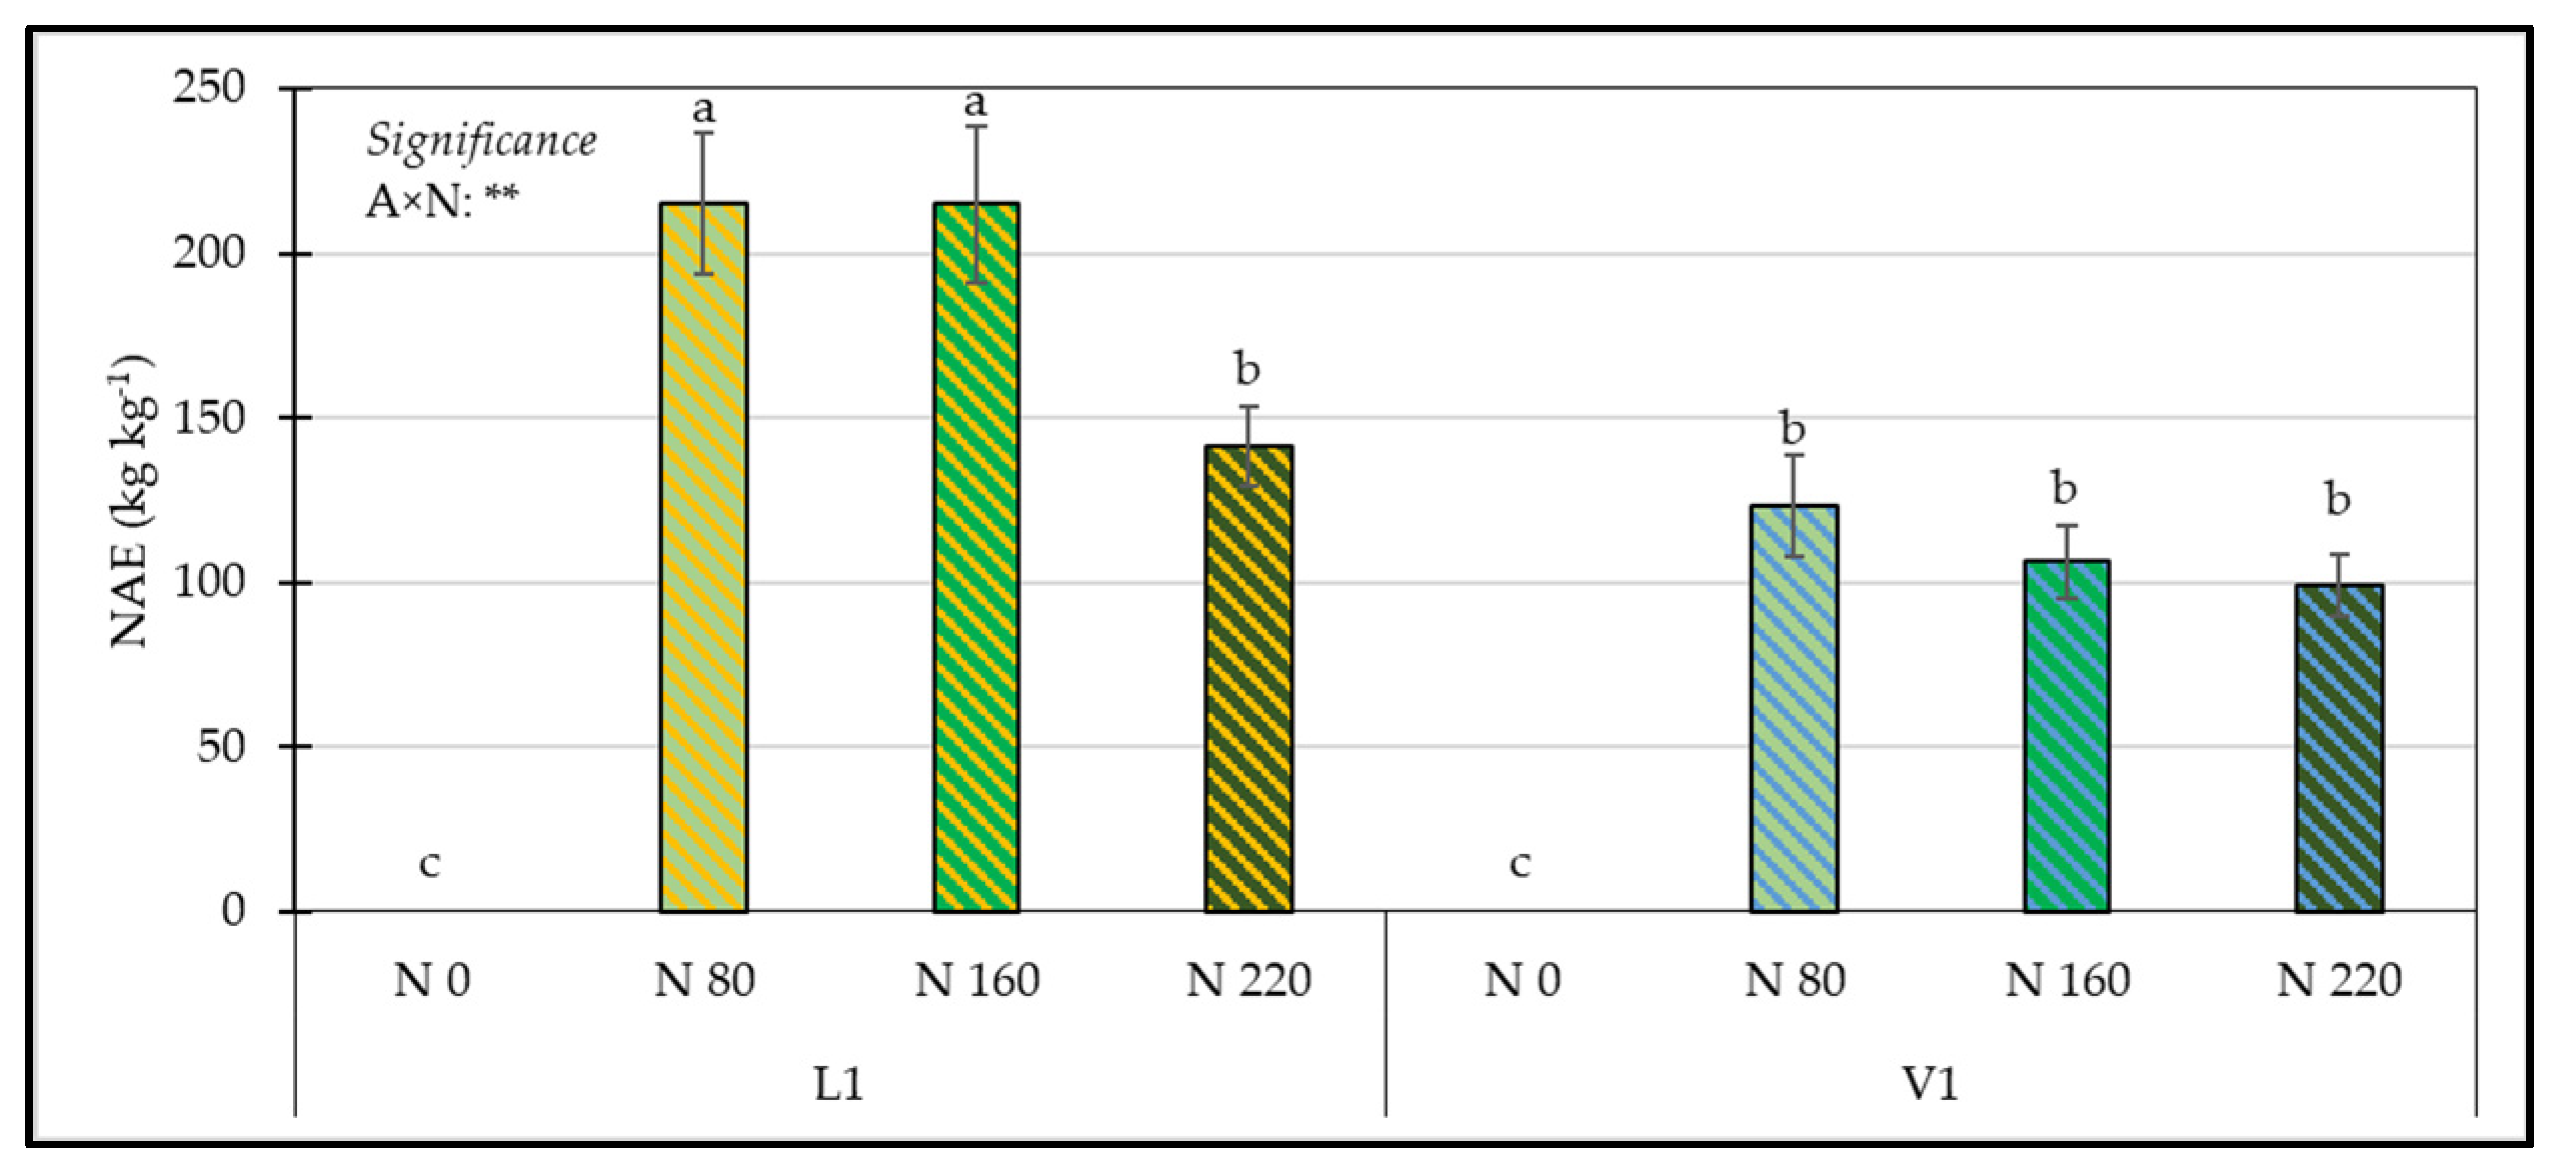
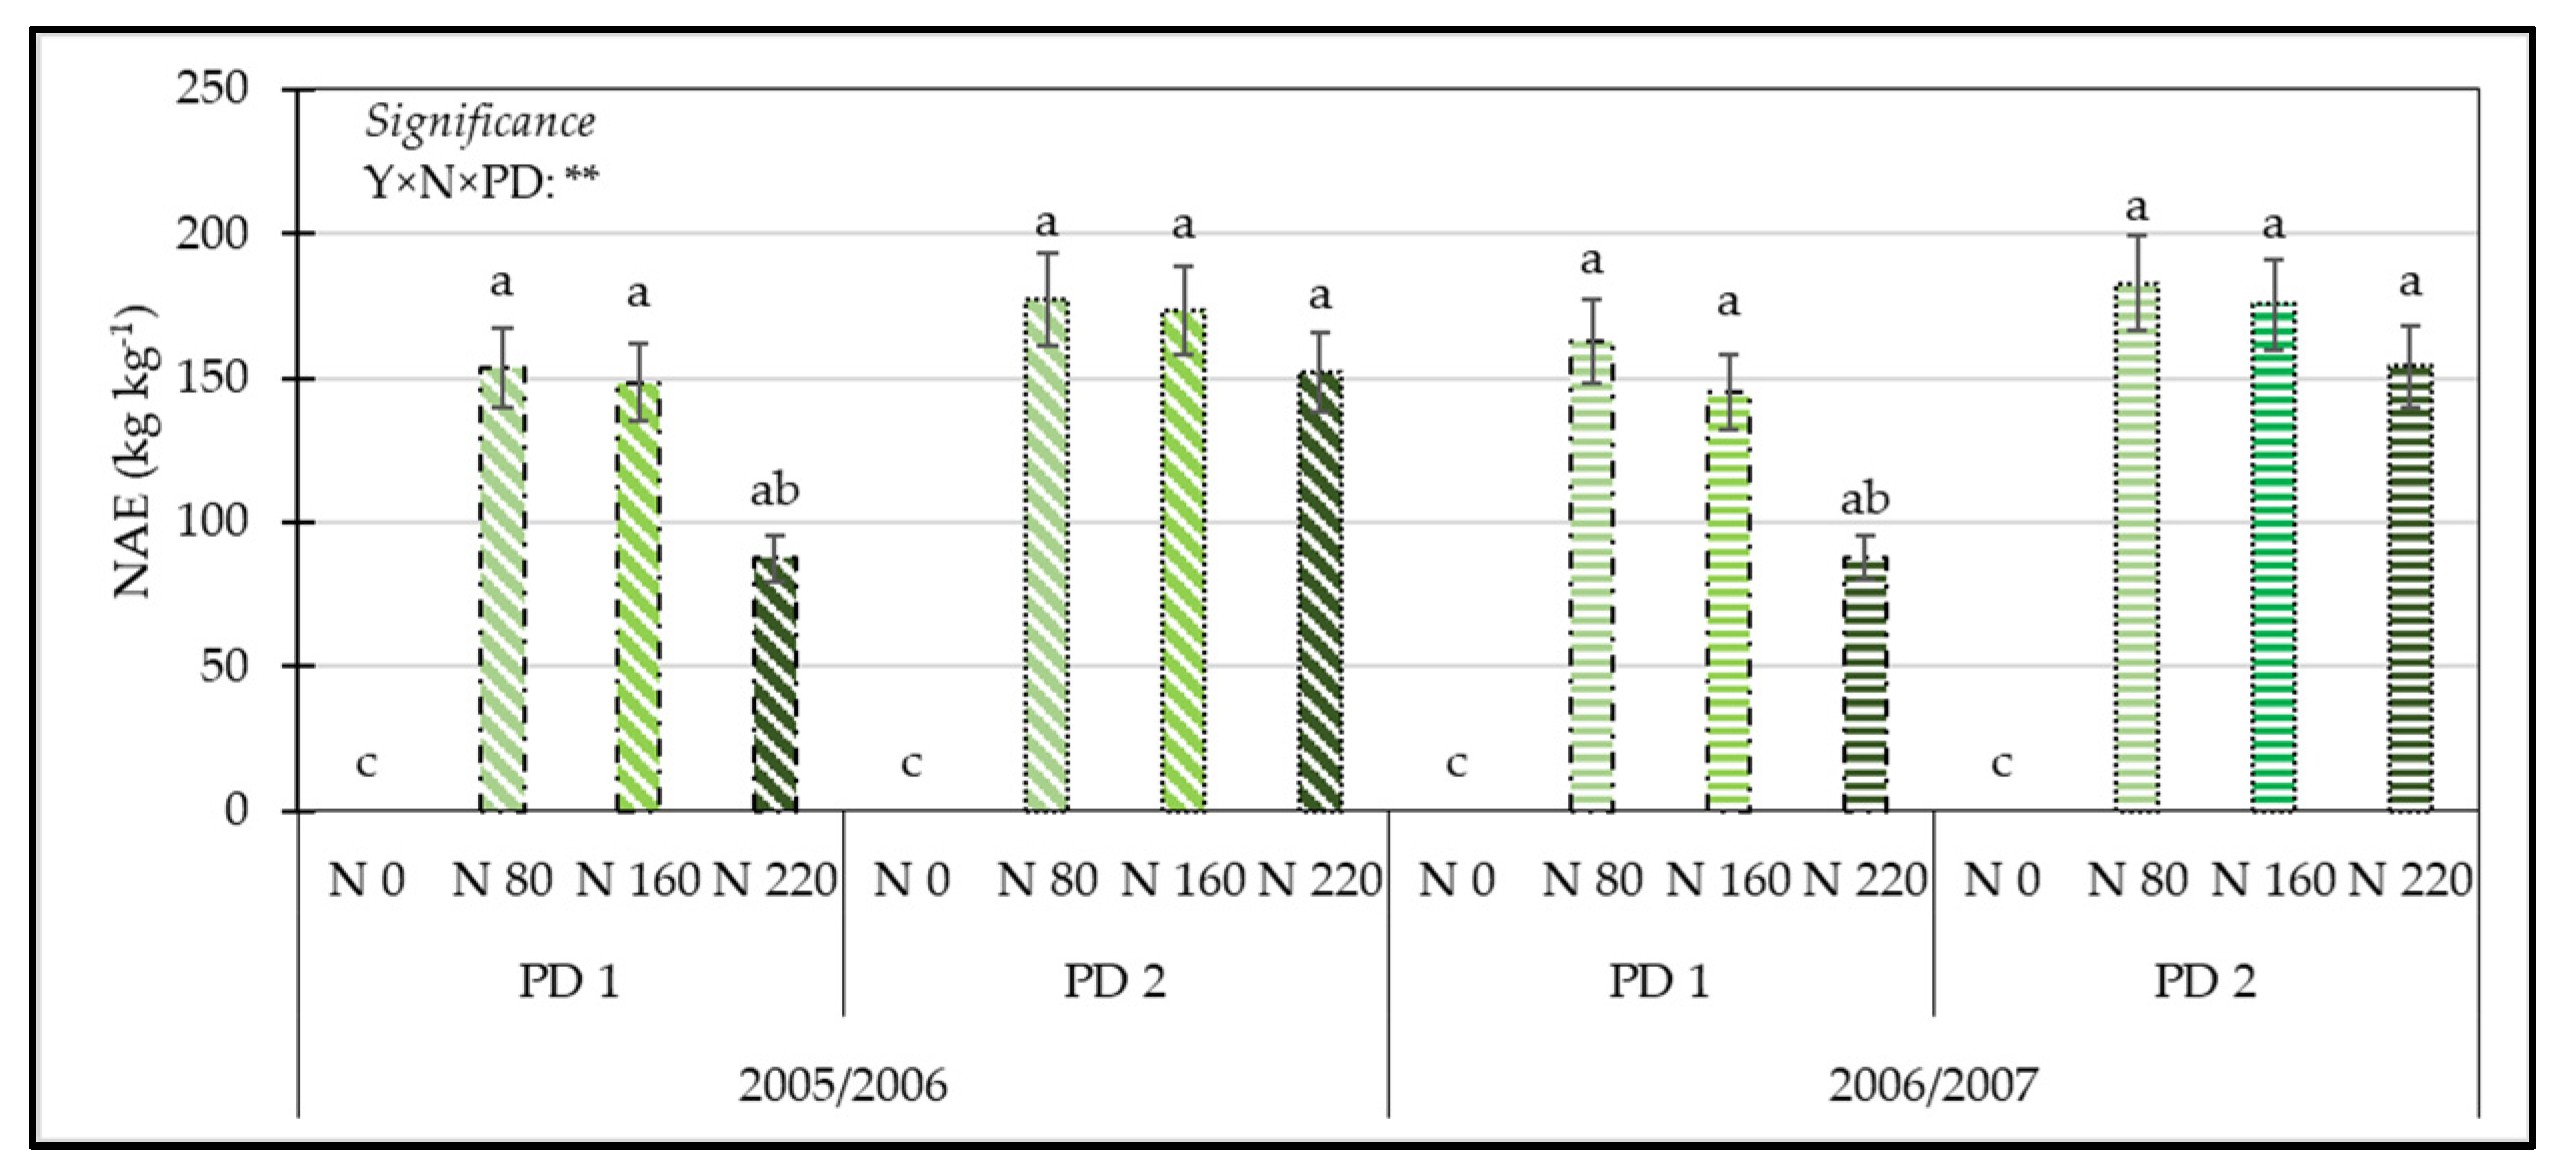
Analysis of variance showed that the cultivation year did not significantly affect production parameters and yield but caused significant differences (p ≤ 0.05) in the number of scales and bulb firmness (Table S1).
ANOVA showed a significant effect of the accession factor for average bulb weight, total yield, marketable yield, unmarketable yield, double bulbs, waste bulbs, number of scales, and firmness (Table S1).
For dry matter, number of bulbs per unit area, total yield, marketable yield, days from sowing to harvest, number of scales, and firmness, ANOVA revealed a significant effect of the planting date (Table S1).
Furthermore, nitrogen significantly influenced dry matter, average bulb weight, number of bulbs per unit area, total yield, marketable yield, unmarketable yield, number of scales, and firmness (Table S1).
Regardless of the accession, planting date, and nitrogen dose, onion plants showed a higher number of scales and firmness in the second year (Table 1), whereas ANOVA and means seperation did not show a significant influence of the year for the other observed traits (Table 1).
Regardless of the year, planting date, and nitrogen dose, the accession did not significantly affect dry matter, number of bulbs per unit area, and days from sowing to harvest. Contrariwise, the L1 accession showed a higher average bulb weight than the V1 accession (Table 1).
The data on total yield, marketable yield, and unmarketable yield follow the trend established for average bulb weight (Table 1).
The V1 accession displayed a higher number of double bulbs than the L1 accession (Table 1). The findings on waste bulbs, number of scales, and firmness sustain the trend described for double bulbs (Table 1).
Regardless of the year, accession, and nitrogen dose, PD 2 increased dry matter, number of bulbs per unit area, total yield, marketable yield, and number of scales compared with PD 1 (Table 1), whereas PD 1 significantly improved days from sowing to harvest and firmnesss compared with PD 2.
Irrespective of the year, accession, and planting date, the N 0 level showed the highest dry matter percentage, while N 160 and N 220 showed the lowest. However, bulbs from plots treated with N 80 did not show any difference from bulbs from N 0 plots or from those from N 160 and N 220 plots (Table 1).
Bulbs fertilized with 160 kg N ha−1 revealed the highest average bulb weight, whereas those from plots fertilized with 80 kg N ha−1 showed the lowest average bulb weight. Bulbs fertilized with 80, 160, or 220 kg N ha−1 had the highest number of bulbs per unit area. Non-fertilized bulbs showed the lowest number of bulbs per unit area (Table 1).
Bulbs from plots fertilized with 160 or 220 kg N ha−1 revealed the highest total yield, followed by those fertigated with 80 kg N ha−1. The lowest total yield was observed in non-fertilized plots (Table 1).
The outcomes on marketable yield and unmarketable yield follow the trend described for total yield. For double bulbs, waste bulbs, and days from sowing to harvest, ANOVA did not show a significant effect on the nitrogen level (Table S1).
Statistical analysis highlighted that non-fertilized bulbs or bulbs fertigated with a dosage of 80 kg N ha−1 had the highest number of scales. The lowest number of scales was observed in bulbs grown with 220 kg N ha−1 (Table 1).
Non-fertilized bulbs showed the highest firmness values followed by those fertigated with a mild nitrogen dose (80 kg ha−1), whereas the lowest firmness was measured in bulbs fertilized with the highest dose of nitrogen (Table 1).
ANOVA for the number of fleshy leaves and firmness showed a significant effect of the interaction year × accession (Table S1); the highest number of scales was observed in the 2006/2007 × V1 combination, followed by the 2006/2007 × L1 combination. The lowest number of scales was recorded in the L1 and V1 accessions cultivated during the first year (Figure 1A). The highest bulb firmness was measured in the V1 accession from the second year of cultivation (2006/2007), followed by V1 bulbs from the first year (2005/2006), which also showed higher firmness values than the L1 accession from the second year of cultivation. The lowest bulb firmness was recorded in the L1 accession grown during the first year (Figure 1B).
For the number of scales, ANOVA showed a significant effect of the interaction between year and nitrogen dose (Table S1). The highest number of scales for bulbs was collected from plots fertilized with 0, 80, and 160 kg N ha−1 during the second year of cultivation, whereas the lowest number of scales was observed in bulbs from the first year of cultivation and fertilized with the highest nitrogen dose (Figure 2).
ANOVA showed a significant effect of the interaction A × N for the total yield, marketable yield, unmarketable yield, and firmness (Table S1). The highest total yield was recorded in the L1 accession fertilized with the highest N doses (160 or 220 kg ha−1). The lowest total yield was observed in the non-nitrogen-fertilized V1 accession (Table 2). The data on the marketable yield support the trend established for the total yield (Table 2). The L1 accession fertilized with 80, 160, or 220 kg N ha−1 had the highest unmarketable yield, whereas the V1 × N 0 combination showed the lowest unmarketable yield (Table 2). The non-nitrogen-fertilized V1 accession had the highest firmness, followed by the V1 × N 80 combination. Bulbs belonging to the L1 accession and fertilized with the highest nitrogen dose showed the lowest firmness (Table 2).
ANOVA for the dry matter percentage, average bulb weight, number of bulbs per unit area, number of scales, and firmness displayed a significant effect of the interaction between accession and planting date (Table S1). The highest bulb dry matter percentage was recorded in plants belonging to the V1 × PD 2 combination. The lowest dry matter percentage was observed in onion bulbs from PD 1 (Table 3). The highest average bulb weight was recorded in the L1 accession from the early planting period, followed by the L1 accession from the traditional planting period (PD 2); the combination V1 × PD 2 had the lowest average bulb weight (Table 3). The L1 accession planted in the traditional period displayed the highest number of bulbs per unit area, while the L1 accession planted early showed the lowest values (Table 3). The L1 × PD 2, V1 × PD 1, and V1 × PD 2 combinations displayed the highest number of scales, whereas the L1 × PD 1 combination had the lowest (Table 3). Bulbs belonging to the V1 accession planted in the early period had the highest firmness followed by those planted in the traditional period (Table 3).
ANOVA for the total yield, marketable yield, unmarketable yield, and firmness showed a significant influence of the interaction N × PD (Table S1). Bulbs planted during PD 2 and fertilized with the highest nitrogen dose showed the highest total yield, whereas bulbs planted during the early planting period and non-fertilized with nitrogen showed the lowest total yield (Table 4). The PD 2 × N 220 combination had the highest marketable yield, followed by the PD 2 × N 160 combination; the lowest marketable yield was recorded from plots planted during the early period and non-fertilized with nitrogen (Table 4). The PD 1 × N 160, PD 1 × N 220, and PD 2 × N 160 combinations showed the highest unmarketable yield, whereas bulbs non-fertilized with nitrogen revealed the lowest values (Table 4). Bulbs from plots planted early and non-fertilized with nitrogen had the highest firmness, followed by those planted in plots non-fertilized with nitrogen and planted early. The lowest firmness values were recorded in bulbs from the PD 2 × N 220 combination (Table 4).
For firmness, ANOVA showed a significant effect of the interaction Y × A × N (Table S1). The highest bulb firmness values were collected in the V1 accession from non-nitrogen-fertilized plots, cultivated in the second year, followed by those grown during the first year. The lowest firmness was recorded in the L1 accession supplied with 220 kg N ha−1, cultivated during the first year (Figure 3).
As regards the number of scales, statistical analysis displayed a significant effect of the interaction Y × N × PD (Table S1). The highest number of scales per bulb was exhibited in onions grown during the second cultivation year, in the traditional planting period, and with a mild nitrogen supply (80 kg ha−1); the lowest number of scales was recorded in bulbs from plots fertilized with 220 kg N ha−1 planted during the early period and cultivated in the first year, or in bulbs from plots fertilized with 160 or 220 kg N ha−1 planted during the traditional period and cultivated during the first year (Figure 4).
For the dry matter percentage and total yield, ANOVA showed a significant influence of the interaction A × N × PD (Table S1). The highest dry matter percentage was recorded in non-fertilized plots, PD 2, and the V1 accession. The lowest values were observed in the combinations L1 × PD 1 × N 160, L1 × PD 1 × N 220, V1 × PD 1 × N 80, V1 × PD 1 × N 160, and V1 × PD 2 × N 220 (Figure 5A). The highest total yield values were linked with the L1 accession planted during the traditional period and fertilized with 160 or 220 kg N ha−1, whereas the lowest total yield was shown by the V1 accession planted in the early period and non-fertilized with nitrogen (Figure 5B).

3.3. NAE

Analysis of variance showed that the cultivation year did not significantly affect the nitrogen agronomic efficiency (NAE) (Table S1). Statistical analysis revealed a significant effect of accession; the L1 accession displayed a higher NAE than the V1 accession (Table 5).
ANOVA revealed a significant effect of the planting date (Table S1). The highest NAE was observed in onions planted in the traditional period (PD 2) (Table 5).
Furthermore, N significantly influenced the NAE (Table S1); for the plots non-fertilized with N, the NAE was 0. Bulbs from plots fertilized with 80 or 160 kg N ha−1 revealed the highest NAE, followed by those fertilized with 220 kg N ha−1 (Table 5).
ANOVA showed a significant effect of the interactions A × N and Y × N × PD for the NAE; the other interaction did not significantly affect the NAE (Table S1).
For the interaction A × N, the highest NAE was observed in the L1 accession fertilized with 80 or 160 kg N ha−1; the lowest values were observed in the combinations L1 × N 220, V1 × N 80, V1 × N 160, and V1 × N 220 (Figure 6).
For the interaction Y × N × PD, excluding onions cultivated without N fertilization, the lowest values for the NAE were observed, in both years, in onions planted early and fertilized with 220 kg N ha−1 (Figure 7).

3.4. Cost–Benefit Analysis

Cost–benefit analysis, expressed as an average of the two agricultural years, showed that the highest net benefit of EUR 21,746 was obtained by applying a N dose of 220 kg ha−1 for the L1 accession. The lowest net benefit of EUR 6139 was obtained for the V1 accession with a nitrogen application of 80 kg ha−1 (Table 6).
After carrying out dominance analysis, we found that 5 of the 16 treatments dominated. Dominant treatments were excluded from the marginal analysis and from the marginal rate of return (MRR) calculations, as were zero-N applications.
In addition to the calculation of the net benefit, it was also necessary to compare additional or marginal costs with additional or marginal benefits. Marginal analysis has the aim of showing how the net benefit generated from an investment varies as the investment increases.
The results of the marginal analysis are shown in Table 7. As dominant treatments were excluded from the analysis, we were able to note that, for both accessions and during both years, marginal rates of return were obtained which were above the minimum rate of 100%, considered as favorable in financial terms.
The highest marginal rate of return of 2016% was obtained for the L1 onions planted on the early planting date with a N dose of 160 kg ha−1. A slightly lower rate of 1938% was found, once again, for the L1 onions planted on the traditional planting date with a N dose of 220 kg ha−1.

4. Discussion

In this study, the variability of production and quality parameters was assessed over two cultivation years for two genotypes of onion subjected to four levels of nitrogen fertilization and planted on two different dates. Furthermore, economic analysis was carried out to determine the most profitable combination of factors for farmers.
Nitrogen fertilization is one of the agronomic techniques that most influences the yields and the quality of agricultural productions; it is important to supply the correct quantities of nitrogen in relation to each type of crop to satisfy nutritional needs and maximize production [29,30,31]. In species that need high amounts of nitrogen such as onions, it is important to maximize the nutrient use efficiency to obtain higher yields and improve crop quality and, at the same time, to avoid nitrogen dispersion in the soil and risks for the ecosystem and human health [31,32,33].
An increase in the total yield per unit area, and consequently the marketable yield per hectare, is correlated with an increase in the size and average weight of bulbs and the number of bulbs per unit area [18]. Differences in these parameters were found as a result of both the accessions and nitrogen levels applied. The size and average bulb weight are greatly influenced by nitrogen fertilizer and by genotype choice and are quality parameters taken into consideration by consumers [12,34]. During the two years of cultivation and taking both accessions into consideration, average yields ranged from values below 30 t ha−1 to above 80 t ha−1 (Table 1, Table 2 and Table 3). This variability in yield and production parameters is linked both to the increasing levels of nitrogen applied, to morphological differences, and to genetic variability between the two accessions, which influences the response to different fertilizer levels. In agreement with Kazimierczak et al. [35] and Gererufael et al. [36], for both accessions, yields increased continuously as higher levels of nitrogen were applied.
The highest total yields and marketable yields were found for the “Bianca Calda di Comiso” onion, a local genotype in which greater nitrogen agronomic efficiency compared to the “Bianca di Maggio” onion was also found. Kazimierczak et al. [35] in Poland obtained yield peaks of over 70 t ha−1 by applying high doses of nitrogen. With greater fertilization levels, Ncayiyana et al. [37] in South Africa and Boyhan et al. [38] in America obtained yields of approximately 50 t ha−1. In Ethiopia, Gererufael et al. [36], by increasing the amount of nitrogen fertilizer and organic matter, obtained yields near to 40 t ha−1. The availability of nitrogen in the soil influences aerial organs, chlorophyll biosynthesis, leaf number, and leaf area [18,39,40]. The increase in the weight of the bulbs, and consequently in the total yields per unit area, is linked to the greater biomass produced in response to the increasing doses of nitrogen [17,36,39].
The greater yields and the differences in the results obtained in this study compared to other authors could be due to the better adaptability of the “Bianca Calda di Comiso” onion to its typical cultivation environment, and to the greater use efficiency of the nitrogen fertilizer. The optimal nitrogen application rate must be established locally, as it depends on the quantity available in the soil, but also on the total yield and the efficiency of use of the fertilizer, parameters directly related to the genetic heritage and the adaptability of the cultivar [39].
Nitrogen is one of the main components of plant tissue, and a good level of nitrogen availability in the soil stimulates root growth and development, and plant growth [41]. The chlorophyll content and the photosynthetic rate are directly related to the mineral content and nitrogen fertilization of vegetables [31,42,43]. The onion is very greedy for nitrogen, and careful management of fertilizer is needed due to the shallow nature of the root system [20] and the risk of nitrogen accumulation both in the soil and the produce [44].
The variability in the biometric and production parameters found in various onion cultivars and accessions which have been the subject of research in various parts of the world is linked to differences in the genetic heritage and environmental factors [45,46]. As noted by a number of authors [47,48,49], the adaptability of cultivars and the different pedoclimatic conditions found at the test sites and in the many regions in the world where onion farming is particularly widespread have significantly affected production and quality results.
Harvesting mature produce was carried out in June in all cases. The early planting date, compared to the more traditional date, led to an earlier harvest of 15 days for “Bianca di Maggio” and 7 days for “Bianca Calda di Comiso”. The length of the onion’s growth cycle in this study was not influenced by nitrogen application; the results of this work are not in agreement with Gererufael et al. [36] and Tekeste et al. [50], who found an increase in the growth cycle by applying greater doses of nitrogen. This is likely to be due to agronomic management, which included a break in irrigation in the study treatments towards the end of the biological cycle.
Regarding dry matter, the significant differences found were mainly due to the planting date and the nitrogen dose applied. The results of this study agree with those obtained by Ncayiyana et al. [37], who found a decrease in the dry matter percent with increases in the N dosage in their study. In contrast, Gererufael et al. [36] found an increase in the dry matter content as the N dose increased. Furthermore, Ncayiyana et al. [37], Mogren et al. [13], and Lee et al. [48] found significant differences in the percentage of dry matter in various cultivars of onion.
Mallor Giménez et al. [47] and Larsen et al. [51] reported that bulb firmness is notably influenced by genotypical differences, as well as by nitrogen fertilization. In the “Bianca di Maggio”, firmness values were consistently higher than in the “Bianca Calda di Comiso”; furthermore, in agreement with Charron et al. [52]—for both accessions—a decrease in bulb firmness was found as nitrogen levels were increased. Randle [53] found similar results during the cultivation of onion using hydroponics, when increasing the nitrogen content in the nutrient solution. The bulb firmness is related to the dry matter content [54]. Increasing doses of nitrogen have been shown to cause a decrease in the percentage of dry matter; the absorption of calcium, a fundamental element in the cellular structure, can be limited by nitrogen fertilization and, consequently, can decrease the firmness of bulbs [52].
Furthermore, the number of fleshy scales was also highly affected by genotypical differences [11,54]. Differences were found between the two accessions, according to the results from Bal et al. [55], Petropoulos et al. [11], and Lee et al. [48]. The results from this study agree with those of Sinkovič et al. [56], who found that the average number of fleshy scales was higher for plants not subjected to nitrogen fertilization.
Data analysis showed that the “Bianca Calda di Comiso” landrace, compared to the “Bianca di Maggio” accession, provided greater nitrogen agronomic efficiency (NAE) (Table 5), a property which is also linked to the better yield results obtained by the local genotype. Comparing the results of the data analysis concerning the N dosage, higher NAE values were recorded for N doses of 80 kg ha−1, slightly lower values were recorded for N doses of 160 kg ha−1, and far lower values were recorded for the highest N dose of 220 kg ha−1. Díaz-Pérez et al. [57] and Bavec et al. [58] in onion, Sandoval-Contreras et al. [59] in rice, and Galindo et al. [60] in maize and wheat also found a decrease in NAE values as the N doses increased. The low efficiency of nitrogen use in onions is linked to the reduced development of the root system, and the choice of the optimal application rates must be established in relation to the cultivation area [39]. The better NAE of the local ecotype found in this study once again demonstrates its better ability to adapt and to use crop inputs compared to commercial cultivars.
Regarding the economic analysis (Table 6 and Table 7), the greatest net benefit was found with high-N application treatments, which led to higher marketable yields. This demonstrates that an increase in cultivation inputs, more specifically nitrogen fertilizer applications, ensures greater yields and, therefore, returns for farmers. Economic analysis also showed that the “Bianca Calda di Comiso” onion persistently produced greater net benefits and marginal rates of return due to the distinctly higher marketable yields compared to the “Bianca di Maggio”. In agreement with various authors [27,36,61,62] who carried out economic analysis on onions, the greatest net benefits and marginal rates of return were constantly found with medium- and high-N application coupled with other types of fertilizer.

5. Conclusions

The onion is a widely grown species in the Mediterranean area, and local genotypes are often grown which have adapted perfectly to their cultivation area. In recent years, consumers have been increasingly looking for high-quality produce with information on the origin of the produce. The results of this work show how important it is for farmers to choose genotypes suited to the area of cultivation and to adopt the correct agronomic strategy to maximize quality and profits. Fertilizing the “Bianca Calda di Comiso” with high levels of nitrogen (160 or 220 kg ha−1) allows farmers to obtain a marked increase in yields and profits.
The “Bianca di Maggio” onion is less suited to high levels of fertilizer as yields were found to be lower, even without the application of nitrogen fertilizer, compared to the “Bianca Calda di Comiso”. It is not necessary to exceed 80 kg ha−1 of N to improve yields and obtain good returns for the “Bianca di Maggio”. The optimization of nitrogen doses and the choice of the traditional planting date were found to be a noteworthy strategy to adopt for increasing yields and profits.

Supplementary Materials

The following are available online at https://www.mdpi.com/article/10.3390/horticulturae8050454/s1. Table S1: Significance of ANOVA analysis. Figure S1: Monthly average trend of the daily potential evapotranspiration during the two years of cultivation. Figure S2: Rainfall and air temperature trends during the first year, 2005/2006, at the test site. The dashed lines show the average rainfall and temperature trends in the period between 2002 and 2020. Figure S3: Rainfall and air temperature trends during the second year, 2006/2007, at the test site. The dashed lines show the average rainfall and temperature trends in the period between 2002 and 2020.

Author Contributions

Conceptualization, G.D.M. and S.B.; methodology, S.L.B.; software, D.F.; validation, N.I., B.B.C. and D.F.; formal analysis, G.D.M. and S.B.; investigation, D.F.; resources, G.D.M. and S.B.; data curation, B.B.C.; writing—original draft preparation, D.F.; writing—review and editing, G.D.M., B.B.C. and D.F.; visualization, N.I.; supervision, S.L.B.; project administration, G.D.M.; funding acquisition, G.D.M. All authors have read and agreed to the published version of the manuscript.

Funding

This research received no external funding.

Institutional Review Board Statement

Not applicable.

Data Availability Statement

Data are available by contacting the authors.

Acknowledgments

The authors would like to thank Gateano Randone, Giuseppe Parrino, and Marco Causapruno. A special thanks goes to Lucie Branwen Hornsby for her linguistic assistance.

Conflicts of Interest

The authors declare no conflict of interest.

References

  1. D’Anna, F.; Sabatino, L. Morphological and agronomical characterization of eggplant genetic resources from the Sicily area. J. Food Agric. Environ. 2013, 11, 401–404. [Google Scholar]
  2. Sabatino, L.; Palazzolo, E.; D’Anna, F. Grafting suitability of Sicilian eggplant ecotypes onto Solanum torvum: Fruit composition, production and phenology. J. Food Agric. Environ. 2013, 11, 1195–1200. [Google Scholar]
  3. Sabatino, L.; Iapichino, G.; Vetrano, F.; D’Anna, F. Morphological and agronomical characterisation of Sicilian bottle gourd Lagenaria siceraria (Mol.) Standley. J. Food Agric. Environ. 2014, 12, 587–590. [Google Scholar]
  4. Sabatino, L.; Iapichino, G.; Maggio, A.; D’anna, E.; Bruno, M.; D’Anna, F. Grafting affects yield and phenolic profile of Solanum melongena L. landraces. J. Integr. Agric. 2016, 15, 1017–1024. [Google Scholar] [CrossRef] [Green Version]
  5. Consentino, B.B.; Sabatino, L.; Mauro, R.P.; Nicoletto, C.; De Pasquale, C.; Iapichino, G.; La Bella, S. Seaweed Extract Improves Lagenaria siceraria Young Shoot Production, Mineral Profile and Functional Quality. Horticulturae 2021, 7, 549. [Google Scholar] [CrossRef]
  6. Raimondo, F.M.; Bazan, G.; Troia, A. Taxa a rischio nella flora vascolare della Sicilia. Biogeogr. J. Integr. Biogeogr. 2011, 30, 229–239. [Google Scholar] [CrossRef] [Green Version]
  7. Christenhusz, M.J.M.; Angiosperm Phylogeny Group. An update of the Angiosperm Phylogeny Group classification for the orders and families of flowering plants: APG III. Bot. J. Linn. Soc. 2009, 161, 105–121. [Google Scholar]
  8. Food and Agriculture Organization Faostat. Food and Agriculture Data; Food and Agriculture Organization: Rome, Italy, 2019; Available online: http://www.fao.org/faostat/en/#data (accessed on 10 June 2021).
  9. Marotti, M.; Piccaglia, R. Characterization of flavonoids in different cultivars of onion (Allium cepa L.). J. Food Sci. 2002, 67, 1229–1232. [Google Scholar] [CrossRef]
  10. Teshika, J.D.; Zakariyyah, A.M.; Zaynab, T.; Zengin, G.; Rengasamy, K.R.; Pandian, S.K.; Fawzi, M.M. Traditional and modern uses of onion bulb (Allium cepa L.): A systematic review. Crit. Rev. Food Sci. Nutr. 2019, 59 (Suppl. S1), S39–S70. [Google Scholar] [CrossRef]
  11. Petropoulos, S.A.; Fernandes, Â.; Barros, L.; Ferreira, I.C.; Ntatsi, G. Morphological, nutritional and chemical description of “Vatikiotiko”, an onion local landrace from Greece. Food Chem. 2015, 182, 156–163. [Google Scholar] [CrossRef] [Green Version]
  12. Caruso, G.; Conti, S.; Villari, G.; Borrelli, C.; Melchionna, G.; Minutolo, M.; Russo, G.; Amalfitano, C. Effects of transplanting time and plant density on yield, quality and antioxidant content of onion (Allium cepa L.) in southern Italy. Sci. Hortic. 2014, 166, 111–120. [Google Scholar] [CrossRef]
  13. Mogren, L.M.; Olsson, M.E.; Gertsson, U.E. Effects of cultivar, lifting time and nitrogen fertilizer level on quercetin content in onion (Allium cepa L.) at lifting. J. Sci. Food Agric. 2007, 87, 470–476. [Google Scholar] [CrossRef]
  14. Siracusa, L.; Avola, G.; Patane, C.; Riggi, E.; Ruberto, G. Re-evaluation of traditional Mediterranean foods. The local landraces of ‘Cipolla di Giarratana’ (Allium cepa L.) and long-storage tomato (Lycopersicon esculentum L.): Quality traits and polyphenol content. J. Sci. Food. and Agr. 2013, 93, 3512–3519. [Google Scholar] [CrossRef] [PubMed]
  15. Tinna, D.; Garg, N.; Sharma, S.; Pandove, G.; Chawla, N. Utilization of plant growth promoting rhizobacteria as root dipping of seedlings for improving bulb yield and curtailing mineral fertilizer use in onion under field conditions. Sci. Hortic. 2020, 270, 109432. [Google Scholar] [CrossRef]
  16. Przygocka-Cyna, K.; Barłóg, P.; Grzebisz, W.; Spiżewski, T. Onion (Allium cepa L.) yield and growth dynamics response to in-season patterns of nitrogen and sulfur uptake. Agronomy 2020, 10, 1146. [Google Scholar] [CrossRef]
  17. Geisseler, D.; Ortiz, R.S.; Diaz, J. Nitrogen nutrition and fertilization of onions (Allium cepa L.)–A literature review. Sci. Hortic. 2022, 291, 110591. [Google Scholar] [CrossRef]
  18. Gebretsadik, K.; Dechassa, N. Response of Onion (Allium cepa L.) to nitrogen fertilizer rates and spacing under rain fed condition at Tahtay Koraro, Ethiopia. Sci. Rep. 2018, 8, 9495. [Google Scholar] [CrossRef]
  19. Drost, D.; Koenig, R.; Tindall, T. Nitrogen use efficiency and onion yield increased with a polymer-coated nitrogen source. HortScience 2002, 37, 338–342. [Google Scholar] [CrossRef] [Green Version]
  20. Buckland, K.; Reeve, J.R.; Alston, D.; Nischwitz, C.; Drost, D. Effects of nitrogen fertility and crop rotation on onion growth and yield, thrips densities, Iris yellow spot virus and soil properties. Agric. Ecosyst. Environ. 2013, 177, 63–74. [Google Scholar] [CrossRef]
  21. Wick, K.; Heumesser, C.; Schmid, E. Groundwater nitrate contamination: Factors and indicators. J. Environ. Manag. 2012, 111, 178–186. [Google Scholar] [CrossRef] [Green Version]
  22. Rajput, T.B.S.; Patel, N. Water and nitrate movement in drip-irrigated onion under fertigation and irrigation treatments. Agric. Water Manag. 2006, 79, 293–311. [Google Scholar] [CrossRef]
  23. Servizio Informativo Agrometeorologico Siciliano. Available online: www.sias.regione.sicilia.it (accessed on 20 July 2021).
  24. Craswell, E.T.; Godwin, D.C. The Efficiency of Nitrogen Fertilizers Applied to Cereals Grown in Different Climates; No. REP-3326; CIMMYT: El Batán, Mexico, 1984. [Google Scholar]
  25. CIMMYT Economics Program, International Maize and Wheat Improvement Center. From Agronomic Data to Farmer Recommendations: An Economics Training Manual; No. 27; CIMMYT: El Batán, Mexico, 1988. [Google Scholar]
  26. Ismeamercati. Available online: https://www.ismeamercati.it/analisi-e-studio-filiere-agroalimentari (accessed on 20 July 2021).
  27. Borsa merci Roma. Available online: http://www.borsamerciroma.it/index.php?categoriaMerceologica=2400&option=com_borsamerci&modulo=listinoPerCategoria&idListino=202128&Itemid=7 (accessed on 20 July 2021).
  28. Confagricoltura Siracusa. Available online: https://www.confagricolturasiracusa.it/ (accessed on 20 July 2021).
  29. Miceli, A.; Vetrano, F.; Sabatino, L.; D’Anna, F.; Moncada, A. Influence of Preharvest Gibberellic Acid Treatments on Postharvest Quality of Minimally Processed Leaf Lettuce and Rocket. Horticulturae 2019, 5, 63. [Google Scholar] [CrossRef] [Green Version]
  30. Sabatino, L.; La Bella, S.; Ntatsi, G.; Iapichino, G.; D’Anna, F.; De Pasquale, C.; Consentino, B.B.; Rouphael, Y. Selenium biofortification and grafting modulate plant performance and functional features of cherry tomato grown in a soilless system. Sci. Hortic. 2021, 285, 110095. [Google Scholar] [CrossRef]
  31. Consentino, B.B.; Aprile, S.; Rouphael, Y.; Ntatsi, G.; De Pasquale, C.; Iapichino, G.; Alibrandi, P.; Sabatino, L. Application of PGPB Combined with Variable N Doses Affects Growth, Yield-Related Traits, N-Fertilizer Efficiency and Nutritional Status of Lettuce Grown under Controlled Condition. Agronomy 2022, 12, 236. [Google Scholar] [CrossRef]
  32. Przygocka-Cyna, K.; Biber, M.; Pluta, M.; Grzebisz, W. Mineral density of onion bulbs as affected by fertilizers based on elemental sulfur. J. Elem. 2016, 21, 485–499. [Google Scholar] [CrossRef]
  33. Golubkina, N.; Amalfitano, C.; Sekara, A.; Tallarita, A.; Pokluda, R.; Stoleru, V.; Cuciniello, A.; Agafonov, A.F.; Kalisz, A.; Hamburda, S.B.; et al. Yield and bulb quality of storage onion cultivars as affected by farming system and nitrogen dose. Sci. Hortic. 2022, 293, 110751. [Google Scholar] [CrossRef]
  34. Banjare, C.; Shukla, N.; Sharma, P.K.; Patanwar, M.; Chandravanshi, D. Effect of organic substances on yield and quality of onion, Allium cepa L. Int. J. Sci. 2015, 5, 30–35. [Google Scholar]
  35. Kazimierczak, R.; Średnicka-Tober, D.; Barański, M.; Hallmann, E.; Góralska-Walczak, R.; Kopczyńska, K.; Rembiałkowska, E.; Górski, J.; Leifert, C.; Rempelos, L.; et al. The Effect of different fertilization regimes on yield, selected nutrients, and bioactive compounds profiles of onion. Agronomy 2021, 11, 883. [Google Scholar] [CrossRef]
  36. Gererufael, L.A.; Abraham, N.T.; Reda, T.B. Growth and yield of onion (Allium cepa L.) as affected by farmyard manure and nitrogen fertilizer application in Tahtay Koraro District, Northwestern Zone of Tigray, Ethiopia. Vegetos 2020, 33, 617–627. [Google Scholar] [CrossRef]
  37. Ncayiyana, M.; Maboko, M.M.; Bertling, I. Alterations in yield, physicochemical components and mineral composition of onion following organic manure and inorganic nitrogen application. Acta Agric. Scand. Sect. B Soil Plant Sci. 2018, 68, 213–219. [Google Scholar] [CrossRef]
  38. Boyhan, G.E.; Torrance, R.L.; Hill, C.R. Effects of nitrogen, phosphorus, and potassium rates and fertilizer sources on yield and leaf nutrient status of short-day onions. HortScience 2007, 42, 653–660. [Google Scholar] [CrossRef] [Green Version]
  39. Piri, H.; Naserin, A. Effect of different levels of water, applied nitrogen and irrigation methods on yield, yield components and IWUE of onion. Sci. Hortic. 2020, 268, 109361. [Google Scholar] [CrossRef]
  40. Halvorson, A.D.; Bartolo, M.E.; Reule, C.A.; Berrada, A. Nitrogen effects on onion yield under drip and furrow irrigation. Agron. J. 2008, 100, 1062–1069. [Google Scholar] [CrossRef]
  41. Amare, G. Review on Mineral Nutrition of Onion (Allium cepa L.). Open Biotechnol. J. 2020, 14, 134–144. [Google Scholar] [CrossRef]
  42. Bojović, B.; Marković, A. Correlation between nitrogen and chlorophyll content in wheat (Triticum aestivum L.). Kragujev. J. Sci. 2009, 31, 69–74. [Google Scholar]
  43. Pinto, E.; Almeida, A.A.; Aguiar, A.A.; Ferreira, I.M. Changes in Macrominerals, Trace Elements and Pigments Content during Lettuce (Lactuca Sativa L.) Growth: Influence of Soil Composition. Food Chem. 2014, 152, 603–611. [Google Scholar] [CrossRef]
  44. Sabatino, L.; Iapichino, G.; La Bella, S.; Tuttolomondo, T.; D’Anna, F.; Cardarelli, M.; Consentino, B.B.; Rouphael, Y. An Appraisal of Calcium Cyanamide as Alternative N Source for Spring-Summer and Fall Season Curly Endive Crops: Effects on Crop Performance, NUE and Functional Quality Components. Agronomy 2020, 10, 1357. [Google Scholar] [CrossRef]
  45. Benti, G. Influence of nitrogen rate and varieties on storage periods of onion (Allium cepa L.) in Fedis district, Eastern Ethiopia. Int. J. Inform. Res. Rev. 2017, 4, 4097–4105. [Google Scholar]
  46. Sekara, A.; Pokluda, R.; Del Vacchio, L.; Somma, S.; Caruso, G. Interactions among genotype, environment and agronomicpractices on production and quality of storage onion (Allium cepa L.)—A review. Hort. Sci. 2017, 44, 21–42. [Google Scholar]
  47. Mallor Giménez, C.; Carravedo Fantova, M.; Estopañán Muñoz, G.; Mallor Giménez, F. Characterization of genetic resources of onion (Allium cepa L.) from the Spanish secondary centre of diversity. Span. J. Agric. Res. 2011, 9, 144–155. [Google Scholar] [CrossRef]
  48. Lee, J.; Kim, J.; Kwon, J.H.; Chang, Y.H.; Kwon, Y.S.; Kim, T.J.; Park, M.J.; Kim, M.A.; Lee, H.M. Evaluation of forty-five cultivars as affected by bulb initiation, bulb and scale characteristics, and bulb minerals and organic compounds of intermediate-day yellow onion (Allium cepa L.) in South Korea. Hortic. Environ. Biotechnol. 2020, 61, 1011–1029. [Google Scholar] [CrossRef]
  49. Pöhnl, T.; Schweiggert, R.M.; Carle, R. Impact of cultivation method and cultivar selection on soluble carbohydrates and pungent principles in onions (Allium cepa L.). J. Agric. Food Chem. 2018, 66, 12827–12835. [Google Scholar] [CrossRef] [PubMed]
  50. Tekeste, N.; Dechassa, N.; Woldetsadik, K.; Talae, A.; Dessalegne, L.; Takele, A. Effect of Integrated Nitrogen, Phosphorus, and Farmyard manure on post-harvest quality and storability of onion (Allium cepa L.). J. Postharvest Technol. 2017, 5, 25–37. [Google Scholar]
  51. Larsen, T.; Saxena, A.; Cramer, C.S. Relatedness of bulb firmness to other attributes of New Mexico onion entries. Int. J. Veg. Sci. 2009, 15, 206–217. [Google Scholar] [CrossRef]
  52. Charron, G.; Furlan, V.; Bernier-Cardou, M.; Doyon, G. Response of onion plants to arbuscular mycorrhizae: 2. Effects of nitrogen fertilization on biomass and bulb firmness. Mycorrhiza 2001, 11, 145–150. [Google Scholar] [CrossRef]
  53. Randle, W.M. Increasing nitrogen concentration in hydroponic solutions affects onion flavor and bulb quality. J. Am. Soc. Hort. Sci. 2000, 125, 254–259. [Google Scholar] [CrossRef]
  54. Coolong, T.W.; Randle, W.M.; Wicker, L. Structural and chemical differences in the cell wall regions in relation to scale firmness of three onion (Allium cepa L.) selections at harvest and during storage. J. Sci. Food Agric. 2008, 88, 1277–1286. [Google Scholar] [CrossRef]
  55. Bal, S.; Maity, T.K.; Maji, A. Genetic Divergence Studies for Yield and Quality Traits in Onion (Allium cepa L.). Int. J. Curr. Microbiol. Appl. Sci. 2020, 9, 3201–3208. [Google Scholar] [CrossRef]
  56. Sinkovič, L.; Škof, M.; Ugrinović, K. Fertilization influenced physico-chemical parameters of different onion cultivars (Allium cepa L.). In Proceedings of the Novi Izzivi V Agron, Laško, Slovenia, 31 Januar–1 February 2019; pp. 215–221. [Google Scholar]
  57. Díaz-Pérez, J.C.; Bautista, J.; Gunawan, G.; Bateman, A.; Riner, C.M. Sweet onion (Allium cepa L.) as influenced by organic fertilization rate: 1. Plant growth, and leaf and bulb mineral composition. HortScience 2018, 53, 451–458. [Google Scholar] [CrossRef] [Green Version]
  58. Bavec, M.; Jakop, D.; Mlakar, S.G.; Bavec, F. Effect of Nitrogen Fertilization on Yields and Nitrogen Agronomic Efficiency of Onion. In Proceedings of the 47th Croatian and 7th International Symposium on Agriculture, Opatija, Croatia, 13–17 February 2012; Volume 368, p. 372. [Google Scholar]
  59. Sandoval-Contreras, H.A.; Ribeiro-Barzan, R.; Sandoval-Contreras, M.; Rodrigues-Brito, O. Growth, yield and agronomic efficiency of rice (Oryza sativa L.) cv. IAPAR 117 affected by nitrogen rates and sources. Acta Agron. 2017, 66, 558–565. [Google Scholar] [CrossRef]
  60. Galindo, F.S.; Pagliari, P.H.; Rodrigues, W.L.; Fernandes, G.C.; Boleta, E.H.M.; Santini, J.M.K.; Jalal, A.; Buzetti, S.; Lavrès, J.; Teixeira Filho, M.C.M. Silicon Amendment Enhances Agronomic Efficiency of Nitrogen Fertilization in Maize and Wheat Crops under Tropical Conditions. Plants 2021, 10, 1329. [Google Scholar] [CrossRef] [PubMed]
  61. Bezabih, T.T.; Girmay, S. Nutrient use efficiency and agro-economic performance of onion (Allium cepa L.) under combined applications of N, K and S nutrients. Vegetos 2020, 33, 117–127. [Google Scholar] [CrossRef]
  62. Nigatu, M.; Alemayehu, M.; Sellassie, A.H. Optimum rate of NPS fertilizer for economical production of irrigated onion (Allium cepa L.) in Dembyia district of Amhara region, Ethiopia. Ethiop. J. Sci. Technol. 2018, 11, 113–127. [Google Scholar] [CrossRef] [Green Version]
Figure 1. Influence of the interaction Y × A on the number of scales (A) and bulb firmness (B). Means with the same letter are not significantly different at p ≤ 0.05 according to Tukey’s test. Bars represent the standard error. ** = significant at p ≤ 0.01; Y = Year; A = Accession; L1 = Landrace (Bianca Calda di Comiso); V1 = Commercial Variety (Bianca di Maggio).
Horticulturae 08 00454 g001
Figure 2. Influence of the interaction Y × N on the number of scales. Means with the same letter are not significantly different at p ≤ 0.05 according to Tukey’s test. Bars represent the standard error. ** = significant at p ≤ 0.01; Y = Year; N = Nitrogen.
Horticulturae 08 00454 g002
Figure 3. Influence of the interaction Y × A × N on bulb firmness. Means with the same letter are not significantly different at p ≤ 0.05 according to Tukey’s test. Bars represent the standard error. ** = significant at p ≤ 0.01; Y = Year; A = Accession; N = nitrogen; L1 = Landrace (Bianca Calda di Comiso); V1 = Commercial Variety (Bianca di Maggio); N 0 = No-Nitrogen Fertilization; N 80 = fertilization with 80 kg N ha−1; N 160 = fertilization with 160 kg N ha−1; N 220 = fertilization with 220 kg N ha−1.
Horticulturae 08 00454 g003
Figure 4. Influence of the interaction Y × N × PD on the number of scales. Means with the same letter are not significantly different at p ≤ 0.05 according to Tukey’s test. Bars represent the standard error. ** = significant at p ≤ 0.01; Y = Year; N = Nitrogen; PD = Planting Date; N 0 = No-Nitrogen Fertilization; N 80 = fertilization with 80 kg N ha−1; N 160 = fertilization with 160 kg N ha−1; N 220 = fertilization with 220 kg N ha−1; PD 1 = Early Planting Date; PD 2 = Traditional Planting Date.
Horticulturae 08 00454 g004
Figure 5. Influence of the interaction A × N × PD on dry matter (A) and total yield (B). Means with the same letter are not significantly different at p ≤ 0.05 according to Tukey’s test. Bars represent the standard error. ** = significant at p ≤ 0.01; * = significant at p ≤ 0.05; A = Accession; N = nitrogen; PD = Planting Date; L1 = Landrace (Bianca Calda di Comiso); V1 = Commercial Variety (Bianca di Maggio); N 0 = No-Nitrogen Fertilization; N 80 = fertilization with 80 kg N ha−1; N 160 = fertilization with 160 kg N ha−1; N 220 = fertilization with 220 kg N ha−1; PD 1 = Early Planting Date; PD 2 = Traditional Planting Date.
Horticulturae 08 00454 g005
Figure 6. Influence of the interaction A × N on the NAE (nitrogen agronomic efficiency). Means with the same letter are not significantly different at p ≤ 0.05 according to Tukey’s test. Bars represent the standard error. ** = significant at p ≤ 0.01; A = Accession; N = nitrogen; L1 = Landrace (Bianca Calda di Comiso); V1 = Commercial Variety (Bianca di Maggio).
Horticulturae 08 00454 g006
Figure 7. Influence of the interaction Y × N × PD on the NAE (nitrogen agronomic efficiency). Means followed by the same letter are not significantly different at p ≤ 0.05 according to Tukey’s test. Bars represent the standard error. ** = significant at p ≤ 0.01; Y = Year; N = nitrogen; PD = Planting Date; N 0 = No-Nitrogen Fertilization; N 80 = fertilization with 80 kg N ha−1; N 160 = fertilization with 160 kg N ha−1; N 220 = fertilization with 220 kg N ha−1; PD 1 = Early Planting Date; PD 2 = Traditional Planting Date.
Horticulturae 08 00454 g007
Table 1. Production parameters for onions in response to year (Y), accession (A), planting date (PD), and nitrogen dose (N).
TreatmentDry Matter
[%]
Average Bulb Weight
[kg]
Number of Bulbs per Unit Area
[Bulbs m−2]
Total Yield
[t ha−1]
Marketable Yield
[t ha−1]
Unmarketable Yield
[t ha−1]
Double Bulbs
[t ha−1]
Waste Bulbs
[t ha−1]
Days from Sowing to Harvest
[Days]
Number of Scales
[Bulb−1]
Firmness
[kg cm−2]
Year (Y)
2005/20067.17 a0.18 a29.91 a 51.25 a32.39 a16.00 a2.21 a 0.65 a214 a8.05 b8.52 b
2006/20077.28 a0.20 a30.08 a 52.50 a 34.70 a 15.65 a1.45 a 0.69 a210 a8.36 a8.86 a
Accession (A)
L17.07 a 0.23 a29.99 a62.08 a 40.46 a21.32 a 0.00 b0.30 b214 a8.15 b7.76 b
V17.38 a 0.15 b30.00 a41.67 b26.63 b10.34 b 3.67 a1.04 a210 a8.26 a9.62 a
Planting Date (PD)
PD 16.93 b0.19 a26.10 b45.16 b26.21 b16.77 a 1.69 a0.49 a246 a8.18 b8.80 a
PD 27.52 a0.18 a33.89 a58.59 a40.87 a14.89 a 1.98 a0.85 a 177 b8.23 a8.58 b
Nitrogen (N)
[kg ha−1]
07.77 a 0.17 b25.16 b35.45 c 25.80 c8.17 c0.88 a 0.61 a 212 a8.29 a9.51 a
807.48 ab0.18 b30.87 a48.99 b31.98 b14.70 b 1.57 a0.74 a 212 a8.28 a 8.87 b
1606.83 b0.21 a30.77 a61.14 a 36.49 ab20.87 a 3.13 a0.66 a212 a8.19 b8.44 c
2206.82 b0.19 ab33.19 a61.92 a39.91 a19.57 a 1.76 a0.67 a212 a8.05 c7.94 d
Means followed by the same letter are not significantly different at p ≤ 0.05 according to Tukey’s test; n.s. = not significant. L1 = Landrace (Bianca Calda di Comiso); V1 = Commercial Variety (Bianca di Maggio).
Table 2. Influence of the interaction A × N on the total yield, marketable yield, unmarketable yield, and firmness.
TreatmentTotal Yield Marketable YieldUnmarketable Yield Firmness
[t ha−1][t ha−1][t ha−1][kg cm−2]
L1N 041.41de29.87 bc11.29 bc8.63 e
N 8058.62 b36.89 bc21.45 a7.90 f
N 16075.78 a47.39 a27.99 a7.48 g
N 22072.53 a47.70 a24.56 a7.03 h
V1N 029.50 f21.73 d5.05 c10.39 a
N 8039.36 e27.08 cd7.95 bc9.83 b
N 16046.50 cd25.59 cd13.76 b9.41 c
N 22051.31 c32.12 bc14.59 b8.86 d
Means followed by the same letter are not significantly different at p ≤ 0.05 according to Tukey’s test. L1 = Landrace (Bianca Calda di Comiso); V1 = Commercial Variety (Bianca di Maggio); N = Nitrogen.
Table 3. Influence of the interaction A × PD on the dry matter percentage, average bulb weight, number of bulbs per unit area, number of scales, and firmness.
TreatmentDry MatterAverage Bulb WeightNumber of Bulbs Per Unit AreaNumber of ScalesFirmness
[%][kg][bulbs m−2][bulb−1][kg cm−2]
L1PD 17.00 b0.25 a28.83 c8.10 b7.90 c
PD 27.14 ab0.20 b36.14 a8.19 a7.62 d
V1PD 16.86 b0.13 c28.36 bc8.26 a9.71 a
PD 27.90 a0.17 d31.64 ab8.27 a9.53 b
Means followed by the same letter are not significantly different at p ≤ 0.05 according to Tukey’s test. L1 = Landrace (Bianca Calda di Comiso); V1 = Commercial Variety (Bianca di Maggio); PD 1 = Early Planting Date; PD 2 = Traditional Planting Date.
Table 4. Influence of the interaction PD × N on the total yield, marketable yield, unmarketable yield, and firmness.
TreatmentTotal Yield Marketable YieldUnmarketable Yield Firmness
[t ha−1][t ha−1][t ha−1][kg cm−2]
PD 1N 031.32 e21.56 e8.07 c9.63 a
N 8043.98 cd24.30 de17.61 ab9.04 c
N 16054.79 b32.33 cd19.76 a8.56 e
N 22050.57 cb26.67 de21.64 a7.99 g
PD 2N 039.59 d30.04 d8.27 c9.39 b
N 8054.00 b39.66 bc11.79 bc8.70 d
N 16067.50 a40.65 b21.99 a8.33 f
N 22073.27 a53.15 a17.51 ab7.89 h
Means followed by the same letter are not significantly different at p ≤ 0.05 according to Tukey’s test. PD 1 = Early Planting Date; PD 2 = Traditional Planting Date; N 0 = No-Nitrogen Fertilization; N 80 = fertilization with 80 kg N ha−1; N 160 = fertilization with 160 kg N ha−1; N 220 = fertilization with 220 kg N ha−1.
Table 5. Nitrogen agronomy efficiency (NAE) in response to year (Y), accession (A), planting date (PD), and N dose (N).
TreatmentNAE
Year (Y)
2005/2006113.47 a
2006/2007111.54 a
Accession (A)
L1142.84 a
V182.19 b
Planting Date (PD)
PD 198.11 b
PD 2126.92 a
Nitrogen (N)
N 00 c
N 80169.21 a
N 160160.56 a
N 220120.28 b
Means followed by the same letter are not significantly different at p ≤ 0.05 according to Tukey’s test. L1 = Landrace (Bianca Calda di Comiso); V1 = Commercial Variety (Bianca di Maggio).
Table 6. Cost–benefit analysis of the two onion accessions expressed as an average of the two agricultural years.
AccessionPlanting DateN
[kg ha−1]
Marketable Yield
[t ha−1]
Adjusted Yield
[t ha−1]
Gross Field Benefits
[EUR ha−1]
Total Variable Costs
[EUR]
Net Benefits
[EUR]
Dominance
L11025.1322.62904809048
L118030.9727.8811,15120910,942
L1116043.2538.9315,57241815,154
L1122033.3229.9911,99660411,391D
L12034.6031.1412,457012,457D
L128042.8038.5215,40820915,199
L1216051.5246.3718,54741818,130
L1222062.0955.8822,35160421,747
V11017.9816.18647206472
V118017.6315.8763482096139D
V1116021.4019.2677034187286
V1122020.0218.0272096046604D
V12025.4822.93917109171
V128036.5232.8713,14920912,940
V1216029.7826.8010,72041810,302D
V1222044.2139.7915,91560415,311
L1 = Landrace (Bianca Calda di Comiso); V1 = Commercial Variety (Bianca di Maggio).
Table 7. Marginal rate of return (MRR) analysis of the two accessions expressed as an average of the two agricultural years.
AccessionPlanting DateN
[kg ha−1]
Adjusted Yield
[t ha−1]
Total Variable Costs [EUR]Net Benefits
[EUR]
MRR
[%]
L118027.8820910,942907
L1116038.9341815,1542016
L128038.5220915,1991313
L1216046.3741818,1301403
L1222055.8860421,7471938
V1116019.264187286195
V128032.8720912,9401804
V1222039.7960415,311599
L1 = Landrace (Bianca Calda di Comiso); V1 = Commercial Variety (Bianca di Maggio).
Publisher’s Note: MDPI stays neutral with regard to jurisdictional claims in published maps and institutional affiliations.

