Article

Identification and Comparative Analysis of Genes and MicroRNAs Involved in the Floral Transition of the Xinjiang Early-Flowering Walnut (Juglans regia L.)

1
Key Laboratory of Horticultural Plant Biology, Huazhong Agricultural University, Wuhan 430070, China
2
College of Horticulture and Forestry, Tarim University, Alar 843300, China
3
Xinjiang Production & Construction Corps Key Laboratory of Protection and Utilization of Biological Resources in Tarim Basin, Alar 843300, China
4
Institute of Economic Crops, Hubei Academy of Agricultural Sciences, Wuhan 430064, China
*
Author to whom correspondence should be addressed.
Horticulturae 2022, 8(2), 136; https://doi.org/10.3390/horticulturae8020136
Submission received: 8 January 2022 / Revised: 2 February 2022 / Accepted: 3 February 2022 / Published: 5 February 2022

Abstract

:
For tree crops, shortening the juvenile phase is a vital strategy to advance fruit bearing and enhance the breeding efficiency. Walnut (Juglans regia L.) seedlings usually take at least eight to 10 years to flower, but early-flowering (EF) types can flower one or two years after planting. In this study, RNA sequencing (RNA-Seq) and microRNA sequencing (miRNA-Seq) were used for a transcriptome-wide analysis of gene and miRNA expression in hybrids of the Xinjiang EF walnut variety ‘Xinwen 81’ and later-flowering (LF) walnut. Based on a high-quality chromosome-scale reference genome, a total of 3009 differentially expressed genes (DEGs) were identified, of which 933 were upregulated (accounting for 31%) and 2076 were downregulated (accounting for 69%). DEGs were functionally annotated, and the flowering-related genes FLOWERING LOCUS T (FT), SUPPRESSOR OF OVEREXPRESSION OF CO 1 (SOC1), and LEAFY (LFY) showed remarkable upregulation in EF compared with in the LF walnut. In addition, miRNAs associated with floral transition were screened as candidates for flowering time regulation in the walnut. This work provides new insights into walnut floral transition, which may ultimately contribute to genetic improvement of the walnut.

Graphical Abstract

1. Introduction

In flowering plants, the floral transition from the juvenile to the adult phase is controlled by several exogenous and endogenous developmental signals to ensure an appropriate flowering time [1,2]. In the model plant Arabidopsis thaliana, this transition is regulated by the photoperiodic, vernalization, autonomous, and gibberellin pathways [1,3]. Crosstalk between those pathways in this critical reproductive stage is regulated by a network of flowering-related genes [1,4,5,6]. For example, FLOWERING LOCUS C (FLC) functions as a flowering repressor in Arabidopsis; in contrast, FLOWERING LOCUS T (FT), or florigen, promotes flower initiation and is directly repressed by FLC under long-day photoperiod (LD) conditions [7,8,9,10]. In addition to the four major pathways described above, floral transition is influenced by the miR156-dependent aging pathway [11,12]. Recent studies have revealed that miR156 and miR172 play key roles in the regulation of the floral transition. The expression level of miR156 is high in the juvenile stage and gradually decreases during the adult stage, whereas miR172 exhibits the opposite expression pattern [12,13]. It is crucial to understand how these pathways function in response to diverse developmental and environmental signals in model and crop plants. However, few flowering time genes have been identified in perennial woody plants.
Perennial woody plants require longer time periods to complete the transition from the juvenile to the adult phase. After the floral transition, they can generate both flowering and vegetative buds each year. In perennial plants, FLC-like genes are expressed at different levels that correspond with evolutionary relationships between plants [14,15,16,17]. It has been shown that, in biennial-to-perennial wavy bittercress (Cardamine flexuosa), integrated age and vernalization pathways generally regulate flowering with CfFLC and miR156-SPL-miR172 modules [18]. Most woody fruit trees have long juvenile vegetative phases, which is the major limitation to early economic benefits for fruit production. Despite the differences in lifespan between annual and perennial plants, similar genetic and epigenetic processes seem to underlie flower transition from the vegetative to reproductive stage.
Persian walnut (Juglans regia L.) is a well-known nut fruit with high nutritive value [19]. It originated in the mountain valleys of Central Asia and is now grown worldwide in countries such as the USA, Iran, and China [20]. This species takes approximately eight to 10 years to bloom for fruit setting after seedlings are planted; the relatively long juvenile phase delays economic income for several years after planting, making early-flowering (EF; short juvenile phase) walnut germplasm resources more desirable for walnut breeders and farmers. Compared with other plants, the mechanism of floral transition in walnut remains less studied. Using RNA sequencing (RNA-Seq) analyses, recent studies have proposed several candidate genes associated with the juvenile–adult phase change in walnut trees [21,22], but the critical genes regulating the precocious characteristic of EF walnut germplasm are still unknown. A high-quality chromosome-scale reference genome was recently released for the walnut [23]. The combination of RNA-Seq data with this reference genome will provide more informative profiles for understanding the floral transition.
In the present study, we created hybrid offspring between the EF cultivar ‘Xinwen 81’ and the late-flowering (LF; or long juvenile phase) type, the Xinjiang local walnut. RNA-Seq and microRNA-Seq (miRNA-Seq) analyses were used to identify differentially expressed genes (DEGs) and differentially expressed miRNAs associated with the floral transition in walnut varieties. Together, these results not only lay the foundation for further studies on juvenile–adult phase change regulation in walnut varieties but, ultimately, may contribute to the development of walnut breeding programs for the selection of EF germplasm.

2. Materials and Methods

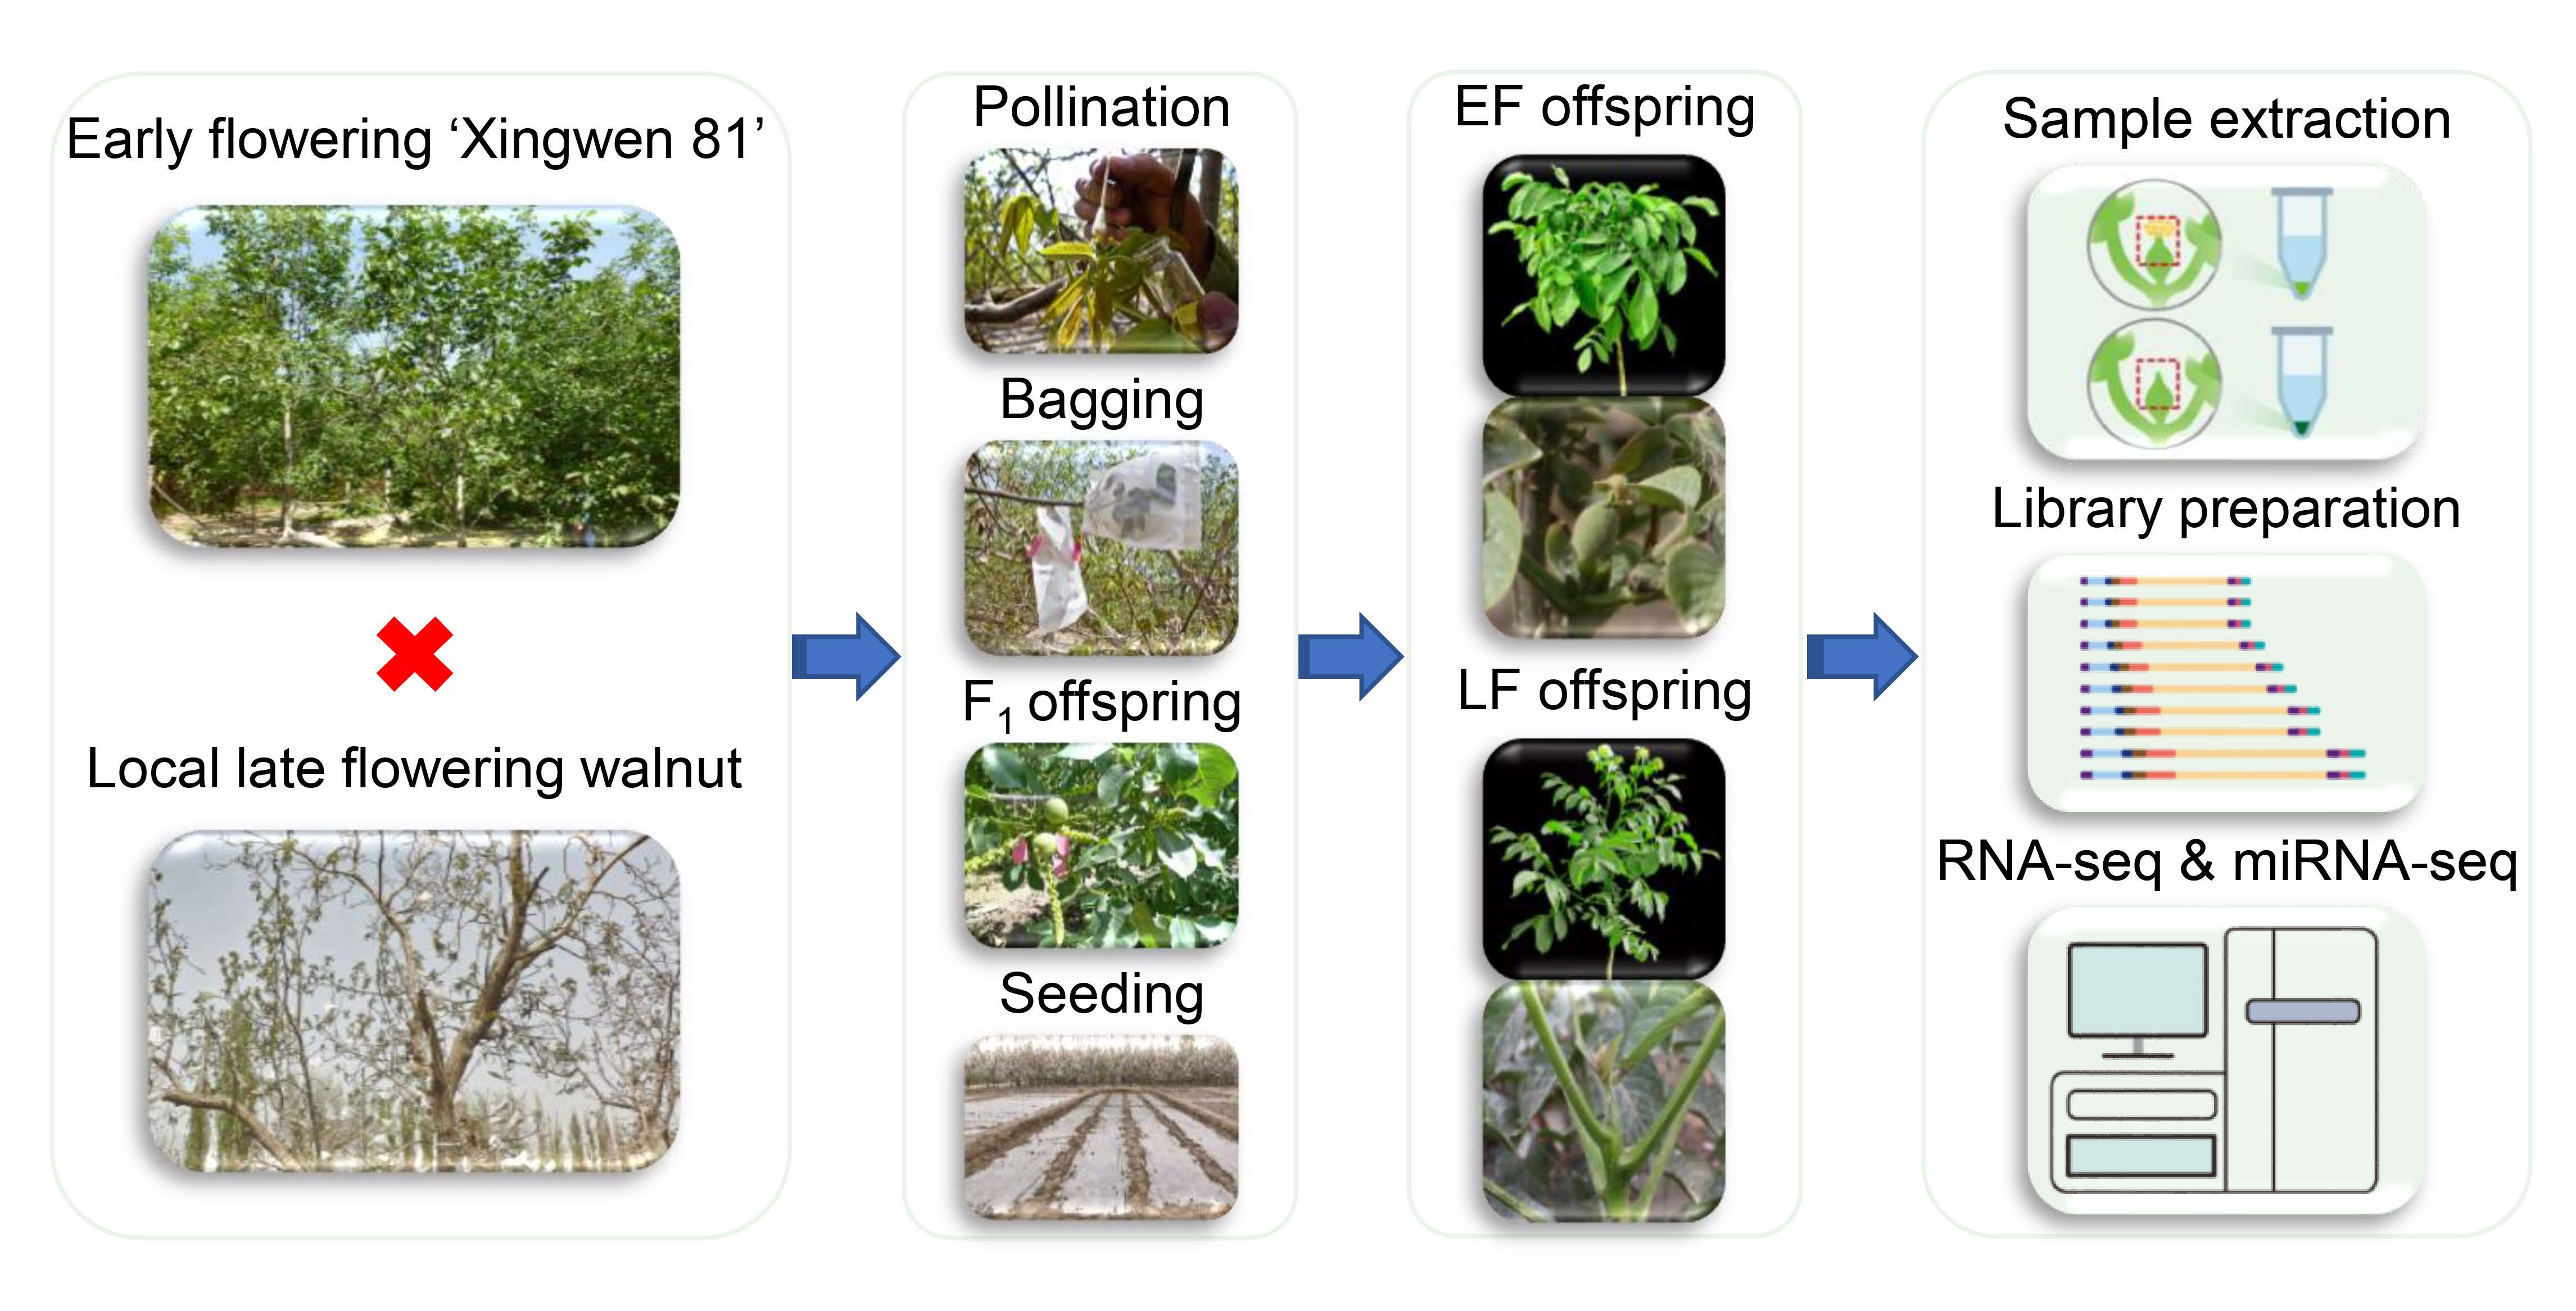
2.1. Plant Materials and Sample Collection

In this study, all walnut materials were planted and collected in a field in Alar city, Xinjiang province, China (40°32′27.74239″ N, 81°18′3.40166″ E, altitude 957.37 m). Briefly, all walnut materials used in this study were obtained following the procedure. Firstly, we hybridized a bred EF variety (‘Xinwen 81’) and a local LF walnut variety by manual pollination to obtain the F1 offspring in 2013. Then, seeds from the F1 offspring were harvested and sown. We observed whether the F1 seedling plants were able to complete the floral transition with visible floral buds in 2014 and 2015. The F1 seedling walnuts that flowered for one or two years were marked as EF offspring, while LF F1 seedling walnuts were marked as those that flowered beyond 2 years. For RNA-Seq and miRNA-Seq analyses, EF and LF bud samples were separately mixed with three repeats from the F1 hybrid population. The mixed samples of EF and LF walnut offspring buds were harvested, flash-frozen in liquid nitrogen, and then stored at −80 °C for further analyses.

2.2. RNA Extraction, Library Preparation, RNA Sequencing, and microRNA Sequencing

Total RNA was extracted from the flower buds of EF and LF walnut plants using the RNA Easy Fast Plant Tissue Kit (TIANGEN, Beijing), and cDNA was generated with the FastKing RT Kit (TIANGEN, Beijing), both according to the manufacturer’s instructions. The Agilent Bioanalyzer 2100 was used to measure the RNA quality, and only high-integrity RNA was used for further analyses. For RNA-Seq, the library was prepared using a TruSeq RNA kit (Illumina, San Diego, CA, USA) following the manufacturer’s recommendations. For miRNA-Seq, the library was prepared using the MicroRNA Sample Pre Kit as instructed by the manufacturer. High-throughput sequencing was performed using the Illumina HiSeq2500 platform.

2.3. RNA-Seq and miRNA-Seq Data Analysis

RNA-Seq libraries were evaluated for quality using FastQC. Low-quality reads, and adapter sequences were filtered using Trim-galore v0.6.2 (https://github.com/FelixKrueger/TrimGalore, accessed on 4 March 2021). Cleaned reads were aligned to the high-quality chromosome-scale assembly of the walnut reference genome [23] (http://dendrome.ucdavis.edu/ftp/Genome_Data/genome/Reju/, accessed on 15 March 2021) using HISAT2 v2.2.1 (http://daehwankimlab.github.io/hisat2/, accessed on 15 March 2021) with default parameters. Gene expression levels were quantified using FeatureCounts v1.22.2 (http://subread.sourceforge.net/featureCounts.html) with default parameters. Differentially expressed genes (DEGs) were identified using the DEseq2 [24] package in R with cutoff values of Fold Change (FC) > 2 and adjusted p-value < 0.05.
miRNA-Seq data were evaluated for quality, and low-quality reads and adapter sequences were removed. Reads that were 18 to 30 nt long were included in subsequent analyses. Cleaned reads mapped to ribosomal RNA (rRNA), transfer RNA (tRNA), small nucleolar RNA (snoRNA), and small nuclear RNA (snRNA) sequences were filtered using Bowtie2, and then the remaining reads were aligned to the walnut genome using miRDeep2 [25]. TPM values were calculated for each miRNA, and then the miRNA abundance was compared between EF and LF samples using the DEseq2 package in R, as described above.

2.4. Functional Enrichment Analysis

DEGs were annotated using Gene Ontology (GO) terms from the agriGO v2.0 database [26], and functional enrichment was determined using Fisher’s test and Yekutieli‘s multi-test adjustment method. GO terms with false detection rate (FDR) values <0.05 were defined as significantly enriched. The Kyoto Encyclopedia of Genes and Genomes (KEGG) [27] was used for biochemical pathway annotation and enrichment analysis, with significantly enriched terms also being defined as those with FDR < 0.05.

2.5. miRNA Target Prediction

miRNA target genes were predicted using TargetFinder [28] with default parameters.

2.6. Quantitative Real-Time PCR Validation

Total RNA was extracted and first-strand cDNA was synthesized as described above. Diluted cDNA was used as a template for quantitative real-time (qRT)-PCR, which was performed using a SYBR Premix ExTaq II Kit on an ABI 7500 qPCR instrument (Applied Biosystems, Waltham, MA, USA). The 2ΔΔCt method was used to evaluate the relative expression levels of target genes in each sample [5]. All primers used in this study are shown in Table S1.

3. Results

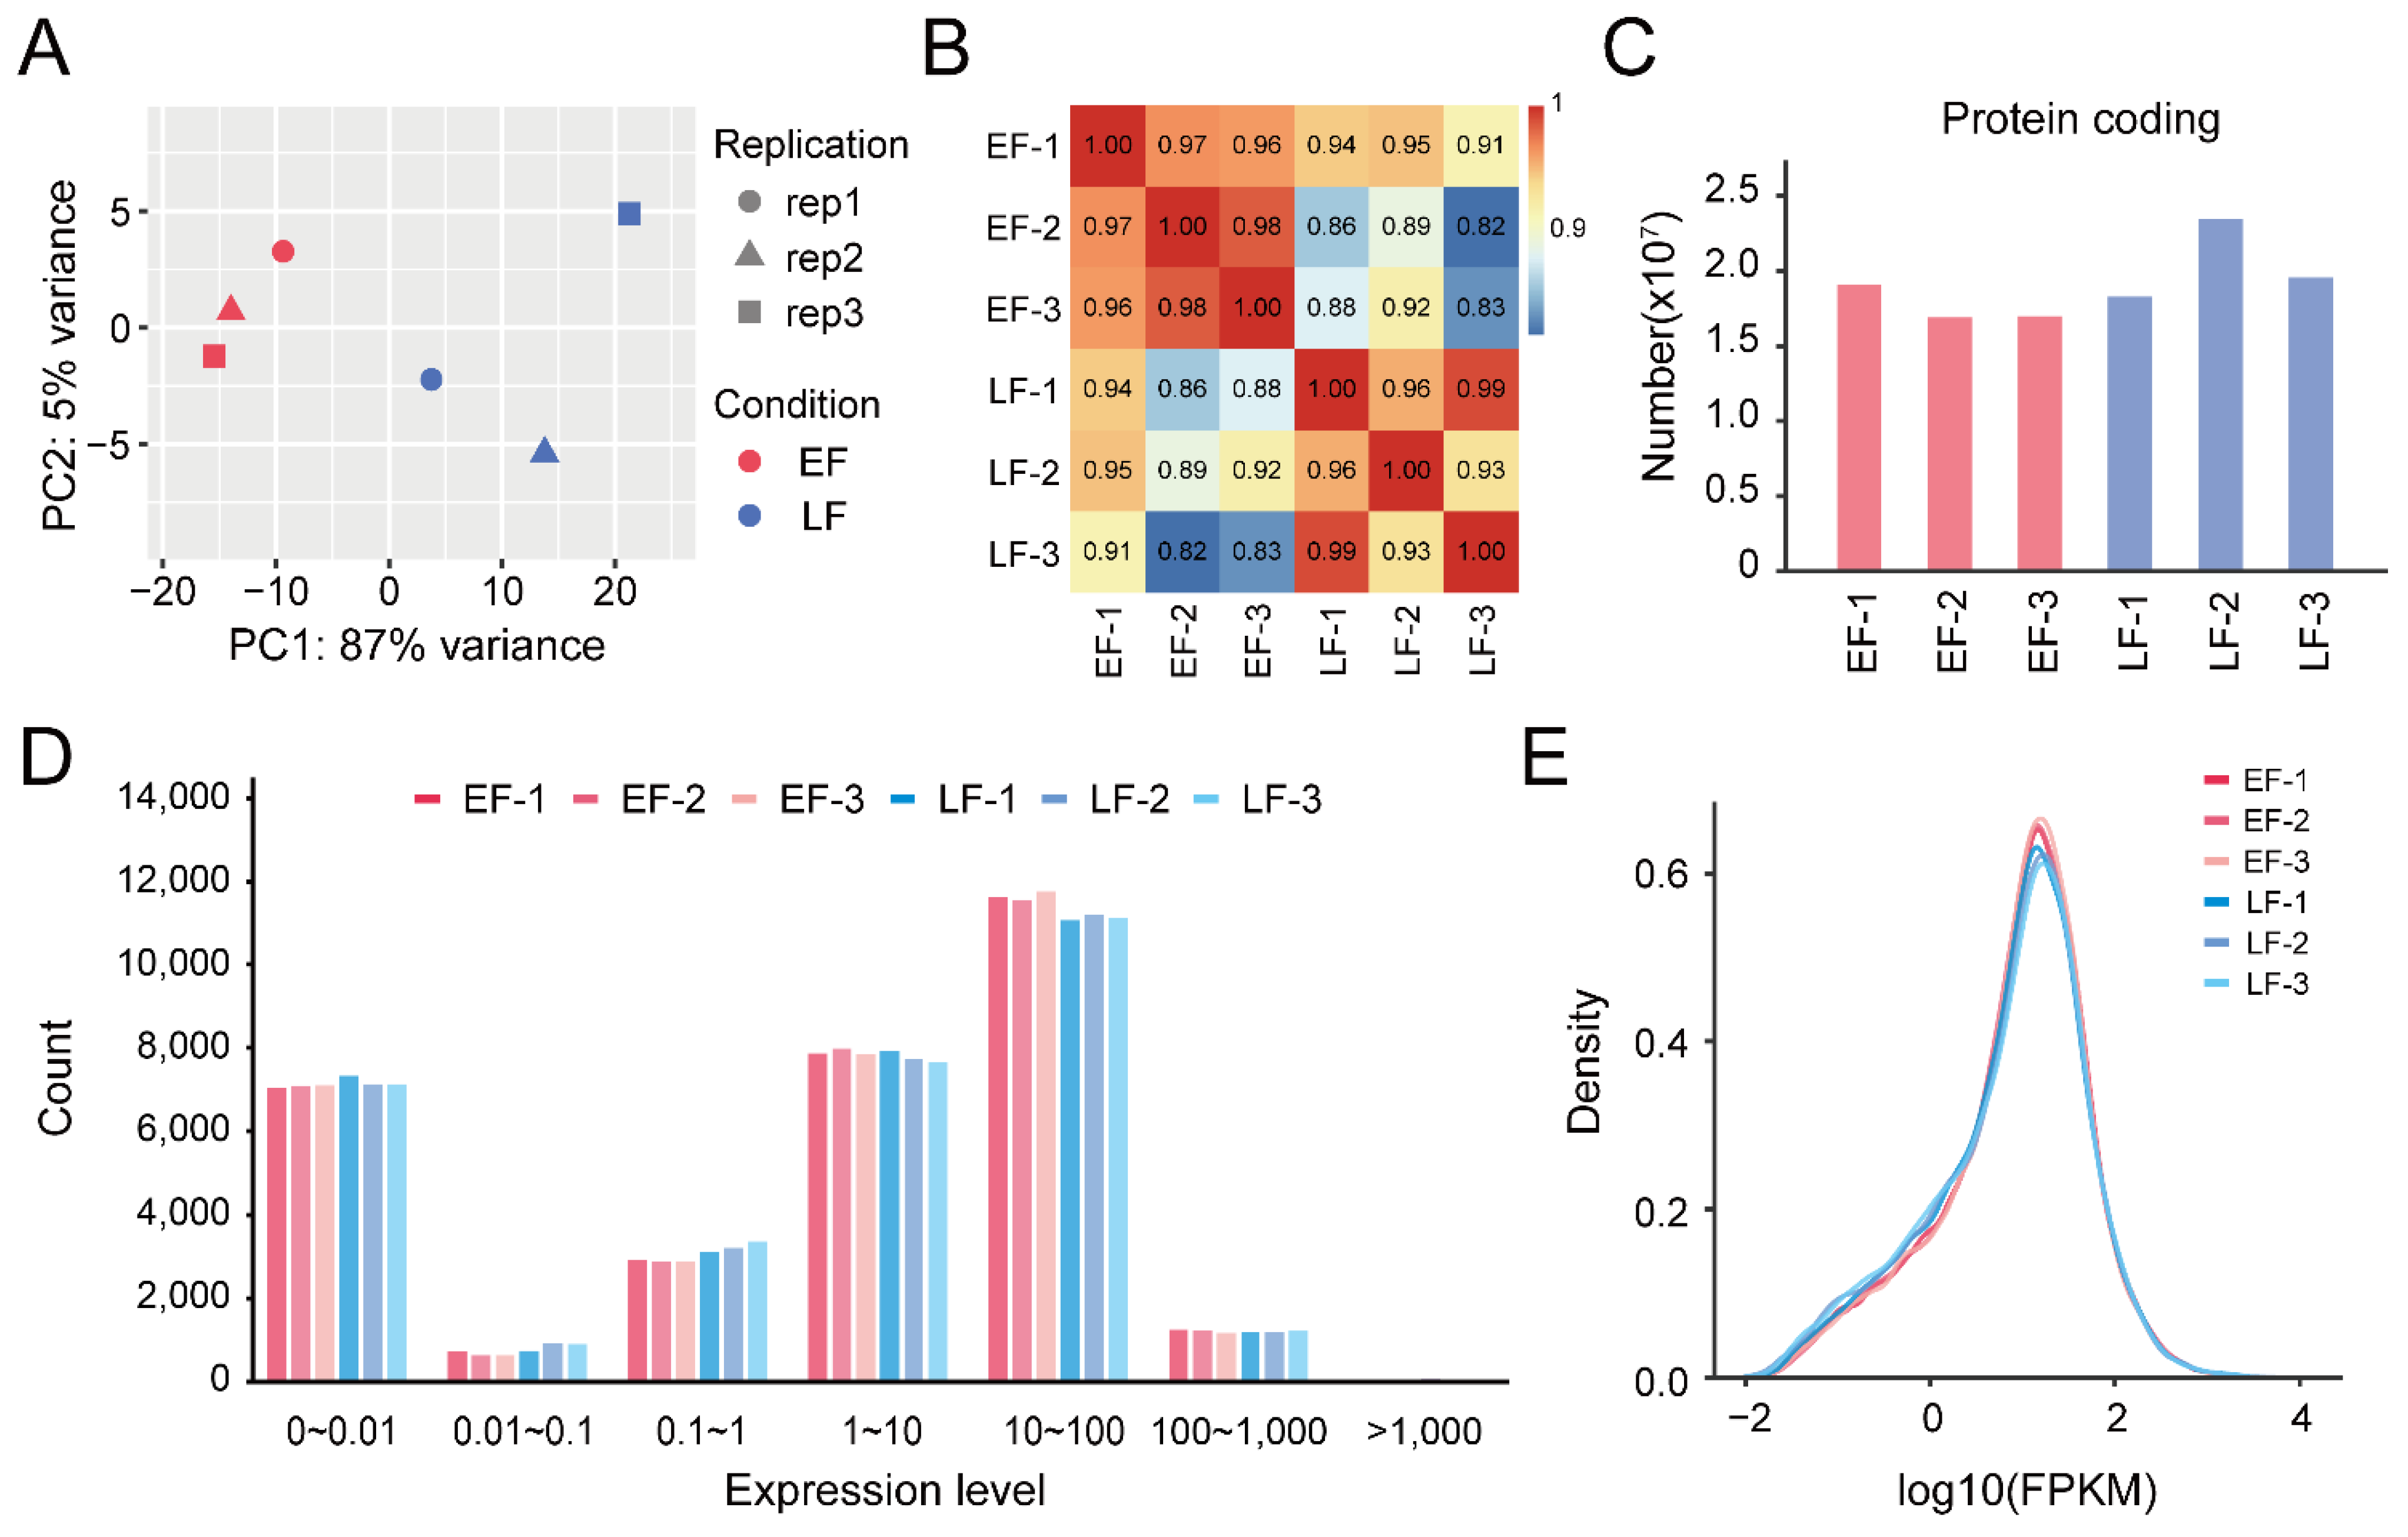
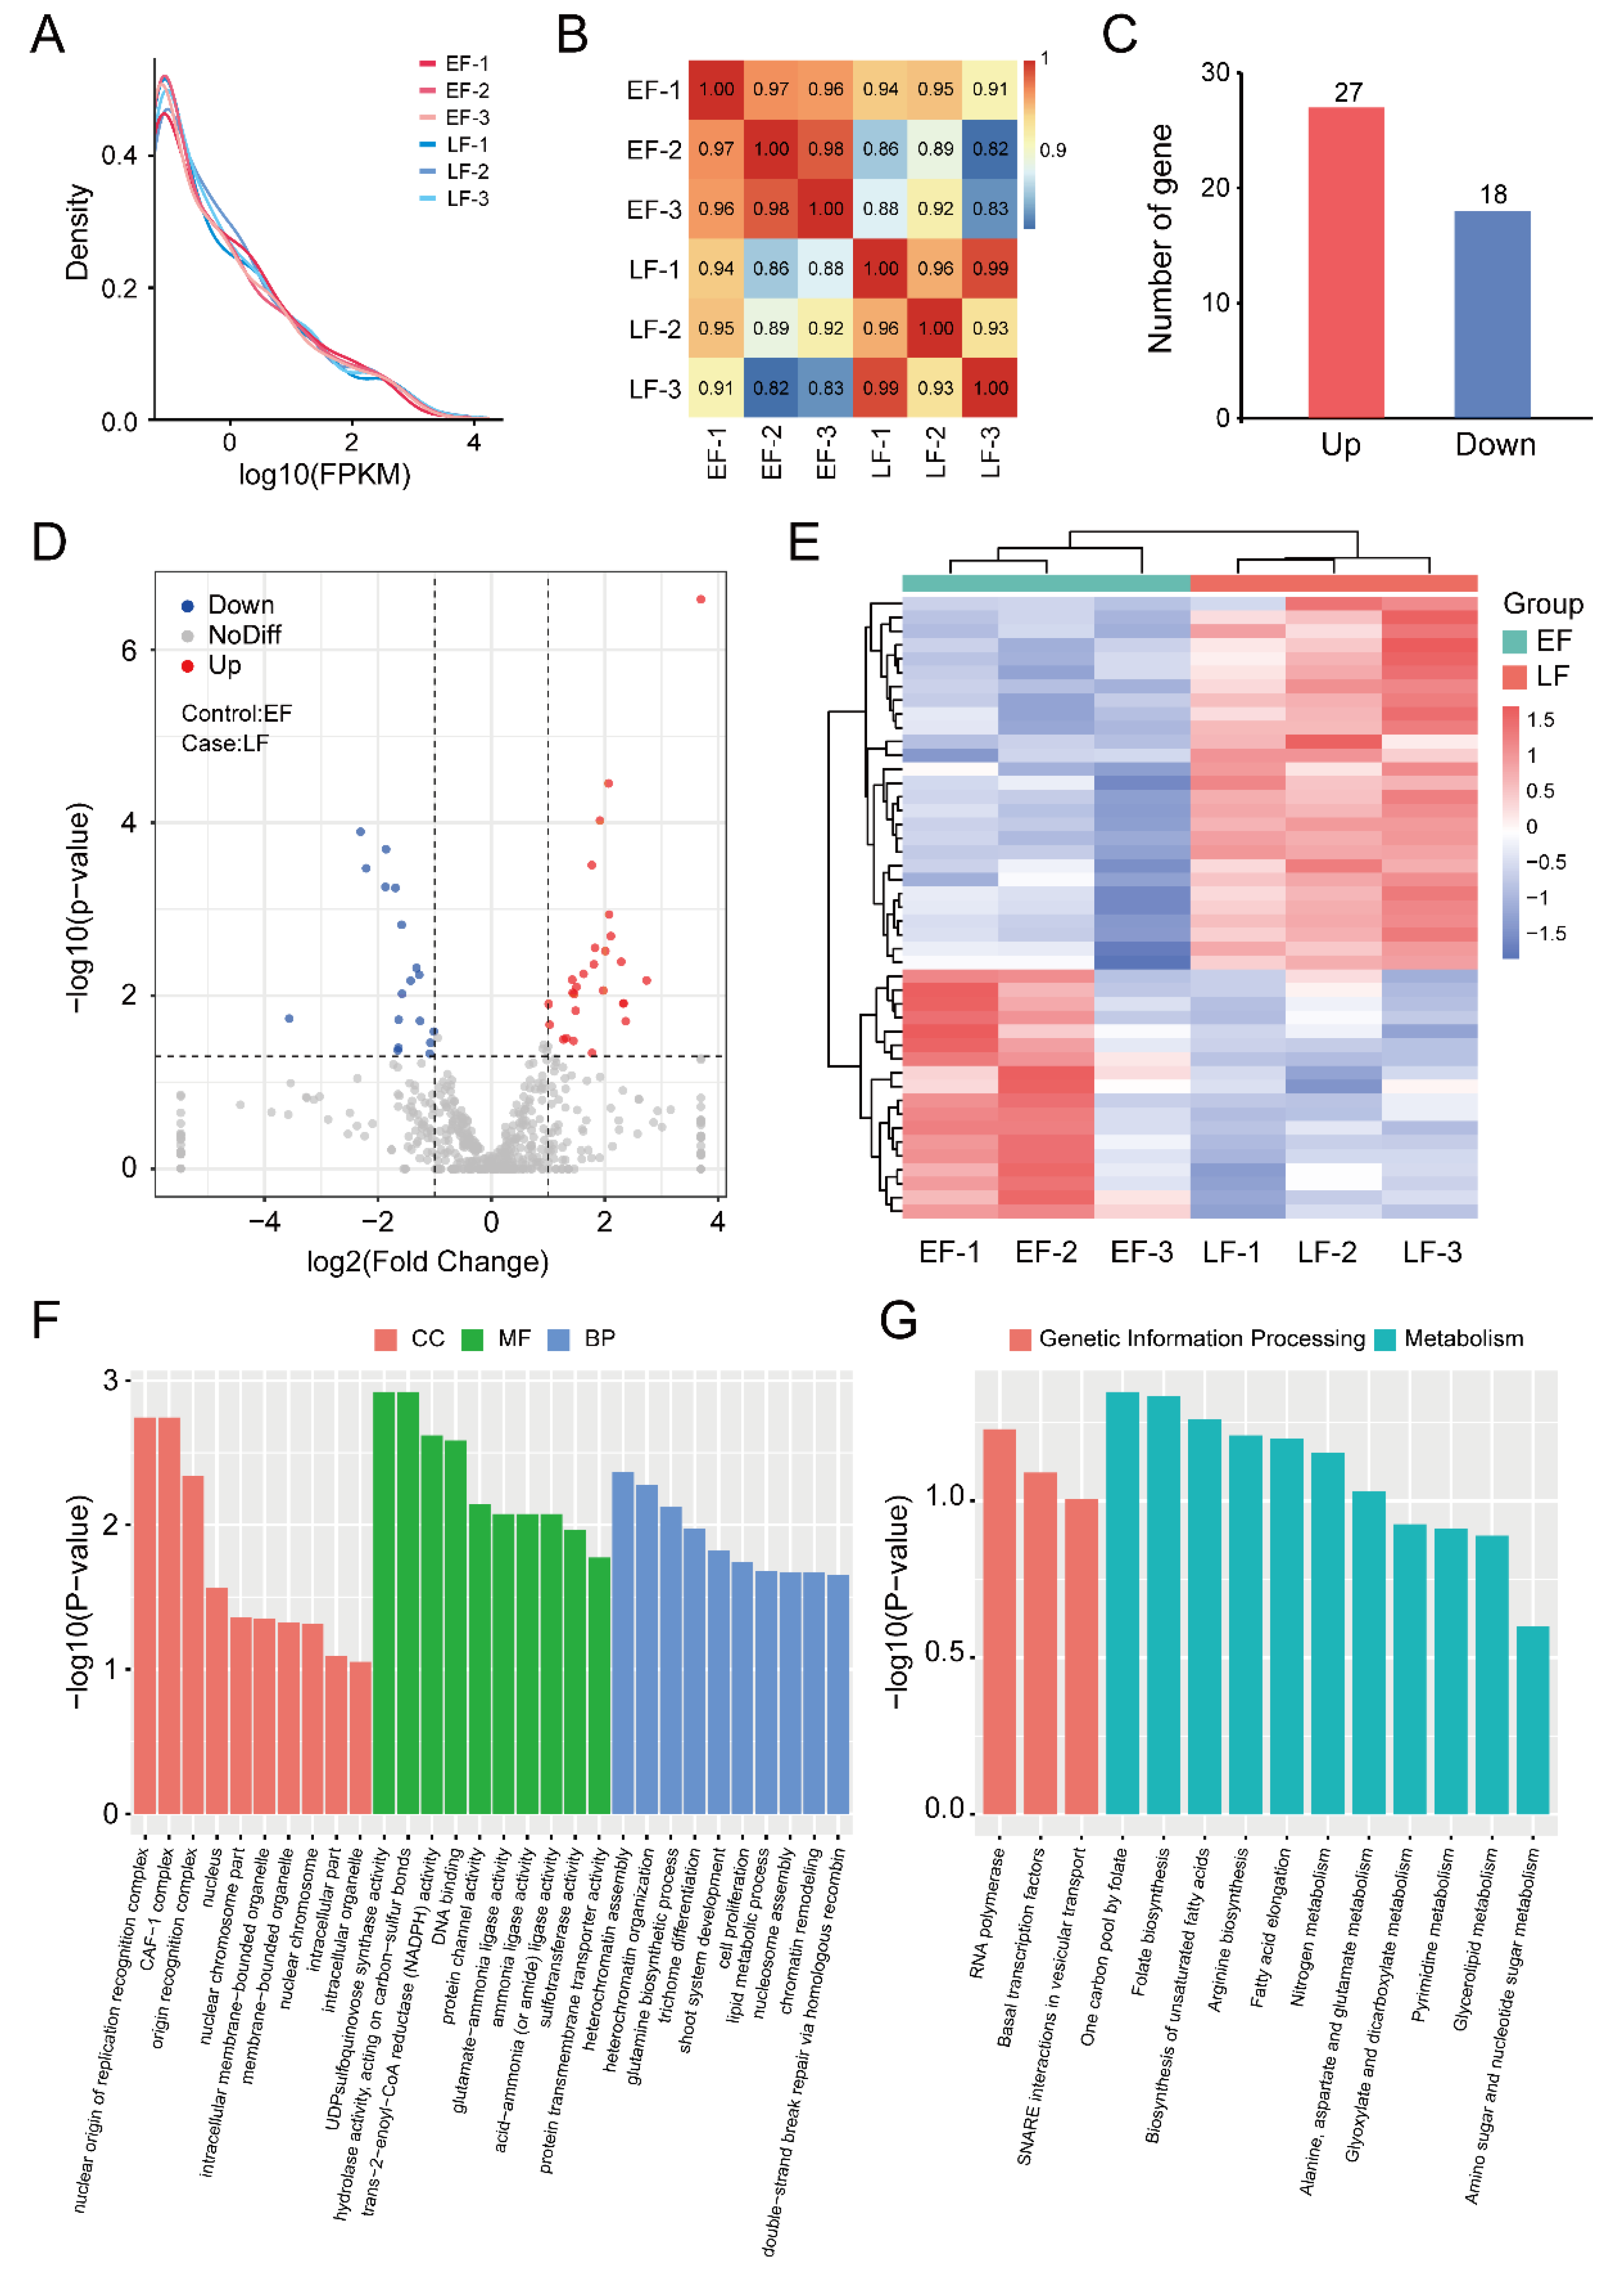
3.1. RNA Sequencing and Transcription Analysis

RNA was extracted from six samples (LF and EF walnut flower buds, each with three biological replicates: EF1-3 and LF1-3, respectively). Illumina sequencing yielded a total of 33.71 million paired-end reads in a total of 42.47 Gb sequencing data. These raw data sequences have been submitted to the Gene Expression Omnibus (GEO) database of the National Center for Biotechnology Information (NCBI) under the accession number GSE193061. After quality checking and cleaning, the remaining reads (those with bases of Q ≥ 20) constituted over 93% of the samples, comprising between 4.63 and 6.55 million reads per sample. The percentage of uniquely mapped reads ranged from 96.61 to 96.78% (Table S2), and only the uniquely mapped reads were further used to calculate the normalized gene expression level as fragments per kilobase of transcript per million mapped reads (FPKM).
To gain insight into transcriptomic differences between EF and LF varieties, we performed a principal component analysis (PCA) (Figure 1A), correlation analysis (Figure 1B), protein-coding read annotation (Figure 1C), expression level analysis (Figure 1D), and expression level density analysis (Figure 1E). The PCA yielded two principal components (PCs) that explained 87% and 5% of the variance for all six samples. Using the PCA and correlation analysis, we found that the three biological replicates of EF and LF walnut varieties had very high levels of replicability (Figure 1A,B). The average number of reads annotated as protein coding genes in the LF walnut samples was higher than in the EF walnut samples (Figure 1C). To minimize transcriptional noise, we defined expressed genes as those with FPKM ≥ 1. Using this cutoff, the number of expressed genes in the LF walnut samples was lower than in the EF walnut samples (Figure 1D,E).

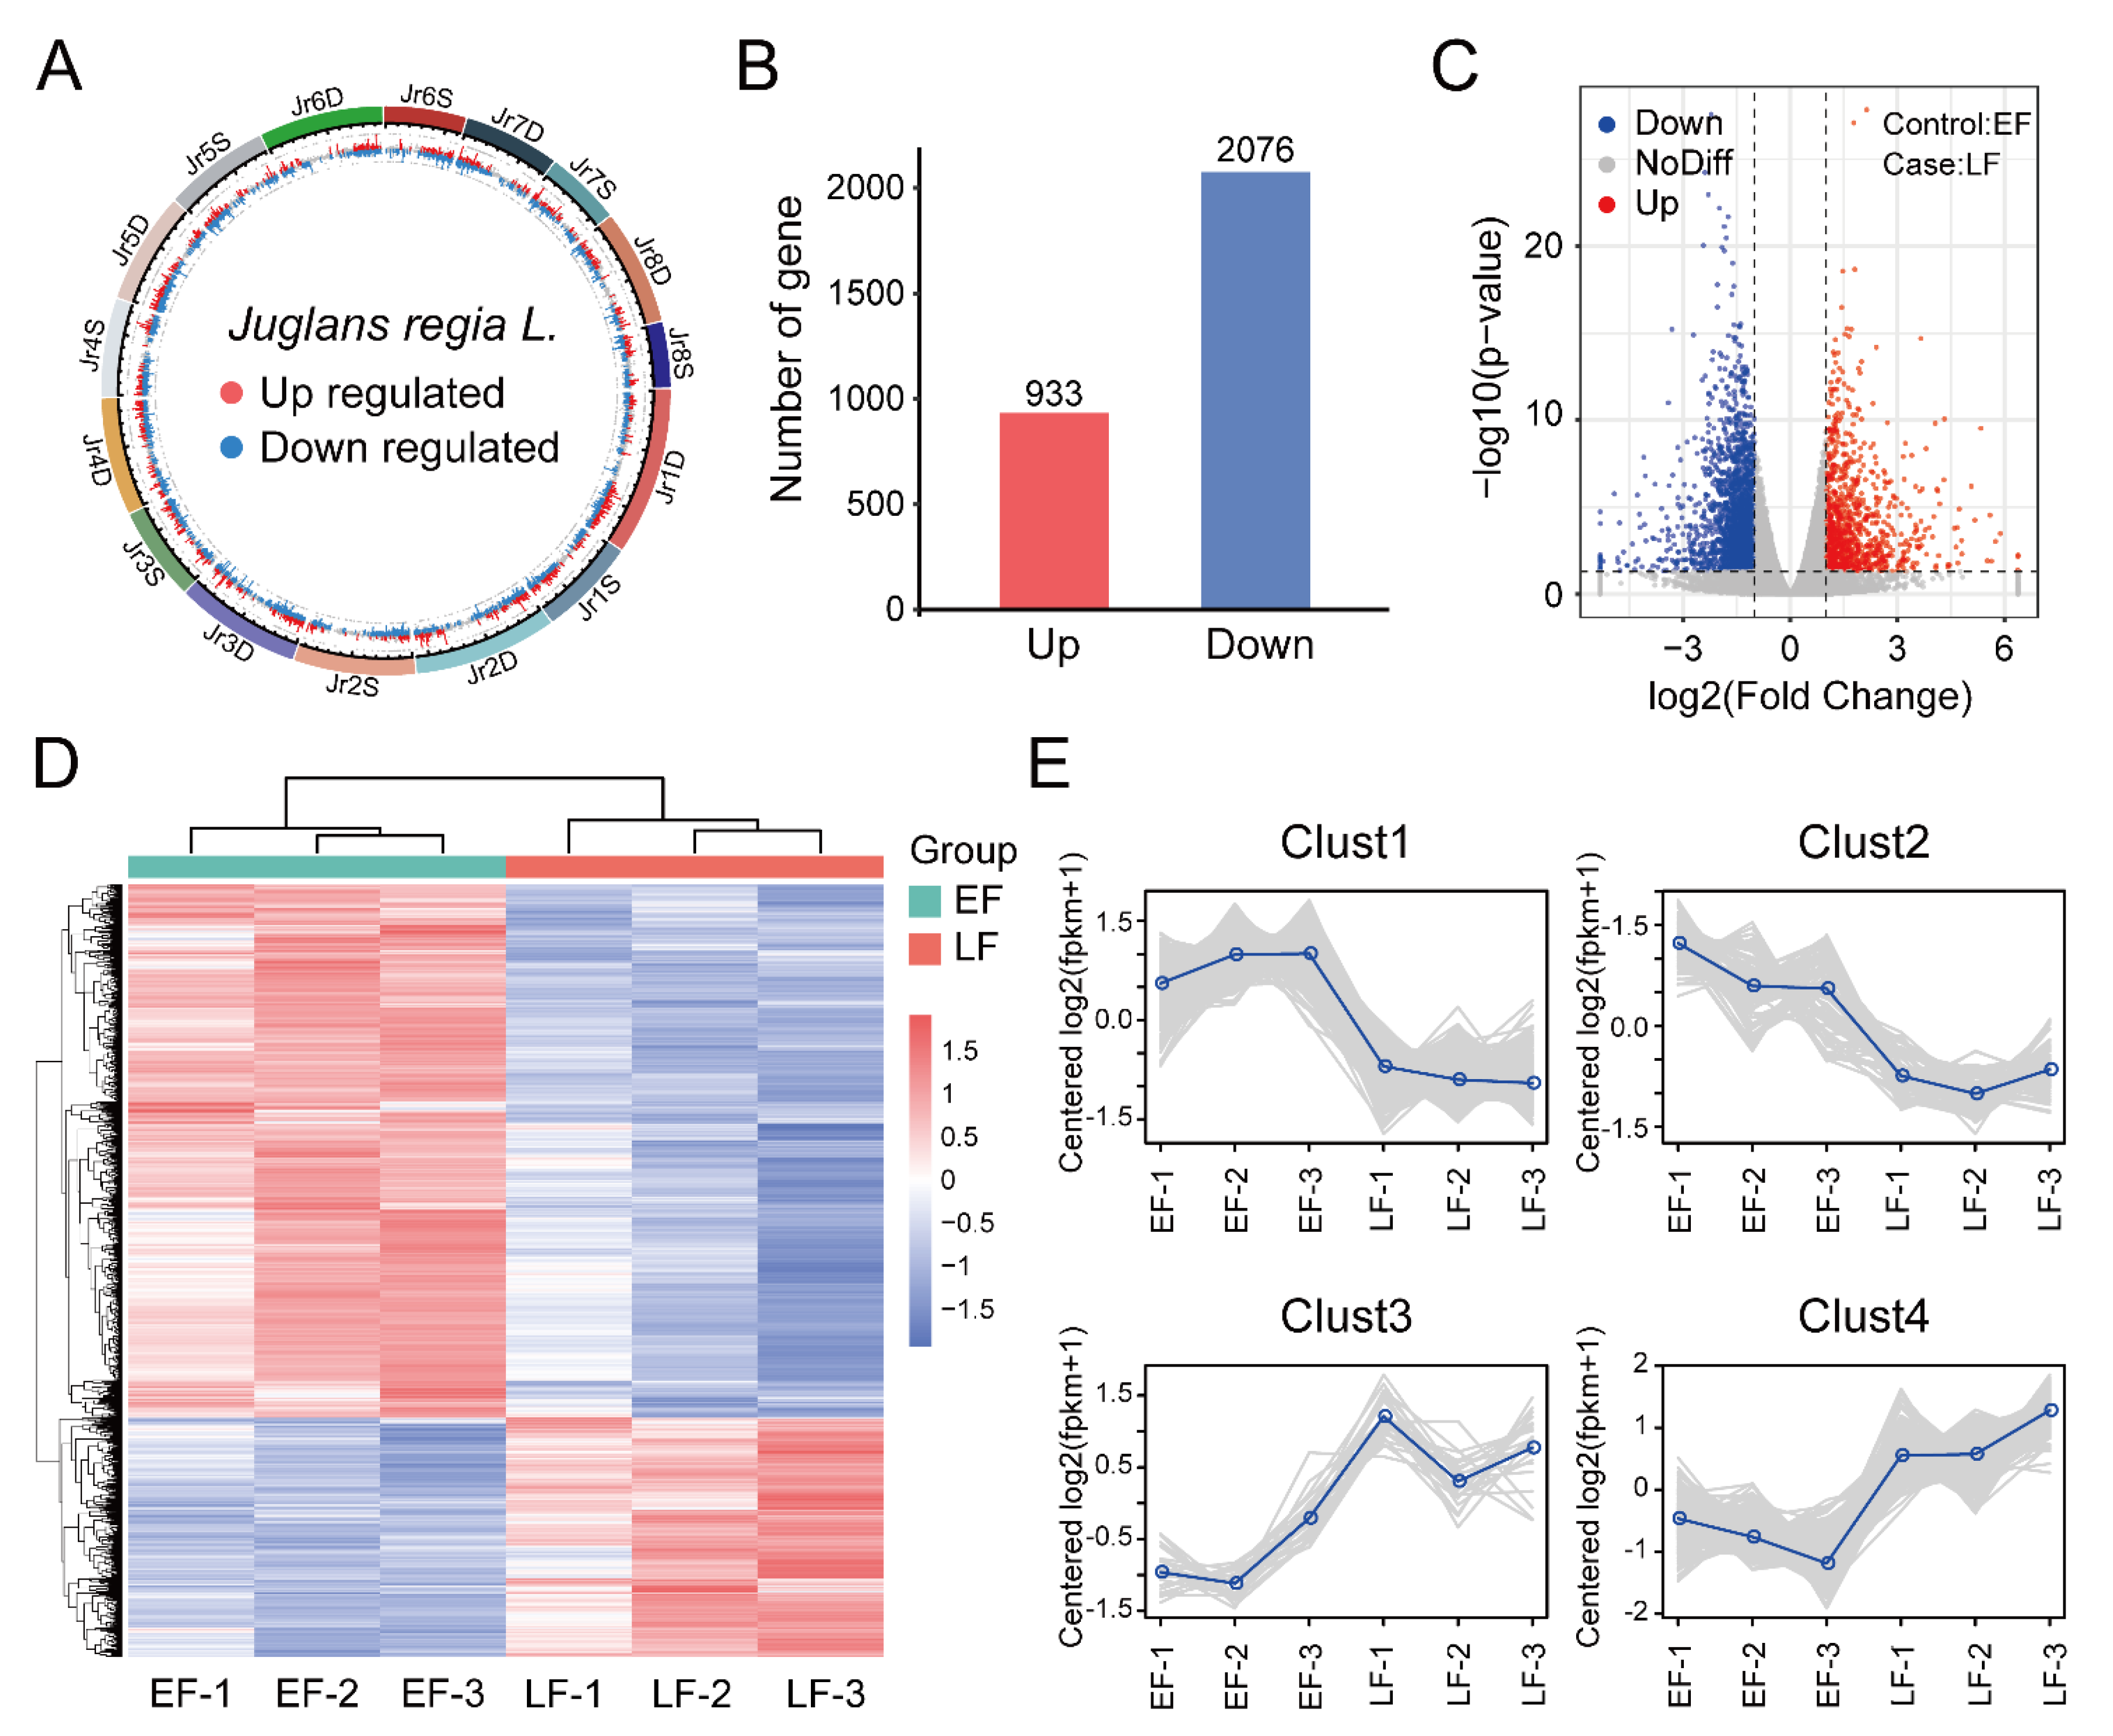
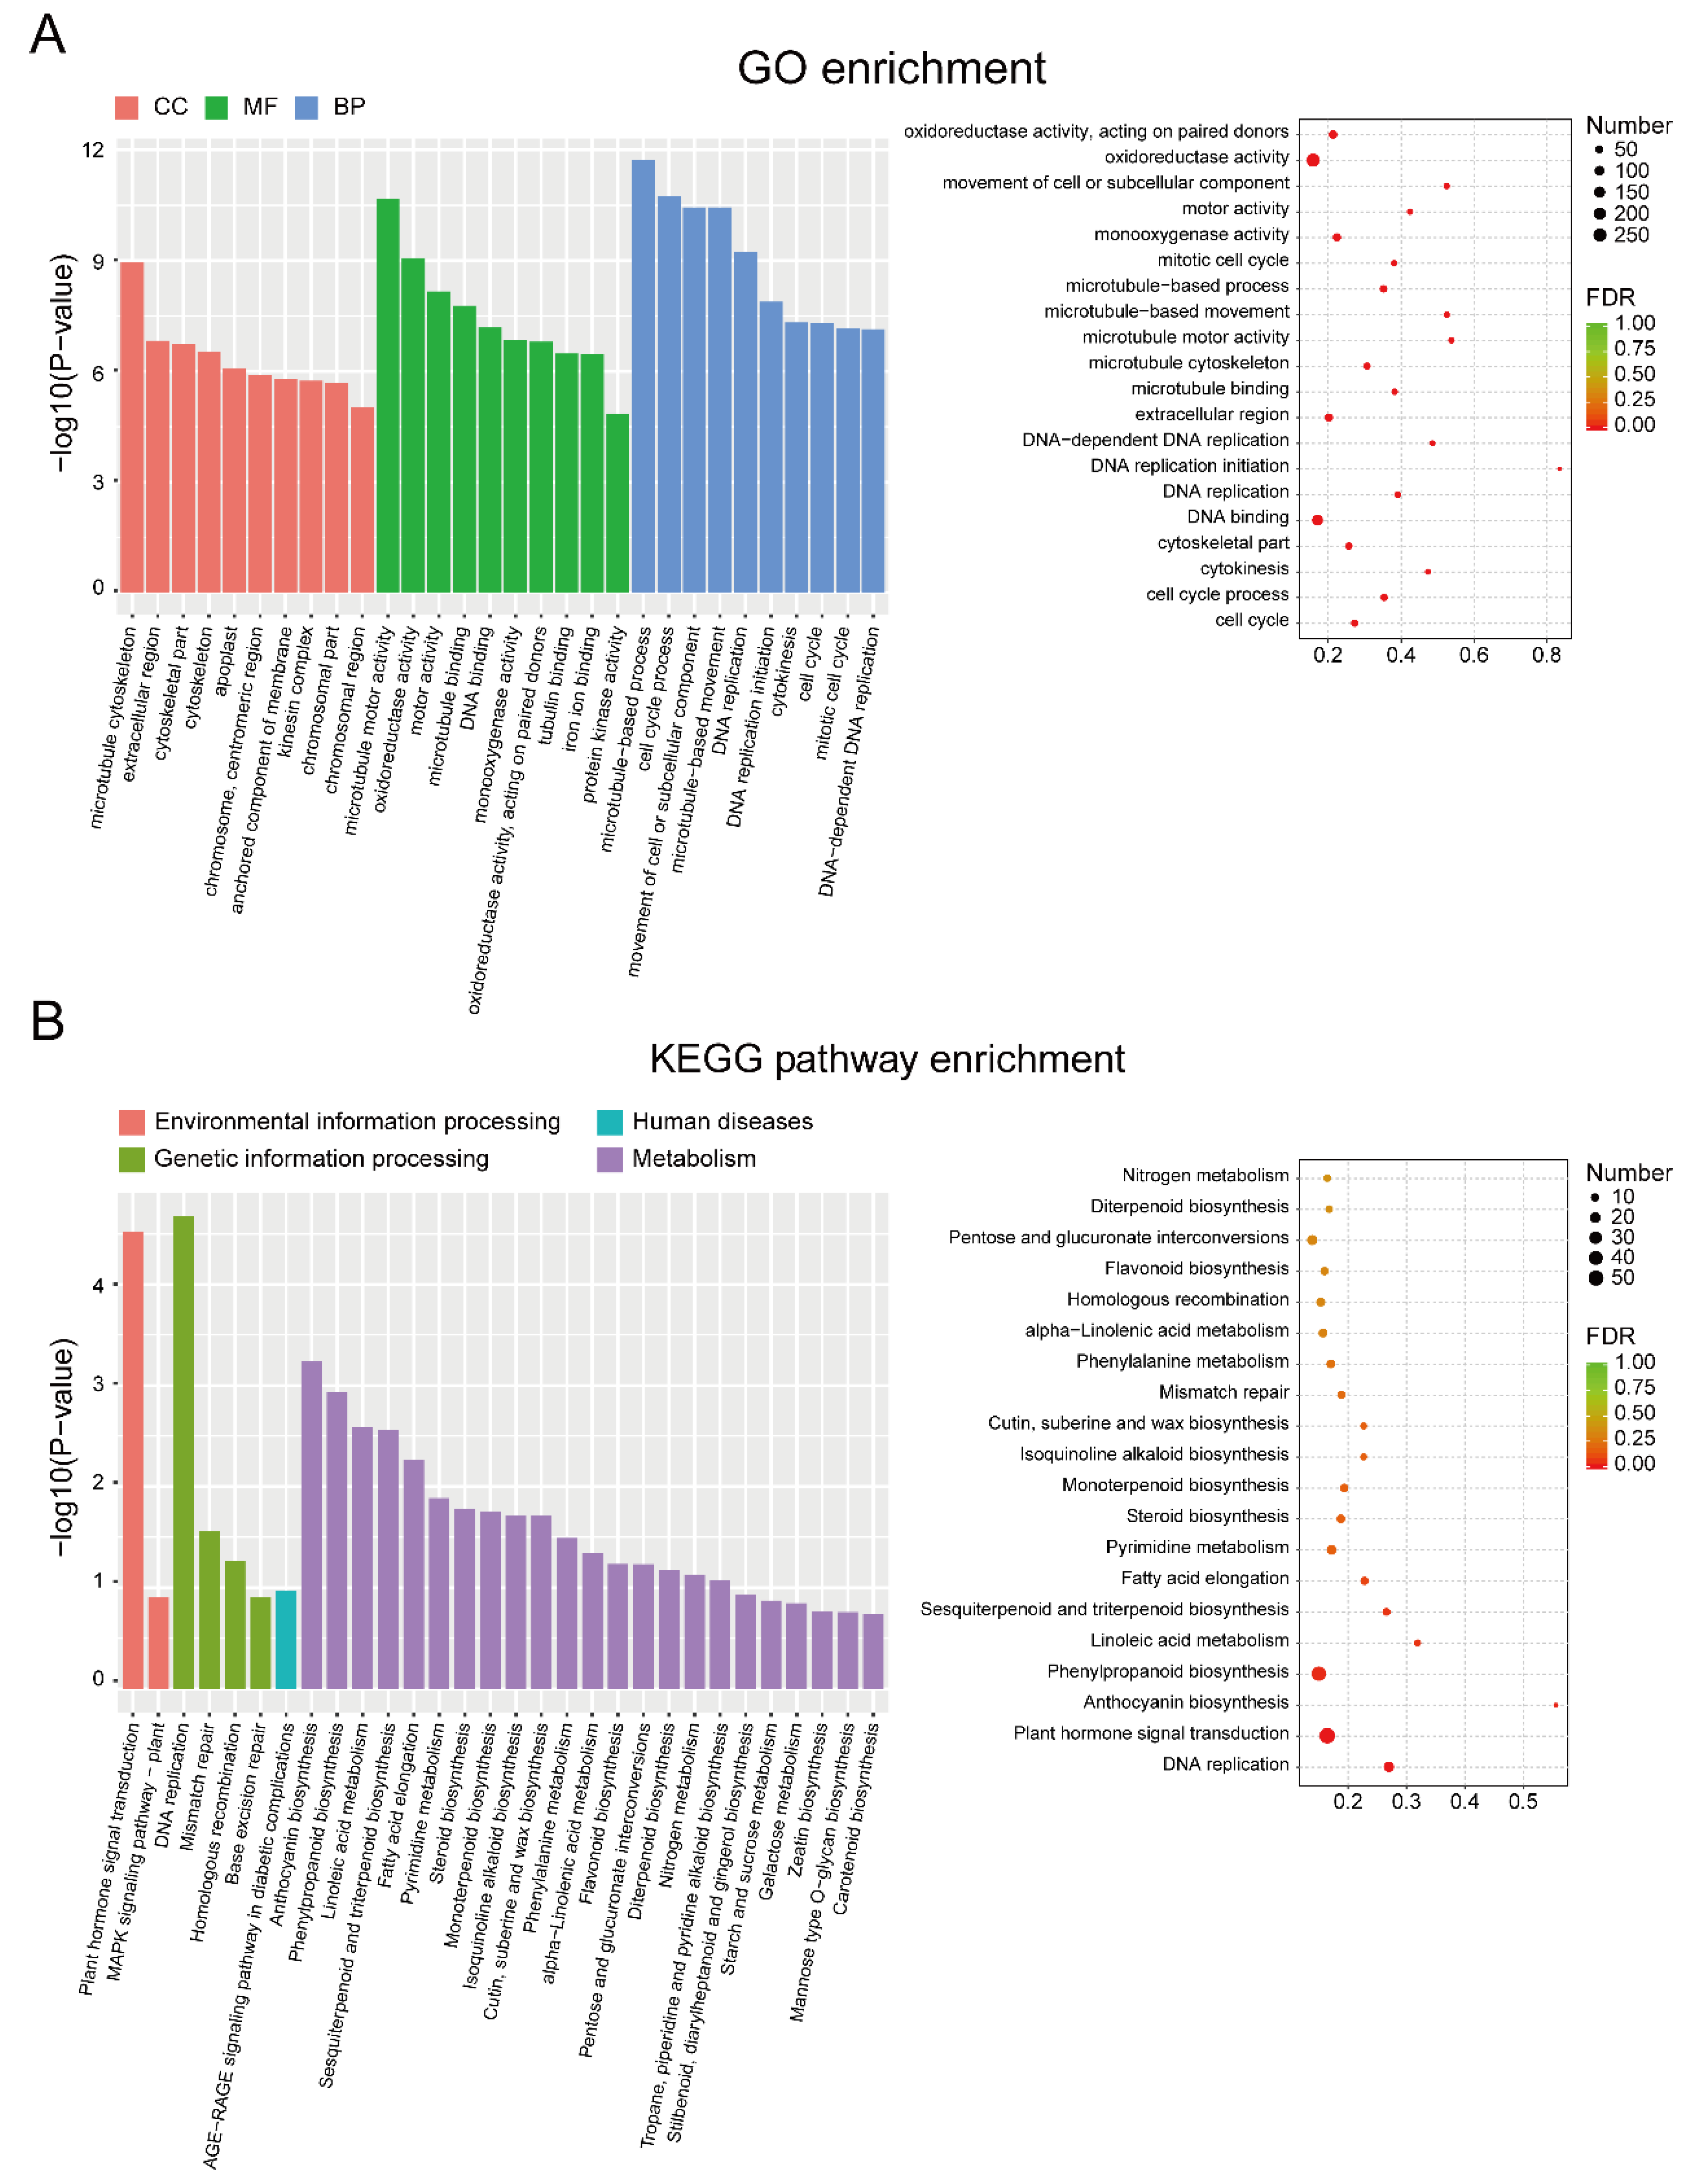
3.2. Identification and Enrichment Analysis of DEGs between EF and LF Walnut Varieties

A total of 3009 genes were identified as significant DEGs between the EF and LF samples, 933 of which were upregulated (accounting for 31%) and 2076 of which were downregulated (accounting for 69%) (Figure 2A–E). We visualized the locations of these DEGs among all chromosomes using a circos plot (Figure 2A) and directly show gene expression levels with a volcano plot (Figure 2C) and a heatmap (Figure 2D).
To determine the functions of the identified DEGs, we performed a GO analysis. Significant GO terms were categorized into three main groups: biological processes, cellular components, and molecular functions (Figure 3A). In the biological process category, ‘microtubule cytoskeleton’ was the most highly enriched term. In the molecular function category, ‘microtubule motor activity’ and ‘oxidoreductase activity’ were the two most highly enriched terms. In the cellular component category, there were five enriched terms, of which ‘microtubule-based process’ was the most significantly enriched, followed by ‘cell cycle process’, ‘movement of cell or subcellular component’, and ‘microtubule-based movement’. We further selected the top 20 terms with the smallest FDR values, and most of the terms were found to be highly relevant to the microtubule and cytoskeleton. Four DNA replication-associated terms and two cell cycle-associated terms were shown to be also enriched. These results indicate that the DEGs identified are associated with growth and development, likely reflecting the differing regulation of plant development and flowering time between the EF and LF offspring walnuts.
We next used the KEGG biochemical pathway analysis [27] to further investigate DEG functions. All DEGs were mapped to terms in the KEGG database and then filtered with a cutoff of p < 0.05 to identify significantly enriched terms. DEGs annotated as being involved in ‘Plant hormone signal transduction’, ‘DNA replication’, ‘Anthocyanin biosynthesis’, and ‘Phenylpropanoid biosynthesis’ were the most significantly enriched (Figure 3B), suggesting that these genes may function in walnut plant development.

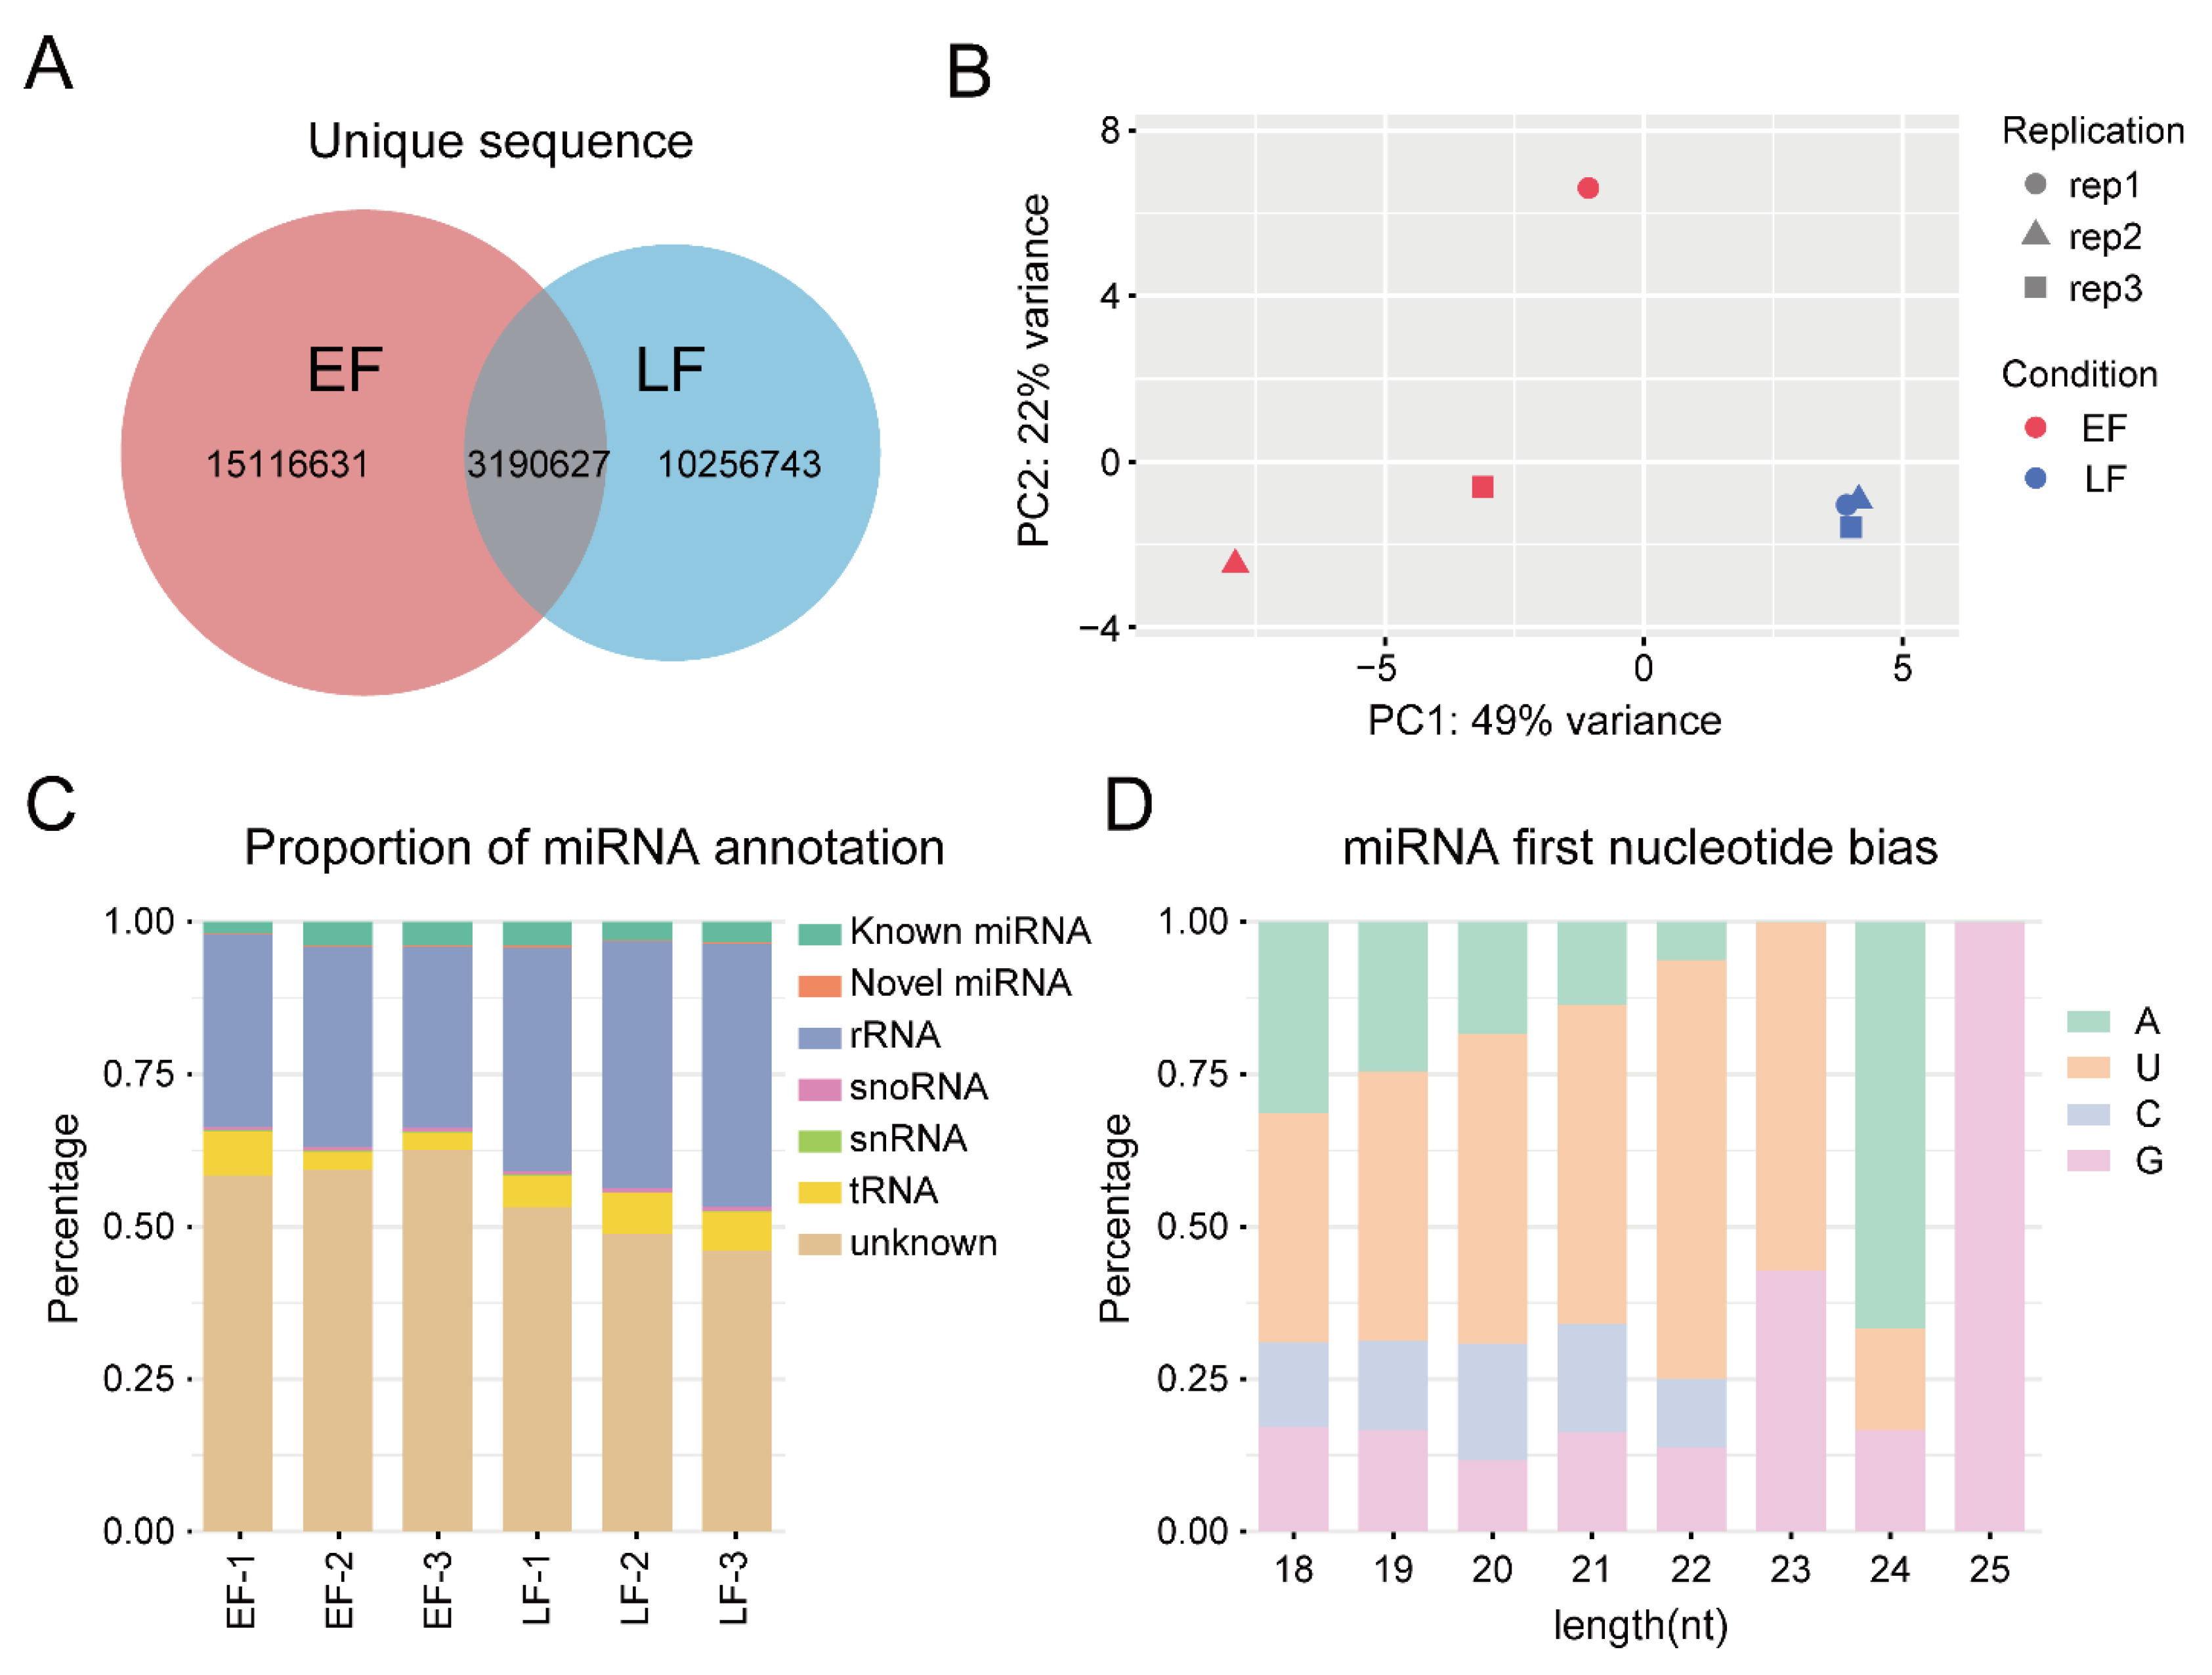
3.3. miRNA Sequencing and Data Analysis

miRNA was extracted from six samples (EF and LF walnut flower buds, each with three biological replicates) and sequenced, yielding a total of 91.98 Mb of sequenced data points. These raw data sequences have been submitted to the GEO under the accession number GSE193061. Only reads that were 18 to 30 bp in length were used in subsequent analyses (Figure 4A). Two PCs explained 71.0% of the total sample variance, and the three biological replicates of each variety had very high levels of replicability (Figure 4B). Clean reads were mapped to ribosomal RNA (rRNA), transfer RNA (tRNA), small nucleolar RNA (snoRNA), and small nuclear RNA (snRNA) sequences (Figure 4C), and then the remaining reads were aligned to the walnut genome. miRNAs from 18–23 bp had a first nucleotide bias towards U, whereas the bias was for A and G in 24 and 25 bp miRNAs, respectively (Figure 4D). TPM values were calculated for each miRNA, and a density analysis was also performed (Figure 5A). The heatmap (Figure 5B) directly shows the Pearson correlation coefficients between samples and again indicates a high level of repeatability among the biological replicates of each sample, consistent with the PCA results.
Using FC > 2 and adjusted p-value < 0.05 as cutoff values, 27 miRNAs were classified as upregulated and 18 miRNAs were classified as downregulated (Figure 5C–E; Table S3). miRNA expression cluster analysis (Figure S1) and GO and KEGG function analyses were also performed (Figure S2). The top 10 most highly enriched GO terms in each category are shown in Figure 5F and Figure S2A, and the most enriched KEGG terms are shown in Figure 5G and Figure S2B.

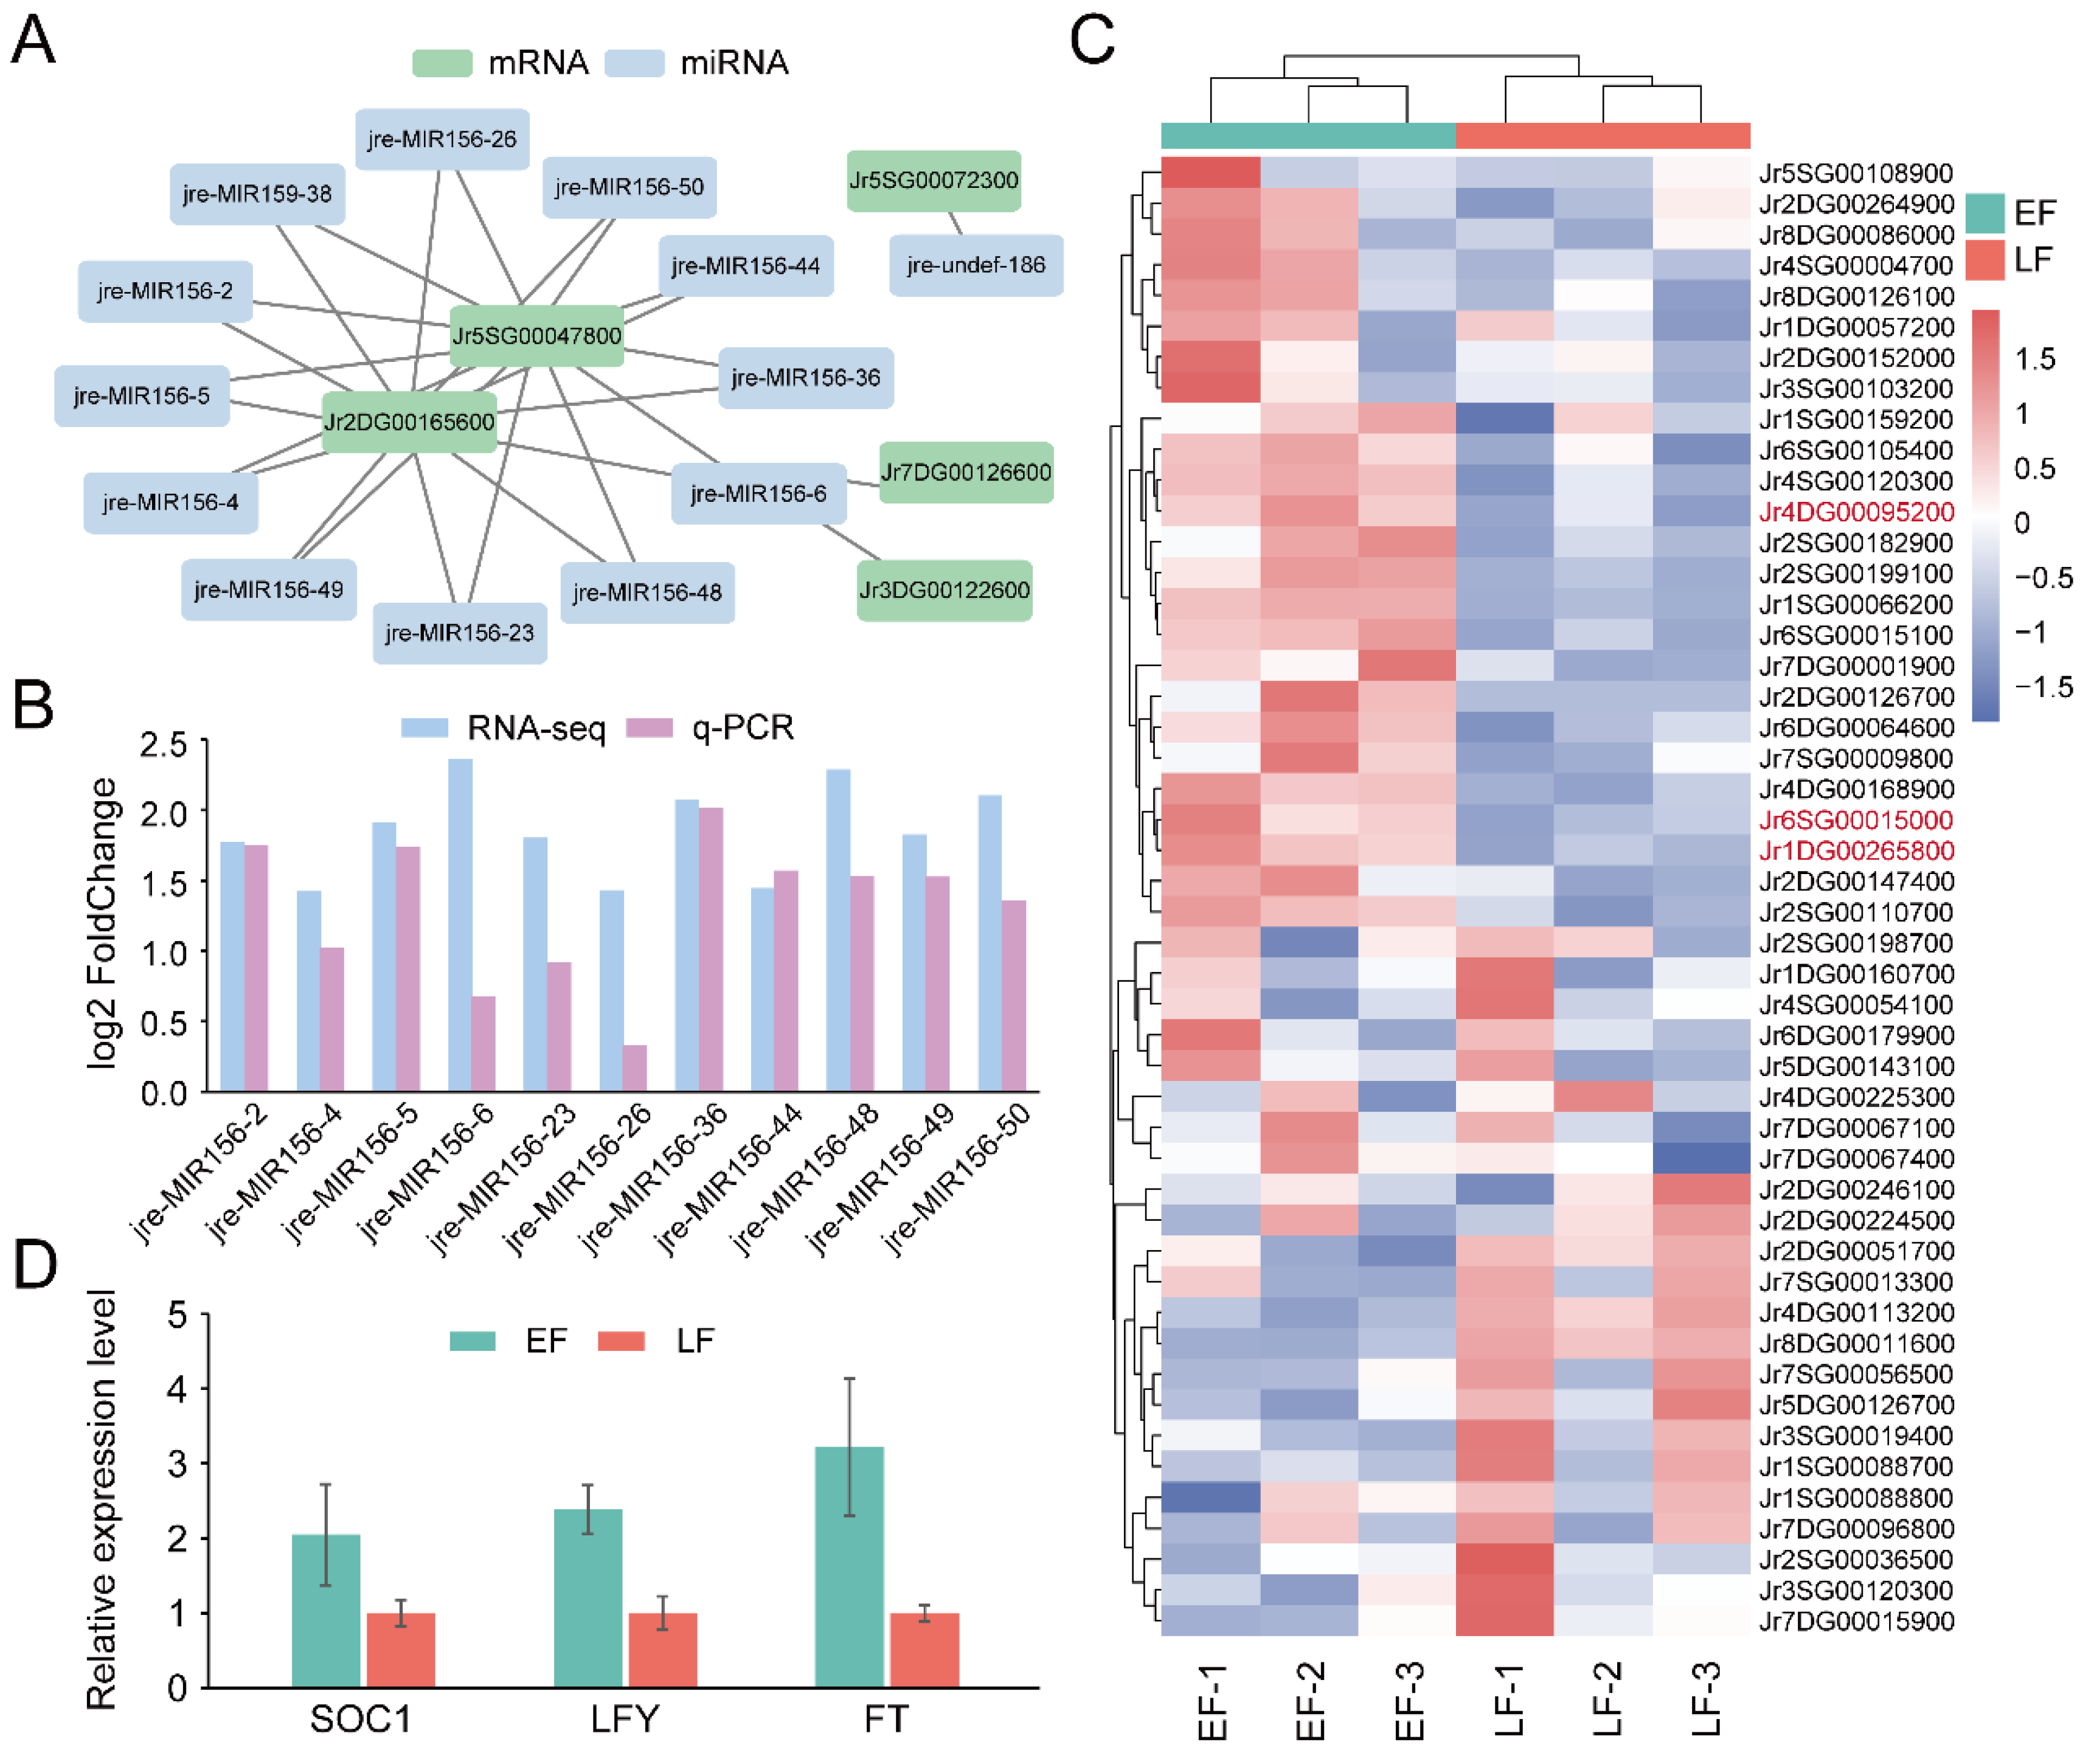
3.4. Identification of Genes and miRNAs Associated with Flowering Time

To demonstrate the regulatory network between miRNAs and mRNAs, miRNA target genes were predicted. We constructed an interaction network between differentially expressed miRNAs and DEGs (Figure 6A) based on the predicted results, and the miRNAs in the jre-MIR156 family were verified using qRT-PCR (Figure 6B). We collected the gene list including the flowering genes and homologous genes of flowering genes in Arabidopsis thaliana, visualized it with a heatmap (Figure 6C), and validated gene expression levels by comparing results from qRT-PCR and RNA-Seq (Figure S3). A GO enrichment analysis was also performed (Figure S4).
In Arabidopsis, the regulation of the flowering time involves a comprehensive network, in which FT [9,29] is a key hub gene that promotes flowering. LFY (floral meristem identity control protein LEAFY) [30] is a transcriptional regulator that plays a regulatory role in flowering. SOC1 (AGAMOUS-like 20) [31] acts downstream of FT and controls flowering. We validated the expression of SOC1 (Jr1DG00265800), LFY (Jr6SG00015000), and FT (Jr4DG00095200) with qRT-PCR, and found that the three genes were more highly expressed in the EF than in the LF walnut variety (Figure 6D). These results suggest that these candidate genes play vital roles in the regulation and promotion of flowering in the EF walnut variety.

4. Discussion

In woody horticultural plants (fruit trees), the early-flowering/precocious trait is desirable because it permits early fruit setting and timely harvest. The selection of early-flowering walnut cultivars may increase or stabilize production, and some walnut genotypes originating from central Asia (including Xinjiang province) display an early flowering phenotype [32]. In vitro propagation of these EF walnut varieties and observations of flower bud formation has confirmed the EF phenotype [33,34,35]. The identification of genetic mechanisms underlying the modulation of flowering time can contribute to walnut breeding goals by promoting fruit production [20] and aids in the selection of lines to study the genetic cues controlling flowering in woody perennials more broadly.
Currently, in walnut varieties, very little is known about the signals that underlie the transition between the juvenile and adult phases. Recent studies have identified flowering-related genes associated with this transition in walnut trees [21,22]. Remarkably, transcriptome profiling (RNA-seq) has revealed thirty-one DEGs associated with this floral transition in J. regia [22]. However, that study performed a RNA-seq analysis that lacked a high-quality walnut reference genome. Thanks to technology advances, a walnut reference genome has been released with the new version [23], which allowed us to easily and conveniently identify profiles of DEGs and differentially expressed miRNAs associated with the floral transition. For example, with a high-quality walnut reference genome, it was possible to mark all DEGs and differentially expressed miRNAs as special location IDs in our study (Tables S2 and S3). Moreover, our study performed RNA-seq and microRNA-seq followed by a bulk segregant analysis (BSA) of the F1 offspring population obtained from a bred EF walnut ‘Xingwen81’ and a local LF walnut cultivar [22].
Recently, epigenetic factors have been a major driver for understanding the mechanisms associated with floral transition [1]. For example, various histone modifications have been revealed as being associated with the regulation of the flowering time in model plants [5,36,37]. In woody plants, it has been shown that the complex regulatory networks associated with floral transition are controlled by epigenetic mechanisms [38,39], implying that specific genes and epigenetic mechanisms have essential roles in Xinjiang precocious walnuts. Thus, future research will focus on identifying the functional impacts of these DEGs and miRNAs and investigating the chromatin states of the candidate genes.
In conclusion, we profiled differentially expressed genes and miRNAs associated with the floral transition in the Xinjiang EF walnut. Using RNA-Seq and validating the data with qRT-PCR analyses, we found that FT, SOC1, and LFY are highly expressed in the EF walnut variety. We additionally identified a set of miRNAs associated with the floral transition. Together, these results not only lay the foundation for further studies into the regulation of the juvenile–adult phase change but could also contribute to the development of walnut breeding programs for selecting EF germplasm.

Supplementary Materials

The following are available online at www.mdpi.com/article/10.3390/horticulturae8020136/s1. Figure S1: miRNA expression trend analysis. Figure S2: Bubble diagram of the miRNA enrichment analysis using GO (A) and KEGG (B). Figure S3: Validation of candidate genes with qRT-PCR. Figure S4: GO enrichment analysis of candidate genes. Table S1: List of primers used in this study. Table S2: DEGs between the EF and LF walnut varieties by RNA-seq. Table S3: Differentially expressed miRNAs between the EF and LF walnut varieties by microRNA-seq.

Author Contributions

Conceptualization, Z.L.; methodology, Q.J. and W.C.; software, W.C.; validation, R.M. and F.S.; formal analysis, R.Z. and C.W.; investigation, Q.Z.; resources, Q.J.; data curation, Q.J.; writing—original draft preparation, Q.J.; writing—review and editing, Z.L.; visualization, W.C.; supervision, Z.L.; project administration, Q.J. and Z.L.; funding acquisition, Q.J. and Z.L. All authors have read and agreed to the published version of the manuscript.

Funding

This research was funded by the Major Scientific and Technological Projects of XPCC (2017DB006) and the National Natural Science Foundation of China (31260463, 32160698).

Data Availability Statement

The raw data sequences have been submitted to the Gene Expression Omnibus (GEO) database of the National Center for Biotechnology Information (NCBI) under the accession number GSE193061.

Acknowledgments

The authors thank Pingxian Zhang (from Huazhong Agricultural University) for his technical support and improvement, and kind help for revision of this manuscript.

Conflicts of Interest

The authors declare no conflict of interest.

References

  1. He, Y. Chromatin regulation of flowering. Trends Plant Sci. 2012, 17, 556–562. [Google Scholar] [CrossRef] [PubMed]
  2. Conti, L. Hormonal control of the floral transition: Can one catch them all? Dev. Biol. 2017, 430, 288–301. [Google Scholar] [CrossRef] [PubMed]
  3. He, Y. Control of the transition to flowering by chromatin modifications. Mol. Plant 2009, 2, 554–564. [Google Scholar] [CrossRef]
  4. Bouché, F.; Lobet, G.; Tocquin, P.; Périlleux, C. FLOR-ID: An interactive database of flowering-time gene networks in Arabidopsis thaliana. Nucleic Acids Res. 2016, 44, D1167–D1171. [Google Scholar] [CrossRef] [PubMed] [Green Version]
  5. Zhang, P.; Li, X.; Wang, Y.; Guo, W.; Chachar, S.; Riaz, A.; Geng, Y.; Gu, X.; Yang, L. PRMT6 physically associates with nuclear factor Y to regulate photoperiodic flowering in Arabidopsis. aBIOTECH 2021, 2, 403–414. [Google Scholar] [CrossRef]
  6. Gu, X.; Wang, Y.; He, Y. Photoperiodic regulation of flowering time through periodic histone deacetylation of the florigen gene FT. PLoS Biol. 2013, 11, e1001649. [Google Scholar] [CrossRef]
  7. Helliwell, C.A.; Wood, C.C.; Robertson, M.; James Peacock, W.; Dennis, E.S. The Arabidopsis FLC protein interacts directly in vivo with SOC1 and FT chromatin and is part of a high-molecular-weight protein complex. Plant J. 2006, 46, 183–192. [Google Scholar] [CrossRef]
  8. Corbesier, L.; Vincent, C.; Jang, S.; Fornara, F.; Fan, Q.; Searle, I.; Giakountis, A.; Farrona, S.; Gissot, L.; Turnbull, C.; et al. FT protein movement contributes to long-distance signaling in floral induction of Arabidopsis. Science 2007, 316, 1030–1033. [Google Scholar] [CrossRef] [Green Version]
  9. Mathieu, J.; Warthmann, N.; Küttner, F.; Schmid, M. Export of FT protein from phloem companion cells is sufficient for floral induction in Arabidopsis. Curr. Biol. 2007, 17, 1055–1060. [Google Scholar] [CrossRef] [Green Version]
  10. Searle, I.; He, Y.; Turck, F.; Vincent, C.; Fornara, F.; Kröber, S.; Amasino, R.A.; Coupland, G. The transcription factor FLC confers a flowering response to vernalization by repressing meristem competence and systemic signaling in Arabidopsis. Genes Dev. 2006, 20, 898–912. [Google Scholar] [CrossRef] [Green Version]
  11. Wang, J.W.; Czech, B.; Weigel, D. miR156-regulated SPL transcription factors define an endogenous flowering pathway in Arabidopsis thaliana. Cell 2009, 138, 738–749. [Google Scholar] [CrossRef] [PubMed] [Green Version]
  12. Wu, G.; Park, M.Y.; Conway, S.R.; Wang, J.W.; Weigel, D.; Poethig, R.S. The sequential action of miR156 and miR172 regulates developmental timing in Arabidopsis. Cell 2009, 138, 750–759. [Google Scholar] [CrossRef] [PubMed] [Green Version]
  13. Khan, M.R.G.; Ai, X.Y.; Zhang, J.Z. Genetic regulation of flowering time in annual and perennial plants. Wiley Interdiscip. Rev. RNA 2014, 5, 347–359. [Google Scholar] [CrossRef] [PubMed]
  14. Kemi, U.; Niittyvuopio, A.; Toivainen, T.; Pasanen, A.; Quilot-Turion, B.; Holm, K.; Lagercrantz, U.; Savolainen, O.; Kuittinen, H. Role of vernalization and of duplicated FLOWERING LOCUS C in the perennial Arabidopsis lyrata. N. Phytol. 2013, 197, 323–335. [Google Scholar] [CrossRef]
  15. Wang, R.; Farrona, S.; Vincent, C.; Joecker, A.; Schoof, H.; Turck, F.; Alonso-Blanco, C.; Coupland, G.; Albani, M.C. PEP1 regulates perennial flowering in Arabis alpina. Nature 2009, 459, 423–427. [Google Scholar] [CrossRef] [Green Version]
  16. Zhang, J.Z.; Li, Z.M.; Mei, L.; Yao, J.L.; Hu, C.G. PtFLC homolog from trifoliate orange (Poncirus trifoliata) is regulated by alternative splicing and experiences seasonal fluctuation in expression level. Planta 2009, 229, 847–859. [Google Scholar] [CrossRef]
  17. An, H.; Jiang, S.; Zhang, J.; Xu, F.; Zhang, X. Comparative transcriptomic analysis of differentially expressed transcripts associated with flowering time of loquat (Eriobotya japonica lindl.). Horticulturae 2021, 7, 171. [Google Scholar] [CrossRef]
  18. Zhou, C.M.; Zhang, T.Q.; Wang, X.; Yu, S.; Lian, H.; Tang, H.; Feng, Z.Y.; Zozomova-Lihová, J.; Wang, J.W. Molecular basis of age-dependent vernalization in Cardamine flexuosa. Science 2013, 340, 1097–1100. [Google Scholar] [CrossRef]
  19. Sheng, F.; Hu, B.; Jin, Q.; Wang, J.; Wu, C.; Luo, Z. The analysis of phenolic compounds in walnut husk and pellicle by UPLC-Q-Orbitrap HRMS and HPLC. Molecules 2021, 26, 3013. [Google Scholar] [CrossRef]
  20. Bernard, A.; Lheureux, F.; Dirlewanger, E. Walnut: Past and future of genetic improvement. Tree Genet. Genomes 2018, 14, 1. [Google Scholar] [CrossRef] [Green Version]
  21. Quan, S.; Niu, J.; Zhou, L.; Xu, H.; Ma, L.; Qin, Y. Stages identifying and transcriptome profiling of the floral transition in Juglans regia. Sci. Rep. 2019, 9, 7092. [Google Scholar] [CrossRef] [PubMed] [Green Version]
  22. Hassankhah, A.; Rahemi, M.; Ramshini, H.; Sarikhani, S.; Vahdati, K. Flowering in Persian walnut: Patterns of gene expression during flower development. BMC Plant Biol. 2020, 20, 136. [Google Scholar] [CrossRef] [PubMed] [Green Version]
  23. Marrano, A.; Britton, M.; Zaini, P.A.; Zimin, A.V.; Workman, R.E.; Puiu, D.; Bianco, L.; Di Pierro, E.A.; Allen, B.J.; Chakraborty, S.; et al. High-quality chromosome-scale assembly of the walnut (Juglans regia L.) reference genome. Gigascience 2020, 9, giaa050. [Google Scholar] [CrossRef] [PubMed]
  24. Love, M.I.; Huber, W.; Anders, S. Moderated estimation of fold change and dispersion for RNA-Seq data with DESeq2. Genome Biol. 2014, 15, 550. [Google Scholar] [CrossRef] [Green Version]
  25. Friedländer, M.R.; MacKowiak, S.D.; Li, N.; Chen, W.; Rajewsky, N. MiRDeep2 accurately identifies known and hundreds of novel microRNA genes in seven animal clades. Nucleic Acids Res. 2012, 40, 37–52. [Google Scholar] [CrossRef]
  26. Carbon, S.; Douglass, E.; Dunn, N.; Good, B.; Harris, N.L.; Lewis, S.E.; Mungall, C.J.; Basu, S.; Chisholm, R.L.; Dodson, R.J.; et al. The Gene Ontology resource: 20 years and still GOing strong. Nucleic Acids Res. 2019, 47, D330–D338. [Google Scholar]
  27. Kanehisa, M.; Furumichi, M.; Tanabe, M.; Sato, Y.; Morishima, K. KEGG: New perspectives on genomes, pathways, diseases and drugs. Nucleic Acids Res. 2017, 45, D353–D361. [Google Scholar] [CrossRef] [Green Version]
  28. Xiaochen, B.; Wang, S. TargetFinder: A software for antisense oligonucleotide target site selection based on MAST and secondary structures of target mRNA. Bioinformatics 2005, 21, 1401–1402. [Google Scholar]
  29. Wigge, P.A. FT, A mobile developmental signal in plants. Curr. Biol. 2011, 21, R374–R378. [Google Scholar] [CrossRef] [Green Version]
  30. Yamaguchi, N. LEAFY, a pioneer transcription factor in plants: A mini-review. Front. Plant Sci. 2021, 12, 1274. [Google Scholar] [CrossRef]
  31. Kimura, Y.; Aoki, S.; Ando, E.; Kitatsuji, A.; Watanabe, A.; Ohnishi, M.; Takahashi, K.; Inoue, S.I.; Nakamichi, N.; Tamada, Y.; et al. A flowering integrator, SOC1, affects stomatal opening in Arabidopsis thaliana. Plant Cell Physiol. 2015, 56, 640–649. [Google Scholar] [CrossRef] [PubMed] [Green Version]
  32. Vahdati, K.; Mohseniazar, M. Early bearing genotypes of walnut: A suitable material for breeding and high density orchards. Acta Horti. 2016, 1139, 101–105. [Google Scholar] [CrossRef]
  33. Breton, C.; Cornu, D.; Chriqui, D.; Sauvanet, A.; Capelli, P.; Germain, E.; Jay-Allemand, C. Somatic embryogenesis, micropropagation and plant regeneration of “Early Mature” walnut trees (Juglans regia) that flower in vitro. Tree Physiol. 2004, 24, 425–435. [Google Scholar] [CrossRef] [PubMed] [Green Version]
  34. Chang, Y.Y.; Zhang, Q.X.; Song, X.B.; Zha, W.W.; Pei, D. Analysis on key factors affecting somatic embryogenesis and plant regeneration in precocious walnuts. For. Res. 2019, 32, 34–39. [Google Scholar]
  35. Vahdati, K.; Razaee, R.; Mirmasoomi, M. Micropropagation of some dwarf and early mature walnut genotypes. Biotechnology 2009, 8, 171–175. [Google Scholar] [CrossRef]
  36. Geng, Y.; Zhang, P.; Liu, Q.; Wei, Z.; Riaz, A.; Chachar, S.; Gu, X. Rice homolog of Sin3-associated polypeptide 30, OsSFL1, mediates histone deacetylation to regulate flowering time during short days. Plant Biotechnol. J. 2020, 18, 325–327. [Google Scholar] [CrossRef] [PubMed]
  37. Li, Z.; Fu, X.; Wang, Y.; Liu, R.; He, Y. Polycomb-mediated gene silencing by the BAH–EMF1 complex in plants. Nat. Genet. 2018, 50, 1254–1261. [Google Scholar] [CrossRef]
  38. Liao, X.; Li, Y.; Hu, Z.; Lin, Y.; Zheng, B.; Ding, J. Poplar acetylome profiling reveals lysine acetylation dynamics in seasonal bud dormancy release. Plant. Cell Environ. 2021, 44, 1830–1845. [Google Scholar] [CrossRef]
  39. Agustí, M.; Mesejo, C.; Muñoz-Fambuena, N.; Vera-Sirera, F.; de Lucas, M.; Martínez-Fuentes, A.; Reig, C.; Iglesias, D.J.; Primo-Millo, E.; Blázquez, M.A. Fruit-dependent epigenetic regulation of flowering in Citrus. New Phytol. 2020, 225, 367–384. [Google Scholar] [CrossRef] [Green Version]
Figure 1. RNA-Seq data analyses. (A) Principal component analysis (PCA) of the six samples; (B) Heatmap of the Pearson correlation coefficient between samples; (C) The number of protein coding genes in each RNA-Seq sample; (D) The number of genes in each sample expressed at different levels; (E) Density plot showing overall gene expression levels for each sample.
Horticulturae 08 00136 g001
Figure 2. Differentially expressed gene (DEG) identification. (A) The distribution of DEGs across the whole genome at the chromosome scale; (B) DEGs categorized as up- or downregulated genes; (C) The volcano plot displays genes classified as upregulated (red dots), downregulated (blue dots), or having no difference in expression (grey dots) between the two sample types. Dotted lines represent the cutoff value for fold change (FC) > 2 and p < 0.05; (D) Heatmap, where each row represents one DEG and each column represents one sample. Gene expression levels were normalized by Z-scores; (E) Gene expression trend analysis. Genes were divided into four groups using the general trends of gene expression in different samples.
Horticulturae 08 00136 g002
Figure 3. The functional enrichment of differentially expressed genes using GO and KEGG classification. (A) A histogram (left) and bubble diagram (right) showing the significantly enriched GO terms, which were divided into biological processes (BP), molecular functions (MF), and cellular components (CC); (B) A histogram (left) and bubble diagram (right) showing the significantly enriched KEGG terms, which were divided into four groups: environmental information processing, human diseases, genetic information processing, and metabolism.
Horticulturae 08 00136 g003
Figure 4. Overview of the miRNA-Seq data. (A) Comparison of unique sequences between early-flowering and late-flowering walnut varieties; (B) PCA of miRNA for the six samples; (C) miRNA category annotations; (D) First nucleotide bias analysis for miRNAs of different lengths.
Horticulturae 08 00136 g004
Figure 5. Identification and functional enrichment analyses of differentially expressed miRNAs. (A) Density plot showing overall miRNA expression levels in each sample; (B) Heatmap showing Pearson correlation coefficients between samples; (C) Total number of up- and downregulated miRNAs between the EF and LF varieties; (D) The volcano plot displays miRNAs classified as upregulated (red dots), downregulated (blue dots), or having no difference in expression (grey dots) between the two sample types. Dotted lines represent the cutoff value for fold change (FC) > 2 and p < 0.05; (D) Heatmap, where each row represents one miRNA and each column represents one sample. miRNA expression levels were normalized by Z-scores; (E) Heatmap of differentially expressed miRNAs, where each row represents one miRNA and each column represents one sample. miRNA expression levels were normalized by Z-score; (F) Histogram showing significantly enriched GO terms, which were divided into biological processes (BP), molecular functions (MF), and cellular components (CC); (G) Histogram showing significantly enriched KEGG terms, which were divided into two categories: genetic information processing and metabolism.
Horticulturae 08 00136 g005
Figure 6. Regulation network construction and validation of candidate genes/miRNAs associated with the flowering time. (A) Regulation network of key genes and miRNAs associated with the flowering time; (B) Validation of candidate miRNA expression with qRT-PCR; (C) Heatmap of candidate genes. Gene expression levels were normalized with Z-score. Genes (on the right) shown in red were used for further validation; (D) qRT-PCR validation of expression for key candidate genes that positively regulate the flowering time.
Horticulturae 08 00136 g006
Publisher’s Note: MDPI stays neutral with regard to jurisdictional claims in published maps and institutional affiliations.

