Article

Greater Sunlight Exposure during Early Fruit Development Increases Polyphenol Concentration, Soluble Solid Concentration, and Fruit Mass of Cider Apples

by
Adam Duerr Karl
* and
Gregory Michael Peck
School of Integrative Plant Science, Horticulture Section, Cornell University, Plant Science Building, Ithaca, NY 14853, USA
*
Author to whom correspondence should be addressed.
Horticulturae 2022, 8(11), 993; https://doi.org/10.3390/horticulturae8110993
Submission received: 20 September 2022 / Revised: 20 October 2022 / Accepted: 23 October 2022 / Published: 26 October 2022

Abstract

:
The environmental factors that influence cider apple fruit quality, particularly bitter and astringent polyphenols, are not well understood. Five experiments were conducted to investigate how sunlight affects fruit and juice quality. In three studies, shade cloth was placed over entire trees or individual branches at different phenological stages, durations, and opacities. Influence of canopy microclimate was investigated by harvesting fruit from different sections of the tree canopy. In a final study, opaque paper bags were placed over fruit three weeks after full bloom (WAFB) until harvest. Polyphenol concentrations increased rapidly during the first five WAFB and were diluted as fruit grew larger. At harvest, fruit from unshaded trees had 32% greater total polyphenol concentrations and were 11% larger than trees shaded 1–5 WAFB. Shading branches later in the growing season reduced yield but had a modest and inconsistent reduction on polyphenol concentrations. Juice from fruit harvested from the top of the tree canopy had 33% greater polyphenol concentrations and 14% greater soluble solid concentrations than juice from the interior of the canopy. Bagging fruit had inconsistent impacts on polyphenol concentrations. We hypothesize that there is a source sink relationship between carbohydrate availability and polyphenol synthesis in apple fruit during the early stages of fruit development when most polyphenols are produced. Additionally, greater carbohydrate availability in canopies with greater sunlight exposure resulted in larger fruit and improved juice quality from a cider making perspective.

1. Introduction

To support a cider industry that has grown over ten-fold since 2005 in the United States, cider makers report that they need a greater supply of apples with cider-specific quality attributes, particularly high polyphenol concentrations [1,2]. European cider apple orchards have traditionally been planted using larger rootstocks, with wider, more dense canopies [3]. This is in part to accommodate mechanical harvesting [4]. Fresh-market apples are largely grown in high-density orchards with narrow canopies and dwarfing rootstocks have been designed to increase light exposure within the canopy and thus improve fruit quality [5]. These high-density orchard systems are now also being used for cider apple production in the U.S. [6]. However, many of the increased fruit quality metrics achieved from greater sunlight exposure are less important quality aspects for cider apples: namely, peel color and cosmetic blemishes. It is unclear if greater spur and/or canopy sunlight exposure increases fruit and juice quality from a cider-making perspective, particularly juice polyphenol concentration.
Polyphenols have many functions in plants, but it is thought that flavan-3-ols are produced to defend plants from herbivory by forming peroxides and quinone free radicals in insect digestive tracks and/or by reducing plant tissue nutritional quality by binding to proteins [7,8]. Flavan-3-ol polymers (also known as proanthocyanidins, condensed tannins, or tannins) are functionally defined as polyphenols that bind to and precipitate proteins and other organic compounds [9]. In fermented ciders, polyphenols provide both bitter flavors and astringent mouthfeel. Flavan-3-ol monomers (catechin and epicatechin) and polymers under four subunits long have bitter flavors, while larger units do not have a taste or aroma but provide astringency [10].
How orchard management practices affect cider apple fruit polyphenol synthesis and concentration has been the topic of only a few studies [11,12,13,14]. Most fresh market and processing apple cultivars have very low concentrations of catechins, epicatechins, and flavan-3-ol polymers in both the peel and flesh which is perhaps why these compounds have not been a focus for researchers [15,16]. In fact, human selection has likely favored apples with low flavan-3-ol content because they are more palatable when consumed as fresh fruit and unfermented juice. For example, Kahle et al. (2005) [17] reported flavan-3-ol concentrations under 100 mg/L in apple juice from fresh market and processing cultivars, while apple cultivars selected for fermented cider may have flavan-3-ol concentrations that exceed 2000 mg/L [18].
Studies of fresh market apple production suggest that the year-to-year variability in apple juice polyphenol content may be linked to light interception and carbohydrate availability. For example, apples from more sun exposed sections of the tree canopy are typically larger and have greater soluble solid concentrations than more shaded fruit due to both the greater photosynthetic capacity of the fruit itself and because developing fruit are dependent on carbohydrate resources from the adjacent spur-leaf canopy during cell division phase of fruit development [5,19,20]. Additionally, anthocyanin and flavonol synthesis is heavily regulated by ultraviolet (UV) light exposure, and increased sunlight exposure results in greater red coloration in the peels of red and bi-colored apples and improved marketability of the crop [14,21,22]. However, it is difficult to disentangle the effect of sunlight increasing secondary metabolite concentrations due to increased carbohydrate availability or upregulation of metabolic pathways stimulated by UV exposure. While many of the enzymes in the flavan-3-ol metabolic pathway are light sensitive and shared with anthocyanins and flavonols, their concentrations have not been found to be rate limiting during the first 60 days after full bloom, the period when most flavan-3-ol synthesis occurs [23,24,25].
Among the challenges with growing cider cultivars is that tannin juice concentration has been found to vary dramatically among growing seasons. A study of ‘Dabinett’ and ‘Tremlett’s Bitter’ juice tannin concentrations (as measured by the Löwenthal Permanganate assay) over a ten-year period in Long Ashton, UK revealed that tannin concentrations fluctuated ±50% among years (Lea, unpublished data). Likewise, total polyphenol juice concentrations varied ±25% among four years of a study of high-tannin cider apples grown in coastal and eastern Washington [26]. In fact, in this study the variation among years affected apple total polyphenol concentration more so than the geographic region where the fruit was produced. Seasonal variation is confounded by a lack of understanding about how horticultural management, such as orchard design, tree spacing, and pruning, may affect polyphenol concentration in cider apples. These production practices can all impact light interception, and thus source-sink relationships within the plant.
The goal of our investigations was to understand how sunlight affects apple fruit and juice quality for cider production. We hypothesized that more sun exposed fruit would be larger and have greater polyphenol and soluble solid concentrations. We also hypothesized that fruit shaded earlier in fruit development would have a greater reduction in polyphenol concentrations than those receiving the same amount of shading later in the growing season. Three separate experiments were performed between 2016 and 2018 using differing opacities, durations, and timing of shade cloth placement over whole trees or individual branches to modify light exposure to fruiting spurs and correlate with changes in fruit physiology. A fourth experiment compared fruit harvested from different sections of the apple tree canopy. In a fifth experiment, individual fruit were covered with opaque paper bags three weeks after bloom until harvest and physiological differences were compared to sun exposed fruit.

2. Materials and Methods

2.1. Orchard Site

These studies were conducted between 2016 and 2018 at a Cornell University Agricultural Experiment Station research orchard in Lansing, NY (42.570056, −76.594836) on Hudson-Cayuga silt loam soils with between a 2 and 20° slope [27]. The trees, Malus × domestica Borkh., were trained as a vertical axis and managed using standard pest control and pruning practices for the region [28]. Tree rows were aligned in a north/south orientation. Trees used in Experiments 1, 2, and 3 were grafted onto ‘Malling 9’ (‘M.9’) rootstock and planted in 2003 with 1.8 m between trees and 3.7 m between rows. The cultivars ‘Major’ and ‘Harry Masters Jersey’ used in Experiments 4 and 5 were grafted onto ‘Geneva 30®’ (‘G.30’) rootstock and planted in 2003 with 2 m between trees and 3.7 m between rows; the cultivar ‘Somerset Redstreak’ used in Experiment 4 was grafted onto ‘M.9’ rootstock, planted in 2003 with 1.8 m between trees and 3.7 m between rows. The ‘GoldRush’ trees used in Experiments 4 and 5 were grafted on ‘M.7’ rootstock and planted in 1992 with 2.4 m between trees and 4.6 m between rows.

2.2. Experiment 1: “Early Tree Shading”

This study was a completely randomized design using 12 ‘Dabinett’ trees. Six trees were randomly chosen and covered with black polyethylene plastic woven shade cloth (Greenhouse Megastore, Danville, IL, USA) that blocked 60% of plant assimilable radiation (PAR) for four weeks, between the periods of one and five weeks after full bloom (WAFB). The other six trees were left as a control. One WAFB in the spring of 2018, the trees were thinned to a single king bloom per flowering cluster. Ten fruit samples were collected between 1–2 m in height at weeks one, three, and five after full bloom, and at harvest. An additional ten fruit from each Control tree were also harvested at 7, 9, and 12 WAFB. Full bloom was observed on 23 May 2018, and control and shade treatments established on 30 May. PAR was measured within each tree canopy three weeks after full bloom, as described in Section 2.8.

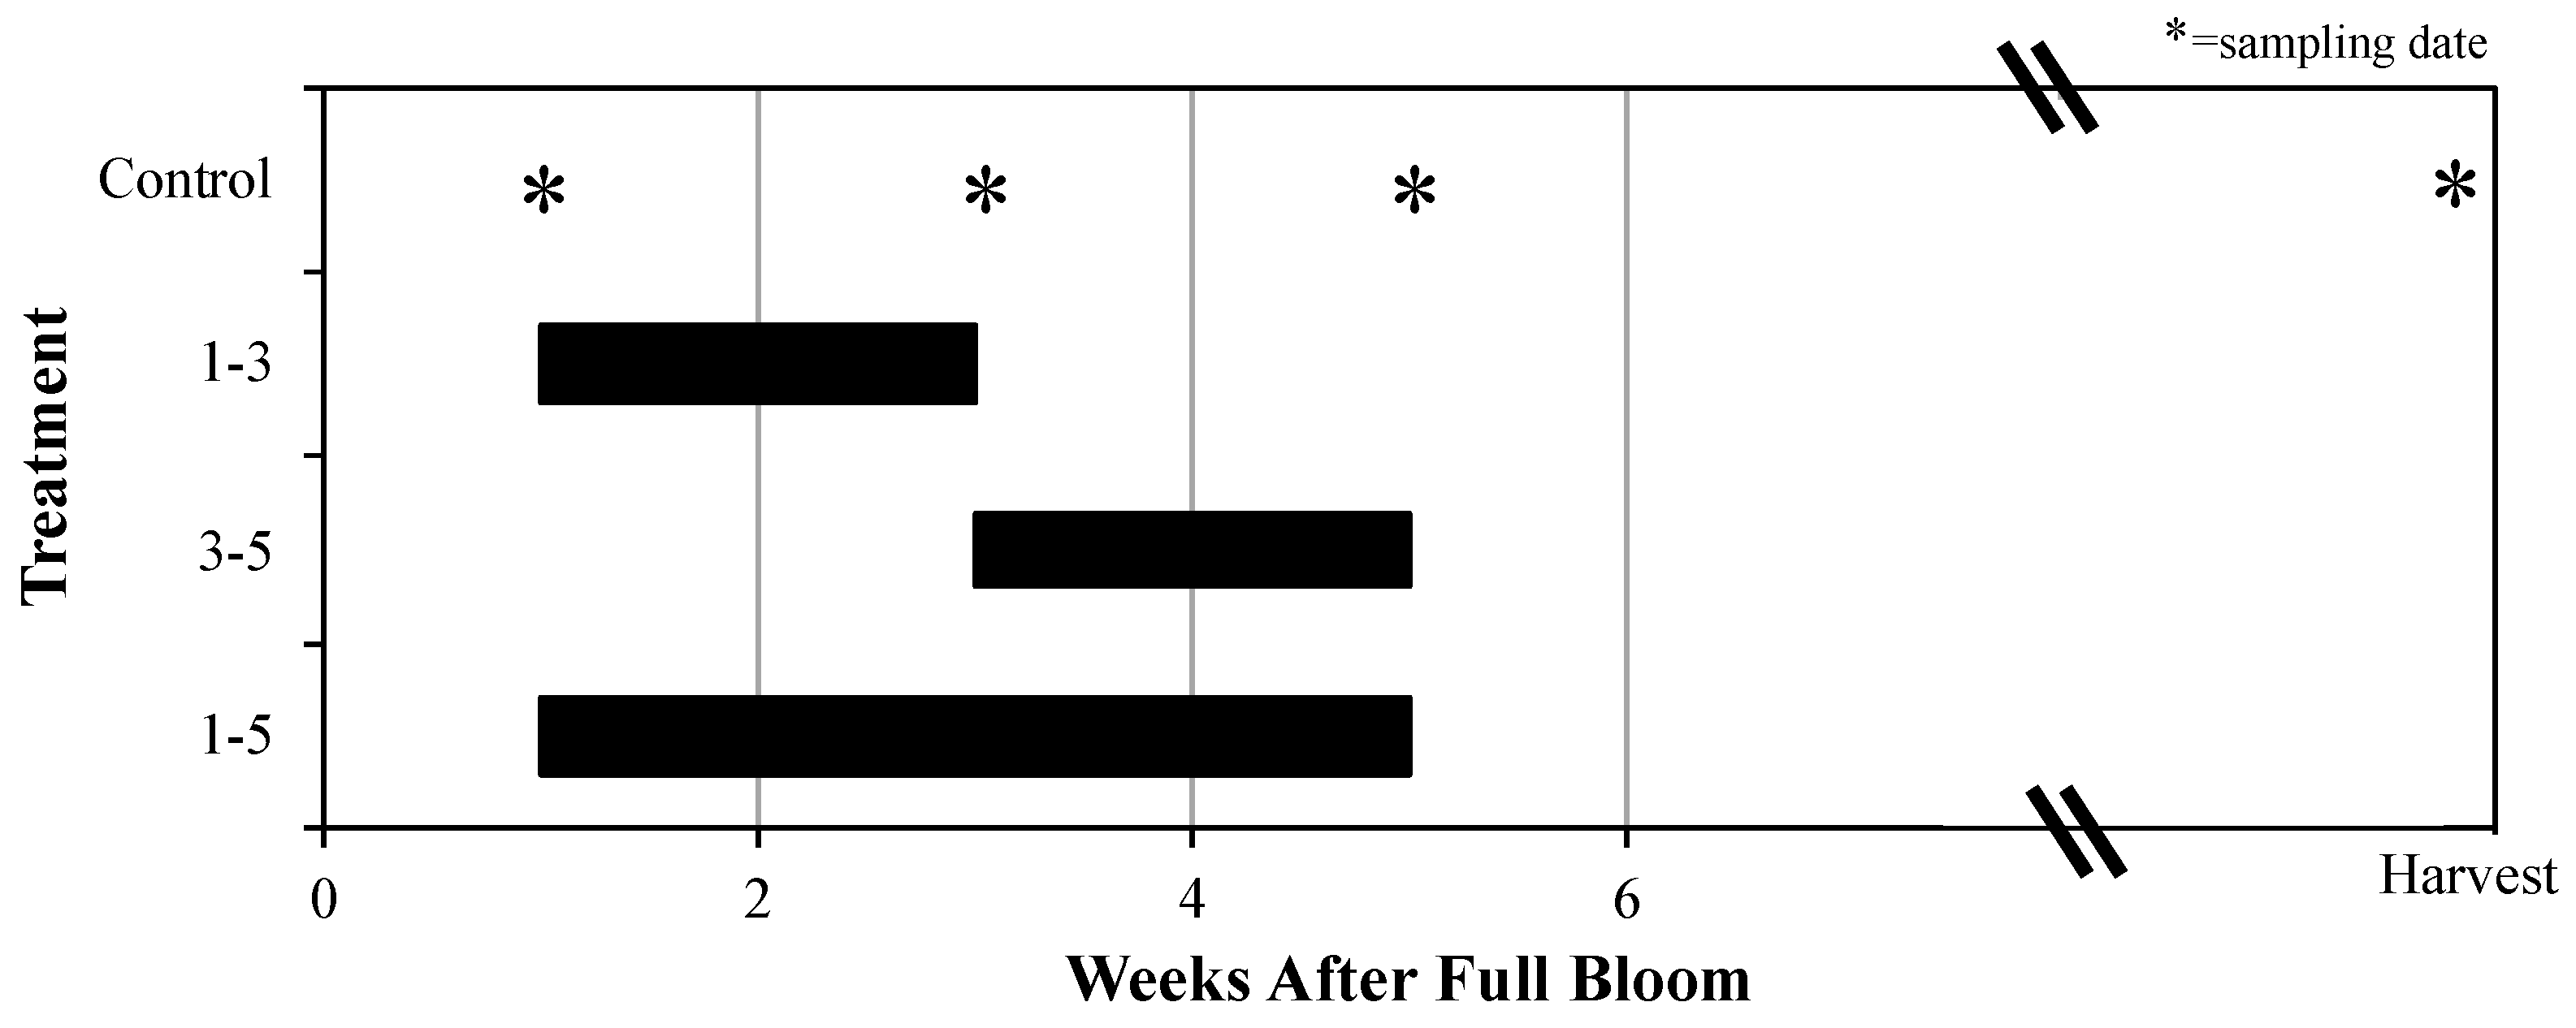
2.3. Experiment 2: “Early Branch Shading”

This study was a randomized complete block design using seven single-tree replications for ‘Ellis Bitter’ and eight for ‘Major’. In the spring of 2018, four branches per tree between 1–2 m in height were thinned to 10 fruit per cm2 branch cross-section area one WAFB. One of four shading treatments was then randomly assigned to each of these branches; each tree contained all four treatments. Black polyethylene plastic woven shade cloth (Greenhouse Megastore, Danville, IL, USA) that blocks 60% PAR was draped and fastened onto branches for 1–3, 3–5, or 1–5 WAFB (Figure 1). There was also an unshaded control. Fruit samples were collected at one, three, and five WAFB. Ten fruit per experimental unit were harvested at the end of one WAFB, and four fruit per experimental unit were harvested at the end of three and five WAFB, and at harvest. Additionally, four fruit samples from non-treatment branches between 1–2 m in height from each tree were sampled at seven, nine, and 12 WAFB to serve as reference points for polyphenol concentrations and fruit growth through the season. Full bloom was observed on ‘Major’ on 19 May 2018 and shading treatments started on 26 May. Full bloom was observed on ‘Ellis Bitter’ on 21 May 2018 and shading treatments started on 28 May. Canopy exposure PAR availability was measured within treatments during weeks two and four after full bloom.

2.4. Experiment 3: “Late Branch Shading”

In the spring of 2016 and 2017 four galvanized steel wire cubic enclosures measuring 30.5 cm on each side were fastened to the ends of branches in the top 2 m of the tree canopies. One of four shading treatments was then randomly assigned to each of these branches; each tree had one branch per treatment. This study was a randomized complete block design with shade enclosures installed in eight ‘Ellis Bitter’ and eight ‘Major’ trees in 2016, and eight ‘Major’ and eight ‘Harry Masters Jersey’ trees in 2017. Four weeks after full bloom, black polyethylene plastic woven shade cloth (Greenhouse Megastore, Danville, IL, USA) that blocks 30%, 50%, and 80% of PAR were draped over and then affixed to the enclosures to establish Low, Medium, and High shading treatments. One enclosure was left uncovered as a control. The shade cloth was left on the enclosures until harvest. Full bloom was observed on 17 May 2016 on both ‘Ellis Bitter’ and ‘Major’ and treatments were established on 13 June 2016. Full bloom was observed on 18 May 2017 in ‘Major’ and ‘Harry Masters Jersey’. Treatments were established on 15 June. In 2017, temperature dataloggers were placed within the enclosures in four ‘Major’ and four ‘Harry Masters Jersey’ trees when shade cloth treatments were implemented, and recorded temperature once per hour until harvest. Canopy exposure PAR availability was measured within treatments monthly until harvest. The number of leaves within each enclosure were counted after harvest.

2.5. Experiment 4: “Fruit Location”

In 2016, 2017, and 2018, fruit growth, quality, and maturity in different locations within apple tree canopies were characterized. The East and West portions of the canopy were defined as the exterior canopy 1–3 m above the ground on the respective east and west sides of orchard rows. The Interior was characterized as the shaded area in proximity to the main trunk 1–3 m above the ground, and the Top zone was characterized as the exposed area of the canopy in the top 1 m of the tree. This study was a randomized complete block design for each cultivar, with eight trees of two cultivars (n = 16) used in each year. ‘GoldRush’ trees were used in all three years; ‘Major’ was used in 2016, ‘Harry Masters Jersey’ in 2017, and ‘Somerset Redstreak’ was used in 2018. Different cultivars were used based on the trees having sufficient crop load, but this also allowed testing these treatments on multiple genotypes.
Canopy exposure PAR availability was measured in the East, West, Interior, and Top portions of eight trees from two cultivars in each year of the study once per month from June through harvest. In 2017, temperature dataloggers were placed within the treatment areas in four ‘GoldRush’ and four ‘Harry Masters Jersey’ trees one WAFB, and recorded temperature once an hour until harvest. At harvest, 10 apples were harvested from the East, West, Internal, and Top treatments of each tree.

2.6. Experiment 5: “Fruit Bagging”

This study was conducted in 2016 and 2017 as a randomized complete block design with five ‘Major’ (2016 only), five ‘Ellis Bitter’, and five ‘GoldRush’ trees. Different trees were used in each year of the experiment. On each tree, opaque paper bags containing a red, black, and brown layer were placed around ten fruit bearing spurs in exposed positions within the tree canopy between 1–3 m above the ground three WAFB. The bags were left in place until harvest. At maturity, Bag fruit were harvested, as were fruit from the closest adjacent spur to serve as a Control.

2.7. Fruit Measurements, Cortex Freeze Drying, and Polyphenol Extraction in Experiments 1 and 2

All fruit samples were weighed, and diameter measured. Week one fruit samples were too small to peel and were immersed in liquid nitrogen before being stored at −80 °C. All other samples were peeled, and cortex tissue separated from the core and immediately immersed in liquid nitrogen before being stored at −80 °C [29]. Week one and cortex tissue samples were then placed in a VirTis Freezemobile 6 (Gardiner, NY, USA) until fully lyophilized. Samples were then ground in an IKA model A11 electric grinder (IKA, Staufen, Germany) to produce a fine powder. Ground tissue (100 mg) was mixed with 4 mL solution of 70% methanol and 0.1% acetic acid to extract polyphenols from tissue samples (MilliporeSigma, Burlington, MA, USA). The tissue and methanol solution were obscured with an opaque cover and mixed in an orbital shaker at 60 rpm for 15 h. The solution was then centrifuged at 500× g for 5 min and the supernatant separated from the pellet.

2.8. Photosynthetically Radiation Measurements

Canopy exposure PAR availability was measured in all studies with a Decagon LP80 ceptometer (Decagon, Pullman, WA, USA). Measurements were taken between 1200–1400 hr in full sun conditions. The ceptometer consists of an 84 cm light probe containing 80 photosensors placed in the tree canopy and an external photosensor positioned in full sun exposure. Ten PAR measurements were taken in rapid succession and averaged to provide a ratio between PAR concentrations in full sun and within different treatments in the tree canopy.
For Experiment 1, the photosensor was held 1 m away from the trunk and 1.7 m above the ground parallel to the tree row on the east and west side of the tree row; east and west side values were averaged to calculate a single canopy exposure PAR availability value per experimental unit [30]. For Experiment 4, the photosensor was held 1 m away from the trunk and 1.7 m above the ground parallel to the tree row on the east and west side of rows for East and West measurements, respectively. The photosensor was held 1.7 m from the ground and against the trunk for Interior measurements, and approximately 1 m below the top of the leader for Top measurements. For Experiments 2 and 3, only the terminal 10.5 cm of the 84 cm long light probe containing ten photosensors were activated in order to characterize the PAR environment within the targeted treatment area. This section of the probe was placed above the foliage under the shade cloth and held level to take PAR measurements.

2.9. Gas Exchange Measurements

A LI-COR lixt 6400 portable photosynthesis gas exchange system (Lincoln, NE) was used to measure differences in photosynthesis rates on the control and shaded ‘Dabinett’ trees from Experiment 1 on 20 June 2018. Gas exchange rates were measured on three healthy exposed leaves on both the east and west sides of the canopy. The CO2 flow rate was set to 400 μmol/s stomatal ratio to 0.5, and stomatal leaf area to 2 cm2. A 2:1 ratio of blue to red light photons were emitted from the instrument lamp when taking measurements. To simulate PAR availability under control and treatment shade light conditions, 1500 μmol/m2/s of photons were emitted while taking measurements on control treatment leaves, and 500 μmol/m2/s of photons were emitted while taking measurements on shade treatment leaves.

2.10. Temperature Datalogging and Growing Degree Day Calculation

The temperature dataloggers deployed during the 2017 field season in Experiments 3 and 4, Thermocron DS1921G-F5# (iButton Link LLC, Whitewater, WI, USA), were hung inside a piece of PVC pipe to prevent contact of the datalogger with direct sunlight. Growing degree days (GDD) base 10 °C was calculated for 4–6 WAFB, and from four WAFB until harvest for each datalogger.

2.11. Fruit and Juice Analyses

Harvest dates are listed in Supplementary Table S1. In Experiment 2, four fruit were harvested from each experimental unit on sampling dates to provide sufficient fruit throughout the study; in all other studies ten-fruit samples were harvested. In Experiment 3, total yield was measured from each experimental unit before a ten-fruit subsample was taken to measure fruit and juice attributes. Fruit were measured for mass, percent peel blush, starch pattern index (SPI), and flesh firmness. Peel blush was visually approximated as the area of the fruit peel with red coloration. The SPI was rated on a 1–8 point scale, with 1 = 0% starch degradation and 8 = 100% starch degradation [31]. The SPI was also used to determine harvest date, with a target value of at least 6 (approximately 60% starch degradation). For Experiments 3 and 4, flesh firmness, after removing the peel, was measured on both the sun and the shade exposed side of each fruit along the equator with a penetrometer (Güss GS Fruit Texture Analyzer, Strand, South Africa) fitted with an 11.1 mm tip. During the 2017 and 2018 harvests for all experiments, chlorophyll a content was measured on a 0–3 point index with a Turoni 53500 DA meter (Forli, Italy) on the sun and the shade side of each apple along the equator.
Fruit from each experimental unit were milled and pressed with a Norwalk 280 juicer (Bentonville, AR, USA) to make a juice sample. Soluble solid concentration, pH, titratable acidity (TA), and total polyphenol concentrations (via the Folin-Ciocalteu assay) were measured for each juice sample. Soluble solid concentration was measured with an Atago PAL-1 digital refractometer (Tokyo, Japan) and reported as °Brix. Juice pH and TA were measured with an automatic titrator [Metrohm Unitrode pH meter, 778 sample processor, and 800 Dosino dosing device (Herisau, Switzerland)]. A 5 mL juice sample was titrated against a 0.1 M NaOH solution to an endpoint of pH 8.2 and expressed as g/L of malic acid equivalents [32].
Total polyphenols were measured with the Folin-Ciocalteu assay in a 96 well microplate at λ 765 nm as described in [33]. Folin-Ciocalteu phenol reagent, sodium bicarbonate, and gallic acid were supplied by Sigma-Aldrich (St. Louis, MO, USA). For the assay, eight standards ranging from zero to three g/L of gallic acid were analyzed on each plate to generate a standard curve. On 96 well microplates, 34.9 μL of deionized water and 1.5 μL of juice, tissue extract, or gallic acid standard were mixed in individual wells. Mixed into each well was 90.9 μL of 0.2 N Folin-Ciocalteu reagent. The water, sample, and Folin-Ciocalteu reagent were left to incubate between six and eight minutes before 72.6 μL of a 7% weight/volume solution of sodium carbonate was mixed into each well. One hour after the addition of the sodium carbonate solution, the absorbance at λ 765 nm was read on a Molecular Devices (San Jose, CA, USA) SpectraMax Plus 284 spectrophotometer. Total polyphenol concentrations, measured as gallic acid equivalents, were calculated from the standard curve generated from each plate.

2.12. Statistical Analysis

Data from these experiments were compared using a linear mixed effects model. Treatments were considered significant at p ≤ 0.05. The Tukey HSD method was used for post hoc mean separation testing in the Early Branch Shading experiments. In Experiment 3, degree of shade cloth opacity was included as a continuous variable in statistical analysis. Treatment, cultivar, year, treatment × cultivar, and treatment × year were included as fixed effects. Block was included within the model as a random variable. A logit transformation of peel blush and canopy exposure PAR percentage data was performed prior to analysis but presented as untransformed data. Data were analyzed using JMP Pro version 14 (SAS Institute, Cary, NC, USA).

3. Results

3.1. Experiment 1: “Early Tree Shading” and Experiment 2 “Early Branch Shading”

3.1.1. Light Environment and Photosynthesis Rates

When shade cloth was placed over trees in the Experiment 1, canopy exposure of plant assimilable radiation (PAR) was reduced by 71%, from 47.9% to 13.8%, and net photosynthetic rate was reduced by 38%, from 20.9 to 12.9 μmol/m2/s, in comparison to the Control (Supplementary Table S2). Two weeks after full bloom (WAFB) in Experiment 2, the unshaded treatments (Control and 3–5 WAFB) had 62% more PAR exposure than the 1–3 and 1–5 WAFB shaded treatments (Supplementary Table S3). At four WAFB, the unshaded treatments (Control and 1–3 WAFB) had 69% more PAR exposure than the 3–5 and 1–5 WAFB shaded treatments. Across both sampling dates, unshaded treatments had, on average, 56.7% PAR exposure and shaded treatments had 19.5% canopy exposure.

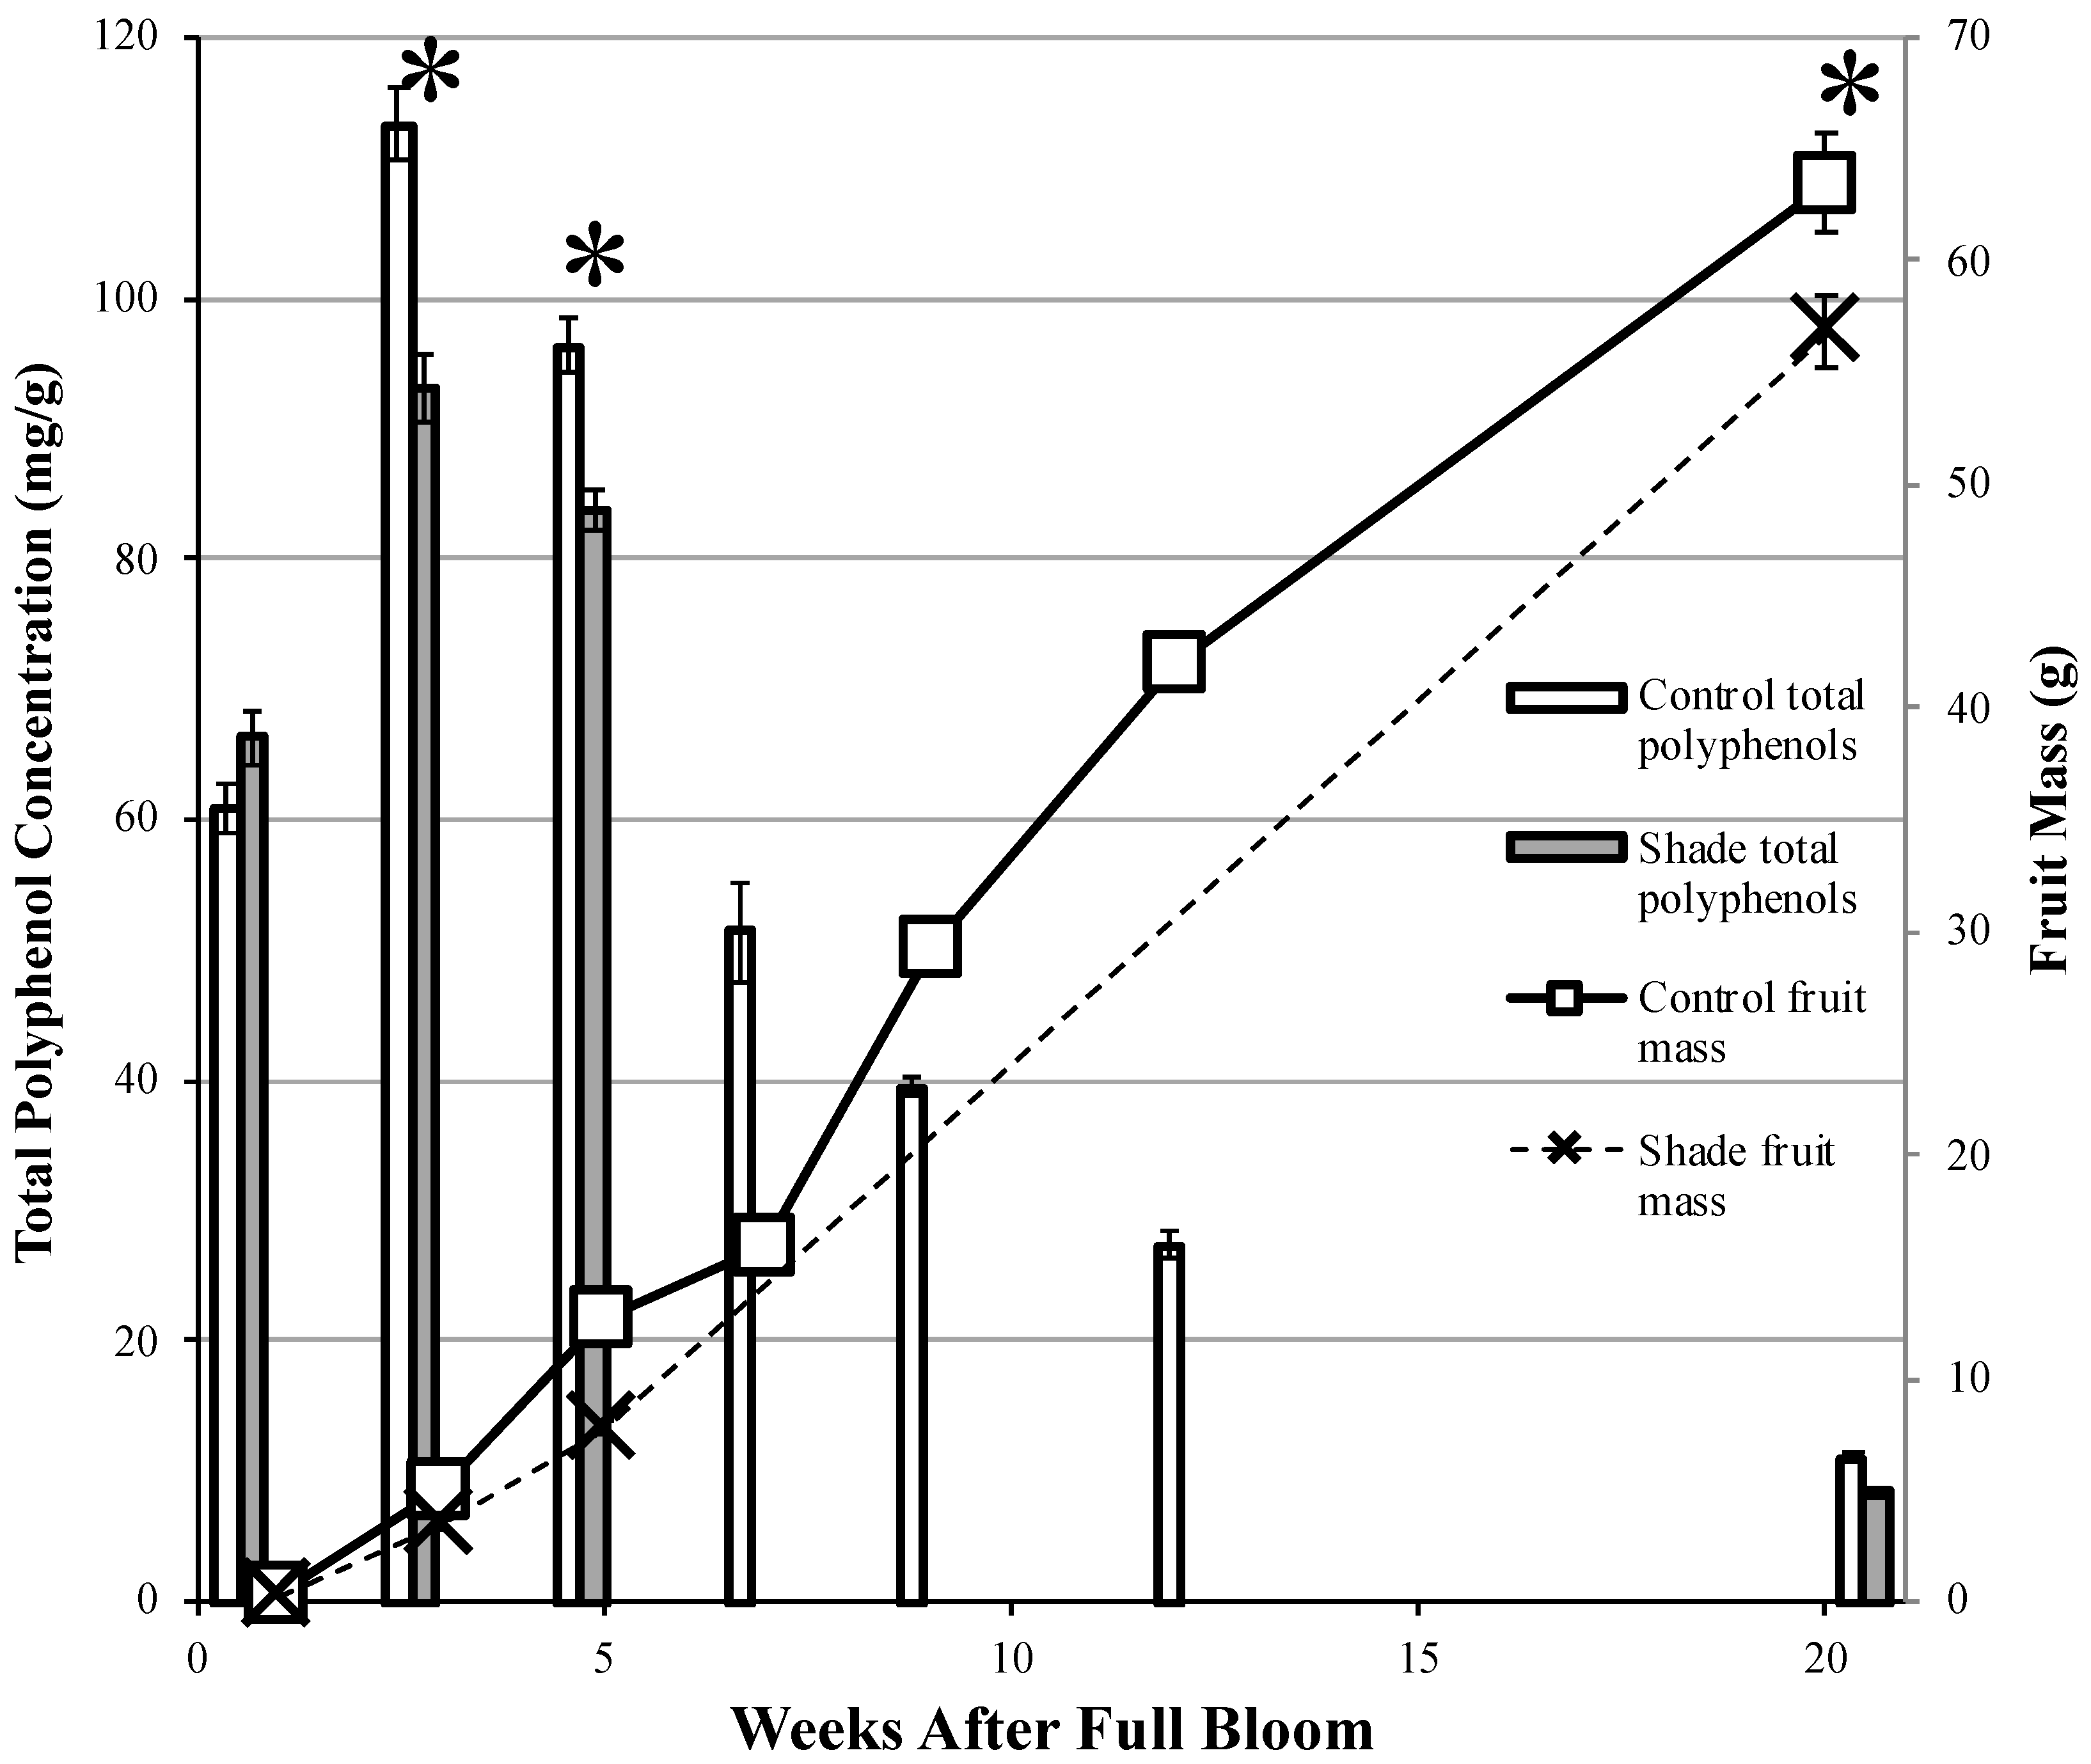
3.1.2. Fruit Development

Fruit mass increased rapidly between one and five WAFB in both Experiments 1 and 2. In Experiment 1, fruit from the Control treatment had a nearly 44-fold increase in mass during these four weeks, from 0.29 to 12.70 g, and in Experiment 2 fruit from the Control treatment increased over 62-fold, from 0.21 to 13.16 g (Supplementary Tables S4 and S5). Between five WAFB and harvest at 20 WAFB, fruit mass increased by 400% in Experiment 1. Fruit mass increased by 542% in fruit from the Control treatment in Experiment 2 between 5 WAFB and harvest at 14 WAFB. At three WAFB, fruit from the Control treatment had 43% greater mass and 14% larger diameter than Shade treatment fruit in Experiment 1. Unshaded fruit (Control and 3–5) were 17% larger and 11% wider than fruit from shaded treatments (1–3 and 1–5) in Experiment 2 (Supplementary Tables S4–S7). At five WAFB, Control treatment fruit were 64% larger than fruit from the Shade treatment in Experiment 1 and had 20% wider diameters. At five WAFB fruit from the Control treatment were 20%, 28%, and 32% larger than 1–3, 3–5, and 1–5 treatment fruit in Experiment 2, respectively. At harvest, Control treatment fruit were 11% larger than the Shade treatment fruit in Experiment 1. There were no statistical differences in fruit mass in Experiment 2 at harvest.

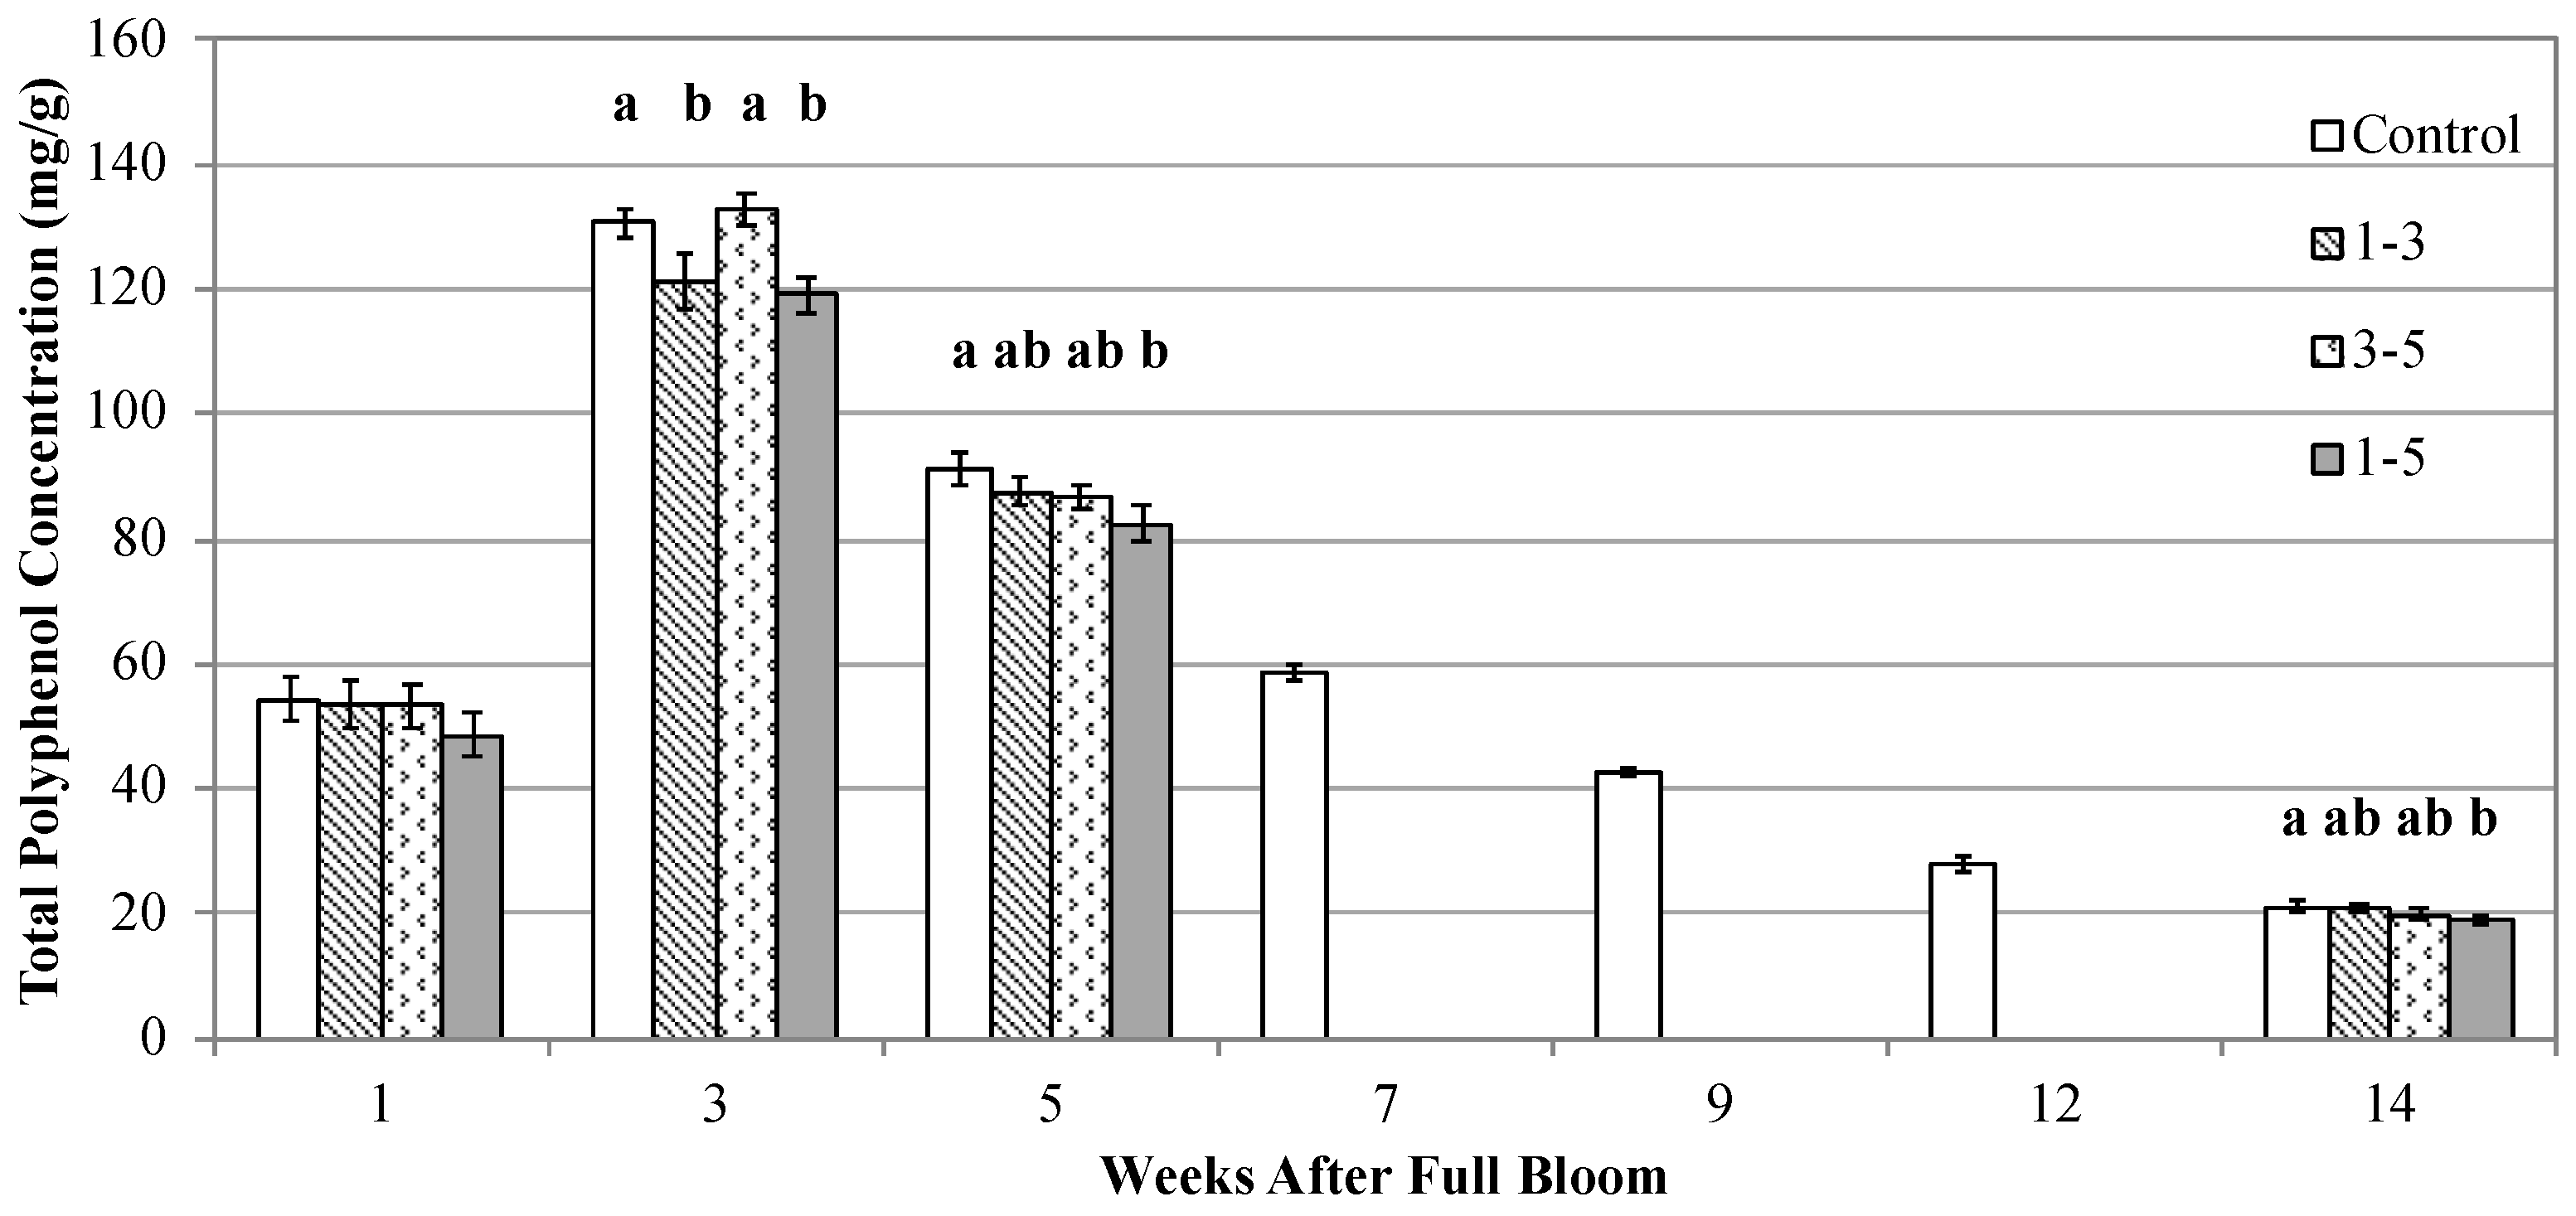
3.1.3. Fruit Polyphenol Concentration

In both Experiments 1 and 2, total fruit polyphenol concentrations increased rapidly between one and three WAFB and then gradually decreased in concentration until harvest (Figure 2 and Figure 3, Supplementary Tables S8 and S9). In Experiment 1, between one and three WAFB, fruit from the unshaded Control increased in total polyphenol concentrations by 86%, from 60.9 to 113.3 mg/g. Similarly, in Experiment 2, fruit from the unshaded Control increased in total polyphenol concentrations by 141% during this period. At five WAFB, total fruit polyphenol concentrations were 15% lower than at three WAFB in fruit from the Control treatment in Experiment 1, and 30% in the fruit from the Control treatment in Experiment 2. By harvest at 20 WAFB, total fruit polyphenol concentrations from the Control treatment in Experiment 1 were 89% lower than they were at five WAFB, dropping from 96.28 to 11.02 mg/g. Similarly, in Experiment 2 total polyphenol concentrations in fruit from the unshaded Control were 77% lower at harvest, which was at 14 WAFB.
In both Experiment 1 and 2, at one WAFB (before shading treatments were implemented) there was no difference among treatments in fruit total polyphenol concentrations (Figure 2 and Figure 3). At three WAFB, Experiment 1 unshaded fruit from the Control treatment had 22% greater total polyphenol concentrations than fruit from the Shade treatment. In Experiment 2, unshaded treatments (Control and 3–5) had 10% greater total polyphenol concentrations than shaded treatments (1–3 and 1–5) at three WAFB. At five WAFB in Experiment 1, total fruit polyphenol concentrations were 15% greater in the Control than Shade treatment. In Experiment 2, Control treatment fruit had total polyphenol concentrations that were 11% greater than in the 1–5 treatment at five WAFB. At harvest, fruit from the Control treatment had 32% greater total polyphenol concentrations than fruit from the Shade treatment, and Control juice had 30% greater total polyphenols than Shade juice in Experiment 1. At harvest in Experiment 2, Fruit from the Control treatment had 11% greater total polyphenol concentrations than the 1–5 treatment; there were no differences among the Control, 1–3, or 3–5 treatments. Control treatment juice had 30%, 25%, and 28% greater total polyphenol concentrations than juice from the 1–3, 3–5, and 1–5 treatments, respectively.

3.1.4. Fruit and Juice Characteristics

At harvest, there were no differences in fruit starch pattern index, peel blush, or chlorophyll a content in either Experiments 1 or 2 (Table 1 and Table 2). There were also no differences in juice soluble solid concentration, pH, or titratable acidity.

3.2. Experiment 3: “Late Branch Shading”

3.2.1. Light Environment

There was a linear relationship between treatment shade cloth opacity and canopy exposure of PAR within Experiment 3 enclosures (Supplementary Figure S1). In the Control treatment, canopy exposure of PAR was 90.7%; Low, Medium, and High treatment branches were exposed to 59%, 46%, and 18% of PAR, respectively (Supplementary Table S10).

3.2.2. Enclosure Growing Degree Days

The shade cloth treatments all reduced cumulative growing degree days within the enclosures. From 4–6 WAFB, Low, Medium, and High treatments had 9%, 9%, and 8% fewer growing degree days base 10 °C than the Control, respectively (Supplementary Table S11). From four WAFB until harvest, Low, Medium, and High treatments had 9%, 8%, and 5% fewer growing degree days base 10 °C than the Control, respectively. Thus, the presence or absence of shade cloth affected air temperature, but the shade cloth opacity did not influence cumulative growing degree days.

3.2.3. Fruit and Juice Characteristics

In Experiment 3, as shade opacity increased, fruit mass of the harvested fruit and yield per branch decreased (Supplementary Table S12). Fruit mass in Low, Medium, and High treatment branches were 8%, 10%, and 7% smaller than the Control treatment fruit, respectively. Yield per branch was 21% less the High treatment than the Control. However, there was no relationship among the shading treatments for the ratio of yield to leaf number. Peel blush was also reduced by increased opacity; the High treatment fruit had 29% less peel blush than the Control (Figure 4). There was no relationship between shading intensity and SPI, fruit firmness, or chlorophyll a content. Soluble solid concentration in juice was reduced with increased shading opacity; Low, Medium, and High treatment juice had 7%, 8%, and 12% lower soluble solid concentrations than the juice from the Control treatment, respectively (Supplementary Table S13). Juice from the High treatment also had 5% lower titratable acidity than the Control, but Low and Medium treatment juice had similar titratable acidity concentrations to the Control. Greater shading intensity also resulted in lower juice polyphenol concentrations. Juice from the Low, Medium, and High treatments had 8%, 10%, and 14% lower total polyphenol concentrations than the Control, respectively. Total differences in polyphenols were higher in 2016 than 2017. High treatment juice was 26% lower in total polyphenols than the Control in 2016, but only 6% lower in 2017.

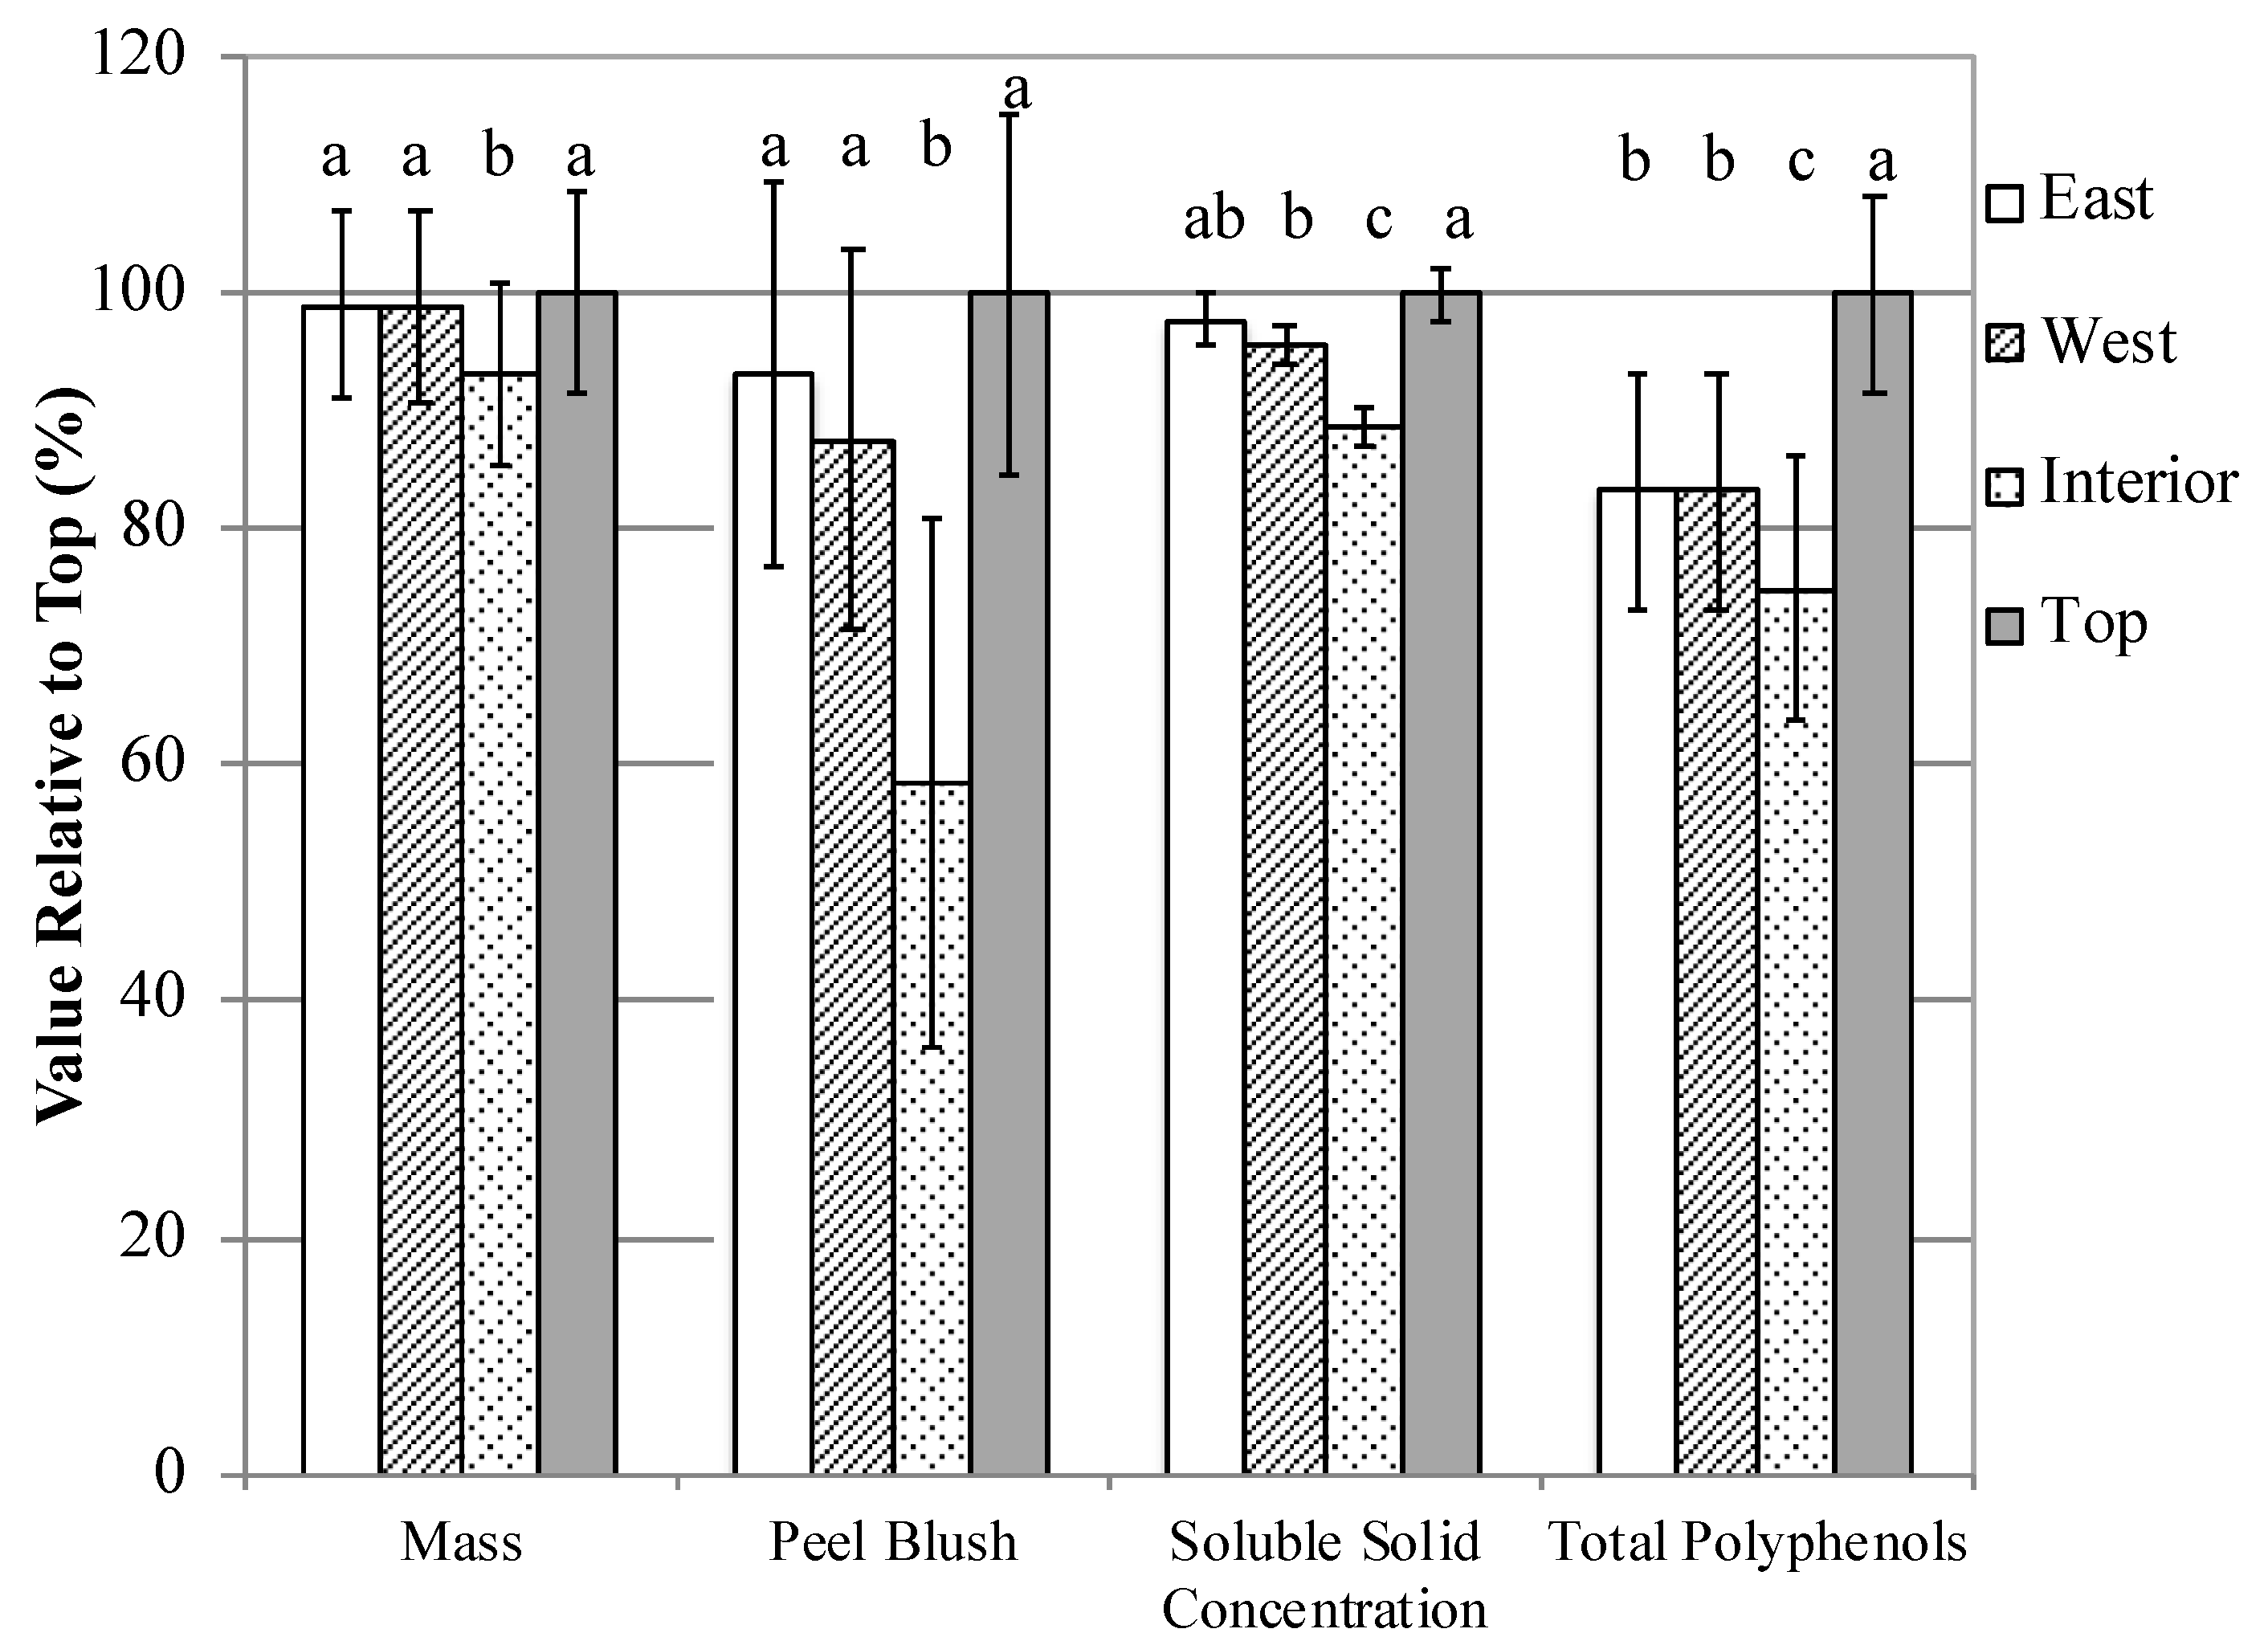
3.3. Experiment 4: “Fruit Location”

3.3.1. Light Environment

Canopy exposure of PAR was greatest in the Top treatment of tree canopies in Experiment 4 (Supplementary Table S14). On average, across all years and cultivars, canopy exposure of PAR was 68% in the Top treatment. The East and West treatments had similar exposure to PAR to one another, receiving on average 48% and 42% of PAR to these sections of the tree canopy, respectively. The East and West treatments received, on average, 35% less PAR than the Top treatment. The Interior treatment had the lowest PAR; on average only 8% of PAR reached the Interior treatment of the canopy, 89% less than the Top treatment and 83% less than the East and West treatment. Relative differences in canopy exposure of PAR within treatments were similar throughout the growing season.

3.3.2. Canopy Growing Degree Days

The Top and West treatments accumulated more growing degree days (GDD) than the Interior treatments from 1–6 WAFB; Top and West treatments had 4% more growing degree days base 10 °C during this period (Supplementary Table S15). From one WAFB until harvest, the Top and West treatments accumulated more growing degree days than the East and Interior treatments. The Top treatment had 6% and 9% more growing degree days base 10 °C than East and Interior treatments, respectively. The West treatment had 7% and 10% more growing degree days base 10 °C than East and Interior treatments, respectively.

3.3.3. Fruit and Juice Characteristics

At harvest, fruit mass from the Top, East, and West treatments were greater than fruit from the Interior treatment; fruit from the Interior were 7% smaller than fruit from the Top and 6% smaller than fruit from the East and West sections of tree canopies (Figure 5). Fruit peel blush was 72% greater in the Top than in Interior treatment fruit, and 53% greater on East and West fruit than Interior fruit. On a green scale color index used for ‘GoldRush’ fruit, Interior fruit were 0.9 units greener than fruit from the Top treatment, and 0.6 and 0.7 units greener than East and West fruit, respectively (Supplementary Table S16). East treatment fruit were 0.3 units greener than Top fruit. Chlorophyll a content in fruit peels was 37% greater in Top fruit than Interior fruit, and 33% greater in East and West fruit than Interior fruit. Interior fruit were also less ripe than Top and West fruit; Top, East and West fruit were 0.4, 0.3, and 0.6 starch pattern index (SPI) units higher than the Interior, respectively. Soluble solid concentrations were greatest in the Top treatment; juice from the Top treatment was 3% greater than East and West juice and 12% higher than Interior juice (Supplementary Table S17). East and West juice was 9% higher in soluble solids than Interior Juice. Interior juice was 0.1 pH units more alkaline than Top, East, and West section juice. Total polyphenol concentrations were greater in more exposed sections of the tree canopy; Top section juice had 20% more total polyphenols than East and West juice, and 33% more total polyphenols than Interior juice. East and West treatment juice had 11% more total polyphenols than Interior juice.

3.4. Experiment 5: “Fruit Bagging”

Fruit and Juice Characteristics of Fruit Bagging Experiment

Fruit mass was smaller in the Bag treatment than the Control for ‘Major’ and ‘Ellis Bitter’; Bag treatment fruit were 26% and 25% smaller than the Control, in ‘Major’ and ‘Ellis Bitter’, respectively, (p < 0.001). There was no difference between ‘GoldRush’ Bag and Control treatment fruit mass (p = 0.996). In ‘Major’ and ‘Ellis Bitter’ Bag fruit had less than 1% peel blush coloration, while Control fruit had 50% or greater peel blush coloration (Table 3). In ‘GoldRush’ Bag treatment apples, fruit peels were very light yellow, all scoring 1.0 on the Green Scale, while Control treatment fruit had a mean Green Scale score of 3.0. Control treatment fruit had greater chlorophyll a content than Bag treatment fruit in all cultivars as well. Bag treatment fruit also had less starch at harvest in ‘Major’ and ‘Ellis Bitter’ (p < 0.001). ‘Major’ and ‘Ellis Bitter’ Bag treatment fruit scored 1.2 and 0.4 starch pattern index units higher than the Control, respectively. There was no difference in SPI in ‘GoldRush’ (p = 0.505). There was no difference in flesh firmness between treatments.
Soluble solid concentrations were greater in Control treatment than Bag treatment juice in all cultivars (Table 4). Juice pH was lower in the Control treatment than in the Bag treatment. In ‘GoldRush’, titratable acidity was 23% greater in Control treatment juice than Bag treatment juice. In ‘Major’ and ‘Ellis Bitter’, there was no statistically significant difference in titratable acidity (p = 0.190). Overall, there was no statistically significant difference in total polyphenol concentrations among treatments. However, in ‘GoldRush’ total polyphenol concentrations were 61% greater in Control juice than Bag juice (p < 0.001); Control treatment juice had 0.37 g gallic acid equivalents (GAE)/L of polyphenols, while Bag treatment juice had 0.23 g GAE/L. In ‘Major’, total polyphenol concentrations were 27% greater in the Bag treatment than the Control (p = 0.026); Control treatment juice had 1.39 g GAE/L, and Bag treatment juice had 1.77 g GAE/L. In ‘Ellis Bitter’, there was no statistically significant difference between treatments (p = 0.796).

4. Discussion

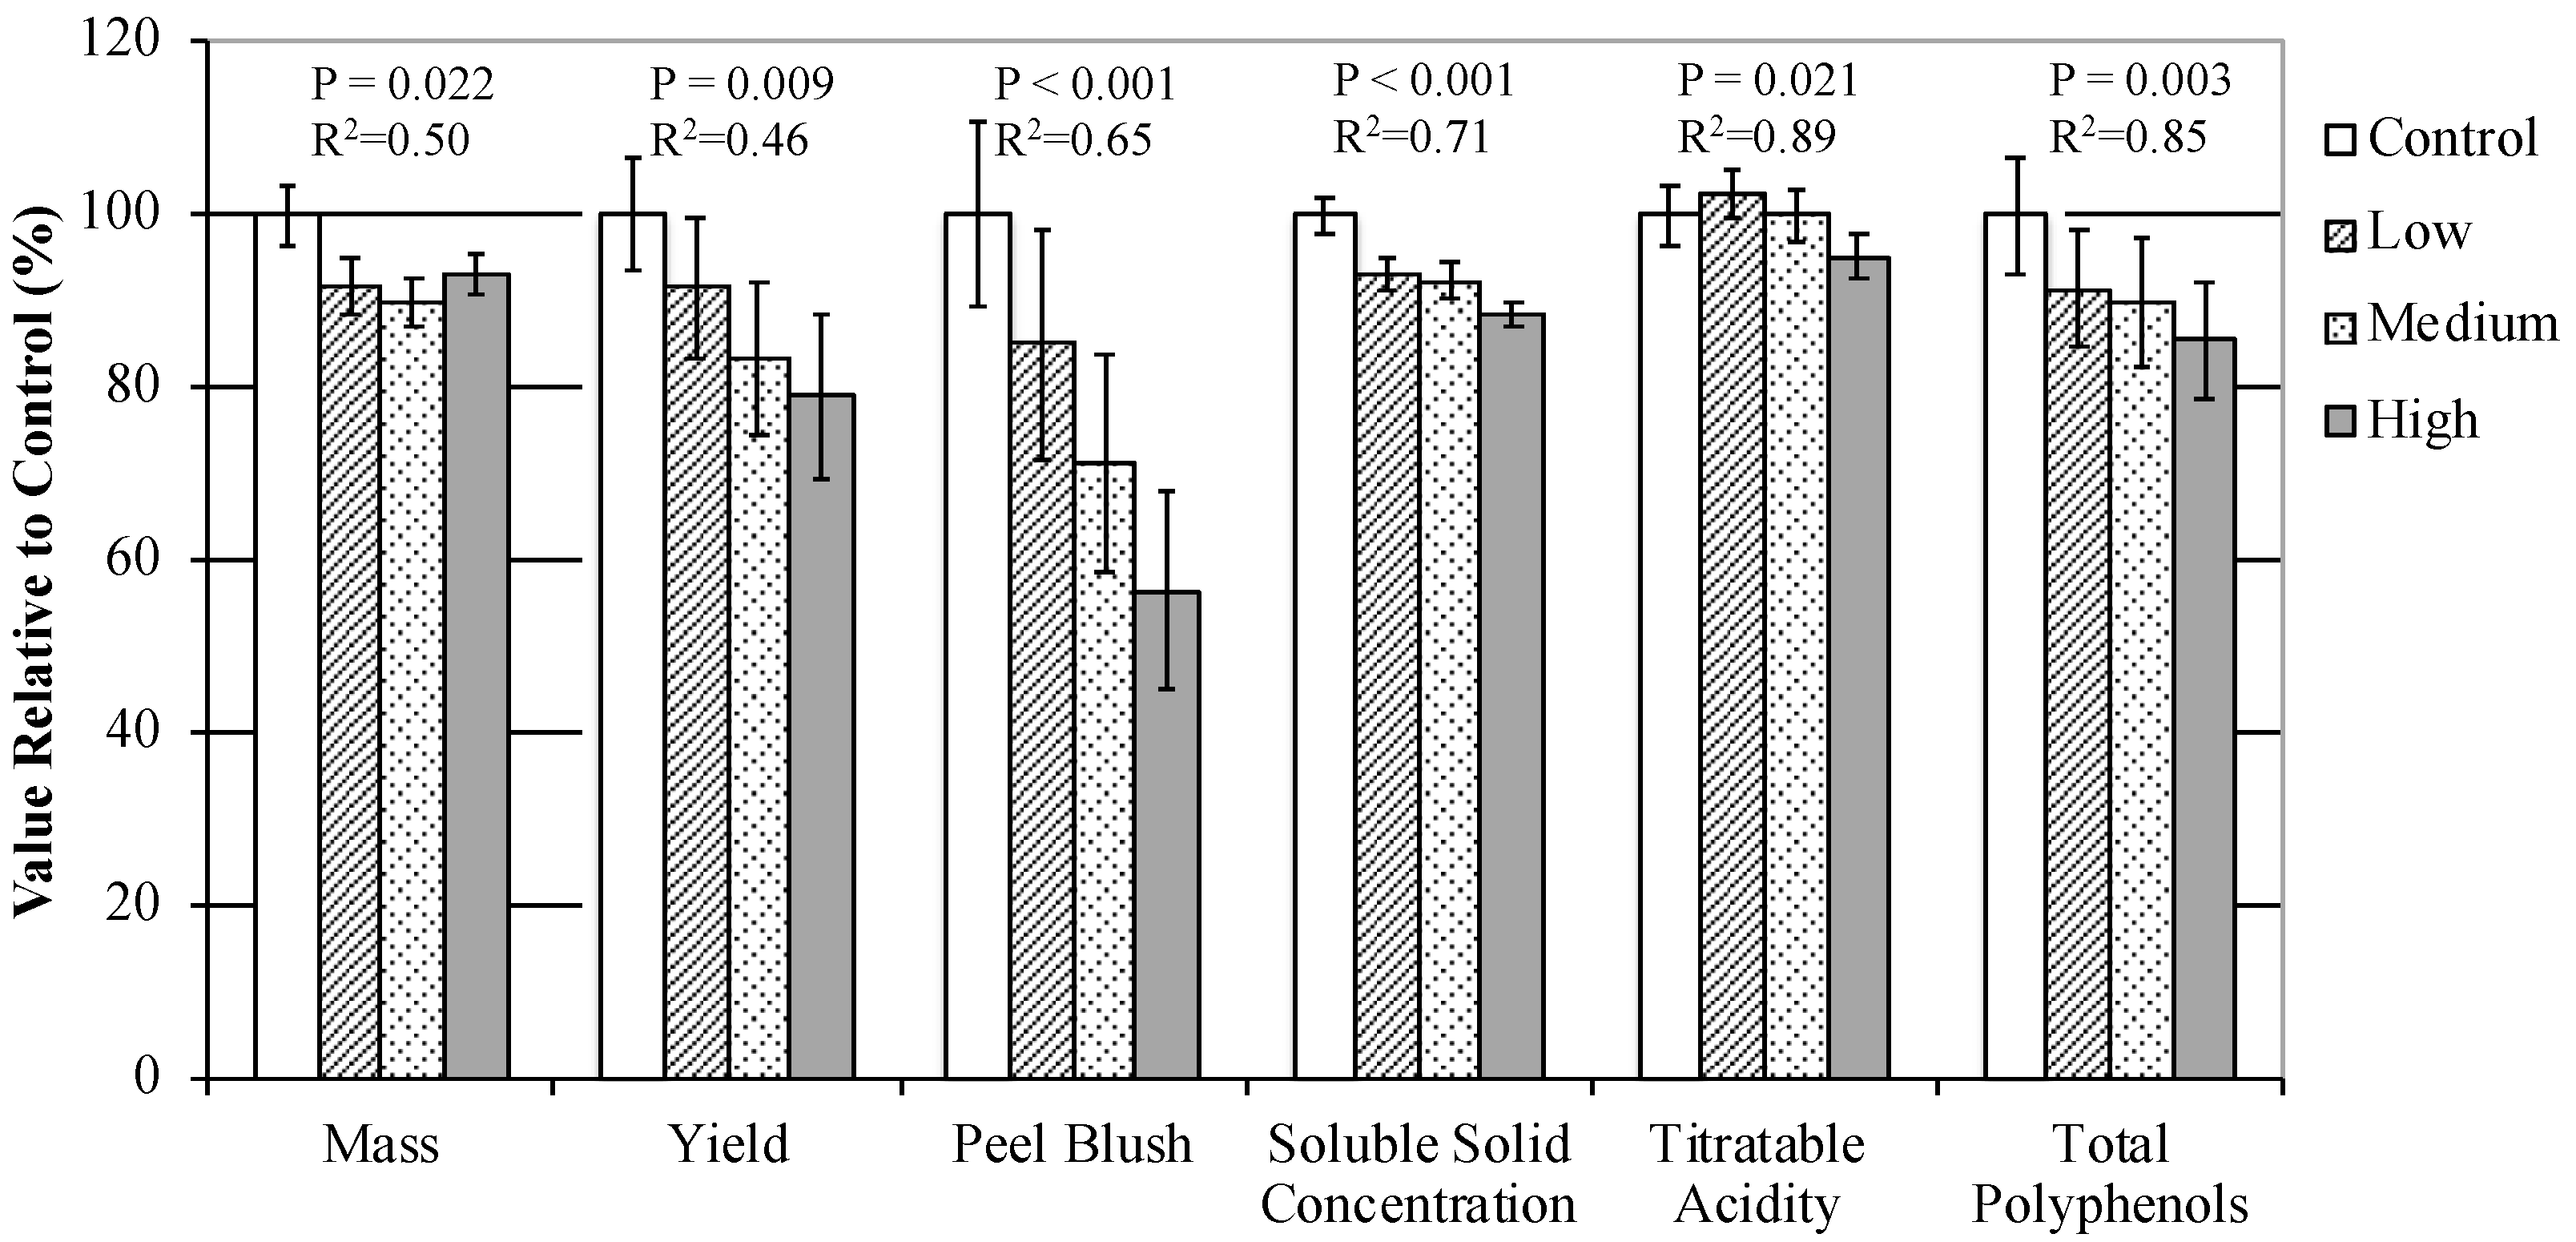
4.1. Overall Assessment of Sunlight Exposure on Cider Apple Fruit Quality

Our results suggest that reducing light exposure into an apple tree canopy decreases fruit size, juice soluble solid concentration and total polyphenol concentration—all important quality characteristic for cider production. Diminished fruit quality appears to be most pronounced when both leaves and fruit are shaded. Additionally, fruit quality at harvest appears to be most influenced by early season light interception. For example, in Experiment 1, “Early Tree Shading”, we found that shading fruiting spurs for four weeks during the cell division phase of fruit development resulted in a reduction of fruit size by 10% and juice polyphenol concentrations by 23% at harvest. These effects are likely attributed to reduced carbohydrate availability to developing fruit at a time in the season when endogenous supply is low and the leaves are still greater sinks than sources of photosynthates [19,34]. Localized decreased light interception of the canopy throughout or later in the season was also correlated with reduced yields, smaller fruit size, and lower soluble solid concentrations, as found in Experiments 3 and 4 (“Late Branch Shading” and “Fruit Location”). Localized decreases in light interception can also be related to delayed ripening, as evidenced by greater chlorophyl a and lower starch pattern indices of fruit from more shaded areas of canopies in Experiment 4.
The relationship between canopy light interception and yield at both a microclimate and orchard-scale is well established in apple trees [35,36,37]. Fruit cell number is dependent on carbohydrate availability for cell growth and division during the first 30–45 days after petal fall [38]. Limiting carbohydrate availability during this period, either from reduced net photosynthesis (such as from lower light availability) or competition with other sinks (such as fruit), reduces cell number and growth, and ultimately potential maximum fruit size [20,39,40].
Across the experiments in this study, reduced sunlight exposure was correlated with lower polyphenol concentrations. Polyphenols are a diverse class of compounds influenced by a number of factors, including UV light exposure, herbivory, and carbohydrate availability [41,42,43,44]. Increased light exposure to a canopy is correlated with both greater UV light exposure and greater carbohydrate supply to developing fruit. While correlated with one another, these factors have distinct physiological and metabolic impacts on fruit development. Thus, it is difficult to differentiate the impacts of increased light exposure directly to fruit from increased light exposure to the adjacent spur canopy producing more carbohydrates.

4.2. Seasonal Development of Polyphenols in Cider Apples

The rapid accumulation of polyphenols in fruit during the first five weeks after full bloom (WAFB) and then their gradual decline in concentrations during the rest of fruit growth and development in Experiments 1 and 2 (the “early shading” experiments) suggests that most polyphenol synthesis occurs during the cell division phase of fruit development. Similarly, Renard et al. (2007) [45] found that nearly all flavan-3-ol (catechin, epicatechin, and their procyanidin polymers) synthesis occurred during the first six WAFB for the cider cultivars ‘Avrolles’ and ‘Kermerrien’. Polyphenol synthesis rates were much lower after cell division ceased. Zhang et al. (2010) [16] also found that flavan-3-ol concentrations increased exponentially during the cell division phase of fruit growth in ‘Honeycrisp’ and then were diluted as fruit cells enlarged.
Renard et al. (2007) [45] found that at five weeks after full bloom the vast majority of cortex tissue polyphenols in high tannin cider apples were flavan-3-ols, followed by caffeoylquinic acid and dihydrochalcones, respectively. In cortex tissue of cider apples at harvest, Guyot et al. (1998) [46] found that procyanidins and flavan-3-ol monomers constituted the vast majority of polyphenols. After cell division, flavan-3-ol monomers polymerize and increase in mean polymer length for the remainder of the growing season [16,45,47]. This suggests that the majority of polyphenols, particularly those with organoleptic properties such as catechins, epicatechins, and their polymers, are synthesized during the cell division phase of fruit development. Enzyme concentrations related to polyphenol synthesis (including flavan-3-ols), such as phenylalanine ammonia-lyase, chalcone-synthase, and dihydroflavonol reductase are greatest in young fruit [23,24]. The reported periods of high enzyme concentrations during fruit cell division correspond with the periods of high polyphenol synthesis in fresh eating apple cultivars and flavan-3-ol synthesis in cider apples [23,24,25,45]. Rapid polyphenol synthesis during the cell division phase of fruit growth were also found in Experiments 1 and 2.

4.3. Differing Effects of Light Exposure to Fruits, Leaves, and Whole Canopies on Polyphenol Synthesis in Cider Apples

In Experiment 5, “Fruit Bagging”, the similar total polyphenol concentrations between Bag and Control treatment ‘Ellis Bitter’ juice, and greater total polyphenol concentrations of Bag than Control treatment juice in ‘Major’ suggests that flavan-3-ol and procyanidin synthesis is not regulated by light exposure solely to the fruit. In ‘Major’, the greater fruit mass of Control than Bag treatments suggest that total polyphenol content on a per fruit basis were similar between treatments, and that greater fruit mass in the Control treatment led to lower total polyphenol concentrations in juice. The greater total polyphenol concentrations in Control than Bag fruit in ‘GoldRush’ suggests that light exposure does influence polyphenol synthesis in the cortex of this cultivar. Though ‘GoldRush’ is included in hard cider blends due to its high acidity, it is mostly grown for the fresh market and thus has low total polyphenols in comparison to cider specific cultivars [15]. Juice from similar fresh market cultivars have greater proportions of hydroxycinnamic acids and dihydrochalcones than flavan-3-ols in their juice polyphenol content [17,18]. Fruit bagging has been shown to lower hydroxycinnamic acid concentrations in the peel and flesh of apples [48]. We did not determine which polyphenols were produced in lower concentrations due to fruit bagging in ‘GoldRush’. However, there is evidence of cultivar variation in the influence of light exposure on fruit and the synthesis of flavan-3-ols in apple tissue. Chen et al. (2012) [48] found fruit bagging to decrease concentrations in flavan-3-ol concentrations in ‘Red Delicious’ and ‘Golden Delicious’ fruit cortex tissue while not having any impact on flavan-3-ol synthesis in ‘Royal Gala’. Additionally, concentrations of flavan-3-ols have not been found to be affected by light exposure in fruit peels of ‘Elstar’ and ‘Jonagold’ apples [49]. However, because light exposure directly to the fruit did not reduce polyphenol concentrations in Experiment 5 in ‘Major’ and ‘Ellis Bitter’ this suggests that differences in total polyphenol concentrations in the other experiments resulted from reduced carbohydrate availability, and not a direct impact of light on enzymatic activity in the fruit itself.
Flavan-3-ol synthesis appears to be less light sensitive than anthocyanins, flavonols, and hydroxycinnamic acids [23,48,49,50]. Concentrations of light-sensitive enzymes in the flavan-3-ol pathway have been found to not be rate limiting during the cell division phase of fruit growth when most flavan-3-ol synthesis occurs [23,24,25]. Even later in fruit development, the synthesis of flavan-3-ols are much less light sensitive than other classes of polyphenols. Fruit bagging of ‘Cripps’ Red’ apples reduced transcription factors for anthocyanin and flavonol synthesis by 40- and 70-fold, respectively, but transcription factors for flavan-3-ol synthesis declined only two to four-fold [50]. Anthocyanins were not detectible in the fruit peel of bagged ‘Cripps’ Red’ apples, and flavonol concentrations were reduced in bagged fruit in comparison to the control, but there was no difference in condensed tannins among treatments.

4.4. Temperature Effects on Polyphenol Synthesis in Cider Apples

It is well established that apple tree metabolic rates, like most plants, are affected by temperature [51]. However, we were unable to find any studies that investigated the relationship between temperature and flavan-3-ol concentrations in apple trees. The Top and West tree sections had similar growing degree accumulations to one another in Experiment 4, but the fruit from the Top treatment had greater juice total polyphenol concentrations. Conversely, the West tree sections had greater growing degree accumulation than the East tree sections but had similar juice total polyphenol concentrations to one another. Similarly, while growing degree accumulation was slightly reduced by the presence of shade cloth in Experiment 3, the “late branch shading” study, increasing shade cloth opacity did not correlate with increasingly lower growing degree accumulations. However, increasing shade cloth opacity was correlated with reducing total polyphenol concentrations; in other words, PAR exposure was a stronger predictor of total polyphenols in the fruit than temperature. The differences in temperature observed within treatments in these experiments were not correlated with changes in total polyphenol concentrations.

4.5. Effect of Carbohydrate Availability on Polyphenol Synthesis in Cider Apples

Because the direct effects of sunlight and temperature most likely did not impact polyphenol development, the findings from our study suggest that carbohydrate availability during fruit development is the primary controlling factor for polyphenol synthesis in apples. This was shown when branches shaded for only two weeks during the cell division phase had 21% lower total juice polyphenol concentrations at harvest in comparison to the unshaded control in Experiment 2. Not only were total polyphenol concentrations reduced via shading whole trees and branches during this period, but these treatments also resulted in 10% smaller fruit size in Experiment 1 at harvest. During the cell division stage of fruit growth, fruit cell number is dependent on carbohydrate availability for cell growth and division [38]. Limiting carbohydrate availability during this period, either from reduced net photosynthesis or competition with other sinks (such as fruit), reduces cell number and growth, and ultimately reduces final fruit size [20,39,40]. Fruit are dependent on localized carbohydrate resources from spur leaves between one and three weeks after full bloom; shading of branches reduces fruit size and delays the export of carbohydrates from extension shoots to developing fruit [20].
Even though shading intensities and duration were greater in the “late branch shading” (Experiment 3), than the “early shading” studies (Experiments 1 and 2), polyphenol concentrations were reduced more by the earlier reduction in carbohydrate availability. In Experiment 2, shade cloth blocking 60% of PAR on individual branches for 4 weeks early in fruit development reduced juice polyphenol concentrations by 22%; in Experiment 3, shade cloth blocking 80% of PAR on individual branches for 11 weeks or longer only reduced polyphenol concentration by 14%. As extension shoot leaves mature, nearby fruit receive a greater proportion of carbohydrates from them rather than spur leaves. Thus, initiating shading four WAFB in Experiment 3 was towards the end of the primary period of polyphenol synthesis in young fruit [20,24,45]. Furthermore, shading starting at four WAFB did not consistently impact polyphenol concentrations in Experiment 3, with an over four-fold greater reduction of total polyphenol concentrations in 2016 than 2017.
In a study of ‘Red Elstar’ and ‘Jonagold’ apple trees by Awad et al. (2001) [52], adjusting carbohydrate availability to fruit via reducing crop load at four and eight WAFB did not impact polyphenol concentrations. In that same study, fruit soluble solid concentration and titratable acidity were increased in trees with a lower crop load, similar to fruit with less or no shading in the “late branch shading” study (Experiment 3) having more soluble solids and titratable acidity than more heavily shaded fruit. Additionally, varying the harvest date by four weeks at the end of fruit development has not been found to influence total polyphenol concentration in apples [53].
Differences in total polyphenol concentrations of fruit from the different sections of trees in Experiment 4 (the “fruit location” study) were likely influenced by localized differences in carbohydrate availability during fruit development, and depending on cultivar, potentially influenced by light exposure to individual fruit. Similar to the shaded regions of the canopy in the “early shading” studies, Interior sections of the tree had less light available for spur leaves and extension shoots early in fruit development when most polyphenol synthesis occurs [24,52]. Similar to Experiment 4, fruit polyphenol concentrations, including flavan-3-ols, have been found to be greater in the exterior, sun exposed regions of the canopy than fruit from the interior canopy [19]. Additionally, similar to Experiment 4, Feng et al. (2014) [19] found fruit size and soluble solid concentration to be greater in fruit from the exterior region of the canopy than the interior.

4.6. Polyphenol Methodology

The Folin-Ciocalteu assay used to measure total polyphenols in our study has high precision, low variability, a relatively wide working range, and is cost and time effective. This assay has also been found to be more accurate than the Löwenthal permanganate assay for measuring polyphenol concentrations in apple juice and cider [54]. However, the Folin-Ciocalteu assay does not measure concentrations of specific polyphenol compounds and is known to measure non-polyphenol compounds that can be reduced, such as ascorbic acid, sulfur dioxide, and reducing sugars [55]. Polyphenol characterization via high performance liquid chromatography would have elucidated exactly which polyphenols were synthesized during our study and recording ratios of fresh to dry weight of tissue samples would have allowed the quantification of total polyphenols on a per fruit basis. Nonetheless, the Folin-Ciocalteu assay is a useful tool in measuring relative differences in polyphenol concentrations among samples from the same cultivar, such as in this research.

4.7. Implications for Cider Apple Orchard Design and Management

Pruning practices and tree training systems that provide more uniform light penetration throughout the tree canopy may result in greater carbohydrate availability to each fruit, and therefore higher polyphenol and soluble solid concentrations, and larger yields. High density orchard designs, such as spindle or V-trellis, have been recently adopted widely in apple producing regions in part due to the greater light interception of the spur canopy, and resultantly larger fruit and greater yields, these designs provide in comparison to many older orchard designs. Additionally, early adjustment of crop load, such as through bloom thinning, may offer a means to decrease carbohydrate demand and thus concomitantly increase fruit size and polyphenol concentration.

5. Conclusions

Altering light exposure to fruit for short periods early in development resulted in differences in polyphenol concentrations that persisted until harvest, while altering light exposure after approximately five weeks after full bloom had minimal impact on polyphenol concentrations. We propose there is a source-sink relationship between carbohydrate availability and polyphenol synthesis during the cell division phase of apple fruit growth. Additionally, greater light exposure to fruiting spurs resulted in increased fruit size and soluble solid concentrations, which are also likely related to carbohydrate availability to developing fruit. Cultivar specific interactions between light exposure and flavan-3-ol synthesis in fruit are likely to exist and require additional study. Nonetheless, the results of the experiments described in this paper suggest that increased cider apple quality is obtained when grown fruit is grown in orchard systems that maximize spur-canopy sunlight interception.

Supplementary Materials

The following supporting information can be downloaded at: https://www.mdpi.com/article/10.3390/horticulturae8110993/s1, Supplementary Figure S1: Percentage of plant assimilable radiation (PAR) permeating the canopy and shadecloth in Experiment 3 of ‘Major’, ‘Ellis Bitter’, and ‘Harry Masters Jersey’ apple trees grown in Lansing, NY. Branches on individual trees were subjected to different shading opacities from week four after full bloom until harvest. Values are means ± standard error (n = 8 ‘Major’ 2016, 8 ‘Ellis Bitter’ 2016, 8 ‘Major’ 2017, and 8 ‘Harry Masters Jersey’ 2017 = 32); Supplementary Table S1. Harvest dates of experiments in different cultivars and years within this study. (‘HMJ’ = ‘Harry Masters Jersey’, ‘SRS’ = ‘Somerset Redstreak’), Supplementary Table S2. Percentage of plant assimilable radiation (PAR) permeating the canopy and shade cloth, and photosynthesis rate of Control leaves exposed to 1500 μmol/m2/s of photons and Shade leaves exposed to 500 μmol/m2/s of photons in cv. ‘Dabinett’ apple trees grown in Lansing, NY. Treatment trees were shaded during weeks 1–5 after full bloom in Experiment 1. Values are means ± standard error (n = 6), Supplementary Table S3. Percentage of plant assimilable radiation (PAR) permeating the canopy and shade cloth two and four weeks after full bloom (WAFB) from cv ‘Ellis Bitter’ and ‘Major’ apple trees grown in Lansing, NY. Branches on individual trees were subjected to different shading treatments during weeks 1–5 after full bloom in Experiment 2. Values are means ± standard error (‘Ellis Bitter’ n = 7, ‘Major’ n = 8). Different lowercase letters indicate a separation of treatments by the Tukey HSD method at a 5% significance level, Supplementary Table S4. Mass of fruit at different stages of development from ‘Dabinett’ apple trees grown in Lansing, NY. Trees were either shaded or un-shaded during weeks 1–5 after full bloom in Experiment 1. Values are means ± standard error (n = 6), Supplementary Table S5. Mass of fruit at different stages of development from ‘Ellis Bitter’ and ‘Major’ apple trees grown in Lansing, NY. Branches on individual trees were subjected to different shading treatments during weeks 1–5 after full bloom in Experiment 2. Values are means ± standard error (‘Ellis Bitter’ n = 7, ‘Major’ n = 8). Different lowercase letters indicate a separation of treatments by the Tukey HSD method at a 5% significance level, Supplementary Table S6. Diameter of fruit at different stages of development from ‘Dabinett’ apple trees grown in Lansing, NY. Trees were either shaded or un-shaded during weeks 1–5 after full bloom in Experiment 1. Values are means ± standard error (n = 6), Supplementary Table S7. Diameter of fruit at different stages of development from ’Ellis Bitter’ and ’Major’ apple trees grown in Lansing, NY. Branches on individual trees were subjected to different shading treatments during the five weeks after full bloom (WAFB) in Experiment 2. Values are means ± standard error (‘Ellis Bitter’ n = 7, ‘Major’ n = 8). Different lowercase letters indicate a separation of treatments by the Tukey HSD method at a 5% significance level, Supplementary Table S8. Total polyphenol concentrations (gallic acid equivalents) of dried fruit cortex tissue at different stages of development and juice from cv ‘Dabinett’ apple trees grown in Lansing, NY. Trees were either shaded or un-shaded during weeks 1–5 after full bloom in Experiment 1. Values are means ± standard error (n = 6), Supplementary Table S9. Total polyphenol concentrations (gallic acid equivalents) of dried fruit cortex tissue at different stages of development and juice from cv ‘Ellis Bitter’ and ‘Major’ apple trees grown in Lansing, NY. Branches on individual trees were subjected to different shading treatments during in the five weeks after full bloom (WAFB) in Experiment 2. Values are means ± standard error (‘Ellis Bitter’ n = 7, ‘Major’ n = 8). Different lowercase letters indicate a mean separation among treatments by the Tukey HSD method at a 5% significance level, Supplementary Table S10. Percentage of plant assimilable radiation (PAR) permeating the canopy and shade cloth in June, July, and August of ‘Major’, ‘Ellis Bitter’, and ‘Harry Masters Jersey’ (’HMJ’) apple trees grown in Lansing, NY in 2016 and 2017. Branches on individual trees were subjected to different shading opacities from four weeks after full bloom until harvest in Experiment 3. Values are means ± standard error (n = 8 ‘Major’ 2016, 8 ‘Ellis Bitter’ 2016, 8 ‘Major’ 2017, and 8 ‘HMJ’ 2017 = 32), Supplementary Table S11. Growing degree days base 10 °C inside shading enclosures of ‘Major’ and ‘Harry Masters Jersey’ (‘HMJ’) apple trees grown in Lansing, NY in 2017. Branches on individual trees were subjected to different shading opacities from four weeks after full bloom until harvest in Experiment 3. Values are means ± standard error (n = 4 ‘Major’ and 4 ‘HMJ’ = 8), Supplementary Table S12. Harvest and fruit characteristics of ‘Major’, ‘Ellis Bitter’, and ‘Harry Masters Jersey’ (‘HMJ’) apple trees grown in Lansing, NY in 2016 and 2017. Branches on individual trees were subjected to different shading opacities from four weeks after full bloom until harvest in Experiment 3. Values are means ± standard error (n = 8 ‘Major’ 2016, 8 ‘Ellis Bitter’ 2016, 8 ‘Major’ 2017, and 8 ‘HMJ’ 2017 = 32), Supplementary Table S13. Juice characteristics of ‘Major’, ‘Ellis Bitter’, and ‘Harry Masters Jersey’ (‘HMJ’) apple trees grown in Lansing, NY. Branches on individual trees were subjected to different shading opacities from four weeks after full bloom until harvest in Experiment 3. Values are means ± standard error (n = 8 ‘Major’ 2016, 8 ‘Ellis Bitter’ 2016, 8 ‘Major’ 2017, and 8 ‘HMJ’ 2017 = 32), Supplementary Table S14. Percentage of plant assimilable radiation (PAR) permeating the canopy in different regions of ‘GoldRush’, ‘Major’, ‘Harry Masters Jersey’ (‘HMJ’), and ‘Somerset Redstreak’ (’SRS’) apple trees in Experiment 4. The study was conducted in Lansing, NY in 2016, 2017, and 2018. Values are means ± standard error (n = 8 × 3 years in ‘GoldRush’, 8 ‘Major’ in 2016, 8 ‘HMJ’ in 2017, and 8 ‘SRS’ in 2018 = 32). Different lowercase letters indicate a separation of treatments by the Tukey HSD method at a 5% significance level, Supplementary Table S15. Growing degree days base 10 °C in different regions of ‘GoldRush’, and ‘Harry Masters Jersey’ (‘HMJ’) apple trees grown in Experiment 4 in Lansing, NY in 2017. Values are means ± standard error (n = 4 ‘GoldRush’ and n = 8 ‘HMJ’). Different lowercase letters indicate a separation of treatments by the Tukey HSD method at a 5% significance level, Supplementary Table S16. Fruit characteristics of apples from different regions of ‘GoldRush’, ‘Major’, ‘Harry Masters Jersey’ (‘HMJ’), and ‘Somerset Redstreak’ (‘SRS’) apple tree canopies grown in Experiment 4. The study was conducted in Lansing, NY in 2016, 2017, and 2018. Values are means ± standard error (n = 8 × 3 years in ‘GoldRush’, 8 ‘Major’ in 2016, 8 ‘HMJ’ in 2017, and 8 ‘SRS’ in 2018 = 32). Different lowercase letters indicate a separation of treatments by the Tukey HSD method at a 5% significance level, Supplementary Table S17. Juice characteristics of apples from different regions of ‘GoldRush’, ‘Major’, ‘Harry Masters Jersey’ (‘HMJ’), and ‘Somerset Redstreak’ (‘SRS’) apple tree canopies grown in Experiment 4. The study was conducted in Lansing, NY in 2016, 2017, and 2018. Values are means ± standard error (n = 8 × 3 years in ‘GoldRush’, 8 ‘Major’ in 2016, 8 ‘HMJ’ in 2017, and 8 ‘SRS’ in 2018 = 32). Different lowercase letters indicate a separation of treatments by the Tukey HSD method at a 5% significance level.

Author Contributions

Conceptualization, A.D.K. and G.M.P.; methodology, A.D.K. and G.M.P.; formal analysis, A.D.K.; investigation, A.D.K.; Writing—Original draft preparation, A.D.K.; Writing—Review and editing, A.D.K. and G.M.P.; visualization, A.D.K.; funding acquisition, G.M.P. All authors have read and agreed to the published version of the manuscript.

Funding

Graduate assistantship funding for A.D.K was provided by Cornell University’s College of Agriculture and Life Sciences and School of Integrative Plant Science—Horticulture Section. This research was supported by the National Institute of Food and Agriculture, U.S. Department of Agriculture, Hatch, under accession 1014042, and the Angry Orchard Cider Company, LLC.

Acknowledgments

We thank Mike Brown, David Zakalik, and the Cornell Orchards Interns for their help and guidance during this project.

Conflicts of Interest

The authors declare no conflict of interest.

References

  1. Becot, F.A.; Bradshaw, T.L.; Conner, D.S. Apple Market Expansion through Value-Added Hard Cider Production: Current Production and Prospects in Vermont. HorTechnology 2016, 26, 220–229. [Google Scholar] [CrossRef] [Green Version]
  2. Brager, D. Cider Trends in the US and Abroad. The Nielsen Company. 2017. Available online: https://www.researchgate.net/publication/328175265_Economic_Case_Studies_of_Cider_Apple_Orchards_in_New_York_State (accessed on 2 June 2021).
  3. Merwin, I.A.; Valois, S.; Padilla-Zakour, O.I. Cider Apples and Cider-Making Techniques in Europe and North America. Hortic. Rev. 2008, 34, 365–415. [Google Scholar]
  4. Copas, L.; Umpleby, R.; Berrie, A. Cider Apple Growers Guide: Guidelines for Integrated Crop Management of Cider Apples; National Association of Cider Makers, Pomology Committee in association with East Malling Research, and the Farming and Wildlife Advisory Group: London, UK, 2011. [Google Scholar]
  5. Robinson, T.L.; Lakso, A.N. Bases of Yield and Production Efficiency in Apple Orchard Systems. J. Am. Soc. Hortic. 1991, 116, 188–194. [Google Scholar] [CrossRef] [Green Version]
  6. Peck, G.; Knickerbocker, W. Economic Case Studies of Cider Apple Orchards in New York State. Fruit Qrtly 2018, 26, 5–10. [Google Scholar]
  7. Barbehenn, R.V.; Peter Constabel, C. Tannins in Plant–Herbivore Interactions. Phytochemistry 2011, 72, 1551–1565. [Google Scholar] [CrossRef]
  8. Robbins, C.T.; Hanley, T.A.; Hagerman, A.E.; Hjeljord, O.; Baker, D.L.; Schwartz, C.C.; Mautz, W.W. Role of Tannins in Defending Plants Against Ruminants: Reduction in Protein Availability. Ecology 1987, 68, 98–107. [Google Scholar] [CrossRef]
  9. Delage, E.; Bohuon, G.; Baron, A.; Drilleau, J.-F. High-Performance Liquid Chromatography of the Phenolic Compounds in the Juice of Some French Cider Apple Varieties. J. Chromatogr. 1991, 555, 125–136. [Google Scholar] [CrossRef]
  10. Lea, A.G.H.; Arnold, G.M. The Phenolics of Ciders: Bitterness and Astringency. J. Sci. Food Agric. 1978, 29, 478–483. [Google Scholar] [CrossRef]
  11. Guyot, S.; Le Bourvellec, C.; Marnet, N.; Drilleau, J.F. Procyanidins are the Most Abundant Polyphenols in Dessert Apples at Maturity. LWT—Food Sci. Technol. 2002, 35, 289–291. [Google Scholar] [CrossRef]
  12. Lea, A.G.H.; Timberlake, C.F. The Phenolics of Ciders. 1. Procyanidins. J. Sci. Food Agric. 1974, 25, 1537–1545. [Google Scholar] [CrossRef]
  13. Lu, Y.; Foo, L.Y. Identification and Quantification of Major Polyphenols in Apple Pomace. Food Chem. 1997, 59, 187–194. [Google Scholar] [CrossRef]
  14. Treutter, D. Biosynthesis of Phenolic Compounds and Its Regulation in Apple. Plant Growth Regul. 2000, 34, 71–89. [Google Scholar] [CrossRef]
  15. Thompson-Witrick, K.A.; Goodrich, K.M.; Neilson, A.P.; Hurley, E.K.; Peck, G.M.; Stewart, A.C. Characterization of the Polyphenol Composition of 20 Cultivars of Cider, Processing, and Dessert Apples (Malus × domestica Borkh.) Grown in Virginia. J. Agric. Food Chem. 2014, 62, 10181–10191. [Google Scholar] [CrossRef] [PubMed]
  16. Zhang, Y.; Li, P.; Cheng, L. Developmental Changes of Carbohydrates, Organic Acids, Amino Acids, and Phenolic Compounds in ‘Honeycrisp’ Apple Flesh. Food Chem. 2010, 123, 1013–1018. [Google Scholar] [CrossRef]
  17. Kahle, K.; Kraus, M.; Richling, E. Polyphenol Profiles of Apple Juices. Mol. Nutr. Food Res. 2005, 49, 797–806. [Google Scholar] [CrossRef]
  18. Guyot, S.; Marnet, N.; Sanoner, P.; Drilleau, J.-F. Variability of the Polyphenolic Composition of Cider Apple (Malus domestica) Fruits and Juices. J. Agric. Food Chem. 2003, 51, 6240–6247. [Google Scholar] [CrossRef]
  19. Feng, F.; Li, M.; Ma, F.; Cheng, L. Effects of Location within the Tree Canopy on Carbohydrates, Organic Acids, Amino Acids and Phenolic Compounds in the Fruit Peel and Flesh from Three Apple (Malus × domestica) Cultivars. Hortic. Res. 2014, 1, 14019. [Google Scholar] [CrossRef] [Green Version]
  20. Grappadelli, L.C.; Lakso, A.N.; Flore, J.A. Early Season Patterns of Carbohydrate Partitioning in Exposed and Shaded Apple Branches. J. Am. Soc. Hortic. Sci. 1994, 119, 596–603. [Google Scholar] [CrossRef] [Green Version]
  21. Jakopic, J.; Stampar, F.; Veberic, R. The Influence of Exposure to Light on the Phenolic Content of ‘Fuji’ Apple. Sci. Hortic. 2009, 123, 234–239. [Google Scholar] [CrossRef]
  22. Chen, W.; Zhang, M.; Zhang, G.; Li, P.; Ma, F. Differential regulation of anthocyanin synthesis in apple peel under different sunlight intensities. Int. J. Mol. Sci. 2019, 20, 6060. [Google Scholar] [CrossRef] [Green Version]
  23. Ju, Z.; Yuan, Y.; Liu, C.; Wang, Y.; Tian, X. Dihydroflavonol Reductase Activity and Anthocyanin Accumulation in ‘Delicious’, ‘Golden Delicious’ and ‘Indo’ Apples. Sci. Hortic. 1997, 70, 31–43. [Google Scholar] [CrossRef]
  24. Ju, Z.-G.; Yuan, Y.-B.; Liou, C.-L.; Xin, S.-H. Relationships among Phenylalanine Ammonia-Iyase Activity, Simple Phenol Concentrations and Anthocyanin Accumulation in Apple. Sci. Hortic. 1995, 61, 215–226. [Google Scholar] [CrossRef]
  25. Lister, C.E.; Lancaster, J.E.; Walker, J.R.L. Developmental Changes in Enzymes of Flavonoid Biosynthesis in the Skins of Red and Green Apple Cultivars. J. Sci. Food Agric. 1996, 71, 313–320. [Google Scholar] [CrossRef]
  26. Alexander, T.R.; King, J.; Zimmerman, A.; Miles, C.A. Regional Variation in Juice Quality Characteristics of Four Cider Apple (Malus × domestica Borkh.) Cultivars in Northwest and Central Washington. HortScience 2016, 51, 1498–1502. [Google Scholar] [CrossRef]
  27. Soil Survey Staff. Keys to Soil Taxonomy, 12th ed.; USDA, NRSC: Washington, DC, USA, 2014. [Google Scholar]
  28. Agnello, A.; Brown, B.; Carroll, J.; Cheng, L.; Cox, K.; Curtis, P.; Helms, M.; Kain, D.; Robinson, T. Cornell Pest Management Guidelines for Commercial Tree Fruit Production; Cornell Cooperative Extension: Ithaca, NY, USA, 2019. [Google Scholar]
  29. Watkins, C.B.; Nock, J.F.; Whitaker, B.D. Responses of Early, Mid and Late Season Apple Cultivars to Postharvest Application of 1-methylcyclopropene (1-MCP) Under Air and Controlled Atmosphere Storage Conditions. Postharvest Bio. Tech. 2000, 1, 17–32. [Google Scholar] [CrossRef]
  30. Bhusal, N.; Han, S.G.; Yoon, T.M. Summer pruning and reflective film enhance fruit quality in excessively tall spindle apple trees. Hortic. Enviro. Biotech. 2017, 58, 560–567. [Google Scholar] [CrossRef]
  31. Blanpied, G.D.; Silsby, K.J. Predicting harvest date windows for apples. In Information Bulletin 221; Cornell Cooperative Extension: Ithaca, NY, USA, 1992. [Google Scholar]
  32. Kumar, S.K.; Wojtyna, N.; Dougherty, L.; Xu, K.; Peck, G.M. Classifying Cider Apple Germplasm Using Genetic Markers for Fruit Acidity. J. Am. Soc. Hortic. Sci. 2021, 146, 267–275. [Google Scholar] [CrossRef]
  33. Singleton, V.L.; Rossi, J.A. Colorimetry of Total Phenolics with Phosphomolybdic-Phosphotungstic Acid Reagents. Am. J. Enol. Vitic. 1965, 16, 144–158. [Google Scholar]
  34. Wünsche, J.N.; Lakso, A.N. The Relationship Between Leaf Area and Light Interception by Spur and Extension Shoot Leaves and Apple Orchard Productivity. HortScience 2000, 35, 1202–1206. [Google Scholar] [CrossRef] [Green Version]
  35. Lakso, A.N.; Grappadelli, A.N. Implications of Pruning and Training Practices to Carbon Partitioning and Fruit Development in Apple. Acta Hortic. 1991, 322, 231–240. [Google Scholar] [CrossRef]
  36. Robinson, T. The Evolution Towards More Competitive Apple Orchard Systems in the USA. Acta Hortic. 2008, 772, 491–500. [Google Scholar] [CrossRef]
  37. Wünsche, J.N.; Lakso, A.N.; Robinson, T.L.; Lenz, F.; Denning, S.S. The Bases of Productivity in Apple Production Systems: The Role of Light Interception by Different Shoot Types. J. Am. Soc. Hortic. Sci. 1996, 121, 886–893. [Google Scholar] [CrossRef] [Green Version]
  38. Lakso, A.N.; Grappadelli, L.C.; Barnard, J.; Goffinet, M.C. An Expolinear Model of the Growth Pattern of the Apple Fruit. J. Hortic. Sci. 1995, 70, 389–394. [Google Scholar] [CrossRef]
  39. Lakso, A.N.; Robinson, T.L.; Pool, R.M. Canopy microclimate effects on patterns of fruiting and fruit development in apples and grapes. In Manipulation of Fruiting; Wright, C.J., Ed.; Butterworths: London, UK, 1989; pp. 263–274. [Google Scholar]
  40. Bepete, M.; Lakso, A.N. Differential Effects of Shade on Early-Season Fruit and Shoot Growth Rates in “Empire” Apple. HortScience 1998, 33, 823–825. [Google Scholar] [CrossRef] [Green Version]
  41. Awad, M.A.; Wagenmakers, P.S.; de Jager, A. Effects of Light on Flavonoid and Chlorogenic Acid Levels in the Skin of ‘Jonagold’ Apples. Sci. Hortic. 2001, 88, 289–298. [Google Scholar] [CrossRef]
  42. Bialczyk, J.; Lechowski, Z.; Libik, A. The Protective Action of Tannins against Glasshouse Whitefly in Tomato Seedlings. J. Agric. Sci. 1999, 133, 197–201. [Google Scholar] [CrossRef]
  43. McArt, S.H.; Halitschke, R.; Salminen, J.-P.; Thaler, J.S. Leaf Herbivory Increases Plant Fitness via Induced Resistance to Seed Predators. Ecology 2013, 94, 966–975. [Google Scholar] [CrossRef]
  44. Stopar, M.; Bolcina, U.; Vanzo, A.; Vrhovsek, U. Lower Crop Load for Cv. Jonagold Apples (Malus × domestica Borkh.) Increases Polyphenol Content and Fruit Quality. J. Agric. Food Chem. 2002, 50, 1643–1646. [Google Scholar] [CrossRef]
  45. Renard, C.M.G.C.; Dupont, N.; Guillermin, P. Concentrations and Characteristics of Procyanidins and Other Phenolics in Apples during Fruit Growth. Phytochemistry 2007, 68, 1128–1138. [Google Scholar] [CrossRef]
  46. Guyot, S.; Marnet, N.; Laraba, D.; Sanoner, P.; Drilleau, J.-F. Reversed-Phase HPLC Following Thiolysis for Quantitative Estimation and Characterization of the Four Main Classes of Phenolic Compounds in Different Tissue Zones of a French Cider Apple Variety (Malus domestica Var. Kermerrien). J. Agric. Food Chem. 1998, 46, 1698–1705. [Google Scholar] [CrossRef]
  47. Henry-Kirk, R.A.; McGhie, T.K.; Andre, C.M.; Hellens, R.P.; Allan, A.C. Transcriptional Analysis of Apple Fruit Proanthocyanidin Biosynthesis. J. Exp. Bot. 2012, 63, 5437–5450. [Google Scholar] [CrossRef] [PubMed] [Green Version]
  48. Chen, C.S.; Zhang, D.; Wang, Y.Q.; Li, P.M.; Ma, F.W. Effects of Fruit Bagging on the Contents of Phenolic Compounds in the Peel and Flesh of ‘Golden Delicious’, ‘Red Delicious’, and ‘Royal Gala’ Apples. Sci. Hortic. 2012, 142, 68–73. [Google Scholar] [CrossRef]
  49. Awad, M.A.; de Jager, A.; van Westing, L.M. Flavonoid and Chlorogenic Acid Levels in Apple Fruit: Characterisation of Variation. Sci. Hortic. 2000, 83, 249–263. [Google Scholar] [CrossRef]
  50. Takos, M.A.; Robinson, P.S.; Walker, R.A. Transcriptional Regulation of the Flavonoid Pathway in the Skin of Dark-Grown ‘Cripps’ Red’ Apples in Response to Sunlight. J. Hortic. Sci. Biotechnol 2006, 81, 735–744. [Google Scholar] [CrossRef]
  51. Calderon-Zavala, G.; Lakso, A.N.; Piccioni, R.M. Temperature Effects on Fruit and Shoot Growth in the Apple (Malus domestica) Early in the Season. Acta Hortic. 2002, 636, 447–453. [Google Scholar] [CrossRef]
  52. Awad, M.A.; De Jager, A.; Dekker, M.; Jongen, W.M.F. Formation of Flavonoids and Chlorogenic Acid in Apples as Affected by Crop Load. Sci. Hortic. 2001, 91, 227–237. [Google Scholar] [CrossRef]
  53. Ewing, B.L.; Peck, G.M.; Ma, S.; Neilson, A.P.; Stewart, A.C. Management of Apple Maturity and Postharvest Storage Conditions to Increase Polyphenols in Cider. HortScience 2019, 54, 143–148. [Google Scholar] [CrossRef] [Green Version]
  54. Ma, S.; Kim, C.; Neilson, A.P.; Griffin, L.E.; Peck, G.M.; O’Keefe, S.F.; Stewart, A.C. Comparison of Common Analytical Methods for the Quantification of Total Polyphenols and Flavanols in Fruit Juices and Ciders. J. Food Sci. 2019, 84, 2147–2158. [Google Scholar] [CrossRef] [Green Version]
  55. Everette, J.D.; Bryant, Q.M.; Green, A.M.; Abbey, Y.A.; Wangila, G.W.; Walker, R.B. Thorough Study of Reactivity of Various Compound Classes toward the Folin−Ciocalteu Reagent. J. Agric. Food Chem. 2010, 58, 8139–8144. [Google Scholar] [CrossRef]
Figure 1. Experiment 2 shading periods and fruit sampling times of different treatments on cv. ‘Ellis Bitter’ and ‘Major’ apple tree branches grown in Lansing, NY in 2018.
Horticulturae 08 00993 g001
Figure 2. Total polyphenol concentrations (gallic acid equivalents) of dried fruit cortex tissue and fruit mass at different stages of development of ‘Dabinett’ apple trees grown in Lansing, NY. Trees were either shaded or un-shaded during weeks 1–5 after full bloom. Values are means ± standard error (n = 6). Asterisks (*) represent statistically significantly differences for both total polyphenol concentrations and mass between treatments in a categorical mixed effects model at a 5% significance level.
Horticulturae 08 00993 g002
Figure 3. Total polyphenol concentrations (gallic acid equivalents) of dried fruit cortex tissue different stages of development of ‘Ellis Bitter’ and ‘Major’ apple trees grown in Lansing, NY. Branches on individual trees were subjected to shading treatments during weeks 1–3, 3–5, or 1–5 after flowing. Values are means ± standard error (n = 7 ‘Ellis Bitter’ + 8 ‘Major’ = 15). Different lowercase letters indicate a separation of treatments by the Tukey HSD method at a 5% significance level.
Horticulturae 08 00993 g003
Figure 4. Mean fruit and juice characteristics from ‘Major’ (n = 8 for 2016 and 2017), ‘Ellis Bitter’ (n = 8), and ‘Harry Masters Jersey’ (n = 8) apple trees grown in Lansing, NY in 2016 and 2017. Branches on individual trees were subjected to different shading opacities from four weeks after full bloom until harvest. Values are means relative to the Control treatment ± standard error.
Horticulturae 08 00993 g004
Figure 5. Fruit and juice characteristics of apples from different regions of ‘GoldRush’, ‘Major’, ‘Harry Masters Jersey’, and ‘Somerset Redstreak’ apple tree canopies grown in Lansing, NY in 2016, 2017, and 2018. Values are mean values relative to the Top treatment ± standard error (n = 8 × 3 years in ‘GoldRush’, 8 ‘Major’ in 2016, 8 ‘Harry Masters Jersey’ in 2017, and 8 ‘Somerset Redstreak’ in 2018 = 32). Different lowercase letters indicate a separation of treatments by the Tukey HSD method at a 5% significance level.
Horticulturae 08 00993 g005
Table 1. Fruit and juice characteristics of ‘Dabinett’ apple trees grown in Lansing, NY. Trees were either unshaded (Control) or shaded during weeks 1–5 after full bloom. Values are means ± standard error (n = 6).
TreatmentStarch Pattern Index (1–8)Peel Blush (%)Chlorophyll a IndexSoluble Solids (°Brix)pHTitratable Acidity (g Malic Acid/L)
Control4.57 ± 0.1872 ± 21.67 ± 0.0511.0 ± 0.34.61 ± 0.101.06 ± 0.04
Shade4.47 ± 0.2175 ± 21.63 ± 0.0410.4 ± 0.24.72 ± 0.101.10 ± 0.03
p-value0.7250.2360.63340.1260.0820.478
Table 2. Fruit and juice characteristics of ‘Ellis Bitter’ and ‘Major’ apple trees grown in Lansing, NY. Branches on individual trees were subjected to different shading treatments during the five weeks after full bloom (WAFB). Values are means ± standard error (‘Ellis Bitter’ n = 7, ‘Major’ n = 8). Different lowercase letters indicate a separation of treatments by the Tukey HSD method at a 5% significance level.
CultivarTreatmentStarch Pattern Index
(1–8)
Peel Blush (%)Chlorophyll a IndexSoluble Solids (°Brix)pHTitratable Acidity (g Malic Acid/L)
‘Ellis Bitter’Control6.9 ± 0.455 ± 21.08 ± 0.049.4 ± 0.24.36 ± 0.021.79 ± 0.04
‘Major’2.9 ± 0.248 ± 31.05 ± 0.1110.5 ± 0.34.32 ± 0.032.22 ± 0.17
‘Ellis Bitter’1–3 WAFB7.0 ± 0.253 ± 21.23 ± 0.059.0 ± 0.24.36 ± 0.031.81 ± 0.04
‘Major’2.9 ± 0.242 ± 41.16 ± 0.089.8 ± 0.24.31 ± 0.022.22 ± 0.04
‘Ellis Bitter’3–5 WAFB6.6 ± 0.2850 ± 21.26 ± 0.069.1 ± 0.34.38 ± 0.031.82 ± 0.04
‘Major’2.3 ± 0.244 ± 41.09 ± 0.109.7 ± 0.24.31 ± 0.022.28 ± 0.10
‘Ellis Bitter’1–5 WAFB7.2 ± 0.1448 ± 31.32 ± 0.058.2 ± 0.34.39 ± 0.021.76 ± 0.08
‘Major’2.9 ± 0.244 ± 31.03 ± 0.1110.3 ± 0.54.34 ± 0.022.28 ± 0.11
p-valueTreatment0.0720.1330.1150.0880.2170.951
Cultivar<0.0010.0060.1700.0010.113<0.001
Treatment × Cultivar0.8020.3060.0690.1630.8120.884
Table 3. Fruit characteristics of bagged (Bag) and un-bagged (Control) apples from ‘Major’, ‘Ellis Bitter’, and ‘GoldRush’ apple trees grown in Lansing, NY in 2016, and 2017. Bag apples had an opaque paper bag placed over fruit at three weeks after full bloom until harvest. Values are means ± standard error (n = 5 ‘Ellis Bitter’ and 5 ‘GoldRush’ in 2016 and 5 ‘Major’, 5 ‘‘Ellis Bitter’, and 5 ‘GoldRush’ in 2017).
CultivarTreatmentMass (g)Peel Blush (%)Green Scale (1–5)Chlorophyll a IndexStarch Pattern Index (1–8)Firmness (N)
‘Major’Control89.3 ± 7.669.6 ± 4.6-0.46 ± 0.126.2 ± 0.265.4 ± 1.5
‘Ellis Bitter’67.0 ± 3.150.8 ± 1.9-1.30 ± 0.097.0 ± 0.173.3 ± 2.2
‘GoldRush’175.6 ± 0.3-3.0 ± 0.20.64 ± 0.063.9 ± 0.184.1 ± 1.1
‘Major’Bag66.4 ± 6.20.4 ± 0.1-0.02 ± 0.017.7 ± 0.258.4 ± 1.4
‘Ellis Bitter’50.1 ± 3.30.1 ± 0.0-1.14 ± 0.067.4 ± 0.274.7 ± 3.0
‘GoldRush’175.5 ± 20.6-1.0 ± 0.00.23 ± 0.044.0 ± 0.185.2 ± 0.7
p-valueTreatment<0.001<0.001<0.001<0.001<0.0010.098
Cultivar<0.001<0.001-<0.001<0.001<0.001
Year<0.0010.3370.926-0.015<0.001
Treatment × Cultivar0.006<0.001-0.121<0.0010.005
Treatment × Year0.8230.3010.926-0.4880.490
Table 4. Juice characteristics of bagged (Bag) and unbagged (Control) apples from ‘Major’, ‘Ellis Bitter’, and ‘GoldRush’ apple trees grown in Lansing, NY in 2016, and 2017. Bag apples had an opaque paper bag placed over fruit at three weeks after full bloom until harvest. Values are means ± standard error (n = 5 ‘Ellis Bitter’ and 5 ‘GoldRush’ in 2016 and 5 ‘Major’, 5 ‘Ellis Bitter’, and 5 ‘GoldRush’ in 2017).
CultivarTreatmentSoluble Solid Concentration (°Brix)pHTitratable Acidity
(g Malic Acid/L)
Total Polyphenols
(g GAE/L Z)
‘Major’Control13.1 ± 0.44.44 ± 0.012.2 ± 0.11.39 ± 0.19
‘Ellis Bitter’10.6 ± 0.34.44 ± 0.022.0 ± 0.00.95 ± 0.08
‘GoldRush’14.0 ± 0.33.38 ± 0.029.4 ± 0.30.37 ± 0.02
‘Major’Bag12.4 ± 0.64.49 ± 0.052.3 ± 0.11.77 ± 0.21
‘Ellis Bitter’10.4 ± 0.44.47 ± 0.022.1 ± 0.00.97 ± 0.05
‘GoldRush’12.9 ± 0.23.49 ± 0.017.6 ± 0.20.23 ± 0.02
p-valueTreatment<0.001<0.001<0.0010.159
Cultivar<0.001<0.001<0.001<0.001
Year0.1600.2570.9260.955
Treatment × Cultivar0.0150.008<0.001<0.001
Treatment × Year0.3220.3060.5210.064
Z GAE = gallic acid equivalents.
Publisher’s Note: MDPI stays neutral with regard to jurisdictional claims in published maps and institutional affiliations.

