Article

Expression Analysis of Brassinolide-Metabolism-Related Genes at Different Growth Stages of Pak Choi

College of Horticulture, Shanxi Agricultural University, Taigu 030801, China
*
Authors to whom correspondence should be addressed.
Horticulturae 2022, 8(11), 1093; https://doi.org/10.3390/horticulturae8111093
Submission received: 19 August 2022 / Revised: 13 November 2022 / Accepted: 17 November 2022 / Published: 20 November 2022
(This article belongs to the Section Genetics, Genomics, Breeding, and Biotechnology (G2B2))

Abstract

:
Pak choi needs to be exposed to low temperature (vernalized) before flowering will initiate. Early bolting caused by low temperature often occurs in spring and leads to significant economic losses. Therefore, it is of great practical significance to study the flowering process of pak choi. Brassinolide (BR) plays a certain role in the flowering process of pak choi. In order to better understand the role of BR in the flowering process of pak choi, the BR content in the shoot apices of pak choi at different growth stages was determined by enzyme-linked immunosorbent assay (ELISA). The results showed that the BR content increased after low-temperature treatment. With the progress of vegetative growth, the BR content decreased and reached the lowest at 10 days after transplanting (V10), then the content increased and reached a small peak at the critical period of floral bud differentiation (S0). After initiation of floral bud differentiation, the content decreased at floral bud differentiation stage 1 (S1), and then gradually increased and reached a peak at floral bud differentiation stage 3 (S3). In order to clarify the molecular mechanism of BR content changes, we analyzed the expressions of key enzymes coding genes in the BR metabolic pathway, and found that six major synthase-encoding genes (Bra008760, Bra030023, Bra036097, Bra027405, Bra011678, and Bra025409) were upregulated at the critical period of floral bud differentiation, leading to the increase in BR content, which were consistent with changes in the BR content. By analyzing the functions of differentially expressed genes (DEGs) between the vegetative growth stage (V10) and the critical period of floral bud differentiation (S0), 21 DEGs were found to be related to BR metabolism. These findings can provide a reference for elucidating the molecular mechanism of BR regulating the flowering process of pak choi.

1. Introduction

Pak choi (Brassica rapa ssp. chinensis Makino var. communis Tsen et Lee) belongs to the genus Brassica of the Brassicaceae family and is a vegetable that needs to be exposed to low temperature for a long time before flowering is initiated. In spring cultivation, early bolting caused by low temperatures decreased its yield and quality [1]. Hormone metabolism is an important regulatory pathway in the vernalization mechanism. Among the six major plant hormones currently recognized, gibberellin (GA) is particularly important for plant vernalization. However, brassinolide (BR) also exerts an influence on vernalization and flowering [2]. Brassinosteroids (BRs) are a new class of phytohormones, which play an important role in the growth and development of plants. They can promote plant cell division [3], regulate photomorphogenesis [4], promote hypocotyl elongation [5,6], and participate in physiological processes such as plant root growth and development [7,8,9,10], flowering [11], pollen tube growth [12], and senescence [6,13]. BRs have relatively high abundance in young plant tissues, flowers, and seeds. Brassinolide (BR), the most active form, was first isolated and purified from rape pollen in 1979 [14], which plays an important role in plant floral bud differentiation [15,16,17,18,19,20]. It was found that tobacco seedlings would transform from vegetative growth to reproductive growth when they underwent vernalization at low temperature, which promoted the formation of floral buds and then grew and developed into flower organs, pointing out that BR played an important role in the vernalization of tobacco seedlings [15]. The experimental results of tobacco also showed that the relative expression levels of genes related to BR signal transduction were increased and the expression level of the FLOWERING LOCUS C (FLC) gene was inhibited, leading to the advance of floral bud differentiation [16,17]. In Arabidopsis thaliana, most BR synthesis mutants and BR-signal-transduction-pathway-related mutants showed prolonged vegetative growth and delayed flowering [11]. BRASSINOSTEROID INSENSITIVE 1 (BRI1) was cloned and identified from common wheat and transferred into Arabidopsis thaliana. The results showed that overexpression of TaBRI1 resulted in early flowering [18]. The cloning and functional verification of soybean brassinolide CONSTITUTIVE PHOTOMORPHISM AND DWARFISM (CPD) showed that GmCPDs contributed to flowering development and were essential in the early stages of flowering regulation [19]. The BR-signaling-pathway-related gene SET DOMAIN GROUP PROTEIN 725 (SDG725) was also involved in flowering regulation in Rice [20]. Overexpression of the DWARF 4 (DWF4) gene in mustard showed that the bolting time and flowering time of transgenic plants were earlier than those of wild type [21]. However, there are few studies on the correlation between BR and floral bud differentiation in pak choi. Therefore, this study investigated the BR content in the shoot apices of pak choi at different growth stages and analyzed the expressions of BR-metabolism-related genes by RNA-Seq, to clarify the molecular mechanism of BR regulating the flowering process of pak choi.

2. Materials and Methods

2.1. Plant Materials and Growth Conditions

Early-bolting pak choi line “75#” was used in this study and was provided by the Institute of Vegetable Research, Shanxi Academy of Agricultural Sciences. This study was carried out at the horticultural station of Shanxi Agricultural University. The experiment included two treatments: low-temperature treatment and control. For the former (designated as V), the germinating seeds were maintained at 4 °C for 20 days. In the control (designated as CK), the seeds were germinated at 25 °C. Seedlings with the same size were transplanted to trays with 50 holes full of substrate at the same time. The plants were then cultivated using traditional methods.

2.2. Sample Collection

After low-temperature treatment, the shoot apices were collected and designated as V0 and CK0 for the low-temperature treatment and control groups, respectively. On 10 days (vegetative growth, V10), 15 days (the critical period of floral bud differentiation, S0), 16 days (floral bud differentiation stage 1, S1), 17 days (floral bud differentiation stage 3, S3), and 18 days (floral bud differentiation stage 5, S5) after transplantation, shoot apices were also collected from both groups; the low-temperature treatment and control samples collected at these times were named as V10-75-1/2/3, CK10-75-1/2/3, S0-75-1/2/3, CK15, S1-75-1/2/3, CK16, S3-75-1/2/3, CK17, S5-75-1/2/3, and CK18, respectively. BR assay samples weighed 0.2 g, and three biological replicates were performed for each treatment. Each 0.1 g sample was used for RNA extraction and was stored at −80 °C.

2.3. Determination of the BR Content

The BR content of pak choi shoot apices at different growth stages was determined in China Agricultural University using the enzyme-linked immunosorbent assay (ELISA) method [22], and three biological replicates were performed for each treatment.

2.4. Total RNA extraction

Total RNA was extracted by RNAprep pure Plant Kit (TIANGEN, Beijing) and the samples were stored at −80 °C.

2.5. Transcriptome Sequencing

The samples used for sequencing were V10-75-1/2/3, S0-75-1/2/3, S1-75-1/2/3, S3-75-1/2/3, and S5-75-1/2/3. The mRNA from the total RNA samples was enriched using oligo magnetic adsorption, and the resulting RNA was fragmented. The RNA fragments served as a template for first-strand cDNA synthesis using random hexamers and reverse transcriptase. Second-strand cDNA was synthesized using DNA polymerase I and RNaseH and purified using a QiaQuick PCR extraction kit. Finally, cDNA fragments of a suitable length (300–500 bp) were obtained by agarose gel electrophoresis and amplified by PCR to construct the final cDNA libraries for paired-end sequencing using the Illumina HiSeq 2500 system (Biomarker Technologies Co., Ltd., Beijing, China). Expression analysis and functional annotation methods were performed as described previously [23].

2.6. Gene Expression and Functional Annotation Analysis

The raw sequences of the two datasets were evaluated. Raw reads were processed by removing reads containing adaptors and reads with more than 10% of unknown bases. Low-quality reads were filtered out so that each read with a quality score of less than 10 was not more than half of the bases, and the clean reads consisted of more than 80% of bases with a Q-value of 30. The clean reads were aligned with TopHat software [24] and then were mapped with the reference gene sequence (http://brassicadb.cn (accessed on 13 November 2022)), allowing for up to 1 bp of mismatch only. The mapped reads were classified as annotated.
Gene expression levels were measured as fragments per kilobase of transcript per million mapped reads (FPKM). Differentially expressed genes (DEGs) between different growth stages were identified using DESeq2 software. A false discovery rate (FDR) < 0.01 and fold change (FC) ≥ 2 were considered as the threshold of differential gene expression. The gene expression of each sample was grouped and compared (V10 vs. S0, S0 vs. S1, S1 vs. S3), and gene ontology (GO) analysis and Kyoto Encyclopedia of Genes and Genomes (KEGG) pathway analysis were performed for all DEGs.

2.7. Quantitative Real-Time PCR (qRT-PCR)

Four genes were randomly selected for qRT-PCR verification of pak choi shoot apices at different growth stages. The PrimerBLAST online website (https://www.ncbi.nlm.nih.gov/tools/primer-blast/index.cgi?LINK_LOC=BlastHome (accessed on 13 November 2022)) was used to design specific primers, and the ACTIN-7 (LOC103855835) gene of Chinese cabbage was used as the reference gene. The primers are shown in Supplementary Table S1. After RNA extraction, reverse transcription to generate cDNA was performed using a PrimeScriptTM RT Reagent Kit (TaKaRa, RR037A) and qRT-PCR was performed using TB Green® Premix Ex TaqTM II (TaKaRa, RR820A). The reaction conditions of the 20 µL reaction system were as follows: 94 °C for 5 min; 40 cycles of 94 °C for 30 s, 55 °C for 30 s, and 72 °C for 30 s. The PCR reactions were performed on an ABI 7500 real-time PCR system; each reaction was performed with three technical replicates, and relative expression levels were calculated using the 2-ΔΔCT method [25].

3. Results

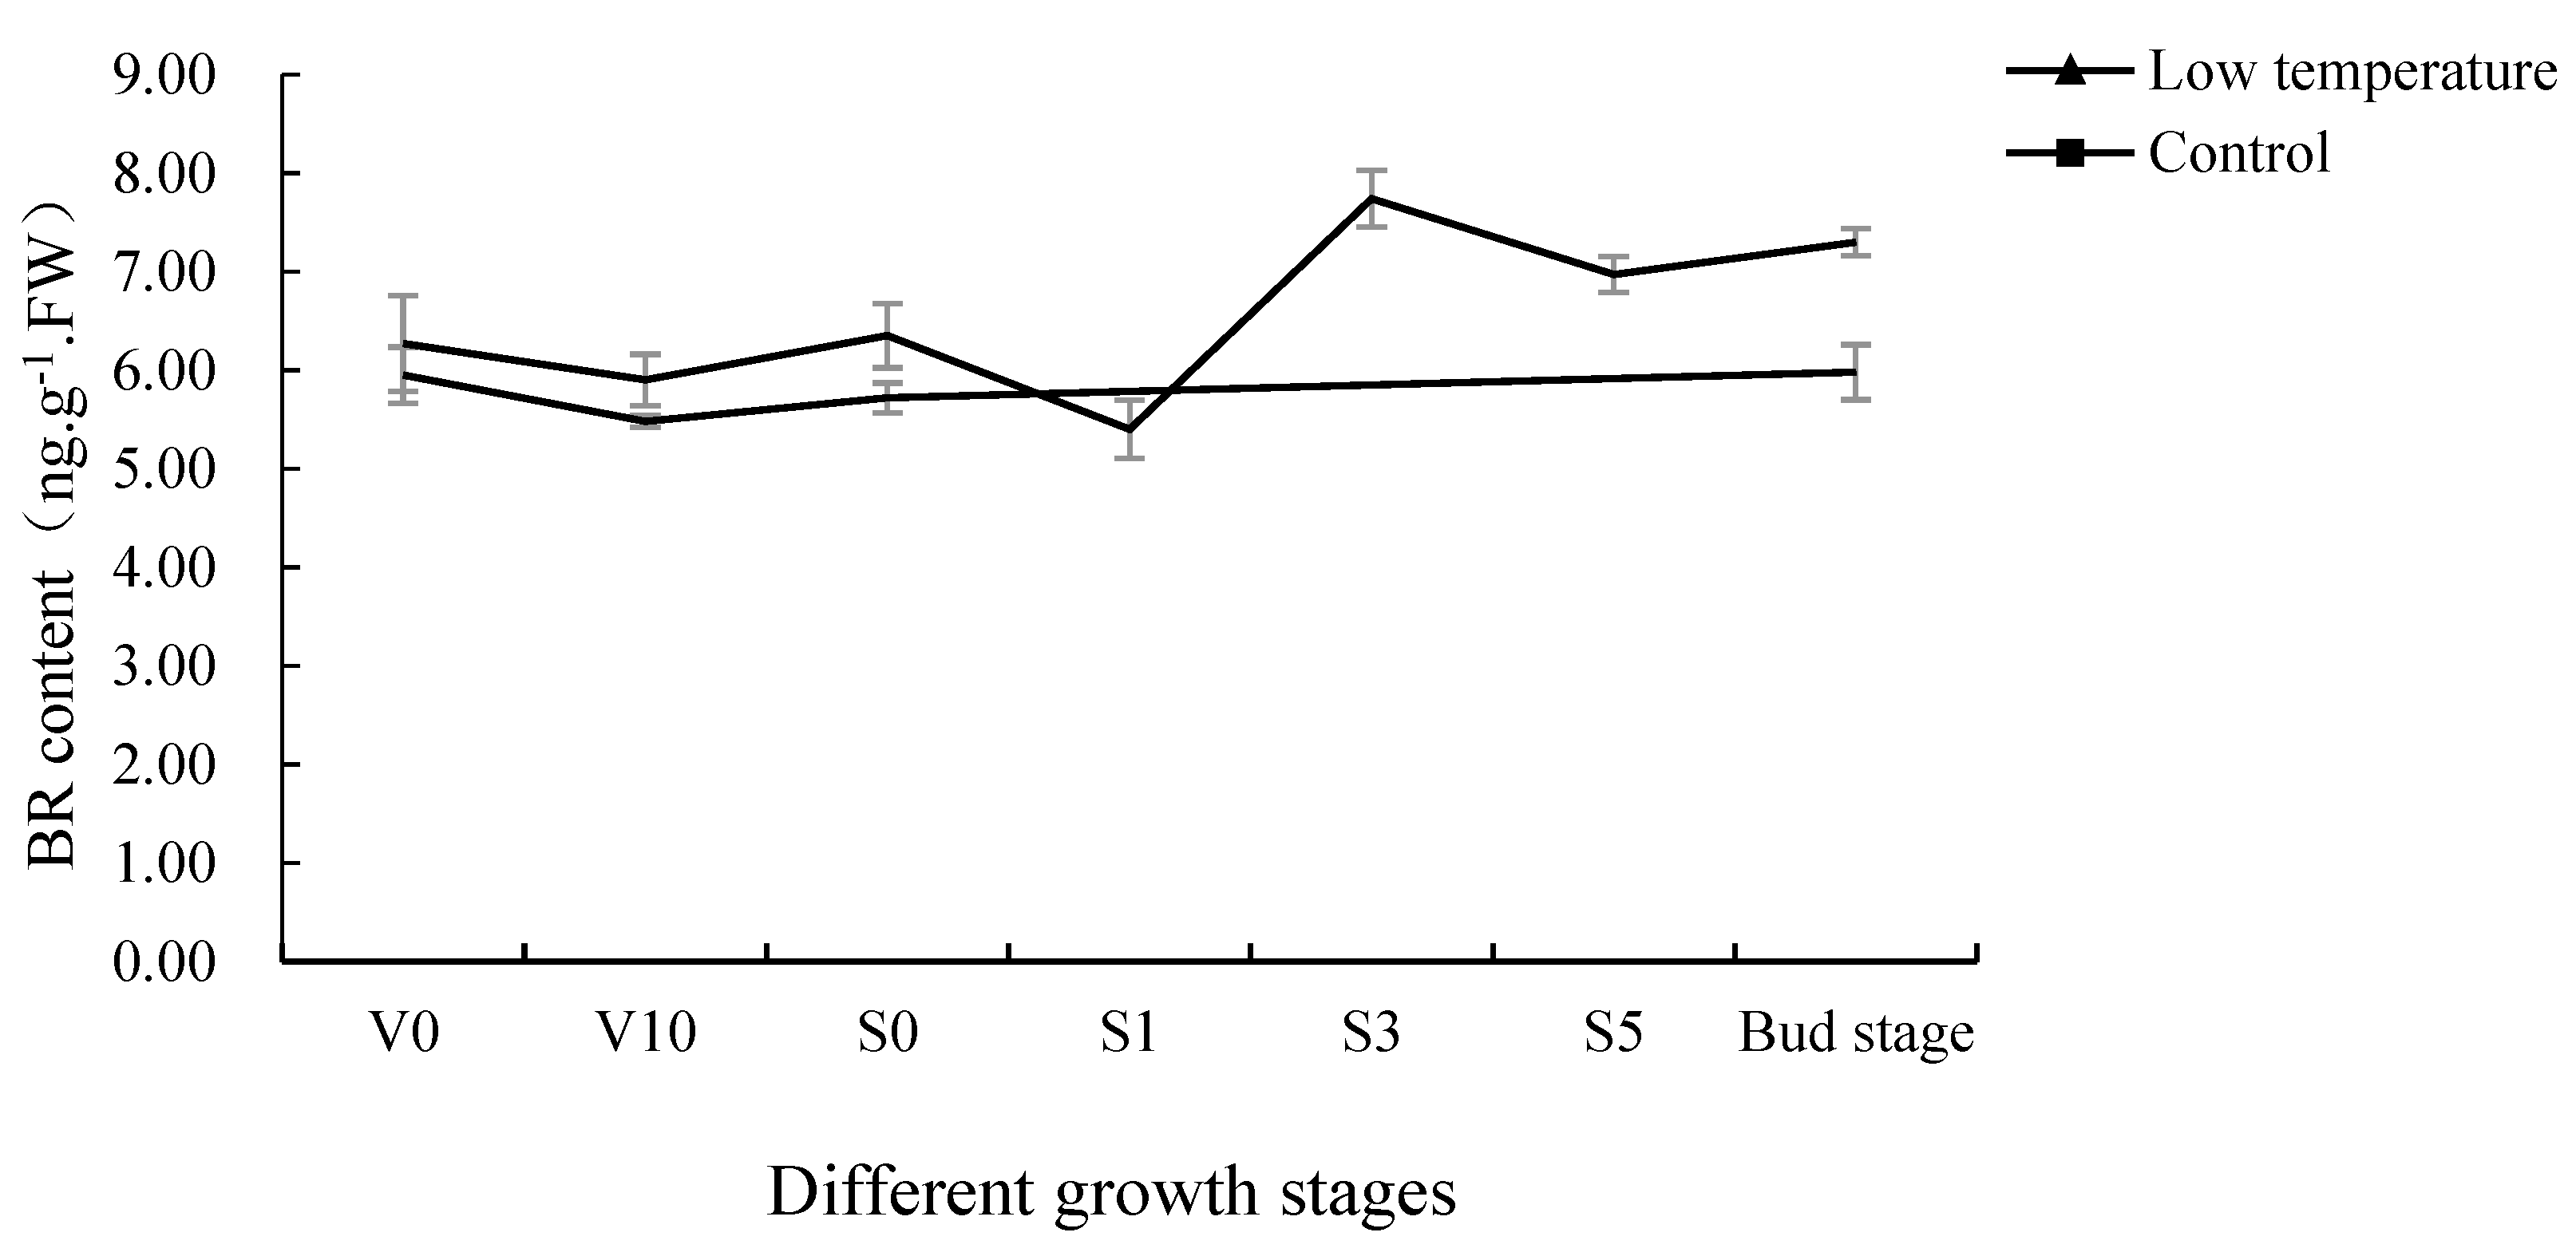
3.1. BR Content of Pak Choi Shoot Apices at Different Growth Stages

The BR content of the pak choi shoot apices at different growth stages was measured (Figure 1). The BR content in the V0 was 6.27 ng·g−1·FW after low-temperature treatment and then decreased with vegetative growth. The BR content at V10 was 5.90 ng·g−1·FW, and it increased gradually thereafter. When floral buds were about to differentiate (15 days after transplanting, S0), its content reached a small peak of 6.35 ng·g−1·FW, and then decreased to 5.40 ng·g−1·FW at floral bud differentiation stage 1 (16 days after transplanting, S1). After that, the BR content increased rapidly and reached the peak at floral bud differentiation stage 3 (17 days after transplanting, S3), with a content of 7.74 ng·g−1·FW, which had remained at a high level from then on. The above may be because pak choi needs a higher BR to promote the beginning of floral bud differentiation, and floral bud differentiation would consume a lot of BR, resulting in a sudden drop in BR content at floral bud differentiation stage 1. Then, with the progress of floral bud differentiation, its BR content had increased and stabilized at a higher level to promote floral bud bolting. For the control group, except for the BR content of pak choi decreasing slightly from V0 to V10, it remained at a relatively stable level in the rest periods with little change trend. In general, the BR content in the low-temperature treatment group was higher than that in the control group, which indicated that BR content rose with the floral bud differentiation of pak choi, and low-temperature treatment increased BR content.

3.2. Transcriptomic Analysis

3.2.1. Evaluation of Sequencing Results

To analyze the gene expression in the pak choi shoot apices at different growth stages, a total of 15 libraries, three replicate libraries for each V10, S0, S1, S3, and S5, were constructed. The summary results of high-throughput sequencing data for each library are shown in Table 1. A total of 111.44 Gb of Clean Data were obtained, and the Q30 base percentage of each sample was not less than 94.17%. The total reads measured for each sample ranged from 39,083,622 to 56,949,456. High-quality Total Reads obtained from each library were compared with the reference genome database, and the number of reads compared to the unique location of the reference genome ranged from 82.00 to 85.44%, implying that the quality of the sequencing data was satisfactory and could be used for subsequent analysis.

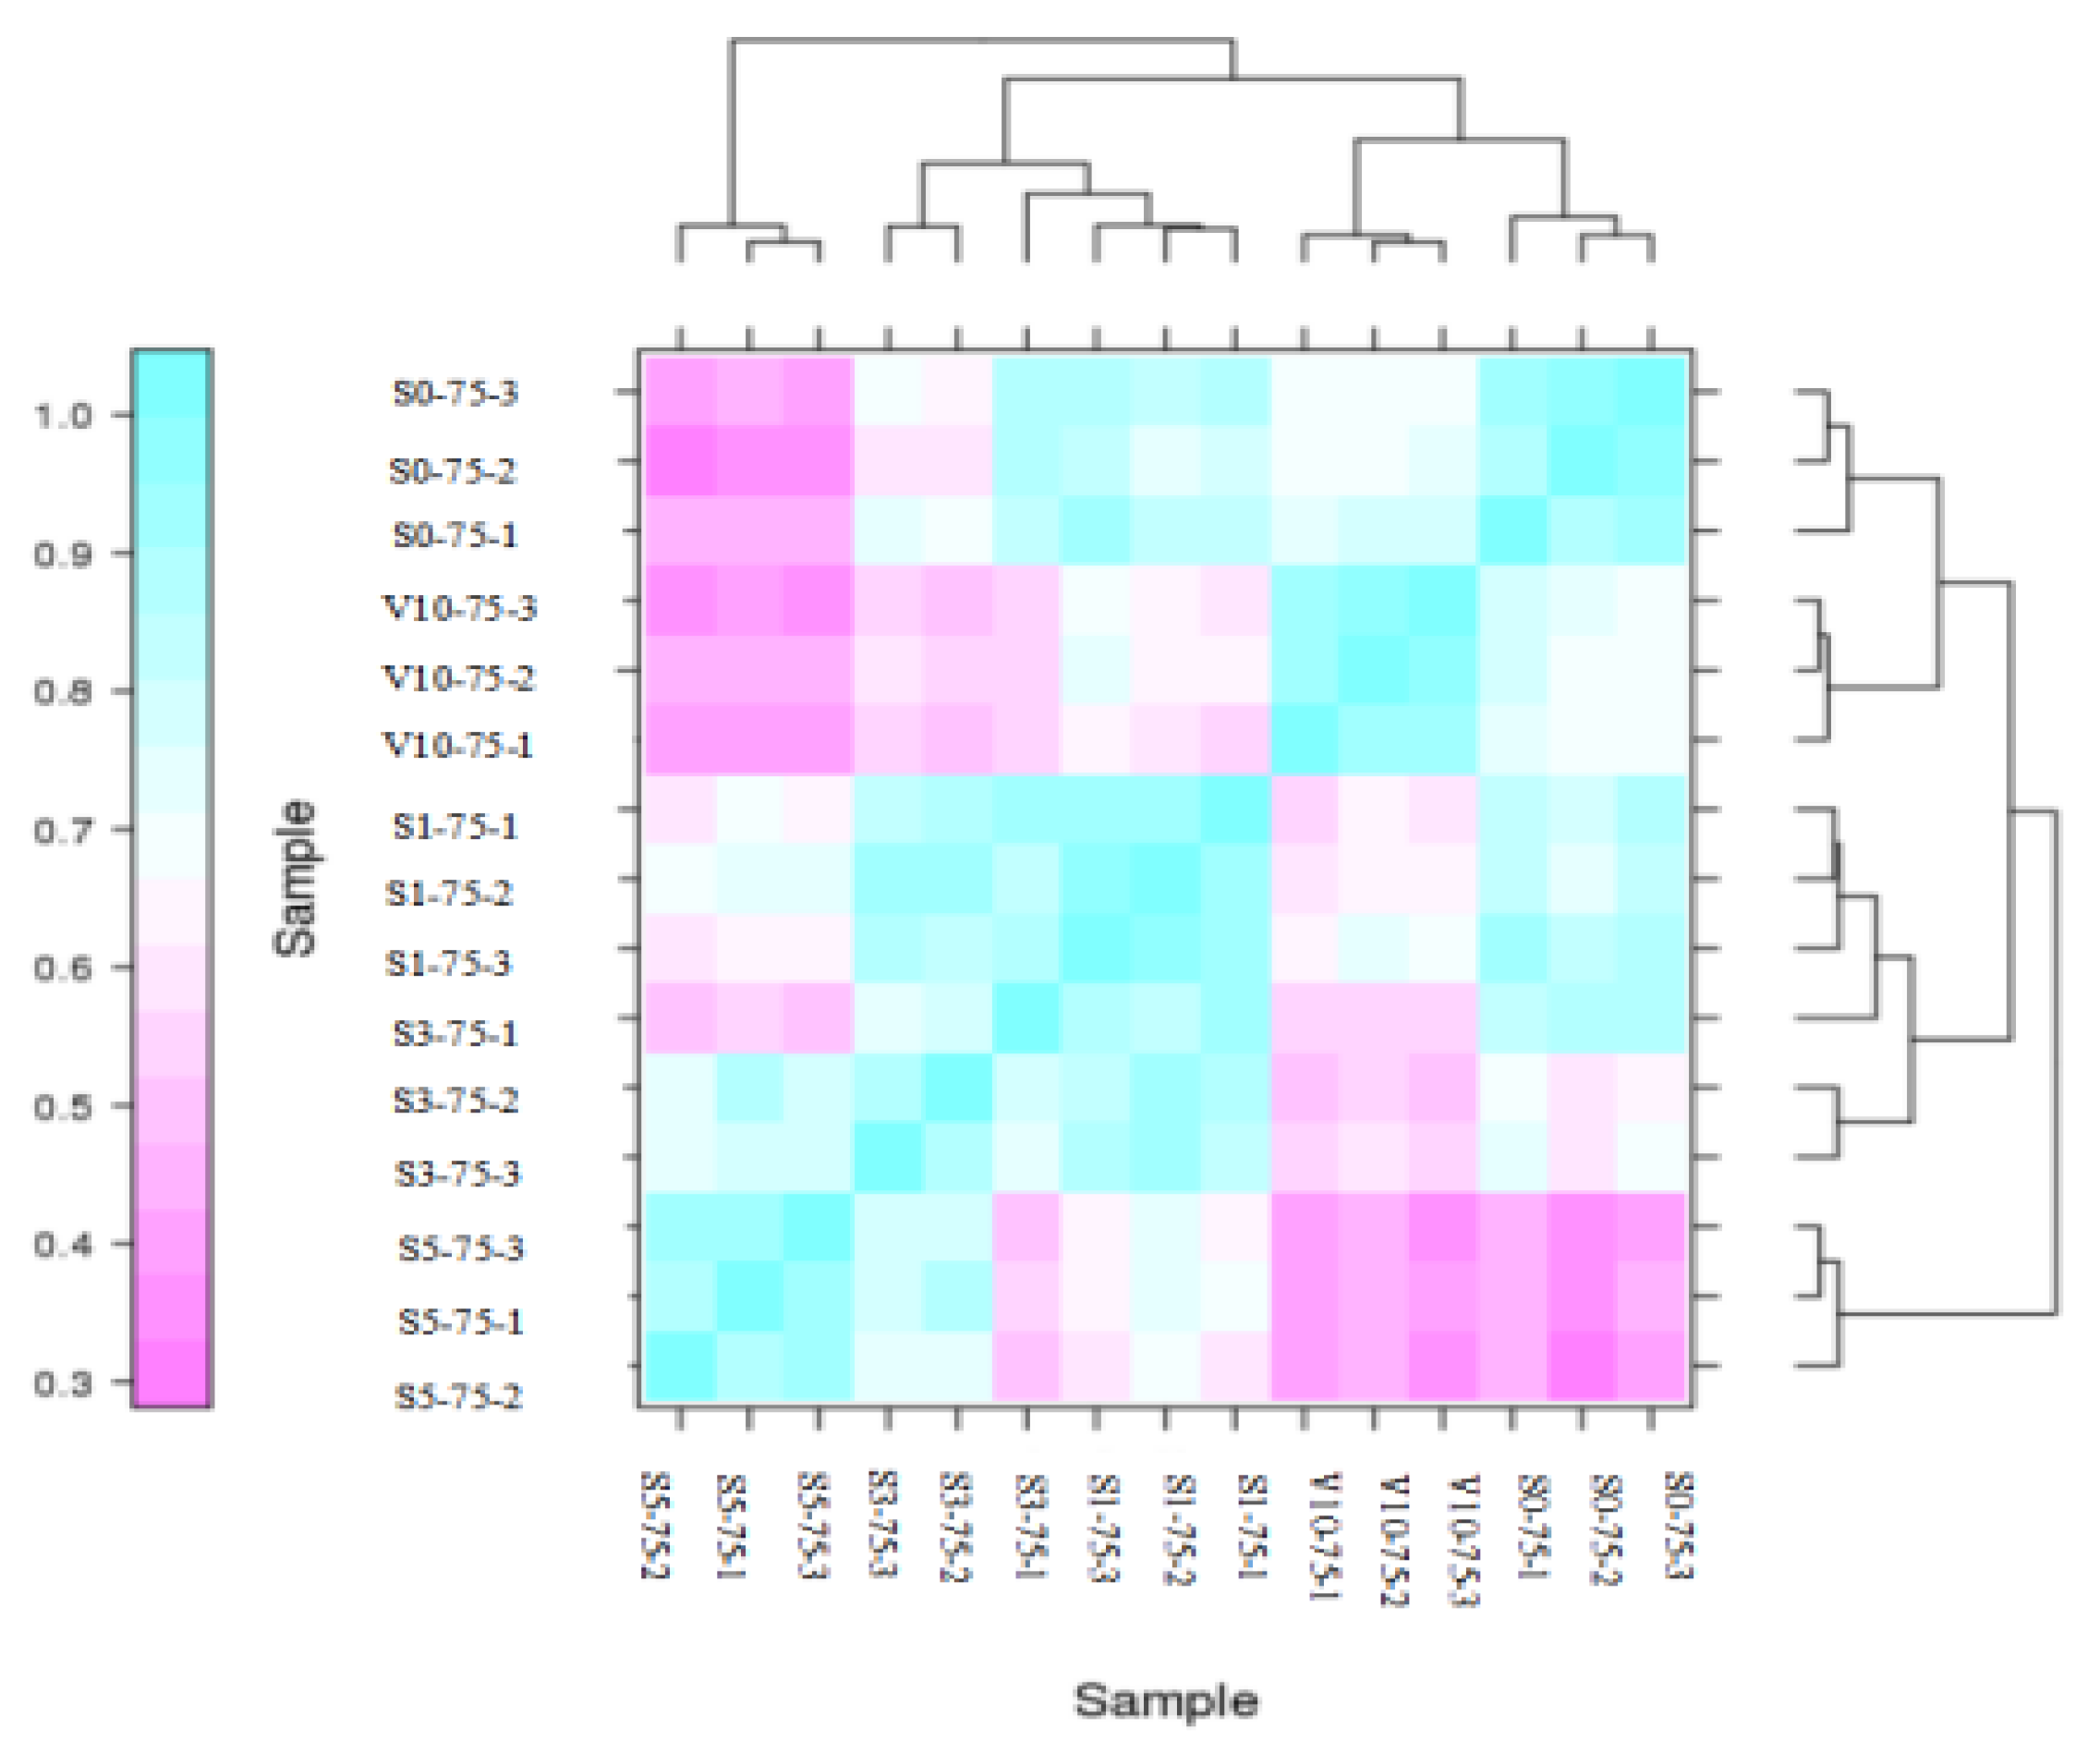
3.2.2. Sample Correlation Analysis

Pearson correlation coefficient R is an important index to evaluate biological repetition correlation. The closer r2 is to 1, the stronger the sample correlation is. The fifteen samples of pak choi shoot apices at different growth stages were analyzed, and the results are shown in Figure 2. The Pearson correlation coefficient between samples in the same biological repeat group was ≥0.8, and the three repeats were all clustered together, indicating that the samples had good repeatability, and the transcriptome data obtained were reliable.

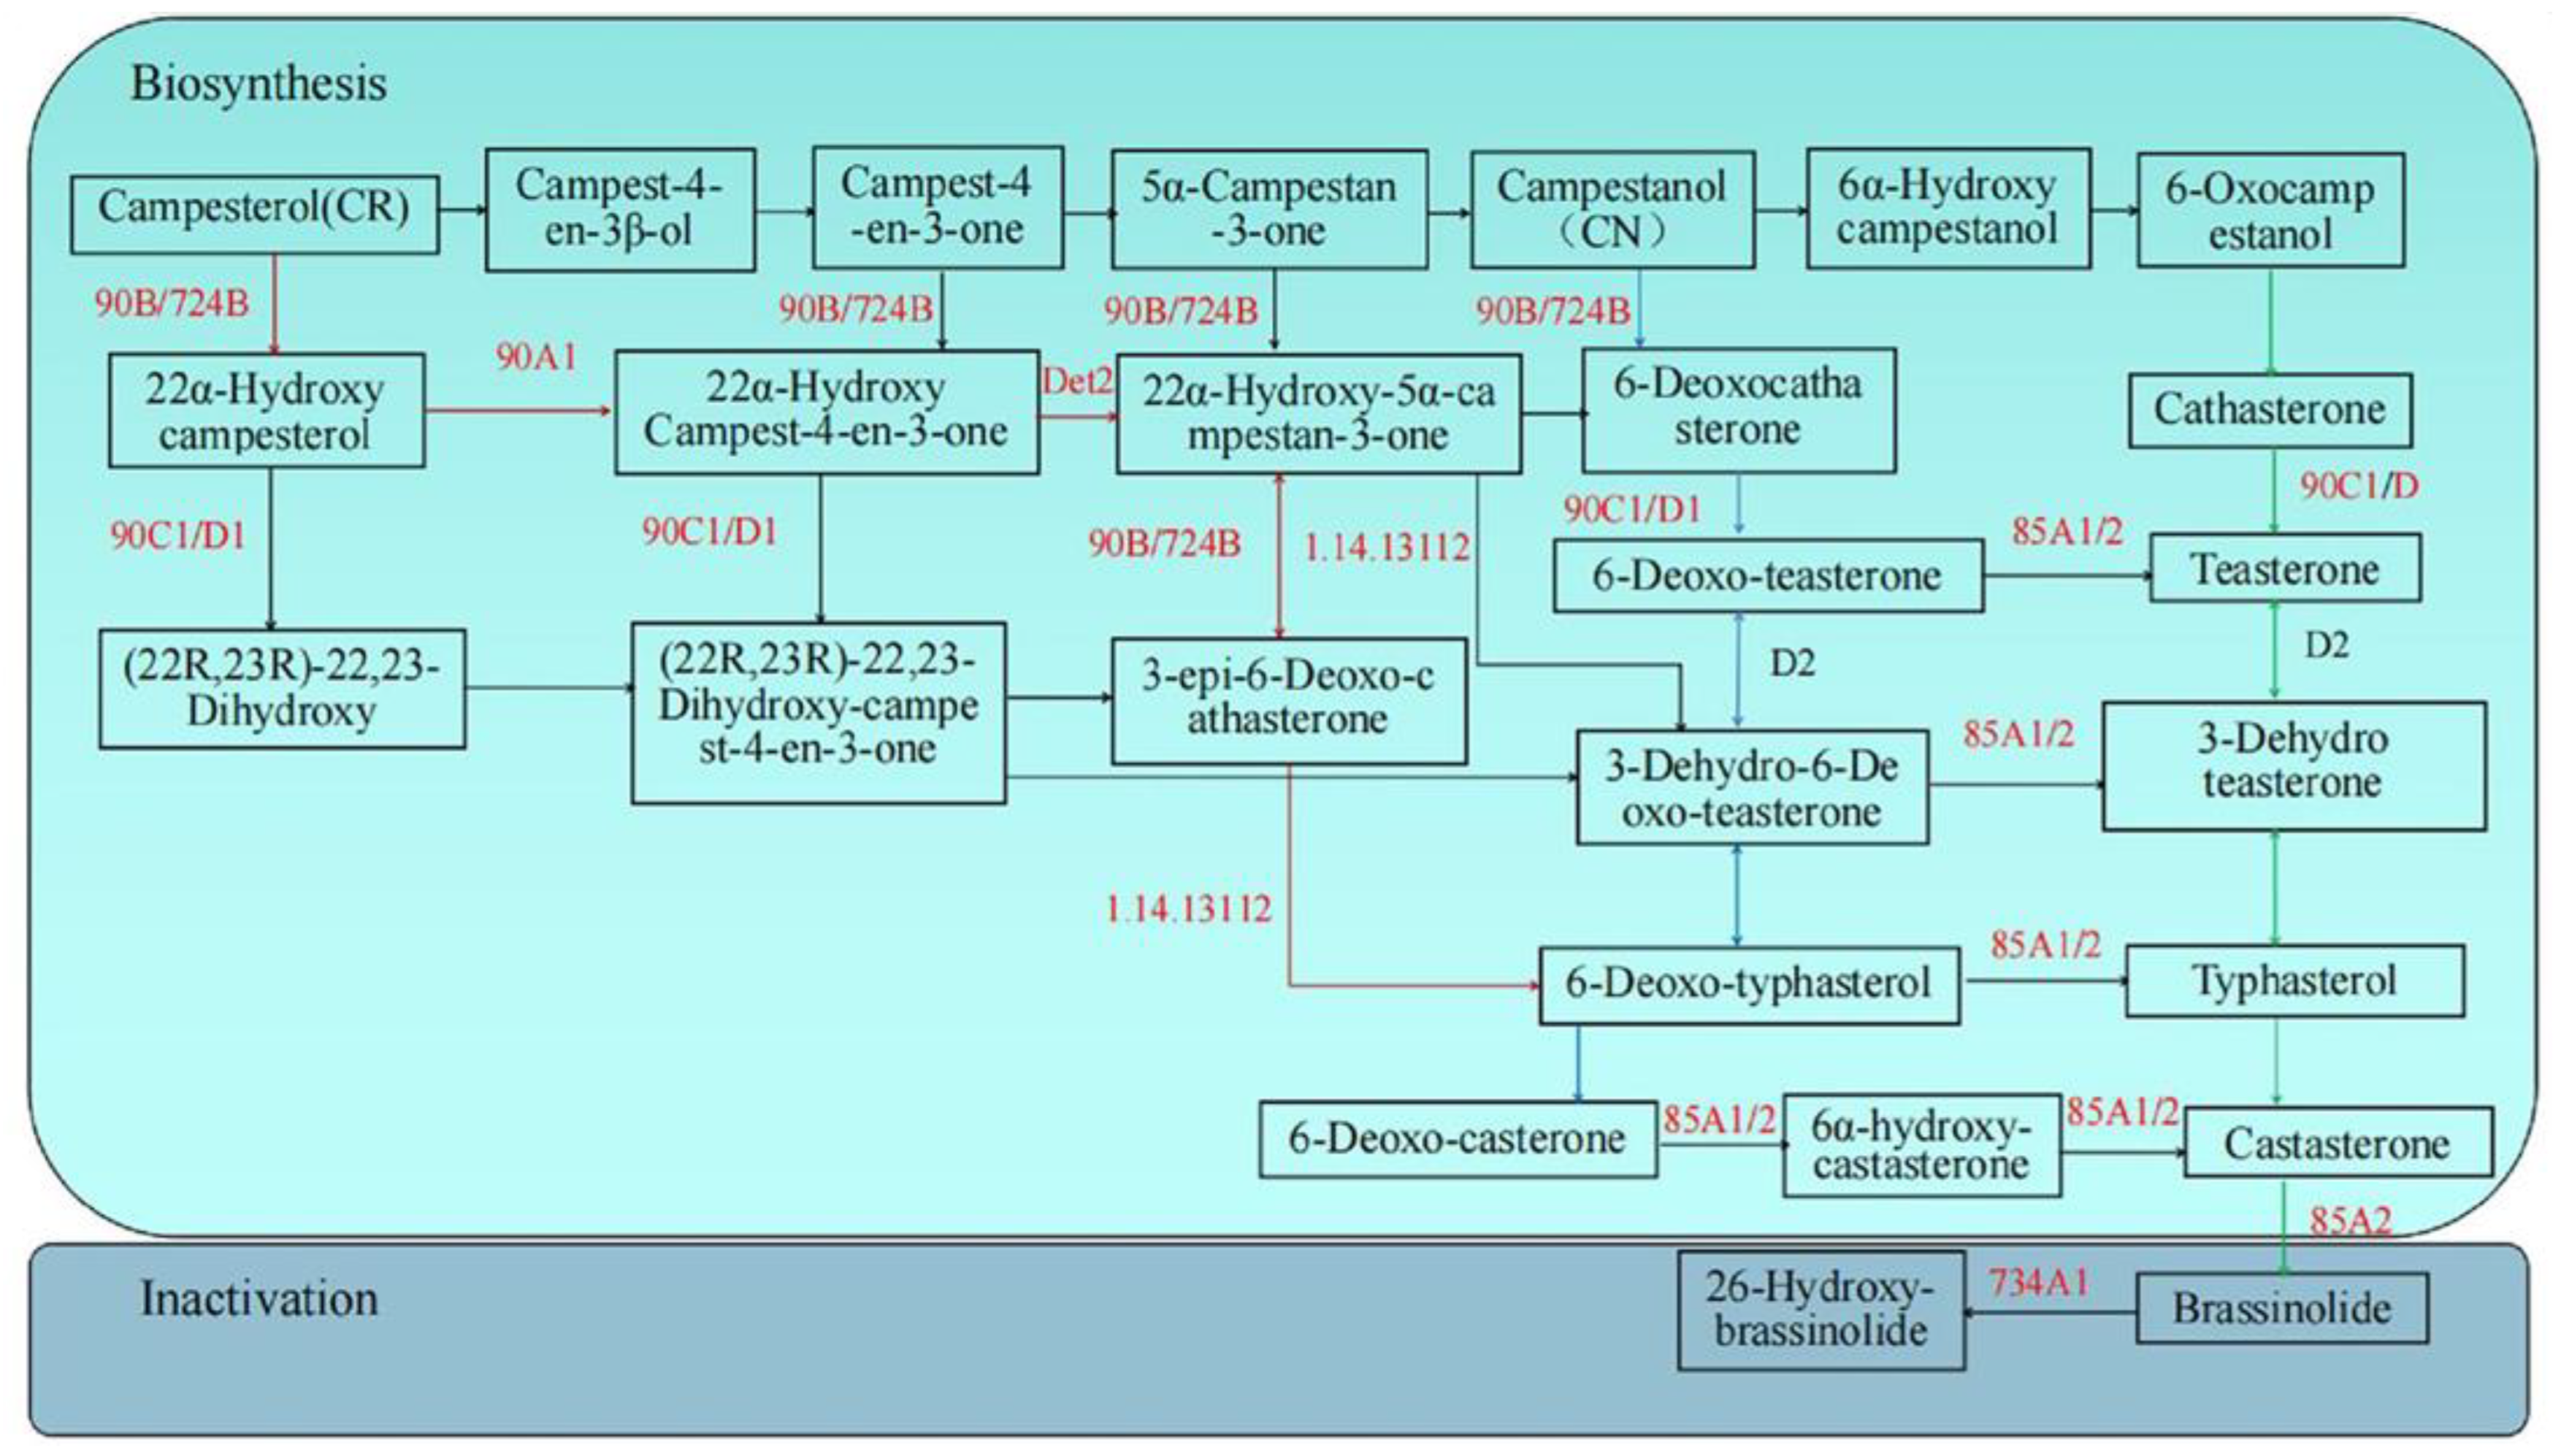
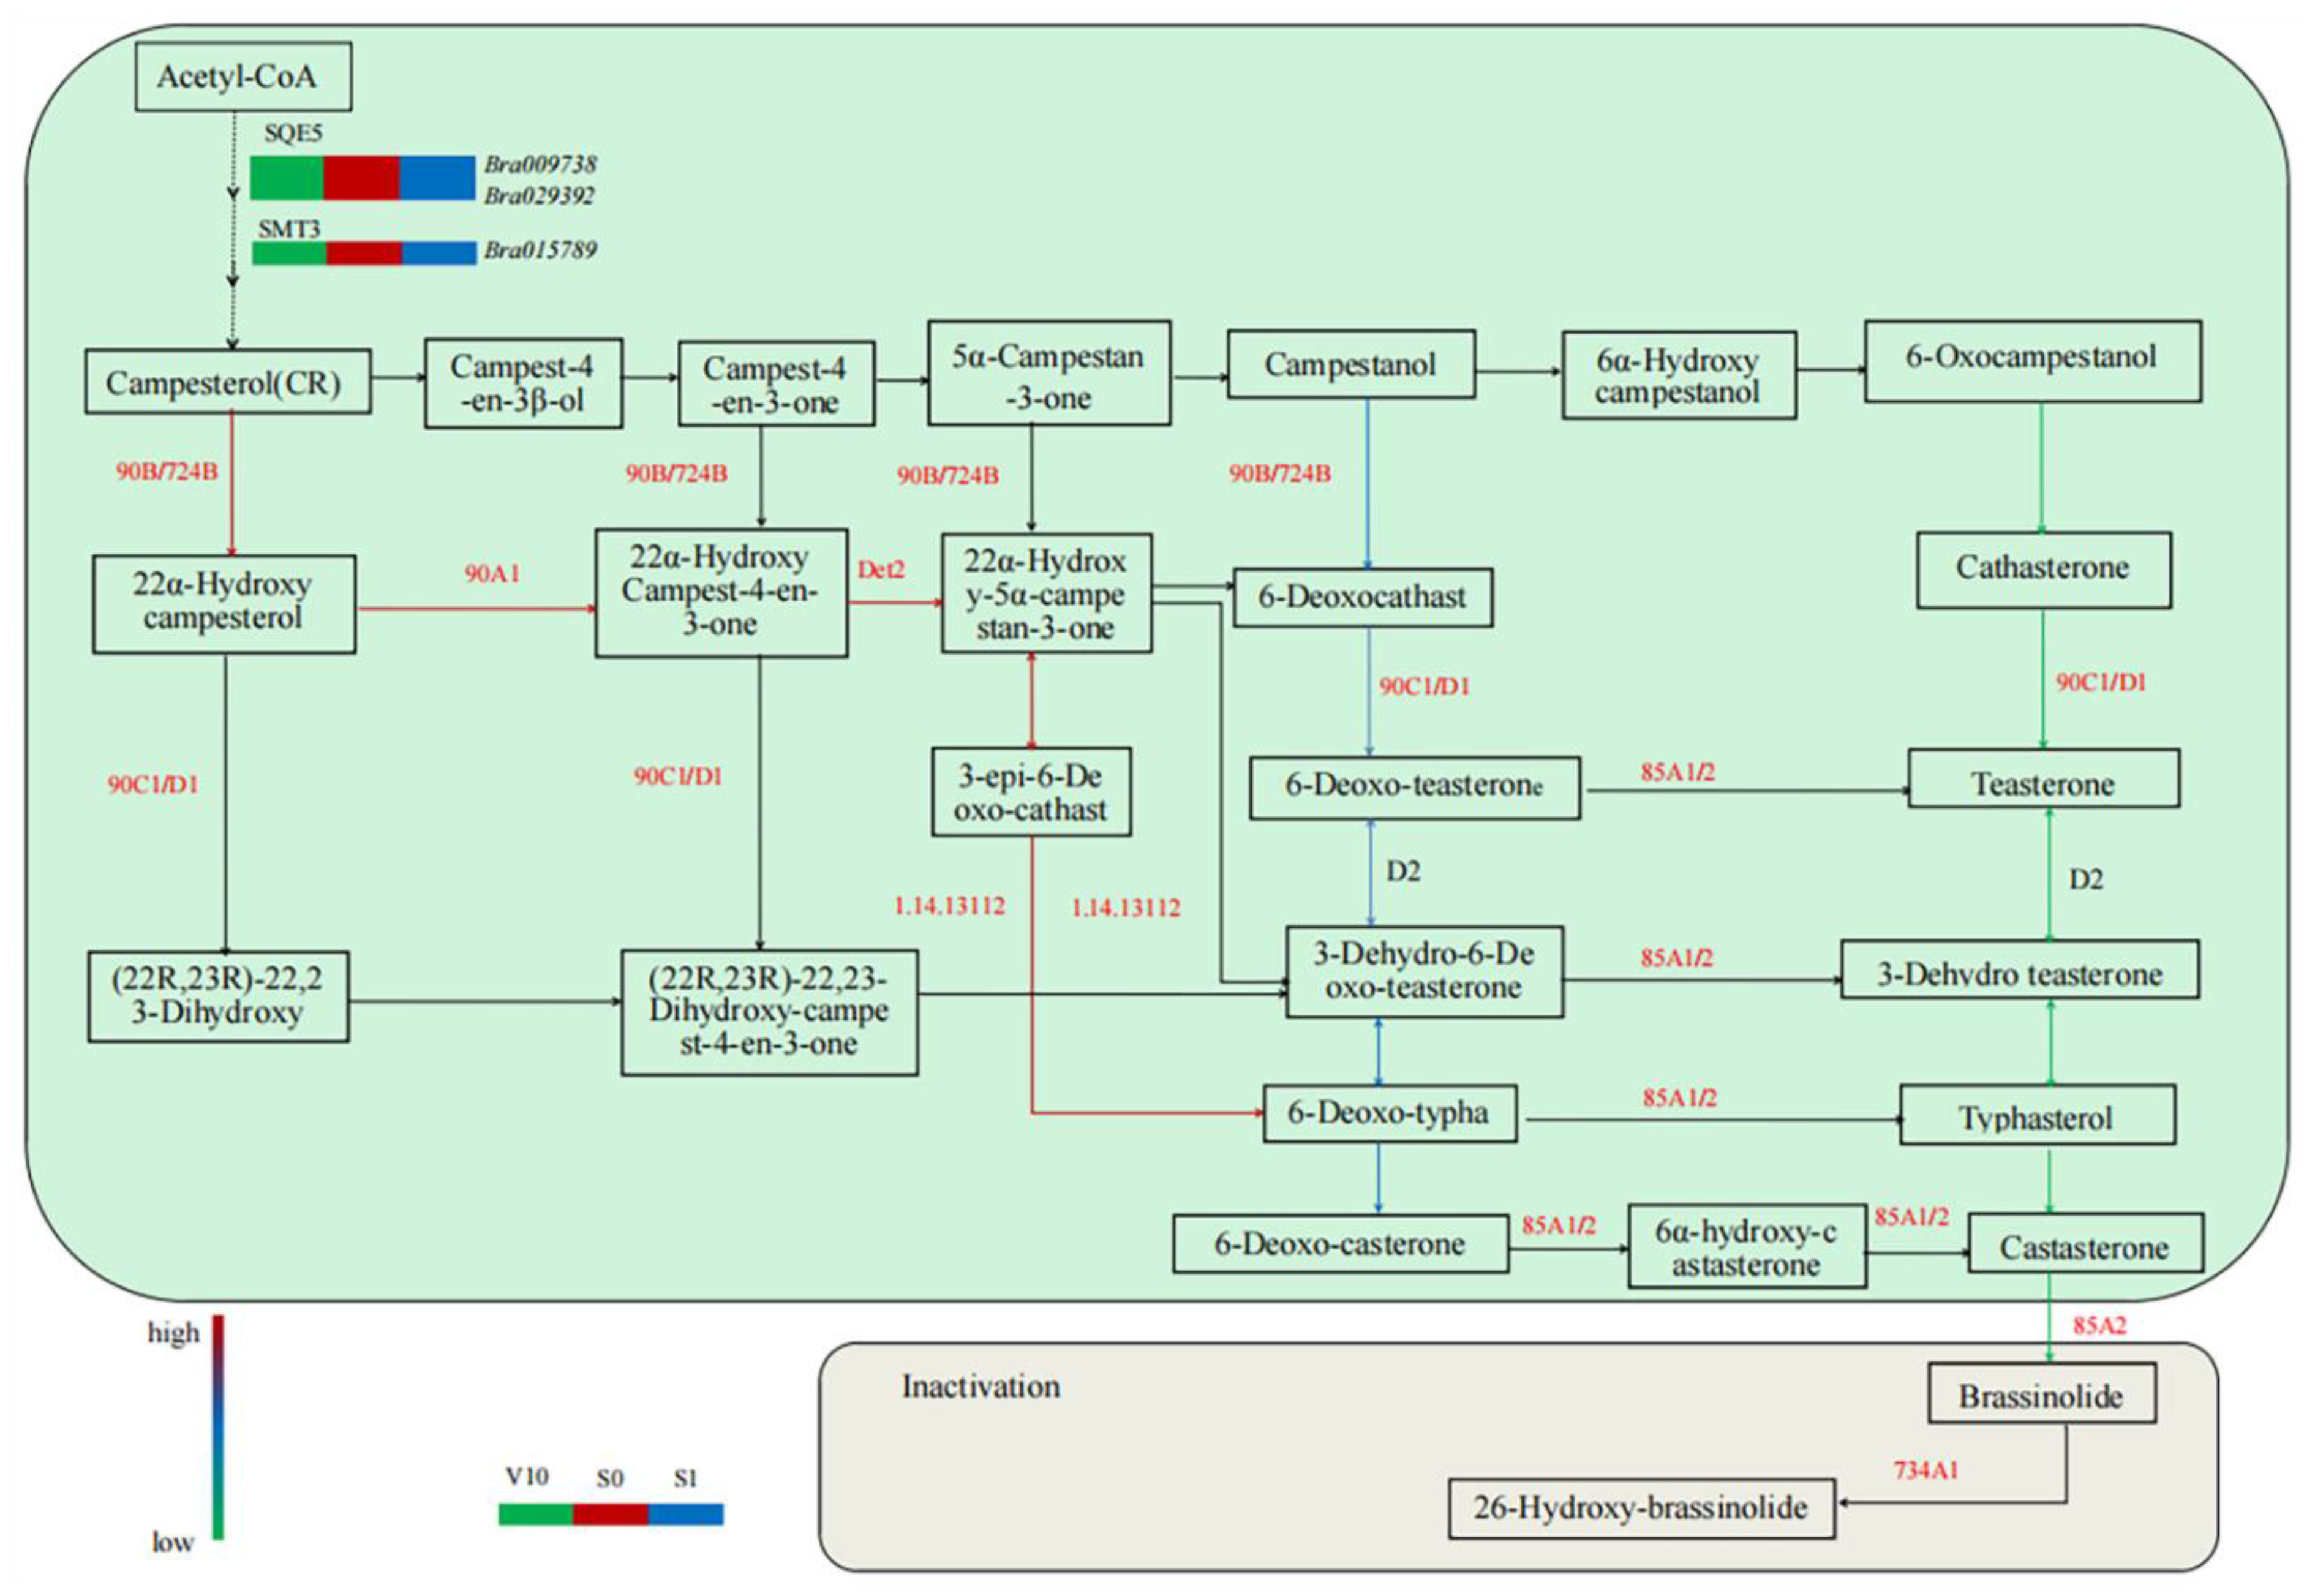
3.3. Expression Analysis of Genes Encoding Enzymes Related to BR Metabolism

During the synthesis of brassinolide, the precursor of BR is campesterol (CR), which is derived from mevalonic acid (MA). BR is synthesized by early and late C-22 oxidation pathways; early and late C-6 oxidation pathways; a synthetic shortcut between the early C-22 oxidation pathway and the late C-6 oxidation pathway. The KEGG pathway map of brassinosteroid biosynthesis (ko00905) from RNA sequencing is shown in Figure 3, including the synthesis pathway and inactivation pathway of brassinolide.
There are five enzymes that play key roles in the BR synthesis pathway, which are steroid 22 α-hydroxylase (90B/724B) [26,27], steroid 5 α-reductase (Det2) [28,29], C-3 oxidase (90A1) [30], C-23 hydroxylase (90C1/D1) [31], and C-6 oxidase (85A1/2) [32]. These key enzymes in the synthesis process not only participate in the reaction in one step, but also play a role in a variety of pathways. In pak choi, the inactivation of BR may mainly inactivate CS and BL through C-26 hydroxylation, in which cytochrome P450 monooxygenase (734A1) [33] is the key enzyme.
The expression of key genes involved in BR metabolism by RNA-seq is shown in Table 2. Five key enzymes involving 16 genes were found to participate in BR synthesis, and one key enzyme involving 1 gene was found to participate in BR inactivation.
Analysis of the expression changes of these genes revealed that Bra008760 encoding the steroid 22 α-hydroxylase was upregulated in both V10 vs. S0 and S1 vs. S3 samples, and downregulated in S0 vs. S1 samples during brassinolide synthesis. These results indicated that the expression of the gene was increased immediately at differentiation and floral bud differentiation stage 3, which may increase the rate of BR synthesis, leading to an increase in BR content during these stages, and the expression of the gene was decreased at floral bud differentiation stage 1, which may slow down the rate of BR synthesis, leading to a decrease in BR content during these stages. The results of hormone content determination showed that the BR content in S0 was higher than that in V10, and that in S3 was higher than that in S1. The change in gene expression was consistent with the change in BR content.
Bra030023 and Bra036097 encoding steroid 22 α-hydroxylase, Bra027405 and Bra011678 encoding C-23 hydroxylase, and Bra025409 encoding C-6 oxidase were all upregulated in V10 vs. S0 samples. These changes in gene expression were consistent with the measured changes in the BR content, suggesting that these genes may play a major role in the process from V10 to S0.
During BR synthesis, the expression of some genes altered irregularly. For example, Bra023464 encoding steroid 22 α-hydroxylase, Bra009126 and Bra028751 encoding C-3 oxidase, Bra021505 encoding C-23 hydroxylase, Bra017142 encoding steroid 5 α-reductase, Bra020747 and Bra025427 encoding C-6 oxidase and Bra017757 encoding C-23 hydroxylase were downregulated in V10 vs. S0 samples.
In the genes encoding BR inactivation, the gene expression changed irregularly. For example, Bra012046 encoding cytochrome P450 monooxygenases was upregulated in V10 vs. S0 and downregulated in S0 vs. S1, which was contrary to the determination results of hormone content. This may be because the higher BR content in plants during these stages activated the genes related to the BR signal transduction pathway, resulting in the negative feedback regulation of some BR synthesis and inactivation genes in plants.
In conclusion, the trends in genes expression of Bra008760, Bra030023, Bra036097, Bra027405, Bra011678, and Bra025409 involved in the synthesis of BR from V10 to S0 were consistent with the change trend in the BR content, and V10 to S0 were the key stages for the flowering of pak choi. Therefore, it was speculated that these five genes may be associated with the flowering of pak choi.

3.4. Identification of Differentially Expressed Genes Related to BR Metabolism
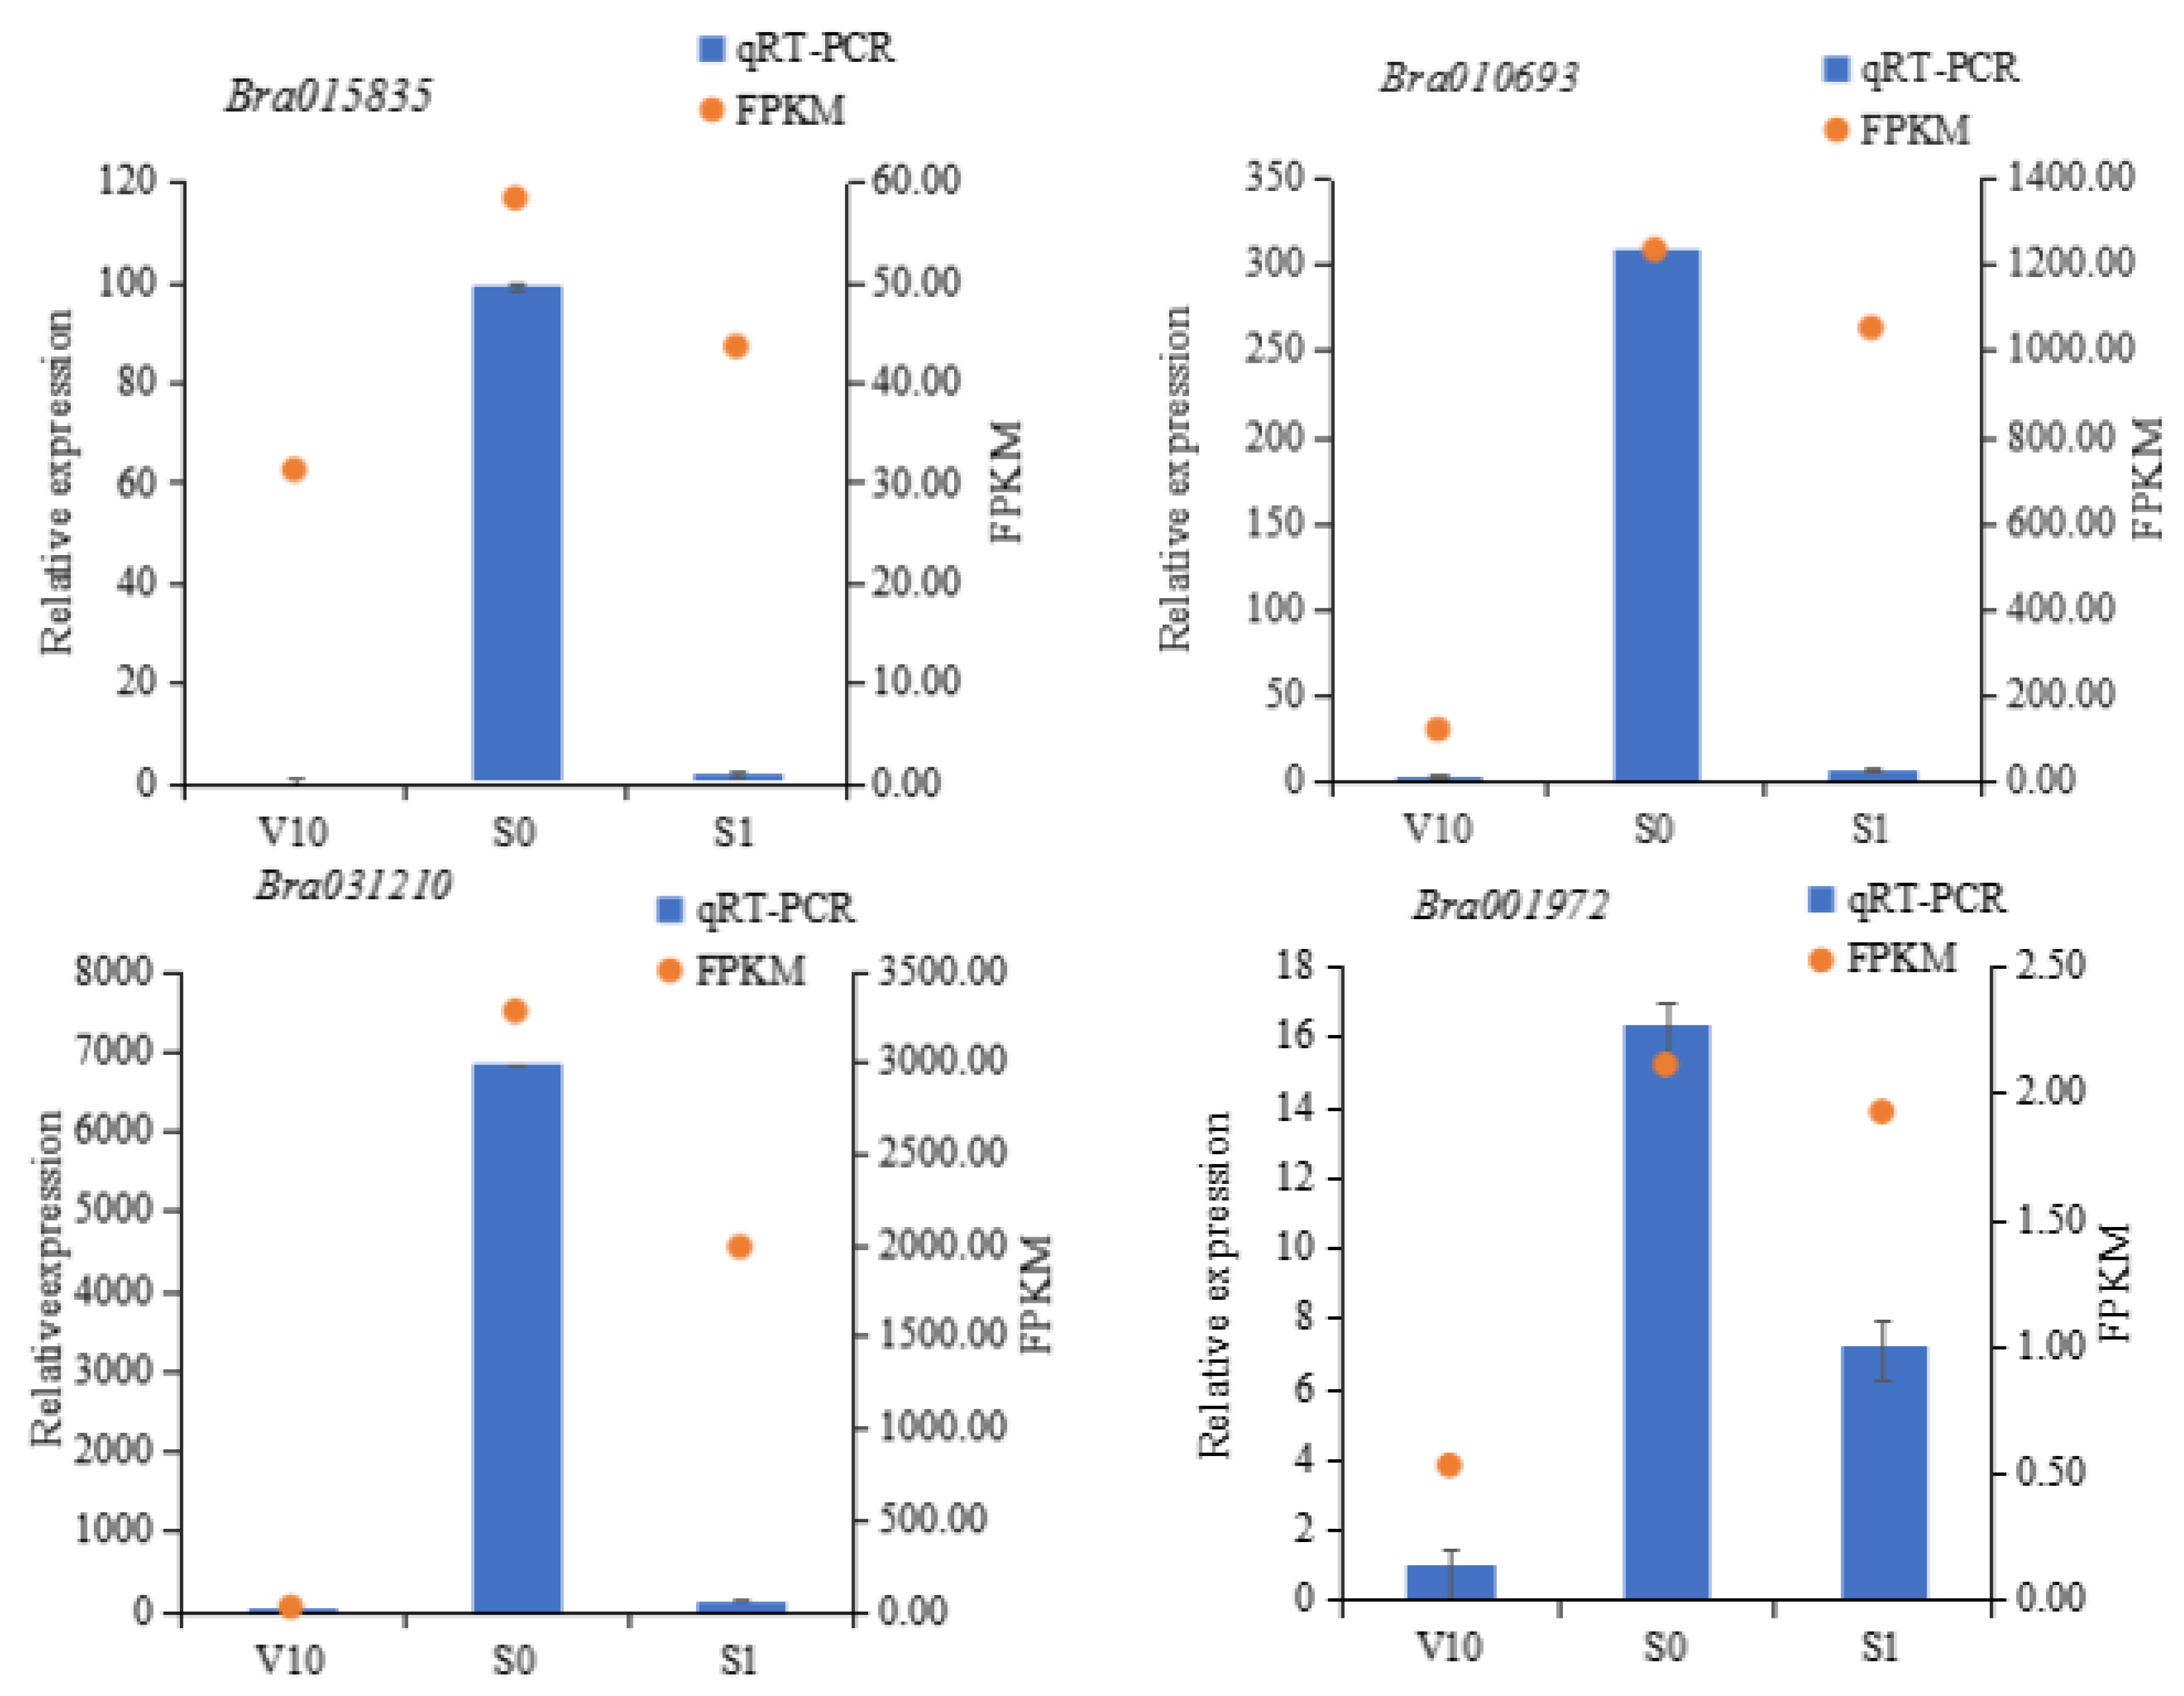
The expression profiles of V0 vs. S0, S0 vs. S1, and S1 vs. S3 were compared. According to false discovery rate (FDR) < 0.01 and fold change ≥ 2, differentially expressed genes (DEGs) were screened out. Through GO function annotation of the genes, DEGs that were consistent with the hormone content results were identified (Table 3). In V10 vs. S0 combination, there were 21 DEGs, of which 20 DEGs were involved in the brassinosteroid biosynthetic process (GO:0016132); one DEGs was involved in the brassinosteroid metabolic process (GO:0016131). There was only one DEG (Bra026365) in the S0 vs. S1 combination, which annotated the brassinosteroid biosynthetic process (GO:0016132). There were two DEGs (Bra004513 and Bra028711) in S1 vs. S3 combinations, one of which was linked to the brassinosteroid biosynthetic process (GO:0016132) and one that was involved in the brassinosteroid metabolic process (GO:0016131).
Bra009738 and Bra029392 encode squalene epoxidase (SQE5), and STEROL METHYLTRANSFERASE 3 (SMT3) encoded by Bra015789 is C-24 methyltransferase. These two enzymes are enzymes in the pathway of forming brassinolide synthesis precursors, and the expression of genes encoding these two enzymes was higher than that of V10 at the S0 stage, indicating that the accumulation of BR content may be beneficial to the initiation of floral bud differentiation (Figure 4).
DWARF IN LIGHT 1 (DFL1) encoded by Bra029023 has IAA amide synthase activity and Bra007824 encodes cyclopropyl sterol isomerase 1 (CPI1). Bra000469 encodes ATP-BINDING CASSETTE G31 (ABCG31), an ABC transporter, and Bra003687 encodes ACC oxidase 5 (ACO5). The enzymes encoded by these genes are related to plant hormones, and the expressions of genes encoding these enzymes in S0 were higher than that in V10, indicating that in the process of flower formation, not only a single plant hormone likely played a role, but multiple hormones were acting in coordination.
Bra010693 and Bra011869 encoding GLYCINE-RICH RNA-BINDING PROTEIN 8 (GRP8) and Bra030284 and Bra031210 encoding GLYCINE-RICH RNA-BINDING PROTEIN 7 (GRP7) are known splicing regulators. Bra007002 encodes a light capture protein (CP29). The Arabidopsis homolog of Bra005212 and Bra017201 is AT2G37220, which encodes a chloroplast RNA binding protein. ABA-REGULATED RNA-BINDING PROTEIN 1 (ARP1) encoded by Bra007096 encodes a putative RNA binding protein in Arabidopsis. Bra010542 encodes a Dirigent (DIR) protein (DIR6). Bra026228 coding WRKY DNA-BINDING PROTEIN 14 (WRKY14) belongs to the WRKY family and Bra010706 encodes a cysteine protease (RD19). Bra024901 encodes a putative acyltransferase (BAT1) and Bra020710 encodes acetyl coenzyme A thiolase (AACT2). The expressions of these genes were higher at the S0 stage than that at the V10 stage, and the BR content was higher at the S0 stage than that at the V10 stage, indicating that nucleic acid and protein are needed in plants to provide material accumulation for cell division and differentiation in the early stage of floral bud differentiation, and a higher BR content may promote the metabolism of nucleic acid and protein.
The Arabidopsis homologous gene of Bra027963 is AT2G03750, which is a superfamily protein containing p-loop nucleoside triphosphate hydrolase. This gene is noted in the inactivation process of brassinolide. During the transformation from V10 to S0, its gene expression was downregulated, which may lead to a decrease in the inactivation rate of BR and an increase in BR content. This may be one of the reasons why the BR content in plants at the S0 stage was higher than that at the V10 stage.
GRETCHEN HAGEN 3.5 (GH3.5) encoded by Bra026365 was a DEG in the combination of S0 vs. S1, which annotated the brassinosteroid biosynthetic process (GO:0016132), and the expression level of this gene was downregulated, which may lead to a decrease in the synthesis rate of BR, thus reducing the BR content. This may be one of the reasons why the BR content in plants at the S1 stage was lower than that at the S0 stage, but this gene was not a differentially expressed gene at the V10 vs. S0 stage, suggesting that this gene may not play a significant role in the early stage of floral bud differentiation.
β-KETOACYL-COA SYNTHASE 13 (KCS13) encoded by Bra004513 is a member of the 3-ketoyl coenzyme A synthetase family and SULFOTRANSFERASE 2A (ST2A) encoded by Bra028711 is sulfonyl transferase. These two genes were DEGs in the S1 vs. S3 combination. In the S1 vs. S3 combination, the expression of the BR synthesis gene was upregulated and the expression of the inactivation gene was downregulated, resulting in the increase in BR synthesis rate and the decrease in BR inactivation rate during the transition from S1 to S3, resulting in the increase in BR content in plants at this stage, which may explain why the BR content increased at this stage. However, these two genes did not belong to the DEGs at the V10 vs. S0 stage, indicating that these two genes likely did not play a significant role in the early stage of floral bud differentiation.
To sum up, we found that there were 24 DEGs in V10 vs. S0, S0 vs. S1, and S1 vs. S3 that were involved in the synthesis and inactivation process of BR and were consistent with the change in hormone content. Among them, 21 DEGs in V10 vs. S0 had the same trend of gene expression changes with BR content changes, and one gene in S0 vs. S1 had the same trend of gene expression changes with BR content changes. The expression changes of two genes in S1 vs. S3 were consistent with the trend of BR content. The flowering transformation of pak choi mainly focused on the transformation from the V10 stage to S0 stage. Therefore, it was speculated that the 21 DEGs whose expression changes were consistent with the change trend of BR content in V10 vs. S0 may be related to the flower-forming process of pak choi.

3.5. qRT-PCR

To verify the reliability of the RNA sequencing (RNA-Seq) results, Bra015835, Bra010693, Bra031210, and Bra001972 were selected for qRT-PCR verification in three samples (V10, S0, and S1). The total RNA from the three stages was extracted for qRT-PCR experiments, and the qRT-PCR results were compared with the transcriptome sequencing data. It was found that the FPKM values of all genes were consistent with the relative expression levels (Figure 5), indicating that the transcriptome sequencing results were reliable and could be used to assess the magnitude of gene expression changes.

4. Discussion

Floral bud differentiation is an important turning point in the transition from vegetative growth to reproductive growth of plants [34]. It is coordinated and controlled by a variety of hormones, among which BR plays an important role and is one of the irreplaceable hormones in plant growth and development. The results of this study showed that the BR content increased after low-temperature treatment. With the progress of vegetative growth, the BR content decreased and reached the lowest at 10 days after transplanting; then, the content increased and reached a small peak at the critical period of floral bud differentiation (Figure 1), the same as the previous results [15], so the trend of BR may be related to improved cold resistance, and the accumulation of BR could promote the flower bud differentiation of pak choi.
BR can promote the metabolism of nucleic acid and protein, so the BR content increased in the early stage of differentiation [35]. Our results showed that the higher concentration of BR content may promote the initiation of floral bud differentiation, and then continue to maintain its content to ensure that floral bud differentiation continued, which was consistent with the previous research results [16,17]. At the initial stage of floral bud differentiation, nucleic acids and proteins are needed to accumulate materials for cell division and differentiation in plants. In addition, studies had pointed out that almost all mutant plants insensitive to BR showed late flowering phenotypes [36], and this suggested that BR may have a promoting effect on the flowering transition, which may explain why the BR content measured in the later stage of flower bud differentiation had rebounded.
In order to further clarify the reasons for the changes in BR content in the shoot apices of pak choi at different growth stages, the genes related to the BR metabolic pathway were analyzed in detail. The expression changes of six key genes from V10 to S0 were consistent with the changes in BR content. Bra008760 encoding CYP724A1 is a steroid 22 α-hydroxylase, which belongs to the CYP724A subfamily. Ectopic overexpression of CYP724A1 in invalid dwf4 mutants functionally supplemented their BR defects and largely restored normal growth and development [37]. Bra030023 and Bra036097 encode DWF4, which play a role in multiple pathways during BR biosynthesis. Overexpression of DWF4 in plants can increase the content of active BR, Arabidopsis plants that overexpress the DWF4 gene had earlier flowering time, and the transgenic plants grew more vigorously [38,39,40,41].
Bra027405 encoding CYP90D1 and Bra011678 encoding ROT3 belong to the cytochrome P450 (CYP450) family gene, which together catalyze the hydroxylation step of C-23 in the BR synthesis pathway [42]. Studies had shown that ROT3 mutants exhibit dwarfism, hypocotyl shortening, cotyledon opening, late flowering, and decreased fertility [43], which was a typical phenotype of mutants with impaired BR biosynthesis. BR6ox2 encoded by Bra025409 is C-6 oxidase, which can catalyze the oxidation reaction of 6-deoxoCS to CS with BR6ox1, and BR6ox2 can catalyze the reaction of CS to BR. In Arabidopsis thaliana, br6ox1/2 mutants produced smaller leaves, shorter internodes, and thicker stems [44,45], and overexpression of BR6ox2 enhanced plant growth and development [46].
In the studies of BR-related mutants dwf4 [47], det2 [13], bri1 [48], and cpd [11], delayed flowering had been reported. The endogenous BR content in det2 mutant was very low, only 10% of that of the wild type [49]. dwf4 and cpd mutants are defective mutants of BR synthesis, and many precursors of BR synthesis have been accumulated internally [47,50]. bri1 mutants have also been reported to contain high levels of BR precursors [51]. Therefore, the variation in endogenous BR and its precursors in plants may affect the flowering time. In this experiment, the expression changes of these 6 BR-related genes were consistent with the changes in BR content, so it was speculated that they might have an effect on the flowering transformation of pak choi, which is consistent with previous studies [47].
By analyzing the DEGs in the vegetative growth stage and the critical stage of floral bud differentiation, it was found that the 21 DEGs related to the BR metabolism were consistent with the changes in BR content. GRP8 encoded by Bra010693 and Bra011869 and GRP7 encoded by Bra030284 and Bra031210 are known splicing regulators. Previous studies showed that FLC expression levels were elevated in both RNAi lines and atgrp7-1 mutants, and RNA interference-mediated reduction in the level of the paralogous AtGRP8 in atgrp7-1 further delayed the floral transition compared with atgrp7-1. All these indicated that AtGRP7 and AtGRP8 promoted floral transition [52,53]. In this study, the expression levels of these differentially expressed genes annotated to the BR synthesis pathway were upregulated during the flowering transition period, which accelerated the synthesis rate of BR and eventually led to the increase in BR content, which is consistent with the results of previous studies [52,53]. However, further studies are needed to understand how the above differential genes related to BR metabolism play a role in the flower bud differentiation of pak choi.

5. Conclusions

In this study, the BR content in the shoot apices of pak choi at different growth stages was measured. The results showed that low-temperature treatment could increase the BR content, and the content rose with floral bud differentiation of pak choi. To elucidate the molecular mechanism of changes in BR content, RNA-seq was used to analyze the expression of BR-metabolism-related enzyme genes. It was found that the expression of six genes (Bra008760, Bra030023, Bra036097, Bra027405, Bra011678, and Bra025409) encoding the three main synthase steroids 22 α-hydroxylase, C-3 oxidase, and C-6 oxidase were upregulated at the critical stage of floral bud differentiation, which was consistent with the change in BR content. In addition, the expressions of 21, 1, and 2 DEGs in V10 vs. S0, S0 vs. S1, and S1 vs. S3 were found to be consistent with the change trend of BR content. These results are helpful to understand the molecular mechanism of BR content change in pak choi at different growth stages.

Supplementary Materials

The following supporting information can be downloaded at: https://www.mdpi.com/article/10.3390/horticulturae8111093/s1, Table S1: primers.

Author Contributions

Conceptualization, G.M., L.H. and M.L.; methodology, G.M., X.L. and Y.W.; software, X.Q.; validation, X.Q., Y.B. and M.L.; formal analysis, G.M.; investigation, G.M. and X.L.; data curation, G.M.; writing—original draft preparation, G.M., L.H. and M.L.; writing—review and editing, G.M. and M.L.; supervision, M.L. All authors have read and agreed to the published version of the manuscript.

Funding

This research was funded by the Basic Research Plan Project of Shanxi Province (20210302123421; 20210302124244), Biological Breeding Engineering Project of Shanxi Agricultural University (YZGC121).

Institutional Review Board Statement

Not applicable.

Informed Consent Statement

Not applicable.

Data Availability Statement

The data presented in this study can be found in online repositories. The names of the repository/repositories and accession number(s) can be found below: https://www.ncbi.nlm.nih.gov/sra (accessed on 13 November 2022), PRJNA821155. The data used to support the findings of this study are available from the corresponding author upon request.

Conflicts of Interest

The authors declare no conflict of interest.

Abbreviations

BAS1PHYB ACTIVATION TAGGED SUPPRESSOR 1
BR6ox1BRASSINOSTEROID-6-OXIDASE 1
BR6ox2BRASSINOSTEROID-6-OXIDASE 2
CYP724A1CYTOCHROME P450, FAMILY 724, SUBFAMILY A, POLYPEPTIDE 1
CYP90D1CYTOCHROME P450, FAMILY 90, SUBFAMILY D, POLYPEPTIDE 1
DET2DEETIOLATED2
ROT3ROTUNDIFOLIA3

References

  1. Shang, M.; Wang, X.; Zhang, J.; Qi, X.; Ping, A.; Hou, L.; Xing, G.; Li, G.; Li, M. Genetic Regulation of GA Metabolism during Vernalization, Floral Bud Initiation and Development in Pak Choi (Brassica rapa ssp. chinensis Makino). Front. Plant Sci. 2017, 8, 1533. [Google Scholar] [CrossRef] [PubMed]
  2. Clouse, S.D. The molecular intersection of brassinosteroid-regulated growth and flowering in Arabidopsis. Proc. Natl. Acad. Sci. USA 2008, 105, 7345–7346. [Google Scholar] [CrossRef] [Green Version]
  3. Oh, M.H.; Honey, S.H.; Tax, F.E. The Control of Cell Expansion, Cell Division, and Vascular Development by Brassinosteroids: A Historical Perspective. Int. J. Mol. Sci. 2020, 21, 1743. [Google Scholar] [CrossRef] [PubMed] [Green Version]
  4. Müller, M.; Munné-Bosch, S. Hormonal impact on photosynthesis and photoprotection in plants. Plant Physiol. 2021, 185, 1500–1522. [Google Scholar] [CrossRef]
  5. Oh, E.; Zhu, J.Y.; Bai, M.Y.; Arenhart, R.A.; Sun, Y.; Wang, Z.Y. Cell elongation is regulated through a central circuit of interacting transcription factors in the Arabidopsis hypocotyl. eLife 2014, 3, e03031. [Google Scholar] [CrossRef]
  6. Yin, Y.; Wang, Z.Y.; Mora-Garcia, S.; Li, J.; Yoshida, S.; Asami, T.; Chory, J. BES1 accumulates in the nucleus in response to brassinosteroids to regulate gene expression and promote stem elongation. Cell 2002, 109, 181–191. [Google Scholar] [CrossRef] [Green Version]
  7. Müssig, C.; Shin, G.H.; Altmann, T. Brassinosteroids promote root growth in Arabidopsis. Plant Physiol. 2003, 133, 1261–1271. [Google Scholar] [CrossRef] [Green Version]
  8. González-García, M.P.; Vilarrasa-Blasi, J.; Zhiponova, M.; Divol, F.; Mora-García, S.; Russinova, E.; Caño-Delgado, A.I. Brassinosteroids control meristem size by promoting cell cycle progression in Arabidopsis roots. Development 2011, 138, 849–859. [Google Scholar] [CrossRef] [PubMed] [Green Version]
  9. Hacham, Y.; Holland, N.; Butterfield, C.; Ubeda-Tomas, S.; Bennett, M.J.; Chory, J.; Savaldi-Goldstein, S. Brassinosteroid perception in the epidermis controls root meristem size. Development 2011, 138, 839–848. [Google Scholar] [CrossRef] [PubMed] [Green Version]
  10. Planas-Riverola, A.; Gupta, A.; Betegón-Putze, I.; Bosch, N.; Ibañes, M.; Caño-Delgado, A.I. Brassinosteroid signaling in plant development and adaptation to stress. Development 2019, 146, dev151894. [Google Scholar] [CrossRef]
  11. Li, J.; Li, Y.; Chen, S.; An, L. Involvement of brassinosteroid signals in the floral-induction network of Arabidopsis. J. Exp. Bot. 2010, 61, 4221–4230. [Google Scholar] [CrossRef] [Green Version]
  12. Vogler, F.; Schmalzl, C.; Englhart, M.; Bircheneder, M.; Sprunck, S. Brassinosteroids promote Arabidopsis pollen germination and growth. Plant Reprod. 2014, 27, 153–167. [Google Scholar] [CrossRef] [PubMed]
  13. Chory, J.; Nagpal, P.; Peto, C.A. Phenotypic and Genetic Analysis of det2, a New Mutant That Affects Light-Regulated Seedling Development in Arabidopsis. Plant Cell 1991, 3, 445–459. [Google Scholar] [CrossRef]
  14. Grove, M.D.; Spencer, G.F.; Rohwedder, W.K.; Mandava, N.; Worley, J.F.; Warthen, J.D., Jr.; Steffens, G.L.; Flippen-Anderson, J.L.; Cook, J.C., Jr. Brassinolide, a plant growth-promoting steroid isolated from Brassica napus pollen. Nature 1979, 281, 216–217. [Google Scholar] [CrossRef]
  15. Zhu, J. Effects of Low-Temperature Induction at Seedling Stage on Brassinolide Content and Receptor Gene Expression in Tobacco Shoot Tip; Southwest University: Chongqing, China, 2016; Available online: https://kns.cnki.net/KCMS/detail/detail.aspx?dbname=CMFD201701&filename=1016767428.nh (accessed on 13 November 2022).
  16. Wang, N. Expression Analysis of BR Signaling Pathway and Flowering Related Genes in Tobacco During Floral Bud Differentiation in Response to Low-Temperature at Seedling Stage; Southwest University: Chongqing, China, 2019; Available online: https://kns.cnki.net/KCMS/detail/detail.aspx?dbname=CMFD202001&filename=1019914013.nh (accessed on 13 November 2022).
  17. Xiao, L.Z. Effects of Low Temperature at Seedling Stage on Key Genes Expression and Development Process of BR Signaling Pathway in Tobacco; Southwest University: Chongqing, China, 2016; Available online: https://kns.cnki.net/KCMS/detail/detail.aspx?dbname=CMFD201701&filename=1016767452.nh (accessed on 13 November 2022).
  18. Singh, A.; Breja, P.; Khurana, J.P.; Khurana, P. Wheat Brassinosteroid-Insensitive1 (TaBRI1) Interacts with Members of TaSERK Gene Family and Cause Early Flowering and Seed Yield Enhancement in Arabidopsis. PLoS ONE 2016, 11, e0153273. [Google Scholar] [CrossRef] [Green Version]
  19. Wang, M.; Xu, X.; Zhang, X.; Sun, S.; Wu, C.; Hou, W.; Wang, Q.; Han, T. Functional analysis of GmCPDs and investigation of their roles in flowering. PLoS ONE 2015, 10, e0118476. [Google Scholar] [CrossRef] [PubMed]
  20. Sui, P.; Shi, J.; Gao, X.; Shen, W.H.; Dong, A. H3K36 methylation is involved in promoting rice flowering. Mol. Plant 2013, 6, 975–977. [Google Scholar] [CrossRef] [PubMed] [Green Version]
  21. Lan, C.Y.; Song, H.Y. Effects of overexpression of DWF4 gene on the growth and development of Brassica juncea. J. Southwest Univ. 2021, 43, 26–37. [Google Scholar]
  22. Deng, A.; Tan, W.; He, S.; Liu, W.; Nan, T.; Li, Z.; Wang, B.; Li, Q.X. Monoclonal antibody-based enzyme linked immunosorbent assay for the analysis of jasmonates in plants. J. Integr. Plant Biol. 2008, 50, 1046–1052. [Google Scholar] [CrossRef]
  23. Sun, M.; Qi, X.; Hou, L.; Xu, X.; Zhu, Z.; Li, M. Gene Expression Analysis of Pak Choi in Response to Vernalization. PLoS ONE 2015, 10, e0141446. [Google Scholar] [CrossRef]
  24. Trapnell, C.; Pachter, L.; Salzberg, S.L. TopHat: Discovering splice junctions with RNA-Seq. Bioinformatics 2009, 25, 1105–1111. [Google Scholar] [CrossRef] [PubMed]
  25. Livak, K.J.; Schmittgen, T.D. Analysis of relative gene expression data using real-time quantitative PCR and the 2(-Delta Delta C(T)) Method. Methods 2001, 25, 402–408. [Google Scholar] [CrossRef] [PubMed]
  26. Fujiyama, K.; Hino, T.; Kanadani, M.; Watanabe, B.; Jae Lee, H.; Mizutani, M.; Nagano, S. Structural insights into a key step of brassinosteroid biosynthesis and its inhibition. Nat. Plants 2019, 5, 589–594. [Google Scholar] [CrossRef] [PubMed]
  27. Choe, S.; Dilkes, B.P.; Fujioka, S.; Takatsuto, S.; Sakurai, A.; Feldmann, K.A. The DWF4 gene of Arabidopsis encodes a cytochrome P450 that mediates multiple 22 alpha-hydroxylation steps in brassinosteroid biosynthesis. Plant Cell 1998, 10, 231–243. [Google Scholar] [CrossRef] [Green Version]
  28. Xu, W.; Zheng, B.; Bai, Q.; Wu, L.; Liu, Y.; Wu, G. Functional study of the brassinosteroid biosynthetic genes from Selagnella moellendorfii in Arabidopsis. PLoS ONE 2019, 14, e0220038. [Google Scholar] [CrossRef] [Green Version]
  29. Noguchi, T.; Fujioka, S.; Takatsuto, S.; Sakurai, A.; Yoshida, S.; Li, J.; Chory, J. Arabidopsis det2 is defective in the conversion of (24R)-24-methylcholest-4-En-3-one to (24R)-24-methyl-5alpha-cholestan-3-one in brassinosteroid biosynthesis. Plant Physiol. 1999, 120, 833–840. [Google Scholar] [CrossRef] [Green Version]
  30. Ohnishi, T.; Godza, B.; Watanabe, B.; Fujioka, S.; Hategan, L.; Ide, K.; Shibata, K.; Yokota, T.; Szekeres, M.; Mizutani, M. CYP90A1/CPD, a brassinosteroid biosynthetic cytochrome P450 of Arabidopsis, catalyzes C-3 oxidation. J. Biol. Chem. 2012, 287, 31551–31560. [Google Scholar] [CrossRef] [Green Version]
  31. Polko, J.K.; Pierik, R.; van Zanten, M.; Tarkowská, D.; Strnad, M.; Voesenek, L.A.; Peeters, A.J. Ethylene promotes hyponastic growth through interaction with ROTUNDIFOLIA3/CYP90C1 in Arabidopsis. J. Exp. Bot. 2013, 64, 613–624. [Google Scholar] [CrossRef] [PubMed]
  32. Bishop, G.J.; Nomura, T.; Yokota, T.; Harrison, K.; Noguchi, T.; Fujioka, S.; Takatsuto, S.; Jones, J.D.; Kamiya, Y. The tomato DWARF enzyme catalyses C-6 oxidation in brassinosteroid biosynthesis. Proc. Natl. Acad. Sci. USA 1999, 96, 1761–1766. [Google Scholar] [CrossRef] [Green Version]
  33. Peng, H.; Neff, M.M. CIRCADIAN CLOCK ASSOCIATED 1 and ATAF2 differentially suppress cytochrome P450-mediated brassinosteroid inactivation. J. Exp. Bot. 2020, 71, 970–985. [Google Scholar] [CrossRef] [PubMed]
  34. Fan, L.; Chen, M.; Dong, B.; Wang, N.; Yu, Q.; Wang, X.; Xuan, L.; Wang, Y.; Zhang, S.; Shen, Y. Transcriptomic Analysis of Flower Bud Differentiation in Magnolia sinostellata. Genes 2018, 9, 212. [Google Scholar] [CrossRef] [PubMed]
  35. Wu, D.R.; Zhao, Y.J. Effects of Epibrassinolide on nucleic acid metabolism in Mung bean. Plant Physiol. J. 1993, 19, 49–52. [Google Scholar]
  36. Domagalska, M.A.; Schomburg, F.M.; Amasino, R.M.; Vierstra, R.D.; Nagy, F.; Davis, S.J. Attenuation of brassinosteroid signaling enhances FLC expression and delays flowering. Development 2007, 134, 2841–2850. [Google Scholar] [CrossRef] [PubMed] [Green Version]
  37. Zhang, R.; Xia, X.; Lindsey, K.; da Rocha, P.S. Functional complementation of dwf4 mutants of Arabidopsis by overexpression of CYP724A1. J. Plant Physiol. 2012, 169, 421–428. [Google Scholar] [CrossRef] [PubMed]
  38. Shimada, Y.; Goda, H.; Nakamura, A.; Takatsuto, S.; Fujioka, S.; Yoshida, S. Organ-specific expression of brassinosteroid-biosynthetic genes and distribution of endogenous brassinosteroids in Arabidopsis. Plant Physiol. 2003, 131, 287–297. [Google Scholar] [CrossRef] [Green Version]
  39. Choe, S.; Fujioka, S.; Noguchi, T.; Takatsuto, S.; Yoshida, S.; Feldmann, K.A. Overexpression of DWARF4 in the brassinosteroid biosynthetic pathway results in increased vegetative growth and seed yield in Arabidopsis. Plant J. 2001, 26, 573–582. [Google Scholar] [CrossRef]
  40. Nomura, T.; Sato, T.; Bishop, G.J.; Kamiya, Y.; Takatsuto, S.; Yokota, T. Accumulation of 6-deoxocathasterone and 6-deoxocastasterone in Arabidopsis, pea and tomato is suggestive of common rate-limiting steps in brassinosteroid biosynthesis. Phytochemistry 2001, 57, 171–178. [Google Scholar] [CrossRef]
  41. Liu, T.; Zhang, J.; Wang, M.; Wang, Z.; Li, G.; Qu, L.; Wang, G. Expression and functional analysis of ZmDWF4, an ortholog of Arabidopsis DWF4 from maize (Zea mays L.). Plant Cell Rep. 2007, 26, 2091–2099. [Google Scholar] [CrossRef]
  42. Ohnishi, T.; Szatmari, A.M.; Watanabe, B.; Fujita, S.; Bancos, S.; Koncz, C.; Lafos, M.; Shibata, K.; Yokota, T.; Sakata, K.; et al. C-23 hydroxylation by Arabidopsis CYP90C1 and CYP90D1 reveals a novel shortcut in brassinosteroid biosynthesis. Plant Cell 2006, 18, 3275–3288. [Google Scholar] [CrossRef] [Green Version]
  43. Zheng, L.W. Study on the Regulation Function of Brassinosteroids on the Growth and Development of Apple Saplings; Northwest University of Agriculture and Forestry Science and Technology: Shanxi, China, 2020; Available online: https://kns.cnki.net/KCMS/detail/detail.aspx?dbname=CDFDLAST2021&filename=1020646554.nh (accessed on 13 November 2022).
  44. Müssig, C.; Lisso, J.; Coll-Garcia, D.; Altmann, T. Molecular analysis of brassinosteroid action. Plant Biol. 2006, 8, 291–296. [Google Scholar] [CrossRef]
  45. Schumacher, K.; Chory, J. Brassinosteroid signal transduction: Still casting the actors. Curr. Opin. Plant Biol. 2000, 3, 79–84. [Google Scholar] [CrossRef]
  46. Kim, T.W.; Hwang, J.Y.; Kim, Y.S.; Joo, S.H.; Chang, S.C.; Lee, J.S.; Takatsuto, S.; Kim, S.K. Arabidopsis CYP85A2, a cytochrome P450, mediates the Baeyer-Villiger oxidation of castasterone to brassinolide in brassinosteroid biosynthesis. Plant Cell 2005, 17, 2397–2412. [Google Scholar] [CrossRef]
  47. Azpiroz, R.; Wu, Y.; LoCascio, J.C.; Feldmann, K.A. An Arabidopsis brassinosteroid-dependent mutant is blocked in cell elongation. Plant Cell 1998, 10, 219–230. [Google Scholar] [CrossRef]
  48. Li, J.; Chory, J. A putative leucine-rich repeat receptor kinase involved in brassinosteroid signal transduction. Cell 1997, 90, 929–938. [Google Scholar] [CrossRef] [Green Version]
  49. Fujioka, S.; Li, J.; Choi, Y.H.; Seto, H.; Takatsuto, S.; Noguchi, T.; Watanabe, T.; Kuriyama, H.; Yokota, T.; Chory, J.; et al. The Arabidopsis deetiolated2 mutant is blocked early in brassinosteroid biosynthesis. Plant Cell Online 1997, 9, 1951–1962. [Google Scholar]
  50. Szekeres, M.; Németh, K.; Koncz-Kálmán, Z.; Mathur, J.; Kauschmann, A.; Altmann, T.; Rédei, G.P.; Nagy, F.; Schell, J.; Koncz, C. Brassinosteroids rescue the deficiency of CYP90, a cytochrome P450, controlling cell elongation and de-etiolation in Arabidopsis. Cell 1996, 85, 171–182. [Google Scholar] [CrossRef] [Green Version]
  51. Noguchi, T.; Fujioka, S.; Choe, S.; Takatsuto, S.; Yoshida, S.; Yuan, H.; Feldmann, K.A.; Tax, F.E. Brassinosteroid-insensitive dwarf mutants of Arabidopsis accumulate brassinosteroids. Plant Physiol. 1999, 121, 743–752. [Google Scholar] [CrossRef] [PubMed] [Green Version]
  52. Streitner, C.; Danisman, S.; Wehrle, F.; Schöning, J.C.; Alfano, J.R.; Staiger, D. The small glycine-rich RNA binding protein AtGRP7 promotes floral transition in Arabidopsis thaliana. Plant J. 2008, 56, 239–250. [Google Scholar] [CrossRef] [PubMed]
  53. Steffen, A.; Elgner, M.; Staiger, D. Regulation of Flowering Time by the RNA-Binding Proteins AtGRP7 and AtGRP8. Plant Cell Physiol. 2019, 60, 2040–2050. [Google Scholar] [CrossRef]
Figure 1. BR content in low-temperature treatment and control at different growth stages.
Horticulturae 08 01093 g001
Figure 2. Sample correlation analysis.
Horticulturae 08 01093 g002
Figure 3. Brassinosteroid metabolic pathway. Note: The red letter is the key enzyme, the green arrow is the early C-6 oxidation pathway, the blue arrow is the late C-6 oxidation pathway, and the red arrow is the early C-22 oxidation pathway.
Horticulturae 08 01093 g003
Figure 4. Analysis of differentially expressed genes related to BR metabolism in the pak choi shoot apices at different growth stages. V10, 10 days after transplanting; S0, 15 days after transplanting; S1, 16 days after transplanting. Green, blue, and red indicate gene expression from low to high.
Horticulturae 08 01093 g004
Figure 5. Comparison of quantitative reverse transcription PCR results with gene expression levels determined by RNA sequencing. FPKM, fragments per kilobase of transcript per million mapped reads.
Horticulturae 08 01093 g005
Table 1. Evaluation statistics of sequencing data from samples.
Sample NameTotal ReadsGC
Content
% ≥ Q30Mapped ReadsUniq Mapped ReadsMultiple Mapped Reads
V10-75-153,756,30047.9594.7846,796,446
(87.05%)
45,673,996
(84.96%)
1,122,450
(2.09%)
V10-75-246,233,65847.5894.5440,071,945
(86.67%)
39,088,760
(84.55%)
983,185
(2.13%)
V10-75-341,857,18047.7994.6336,305,125
(86.74%)
35,431,203
(84.65%)
873,922
(2.09%)
S0-75-146,995,19447.1595.1441,171,901
(87.61%)
40,153,268
(85.44%)
1,018,633
(2.17%)
S0-75-245,981,76047.4094.4139,519,741
(85.95%)
38,479,871
(83.69%)
1,039,870
(2.26%)
S0-75-339,083,62247.4594.1733,511,771
(85.74%)
32,642,398
(83.52%)
869,373
(2.22%)
S1-75-140,207,37447.5594.834,752,592
(86.43%)
33,797,693
(84.06%)
954,899
(2.37%)
S1-75-256,949,45647.5894.6149,069,645
(86.16%)
47,472,852
(83.36%)
1,569,793
(2.80%)
S1-75-351,518,85847.5094.5844,351,302
(86.09%)
43,125,438
(83.71%)
1,225,864
(2.38%)
S3-75-156,676,46047.7895.0049,623,480
(87.56%)
48,215,302
(85.07%)
1,408,178
(2.48%)
S3-75-254,783,39647.8494.6447,688,104
(87.05%)
46,323,302
(84.56%)
1,364,802
(2.49%)
S3-75-351,923,29047.7594.9145,009,605
(86.68%)
43,708,284
(84.18%)
1,301,321
(2.51%)
S5-75-155,299,72647.7794.6948,121,537
(87.02%)
46,741,799
(84.52%)
1,379,738
(2.50%)
S5-75-250,772,79448.0594.5943,790,616
(86.25%)
41,634,586
(82.00%)
2,156,030
(4.25%)
S5-75-354,572,93047.6894.4647,517,629
(87.07%)
46,134,554
(84.54%)
1,383,075
(2.53%)
Table 2. Expression analysis of genes coding enzymes in brassinosteroids metabolism.
MetabolismEnzymeGene NameCoding GeneFPKMExpression Pattern
V10S0S1S3V10 vs. S0S0 vs. S1S1 vs. S3
BiosynthesisSteroid 22 α-hydroxylaseCYP724A1Bra0087600.17 ± 0.050.99 ± 0.080.62 ± 0.100.98 ± 0.12
Bra0234640.10 ± 0.110 ± 00 ± 00 ± 0--
DWF4Bra03002316.63 ± 0.9917.08 ± 1.2017.21 ± 0.2920.92 ± 0.60
Bra0360971.04 ± 0.071.17 ± 0.251.55 ± 0.141.79 ± 0.10
C-3 oxidaseCPDBra0058630 ± 00 ± 00 ± 00 ± 0---
Bra00912647.84 ± 2.4332.95 ± 2.9637.92 ± 2.7528.61 ± 1.01
Bra0287515.85 ± 1.663.73 ± 0.162.95 ± 0.071.47 ± 0.44
steroid 5 α-reductaseDET2Bra01714217.34 ± 0.5714.12 ± 0.4012.93 ± 0.0916.35 ± 1.73
C-23 hydroxylaseCYP90D1Bra02150516.89 ± 0.9112.79 ± 1.717.59 ± 0.033.86 ± 0.62
Bra0274051.31 ± 0.342.77 ± 0.791.19 ± 0.010.98 ± 0.12
ROT3Bra0116782.02 ± 0.114.98 ± 1.273.22 ± 0.041.72 ± 0.13
Bra0177579.12 ± 0.514.10 ± 0.185.22 ± 0.343.92 ± 0.32
C-6 oxidaseBR6OX2Bra02074712.05 ± 1.986.74 ± 1.536.91 ± 0.573.82 ± 1.32
Bra02540915.65 ± 2.1519.43 ± 4.7919.66 ± 3.4613.82 ± 0.23
Bra0362030 ± 00 ± 00 ± 00.06 ± 0.04--
BR6OX1Bra0254273.31 ± 0.242.36 ± 0.613.18 ± 0.903.26 ± 0.55
inactivationcytochrome P450 monooxygenaseBAS1Bra0120467.43 ± 1.629.19 ± 0.978.30 ± 0.046.32 ± 0.23
Note: -, not detected; FPKM, fragments per kilobase of transcript per million mapped reads. Red: the changes in gene expression from the vegetative growth stage to the critical stage of flower bud differentiation were consistent with the changes in hormone content at these two stages.
Table 3. Differentially expressed genes related to BR metabolism at different growth stages of pak choi.
Gene NameCoding EnzymeGene AnnotationFPKMLog2FC
V10S0S1S3V10 vs. S0S0 vs. S1S1 vs. S3
Bra000469ABCG31Brassinosteroid biosynthetic process (GO:0016132)0.16 ± 0.030.51 ± 0.000.34 ± 0.010.49 ± 0.011.83−0.380.17
Bra003687ACO5Same as above1.56 ± 0.0217.15 ± 2.257.14 ± 0.064.30 ± 0.073.37−0.52−0.88
Bra005212AT2G37220Same as above8.99 ± 2.21150.92 ± 0.13106.17 ± 2.51154.33 ± 13.083.75−0.500.58
Bra017201Same as above33.98 ± 2.73162.24 ± 10.55122.56 ± 13.70169.43 ± 15.442.17−0.390.43
Bra007002CP29Same as above35.90 ± 5.31151.75 ± 11.07136.40 ± 12.70157.45 ± 12.992.170.050.02
Bra007096ARP1Same as above1.20 ± 0.386.95 ± 1.135.66 ± 0.194.50 ± 0.312.42−0.05−0.35
Bra007824CPI1Same as above1.86 ± 0.1418.12 ± 2.7711.26 ± 2.797.58 ± 1.063.01−0.67−0.66
Bra009738SQE5Same as above25.29 ± 1.3590.43 ± 4.0361.52 ± 3.0069.38 ± 9.461.94−0.600.12
Bra029392Same as above3.97 ± 1.3218.19 ± 0.6911.36 ± 0.156.90 ± 0.941.54−0.88−0.72
Bra010542DIR6Same as above0.10 ± 0.013.84 ± 0.951.04 ± 0.820.59 ± 0.013.13−0.77-
Bra010693GRP8Same as above109.43 ± 8.321361.84 ± 175.56945.68 ± 26.371534.85 ± 163.233.28−0.190.31
Bra011869Same as above78.31 ± 2.561128.01 ± 198.71772.50 ± 29.451138.56 ± 0.893.61−0.300.49
Bra010706RD19Same as above14.37 ± 3.4945.32 ± 5.1319.85 ± 1.7023.16 ± 3.111.79−0.81−0.31
Bra015789SMT3Same as above39.29 ± 0.52107.55 ± 10.70105.15 ± 3.45101.06 ± 20.981.33−0.11−0.07
Bra020710AACT2Same as above0.79 ± 0.052.57 ± 0.192.07 ± 0.021.93 ± 0.181.60−0.490.30
Bra024901BAT1Same as above1.37 ± 0.059.53 ± 0.914.97 ± 0.137.18 ± 0.102.58−0.680.29
Bra026228WRKY14Same as above1.47 ± 0.054.22 ± 0.372.54 ± 0.021.94 ± 0.071.43−0.57−0.42
Bra029023DFL1Same as above35.08 ± 2.3684.26 ± 6.0059.69 ± 1.5647.18 ± 7.671.16−0.28−0.17
Bra030284GRP7Same as above6.77 ± 1.582125.45 ± 119.011013.80 ± 272.031633.85 ± 567.757.59−0.490.77
Bra031210Same as above18.28 ± 0.674198.73 ± 211.011692.18 ± 390.002862.16 ± 884.407.25−0.680.99
Bra027963AT2G03750Brassinosteroid metabolic process (GO:0016131).20.21 ± 0.635.44 ± 0.1912.53 ± 0.308.09 ± 1.76−2.111.06−0.69
Bra026365GH3.5Same as above63.44 ± 2.6380.49 ± 2.3628.26 ± 5.8022.65 ± 7.640.14−1.06−1.06
Bra004513KCS13Same as above4.38 ± 0.156.53 ± 0.0111.05 ± 1.9445.84 ± 4.940.820.941.55
Bra028711ST2ABrassinosteroid metabolic process (GO:0016131).1.40 ± 0.532.94 ± 0.152.45 ± 0.380.24 ± 0.062.11−0.89−3.35
Publisher’s Note: MDPI stays neutral with regard to jurisdictional claims in published maps and institutional affiliations.

