Article

Flower Thinning Improves Fruit Quality and Oil Composition in Camellia oleifera Abel

1
The Key Laboratory for Silviculture and Conservation of Ministry of Education, Beijing Forestry University, Beijing 100083, China
2
Ningxia Academy of Agriculture and Forestry Sciences, Yinchuan 750002, China
3
The School of Technology, Beijing Forestry University, Beijing 100089, China
*
Author to whom correspondence should be addressed.
Horticulturae 2022, 8(11), 1077; https://doi.org/10.3390/horticulturae8111077
Submission received: 14 October 2022 / Revised: 5 November 2022 / Accepted: 14 November 2022 / Published: 16 November 2022

Abstract

:
Camellia oleifera is a woody oil tree with overlapping flower bud differentiation and fruit maturation. Therefore, mechanical harvesting of fruits leads to flower abscission. The present study investigated the effects of flower number per tree on fruit growth, yield, nutrient accumulation, and oil fatty acid composition in C. oleifera. Here, we set different flower numbers per tree by thinning flowers. Heavy flower thinning (T2 and T3) significantly reduced fruit yield and the proportion of palmitic, palmitoleic, linoleic, and linolenic acid in fatty acids compared with other treatments. However, heavy thinning favored an increase in fruit size and weight, seed and dry kernel rate of fresh fruit, soluble protein and oil accumulation in seeds, and the proportion of oleic acid and stearic acid in fatty acids, and it had no significant effect on oil yield per tree compared with light thinning (T1) and control (T0). T2 and T3 decreased soluble sugar content in the kernels at the later stage of fruit development (260–320 days after full bloom (DAFB)) in contrast to the rapid fruit growth period (200–230 DAFB). As the crop load decreased, fruit ABA content increased continuously during 260–320 DAFB, while fruit IAA content increased during 260–300 DAFB and then decreased during 310–320 DAFB. These data suggest that the abscission of a few flowers during mechanical harvesting will not affect fruit production efficiency in C. oleifera.

1. Introduction

Camellia oleifera is a unique edible oil tree species of China, as well as one of the four major woody oil trees in the world [1]. The oil content in its seeds is approximately 40–50% [2]. The oil from C. oleifera seeds (known as tea oil), as a cooking oil, is a high-quality edible oil that contains more than 90% unsaturated fatty acids, and the proportion of fatty acids is similar to olive oil [3]. Additionally, tea oil is also rich in vitamin E, polyphenols, squalene, and other bioactive substances. Tea oil has been proven to soften blood vessels, reduce blood lipid content and pressure, and is recognized and promoted by the FAO as a healthy and high-quality cooking oil [4].
Presently, the area occupied by C. oleifera in China is approximately 4.37 million hectares, and the annual seed production is 0.9 million tons, equivalent to 6% of China’s vegetable oil consumption [5]. Large areas of C. oleifera forests in China mainly rely on manual fruit harvesting, but this method of harvesting is inefficient, costly, and labor-intensive [6]. Therefore, scholars developed a C. oleifera fruit harvesting machinery with a net recovery rate of 95% to harvest fruits efficiently [7]. However, C. oleifera is a plant with overlapping flowering and fruit maturity, and the average force required for detaching fruits is greater than that of flowers. Thus, mechanical harvesting of C. oleifera fruits inevitably causes flower fall, affecting fruit yield in the following year. Consequently, to avoid flower bud damage, mechanical harvesting has not been widely used in C. oleifera [8].
C. oleifera produces flowers and fruits that exceed the plant’s ability to provide photoassimilates for fruit maturation, resulting in numerous flower and fruit abscissions during development, similar to other plants [9,10,11,12]. Only approximately 10% of flower buds can develop into ripe fruits for the C. oleifera tree [13]. Moreover, the simultaneous growth of flowers and fruits in conjunction with the limited nutrients in C. oleifera aggravates the competition between fruits and flowers, limiting their growth potential and reducing the number of flowers and fruits in the following year [14].
Thinning is a widely used management routine to achieve optimum growth of the retained flowers and fruits, thus improving fruit quality and yield [15,16]. Thinning also strongly affects the accumulation of primary or secondary metabolites, such as soluble solids and titratable acidity in in grape [17,18] and prunus [19] fruits. In previous studies on C. oleifera, branches with fewer fruits can transport phosphorus assimilates to a single fruit, increasing the number of fruit grains and oil yield [20]. Meanwhile, with the increase in the ratio of leaves to fruits of branches, the total content of fatty acids and the relative contents of oleic acid, stearic acid, and squalene in fruits were found to significantly increase. These findings implied that the reduction in C. oleifera flowers caused by mechanical picking may be beneficial to the improvement of fruit yield and quality.
The present study aimed to elucidate the relationship between the number of flowers per tree and the yield and quality of the fruit of C. oleifera. We adopted four flower thinning intensities in the major C. oleifera cultivar of Jiangxi Province of China and evaluated the effects on fruit growth, fruit quality characteristics, and flower bud rate. This study will provide theoretical support for improving the fruit yield and quality and propose an efficient harvesting approach in C. oleifera.

2. Materials and Methods

2.1. Materials

These trials were conducted at a C. oleifera orchard in Poyang County, Jiangxi Province, China (116°51′38″ E, 29°23′39″ N). This area has a typical subtropical monsoon climate, with an annual average sunshine duration of 2098 h, an average temperature of 16.9–17.7 °C, and precipitation of 1300–1700 mm. We used a ten-year-old ‘Ganshi 83-4′ C. oleifera cultivar in this experiment. All trees were planted at 3 m × 2 m spacing, fertilized by furrow application of 2 kg organic fertilizer in spring, and weak branches were pruned in winter, with strong vigor and no disease or pest problems.

2.2. Experimental Design

On 10 December 2020, 240 trees of healthy and similar vigor were selected and labeled. The experiment was conducted in a randomized block design, and we divided all trees into four flower-thinning treatments. The plant materials were hand-thinned at the initial flowering stage (January 2021), and 0% (T0), 20% (T1), 40% (T2), and 60% (T3) of the initial flowers (more than 2000 flowers per tree) were removed. Each treatment was 80 plants.

2.3. Determination of Flower and Fruit Parameters

2.3.1. Flower Bud and Fruit Set Rates

Six trees per treatment were randomly selected and labeled, and the flowers at the initial stage on each tree were manually counted. Before physiological fruit drop (60 days after full bloom (DAFB); 20 February 2022) and fruit harvesting (320 DAFB: 6 November 2022), the number of fruits set per tree was measured. Then, after flower bud differentiation (230 DAFB: 10 August 2022), six new branches of medium length from four directions (east, west, north, and south) of each tree were selected to count the number of flowers and leaf buds. The flower bud and fruit set rates were estimated using the following equations:
Fruit set rate (%) = (fruit number/flower number) × 100%
Flower bud rate (%) = (flower bud number/flower and leaf bud number) × 100%

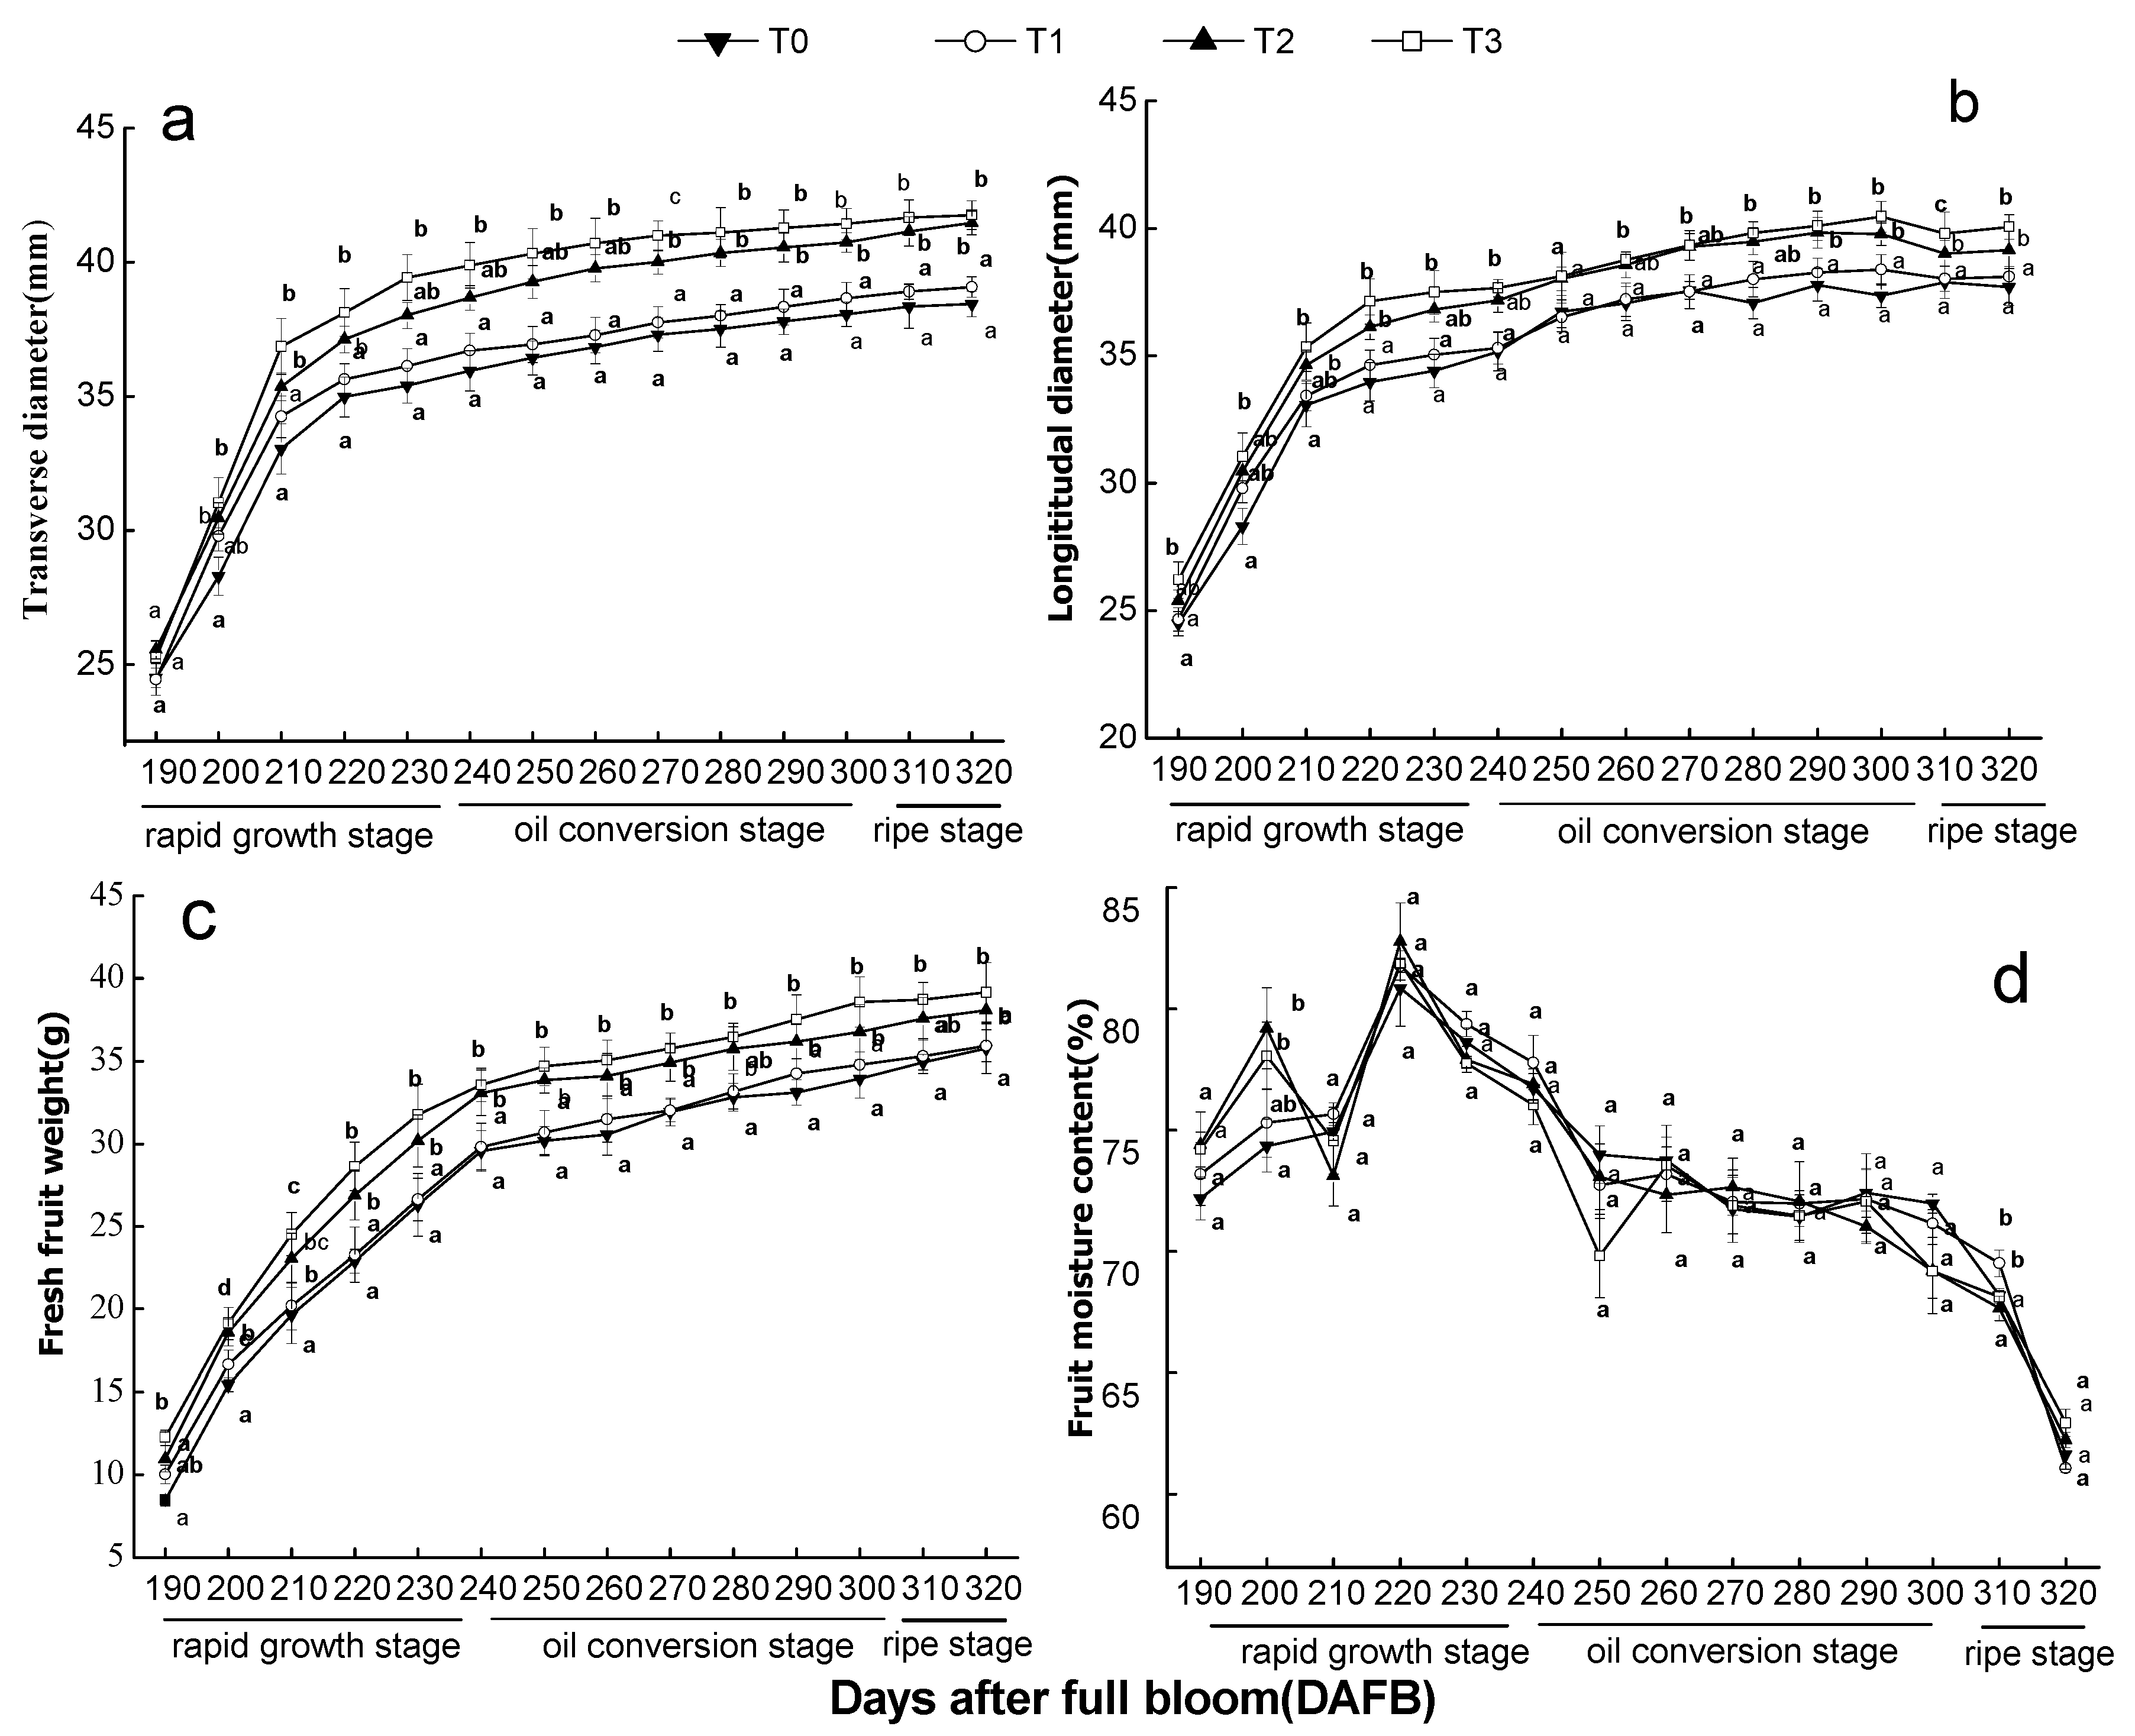
2.3.2. Fruit Growth Parameters

From the rapid fruit growth period (190 DAFB; 28 June 2022) to fruit maturity (320 DAFB; 6 November 2022), twenty representative fruits from each of the three trees (upper, middle, and lower canopies) per treatment were collected every 10 days to determine the fruit growth parameters. The parameters were represented as an average of each plot. To avoid the impact of fruit sampling on tree load, all test trees were sampled only once. The longitudinal and transverse diameters of the fruits were determined using a digital Vernier caliper with an accuracy resolution of 0.01 mm, and the weight of the fruits (fresh fruit weight, fresh seed weight, dry fruit weight, and kernel weight) was determined using an electronic balance with an accuracy resolution of 0.01 g. The moisture content, fresh seed rate, and dry kernel rate of fresh fruit were calculated using the following formulas:
Fresh seed rate (%) = (fresh seed weight/fresh fruit weight) × 100%
Fruit moisture content (%) = (fresh fruit weight − dry fruit weight)/fresh fruit weight) × 100%
Dry kernel rate of fresh fruit (%) = (dry kernel weight/fresh fruit weight) × 100%

2.3.3. Accumulation of Nutrients and Fatty Acids in Fruits

The seed kernels in the fruit samples in Section 2.3.2 were ground with a grinder as the material for nutrient determination from 200 to 320 DAFB. Then, soluble sugar, soluble protein, and oil were extracted from the kernel of the fruit samples using anthrone colorimetry [21], Coomassie brilliant blue method [22], and Soxhlet extraction method (petroleum ether as the extracting solvent) [23], respectively. Meanwhile, the fatty acid components in oil were determined by gas chromatography, as described by Yang et al. [22]. The soluble sugar and soluble protein contents of kernels were quantified based on standard curves. The standard curves for soluble sugar and soluble protein content and calculation formula of oil content are as follows:
Soluble sugar content of kernel (y = 3.0166x + 0.031, R 2 = 0.9901)
Soluble protein content of kernel (y = 0.0025x − 0.138, R 2 = 0.998)
Oil content of kernel = (weight of oil/quality of dried kernel) × 100%

2.3.4. Endogenous IAA and ABA in the Peel

Five more fruit samples were collected from each treatment every 10 days from 260 to 320 DAFB (late developmental stage of C. oleifera fruit) for hormone analysis. The peel and seed were separated immediately after fruit picking and treated with liquid nitrogen at low temperature. Then, the peel was ground into powder and endogenous hormones, including indole acetic acid (IAA) and abscisic acid (ABA), were extracted from 0.5 g of powder and analyzed using the high-performance liquid chromatography method of Xiao et al. [24] and Song et al. [21]. The absorbance of the sample extract was measured at 254 nm on a VWD Chemstation (Agilent 1260 VWD), with a retention time of 5 min. The hormones were quantified based on standard curves and expressed as μg g−1 fresh weight. The standard curves for IAA and ABA were as follows:
IAA (y = 9.336x − 1.595, R 2 = 0.9995)
ABA (y = 46.583x − 9.253, R 2 = 0.998)

2.3.5. Yield and Oil Production per Tree

At maturity (320 DAFB; 6 November 2022), all fruits of the test tree were used to determine the fruit set and flower bud differentiation rates. The fruits were collected and weighed to determine the yield per tree (kg/plant). The oil production per plant was calculated using the following formula:
Oil production per plant (kg) = yield per plant (kg) × dry kernel rate of fresh fruit (%) × kernel oil content (%)

2.4. Statistical Analysis

Excel 2016 software was used for data collation and statistics, and SPSS 22.0 software was used for one-way ANOVA (one-way analysis of variance) of relevant indicators. Duncan’s polar difference was applied for multiple comparisons. Origin Pro 2019 software was used to generate the line graphs and histograms. Three biological replicates were maintained per treatment, and all data are represented as the mean ± SE.

3. Results

3.1. Effect of the Number of Flowers per Tree on Flowering and Fruit Set in ‘Ganshi 83-4′

The differences in the number of flowers per tree significantly affected the flower bud rate and fruit set in the following year (Table 1). Fruit set on the trees under the four treatments continuously decreased from 60 to 320 days after flower bloom (DAFB). The T2 and T3 treatments had higher fruit set rates at 60 and 320 DAFB than T0 and T1. At 320 DAFB, T2 and T3 treatments had 49.1% and 71.8% higher fruit set rates than T0. In addition, the flower bud rate in the following year significantly increased with the reduction in the number of flowers per tree; T1, T2, and T3 resulted in 9.5%, 24.7%, and 44.2% higher flower bud rates than T0.
Further analysis showed that the number of flowers per tree significantly affected fruit growth and moisture contents in the coming year. The size and quality of the fruits on the trees under the four treatments increased rapidly until 230 DAFB and then slowly until 320 DAFB. The fruit moisture content in all treatments peaked at 220 DAFB and then decreased gradually (Figure 1). During the 190–320 DAFB period, the fruit size and weight under all thinning treatments were larger than those in T0. T2 and T3 fruits had significantly increased transverse diameters (Figure 1a), longitudinal diameters (Figure 1b), and fresh weight (Figure 1c) compared with T0 and T1 (p < 0.05), while no significant differences were observed between T1 and T0. The fruit size and weight of T0 were less than those in the other treatments. At harvest, the fruit transverse and longitudinal diameters and fresh fruit weight under T3 were 2.91 mm, 3.33 mm, and 14% higher than those under T0. From 190 to 220 DAFB, the fruit moisture content was also higher in the thinning treatments than T0; T2 and T3 had 2.55% and 2.92% higher fruit moisture content at 200 DAFB than T0 (Figure 1d). However, T0 had higher fruit moisture content than the thinning treatments from 220 to 320 DAFB, but there was no significant difference among the treatments. Overall, T2 and T3 had heavier fresh fruits than T1 and T0 treatments, indicating that a 40% and 60% reduction in the number of flowers per tree benefits fruit growth.

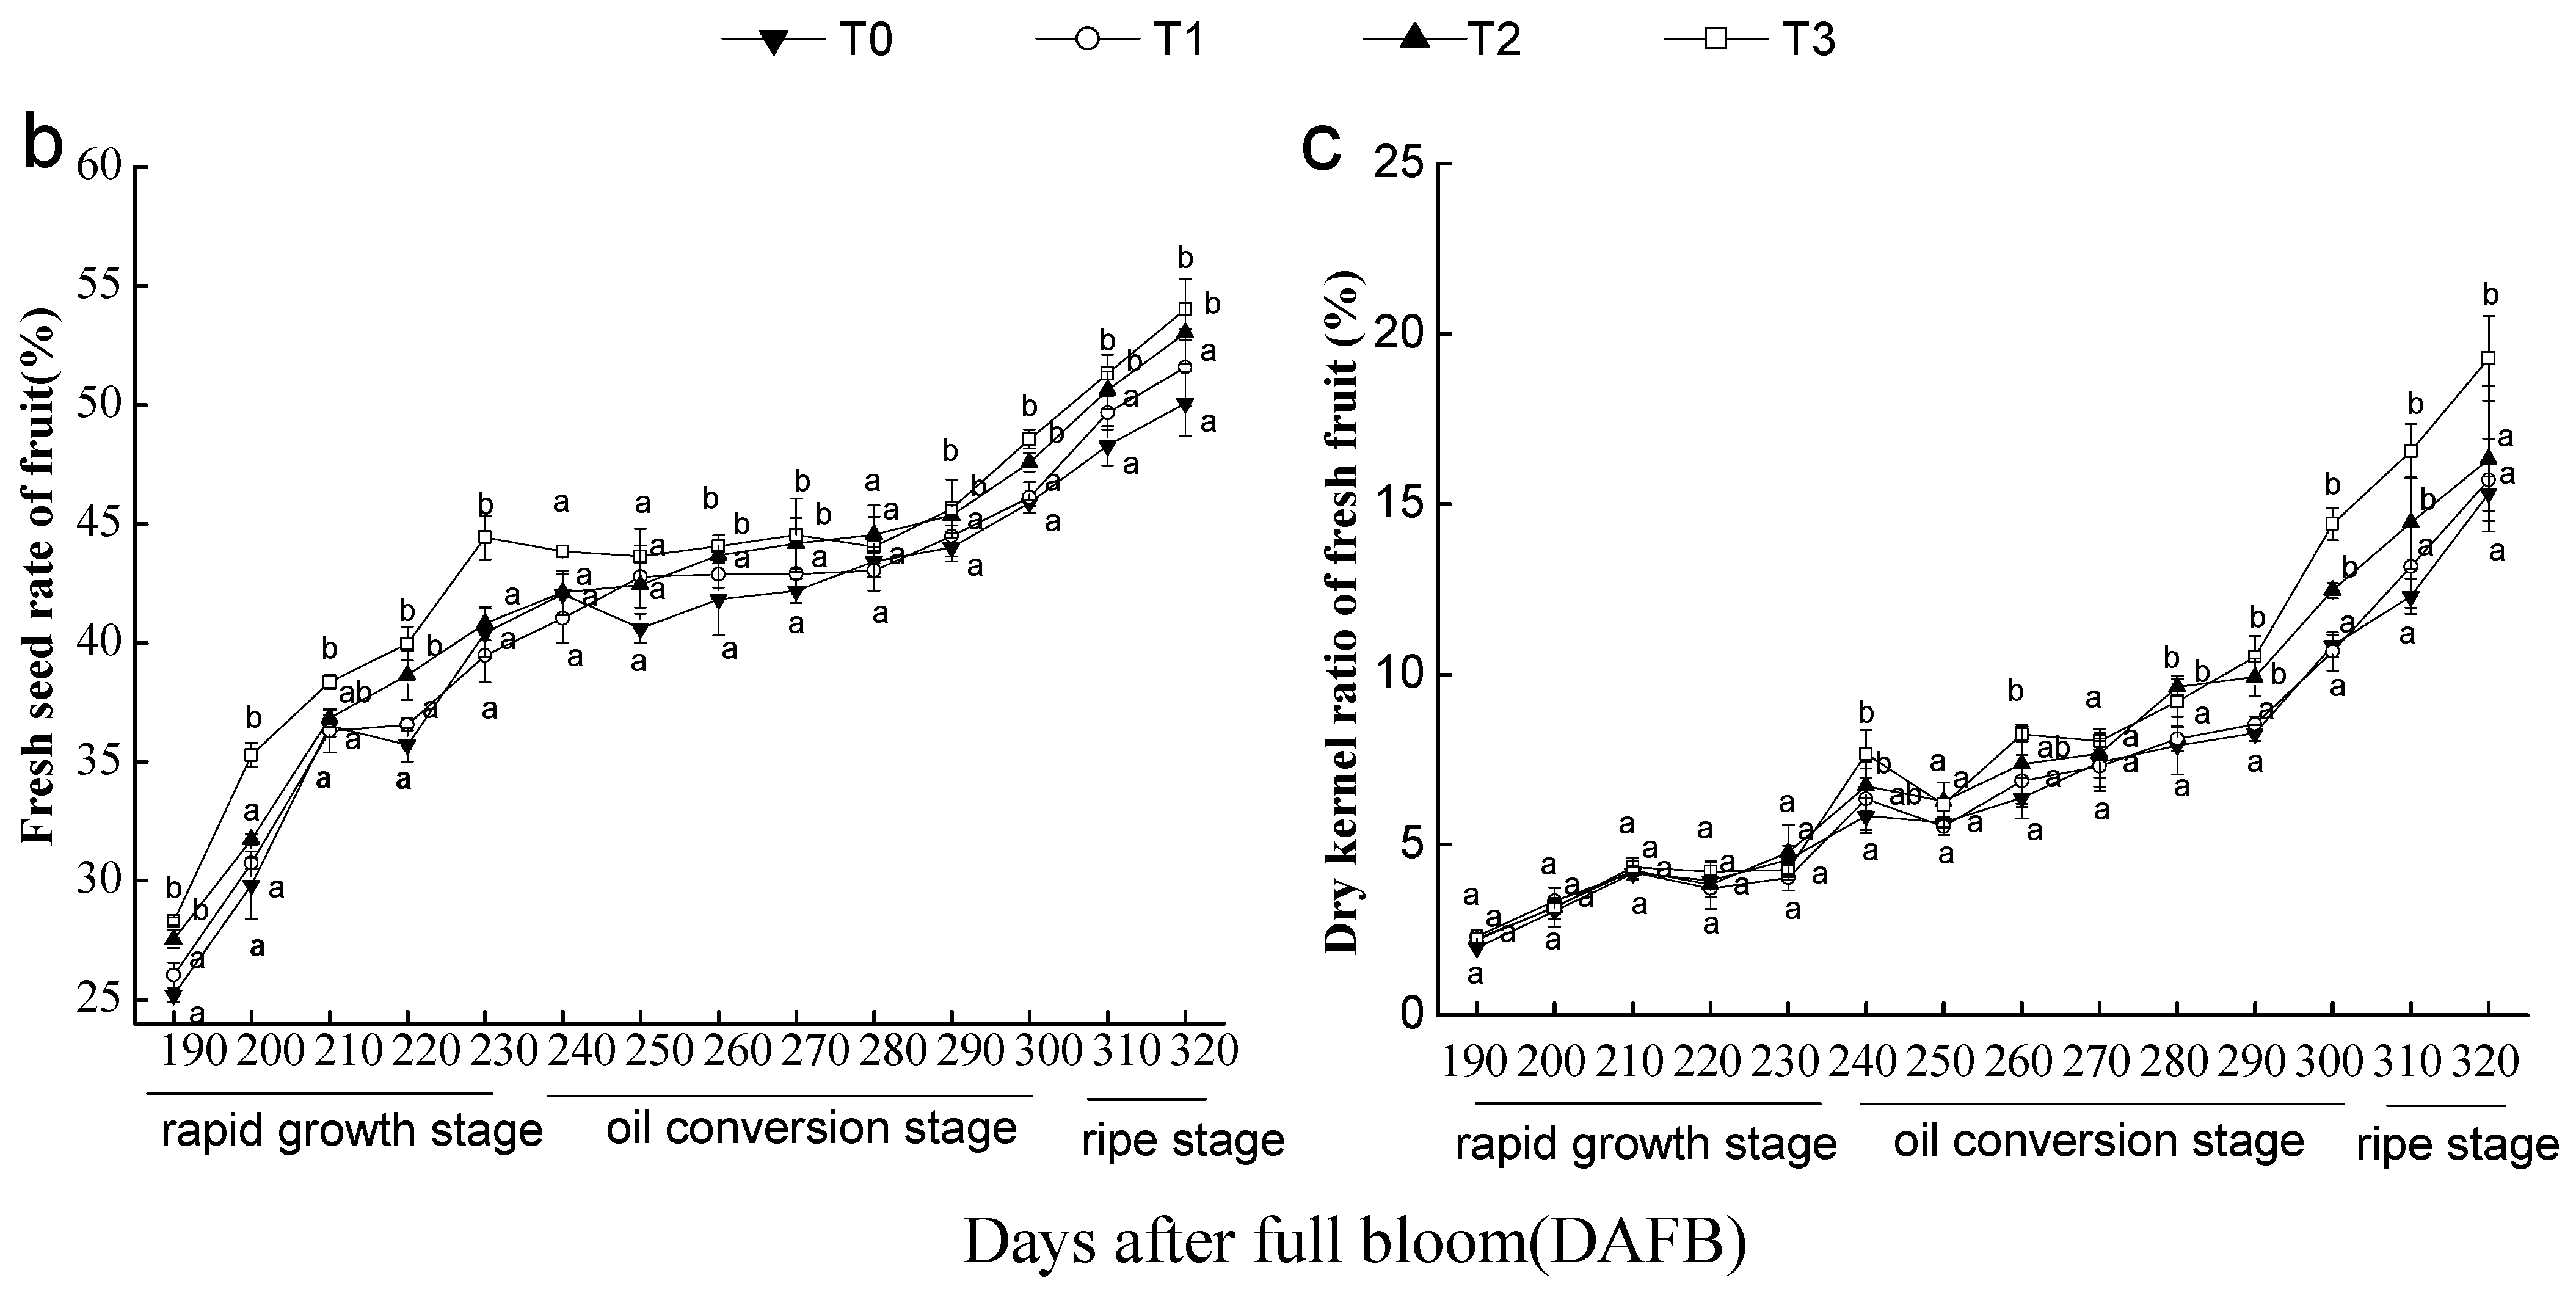
3.2. Effects of the Number of Flowers per Tree on Fresh Seed Rate and Dry Kernel Rate of C. oleifera Fresh Fruits

The fresh and dry seed rates of fruit in the following year continuously increased during the growth in all treatments (Figure 2). The endosperm in the kernel gradually developed from 190 to 230 DAFB, and the seed coat began to harden at 230 DAFB (Figure 2a). The sclerotic degree of the seed coat gradually increased during the oil conversion period (240–300 DAFB), and the seed coat was completely sclerotic at 290 DAFB. The kernel color changed from white to yellow, and the peel of some fruits cracked during the 310–320 DAFB period.
The apparent kernel developmental features were not significantly different among the treatments; however, T3 first showed fruit cracking. The fresh seed rate of fruit (FSRF) in all treatments increased rapidly from 190 to 230 DAFB, slowly from 240 to 280 DAFB, and again rapidly at approximately 290 DAFB (Figure 2b). During the 190–320 DAFB period, the FSRF of T3 was significantly higher than those of T0 and T1, and the FSRF of T0 during the 260–320 DAFB period was significantly lower than those of T2. At harvest, T2 and T3 significantly increased the FSRFs by 5.90% and 7.91%, respectively, compared with T0, while no significant difference was observed between T1 and T0.
The dry kernel rate of fresh fruit (DKRF) constantly increased from 190 to 320 DAFB (Figure 2c). The treatments showed no significant difference in DKRF during the 190–230 DAFB period, while T3 and T2 had significantly higher DKRFs than T0 and T1 after 270 DAFB; the difference in DKRFs among the T2, T3, and T0 treatments gradually increased with fruit development. At the mature stage, the DKRFs in T3, T2, and T1 increased by 26.0%, 6.67%, and 2.61%, respectively, compared with T0, and T3 had a DKRF significantly higher than other treatments.

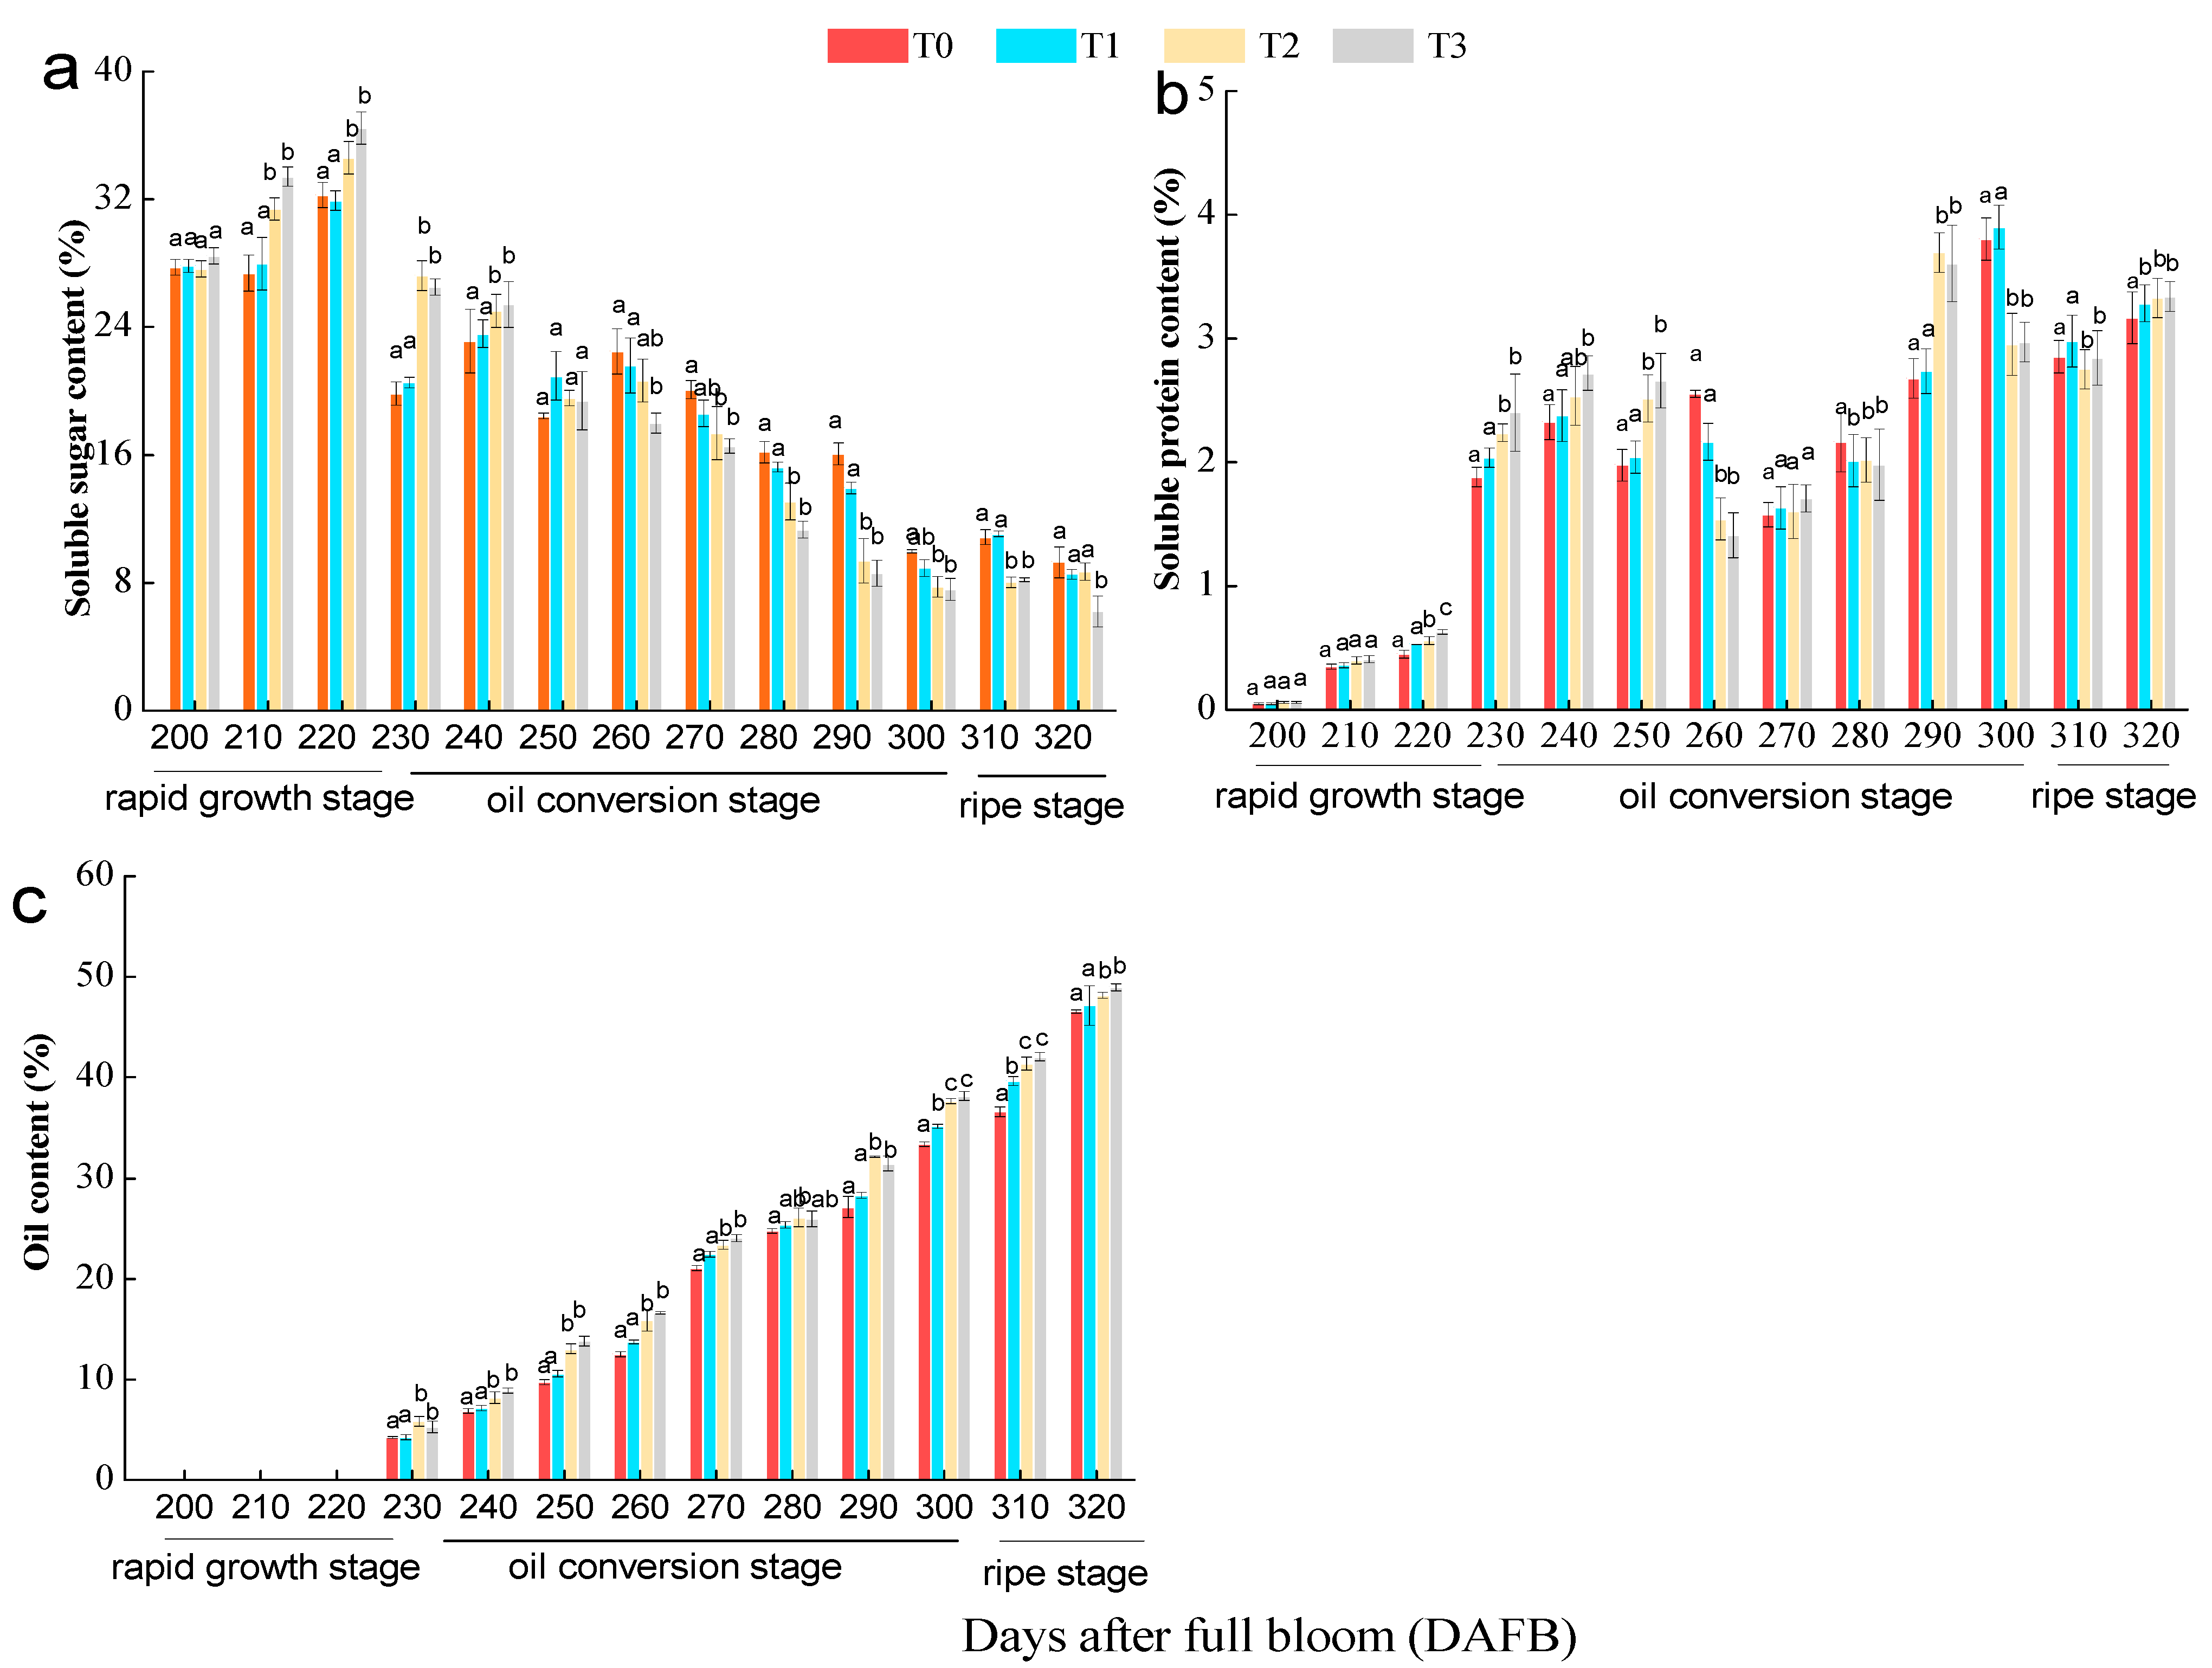
3.3. Effect of the Number of Flowers per Tree on Oil, Soluble Sugar, and Soluble Protein Contents of C. oleifera Seeds

The number of flowers per tree significantly affected the major seed components. The accumulation patterns of the three components were not consistent during the 200–320 DAFB period (Figure 3). The soluble sugar content of the seed kernel (SSCSK) in the four treatments peaked at 230 DAFB, decreased rapidly at 240 DAFB, and then decreased slowly until 320 DAFB (Figure 3a). T2 and T3 had significantly higher SSCSKs than T0 and T1 during the 210–240 DAFB period, while T2 and T3 had significantly lower SSCSKs than T0 and T1 from 280 to 310 DAFB. T3 had a substantially lower SSCSK than the other treatments at 320 DAFB; T0, T1, and T2 increased the SSCSK by 33%, 27.3%, and 28.5%, respectively, compared with T3.
The soluble protein content of the seed kernel (SPCSK) exhibited a bimodal curve in all treatments during the 200–320 DAFB period (Figure 3b). The two peaks of SPCSK in T2 and T3 appeared at 240 and 290 DAFB, and the lowest value occurred at 260 DAFB. Meanwhile, the two peaks in T0 and T1 appeared at 260 and 300 DAFB, and the minimum value occurred at 270 DAFB. Moreover, the peak and minimum values in T2 and T3 appeared approximately 10 days earlier than those in T0 and T1. The SPCSK values at developmental stages other than 260, 300, and 310 DAFB were higher in T2 and T3 than in T0 and T1.
The oil content of the seed kernel (OCSK) in all treatments was initially detected at 230 DAFB and constantly increased during the 230–320 DAFB stage (Figure 3c). T2 and T3 had significantly higher OCSK than T0 and T1 throughout the fruit development period; the OCSK of T1 was significantly higher than that of T0 at 300 and 310 DAFB. At harvest, T2 and T3 demonstrated 3.4% and 5.1% higher OCSK than T0. The OCSK increased as the crop load reduced, indicating the inhibition of oil accumulation at higher crop loads.

3.4. Correlation between Kernel Nutrients at Various Stages of C. oleifera Fruit Development

At different fruit developmental stages, the oil, soluble sugar, and protein content in the seed kernel showed significant correlations (Table 2). During the rapid growth period of fruit (200–230 DAFB), the oil content was positively correlated with soluble sugar (0.601 *) and soluble protein (0.458) (p < 0.05). At the oil accumulation and transformation stage (II) and the maturation stage (III), the oil and soluble sugar content in the seed kernel were negatively correlated, and the negative correlation coefficient at stage II was larger than that at stage III. Meanwhile, an extremely significant positive correlation was detected between oil and soluble protein content.

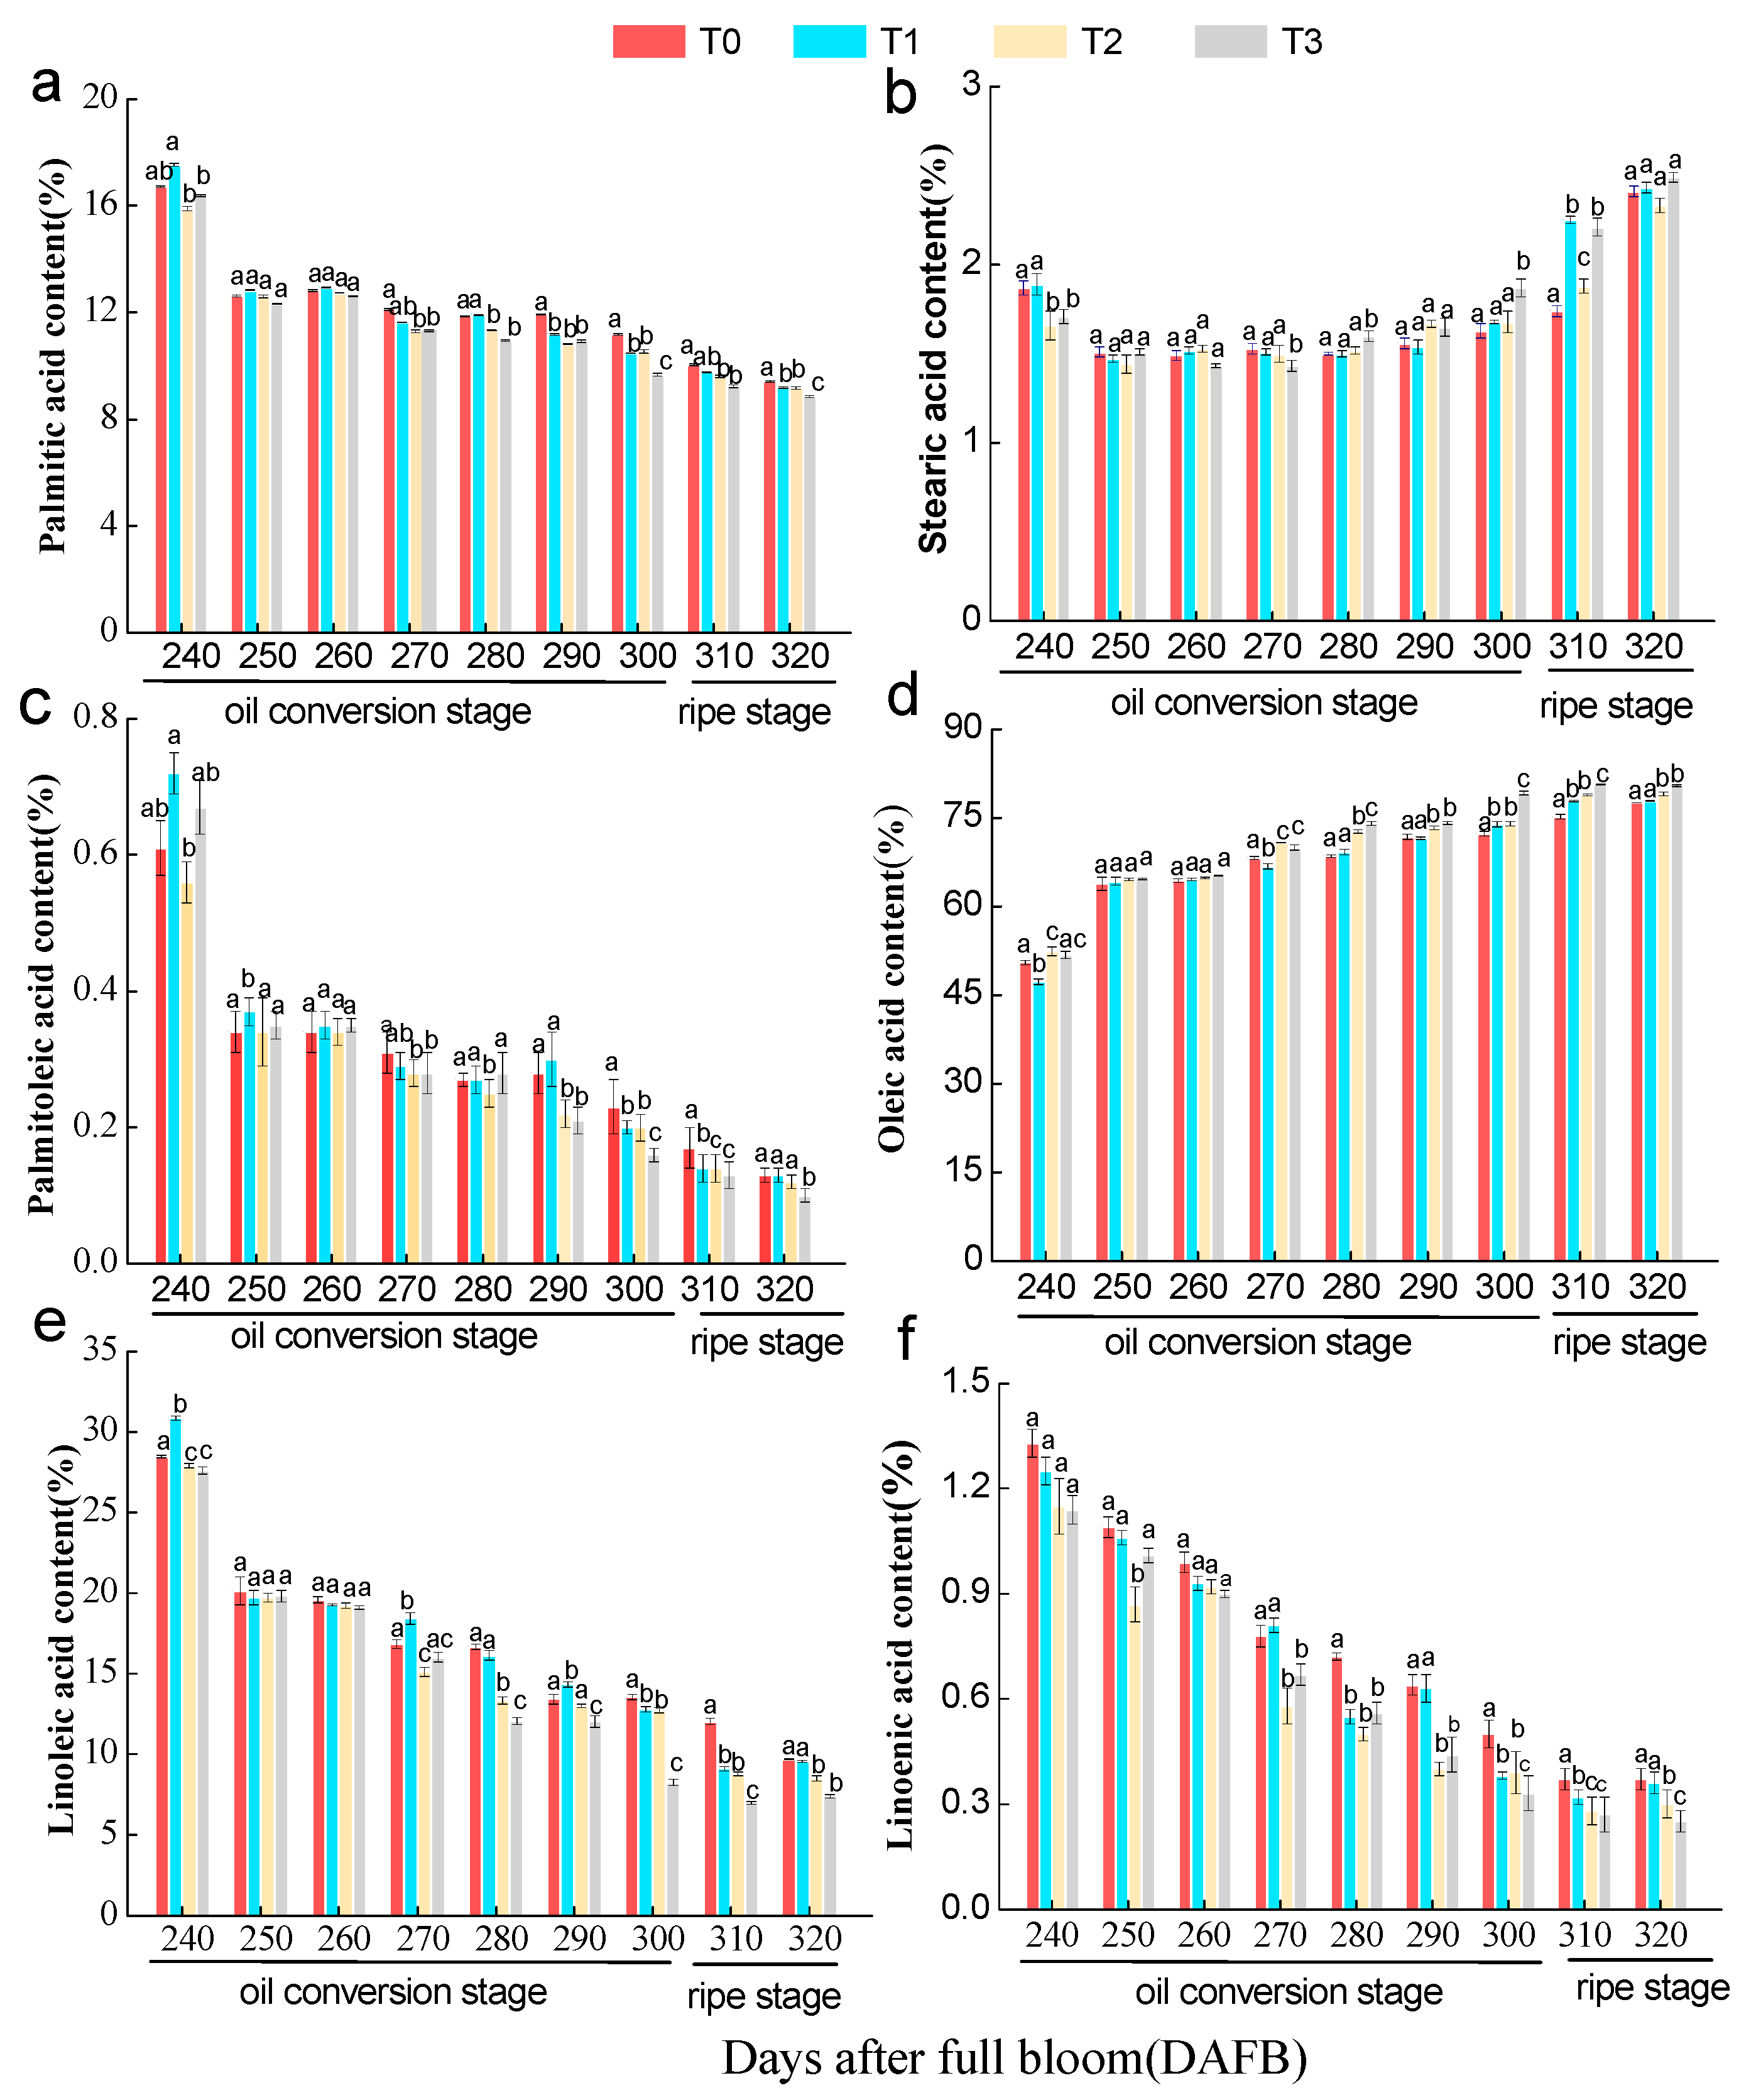
3.5. Effect of the Number of Flowers per Tree on the Content of Oil Components in C. oleifera Seed Kernels

We further investigated the changes in fatty acid composition with fruit development under different crop loads (Figure 4). The results showed that the contents of palmitic acid (PA), palmitoleic acid (POA), linoleic acid (LA), and linolenic acid (LOA) constantly decreased in all treatments during the 260–320 DAFB period. The stearic acid (SA) content decreased from 260 to 270 DAFB but increased after 280 DAFB. Oleic acid (OA), the most abundant fatty acid component in tea oil, constantly increased from 260 to 320 DAFB under the four crop loads. Crop loads significantly affected the fatty acid composition of C. oleifera seed kernels.
The PA content at 270 DAFB was significantly higher in T0 than in T2 and T3; however, no significant difference was observed between T1 and T0, T2, or T3. At both 300 and 320 DAFB, T0 had significantly high PA content, while T3 showed the lowest levels (Figure 4a). Compared with T0, the thinning treatments T1, T2, and T3 reduced the PA content at harvest by 2.44%, 2.45%, and 5.84%, respectively. Overall, the PA content decreased with decreasing crop load.
The SA content was significantly higher in T0 and T1 than in T2 and T3 at 240 DAFB; however, the content of T3 was significantly higher than all the other treatments at 300 DAFB (Figure 4b). Crop loads affected the dynamics of SA content accumulation, but SA content at harvest did not differ significantly across the treatments.
The POA content at 270 DAFB was significantly higher in T0 and T1 than in T2 and T3, and the POA content of T1 was significantly lower than that in T0 at 300 DAFB. At harvest, T3 had substantially lower POA content than T0, T1, and T2, and there was no significant difference among T0, T1, and T2 (Figure 4c). Overall, T3 maintained a lower POA content than the other treatments throughout the observation period.
The OA content in T2 and T3 was significantly higher than that in T0 from 270 to 320 DAFB (Figure 4d); T1 had substantially higher OA content than T0 from 290 to 300 DAFB. At harvest, T1, T2, and T3 resulted in 0.44%, 1.95%, and 3.79% higher OA content than T0, indicating the inhibition of OA accumulation at higher crop loads.
The LA content was significantly lower in T3 than in the other treatments from 280 to 310 DAFB and in T1 and T2 than in T0 at 300 and 310 DAFB (p < 0.05). At harvest, T2 and T3 had significantly higher LA content than T0 and T1; no significant difference was observed between T1 and T0 (Figure 4e).
At 270 DAFB, the LOA content of T2 and T3 was significantly lower than that of T0 and T1, and no significant difference was observed in the LOA content between T2 and T3 (Figure 4f). From 300 to 320 DAFB, T3 significantly decreased the LOA content compared with the other treatments, and both T1 and T2 significantly decreased the LOA content compared with T0.

3.6. Effect of the Number of Flowers per Tree on Economic Indicators of C. oleifera Fruit at Maturity

Further analysis revealed significant differences in fruit yield, dry kernel yield, kernel oil content, and unsaturation degree among the treatments; however, no differences were observed in oil yield (Table 3). Thinning of the initial flowers to 40% (T2) and 60% (T3) reduced yield per tree by 11.7% and 28.1%, respectively, compared with T0 (p < 0.01), but no significant difference was observed between T0 and T1. The T3 treatment resulted in significantly lower dry kernel yield per tree than in T0 and T1, while T2 showed no significant difference compared with other treatments. T2 and T3 had significantly higher kernel oil content than T0 and T1, contrary to the yield per plant. Oil yield per tree did not change significantly among the treatments, but unsaturated fatty acids in oil were significantly higher in T3 and T2 than that in T1 and T0.

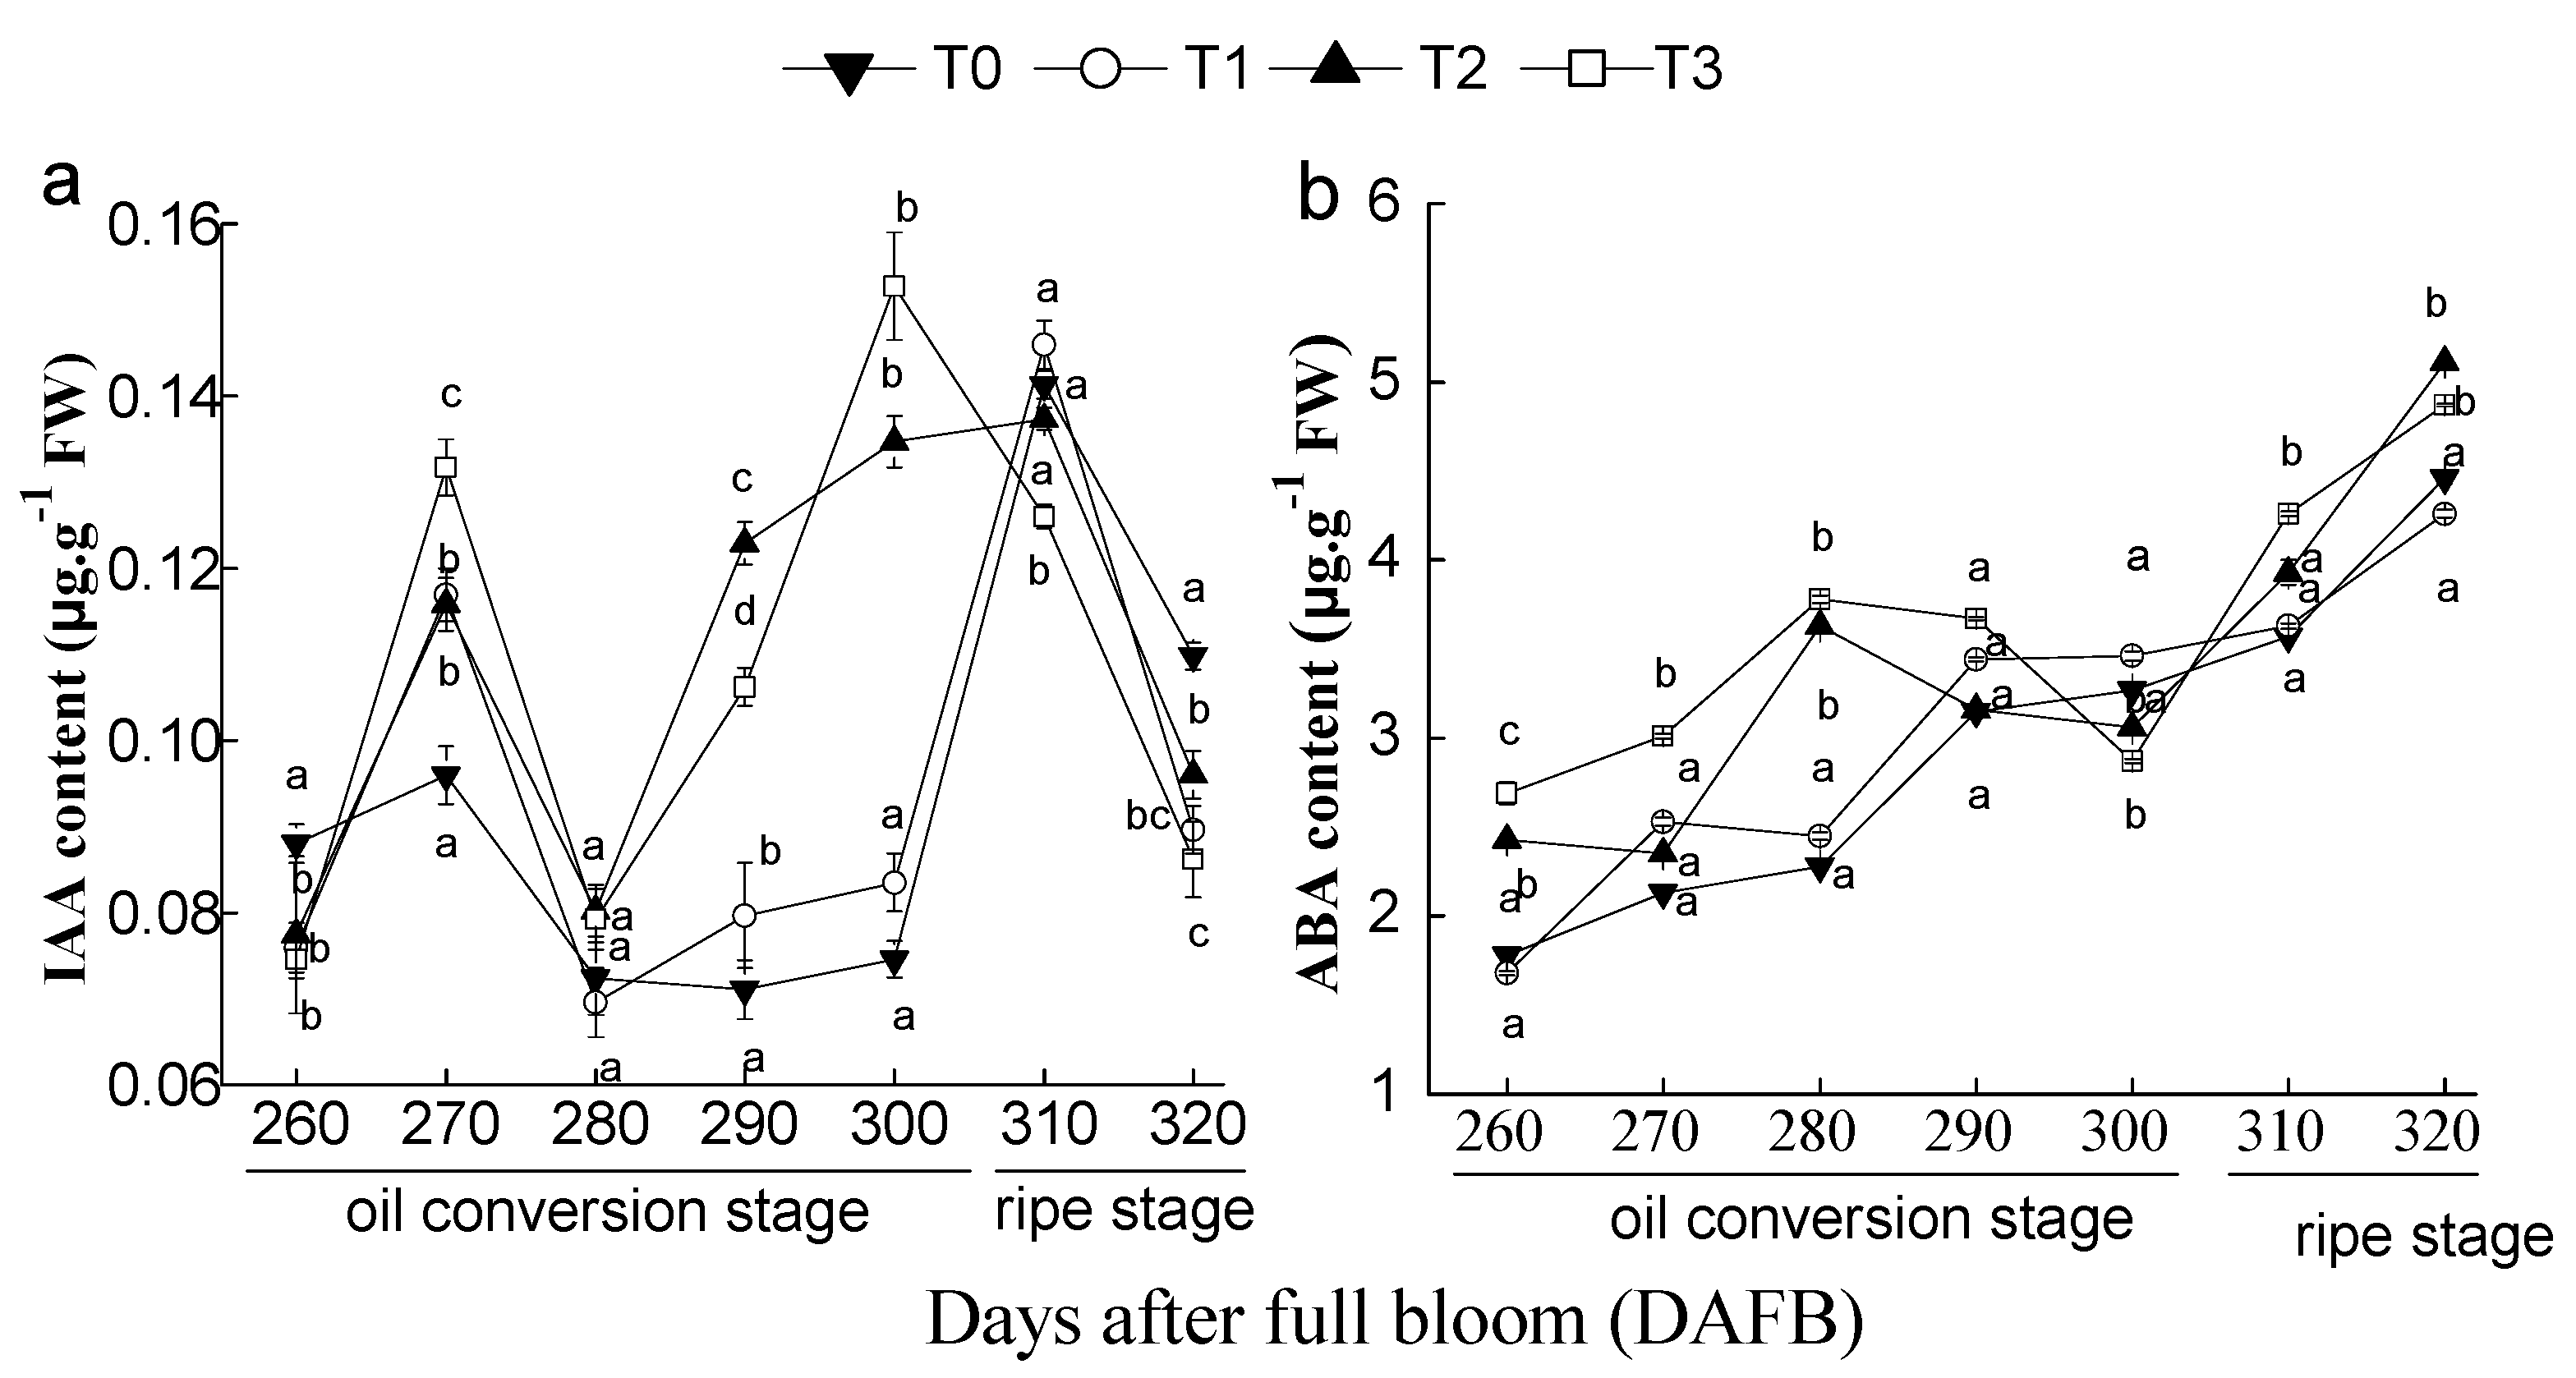
3.7. Effects of the Number of Flowers per Tree on Fruit IAA and ABA Content during the Late Developmental Stage of C. oleifera Fruit

During fruit development, fruit IAA content showed a bimodal distribution in the four treatments (Figure 5a). The first IAA peak appeared at 270 DAFB in all treatments, while the second appeared at 300 DAFB in T3 and 310 DAFB in all other treatments. Moreover, the second IAA peak was higher than the first peak in all treatments. At both 270 and 290 DAFB, the fruit IAA content of T3 was significantly higher than that of the other treatments, and that of T2 was higher than T0. However, at 320 DAFB, the fruit IAA content was the highest in T0 and the lowest in T3; no significant difference was observed between T1 and T2.
The fruit ABA content of T2 and T3 decreased after 280 DAFB and increased again at 300 DAFB, while that of T0 and T1 constantly increased during the late stage of fruit development (260–320 DAFB) (Figure 5b). The fruit ABA content in T3 was significantly higher than that in T0 and T1 from 260 to 280 DAFB and T2 at 260 and 270 DAFB. The treatments did not show differences in ABA content at 300 DAFB. At 310 DAFB, T3 had significantly higher fruit ABA content than the other treatments but with no significant difference among T0, T1, and T2. At harvest (320 DAFB), T2 and T3 significantly increased fruit ABA content by 0.65 ng g−1 FW and 0.41 ng g−1 FW, respectively, compared with T0, while T1 had no significant effect on fruit ABA content.

3.8. Correlation between Hormones and Quality Traits of Fruit at Oil Conversion and Fruit Ripening Stages

Finally, we analyzed the correlations between endogenous hormones and nutrients in the seeds at the later stage of fruit development (Table 4). At the oil conversion period (260–300 DAFB), IAA and ABA were positively correlated with oil content (0.520 and 0.717, respectively), whereas soluble sugar content was negatively correlated with IAA (−0.519). During the fruit ripening period, ABA was positively correlated with oil and soluble protein content (0.909 and 0.773, respectively). In contrast to ABA, IAA showed a negative correlation with oil and soluble protein content (−0.944 and −0.902, respectively).

4. Discussion

Plant growth, development, and productivity primarily depend on photosynthates’ synthesis, transportation, and allocation [25]. Flower and fruit thinning reduces the loss of water and nutrients and enhances the transport of nutrients to flowers or fruits. Thus, thinning ensures a good supply of nutrients and effectively improves the quality of fruits [26,27]. In this study, thinning 40% and 60% C. oleifera flowers increased fruit set and promoted fruit growth, consistent with the findings by Choi et al. [28]. They found significantly faster grape growth under a 2 kg/m2 crop load than under 3 kg/m2 and 4 kg/m2. The fruit’s ability to compete for nutrients and the photosynthetic efficiency of leaves weaken with an excessive reduction in crop load [29]; therefore, fruit growth does not accelerate significantly with the continuous decrease in crop load. Haouari et al. showed that reducing the load induces fruit expansion and growth by accelerating cell division [10]. Similarly, the differences in fruit size and weight caused by different loads gradually increased with fruit development, especially during the rapid growth stage of C. oleifera fruits (190–230 DAFB). However, the differences in kernel percentage among the four treatments gradually increased with fruit development during the late development stage. We speculated that flower thinning increases the nutrient supply to the sink, provides sufficient nutrition for cell division, and promotes the expansion and growth of fruits. This expansion and growth of fruits may lay a foundation for the development of internal seeds [26]. Notably, low crop load treatments (T2 and T3) had significantly higher seed and kernel yield than that in high load treatments (T0 and T1).
Typically, an increase in soluble protein content, a decrease in soluble sugar content, and the accumulation of oil in the seed are closely related [30]. Studies have demonstrated a reduction in soluble sugar with oil synthesis but an increase in soluble protein in Xanthoceras sorbifolia [31] and Idesia polycarpa [32]. In this study, the highest soluble sugar content in C. oleifera seeds was similar to the oil content in mature seeds. Nevertheless, the soluble protein content was far lower than sugar and oil content. This observation in C. oleifera seeds indicates that soluble sugar is likely the primary raw material for oil synthesis [33], and soluble protein is the main component of enzymes regulating metabolic activities [34]. A reduction in crop loads increased the oil content during oil accumulation, consistent with the observations in other plants [35]. Moreover, the reduction in crop loads corresponded with the increase in protein content and the decrease in sugar content during oil accumulation; however, low crop loads promoted soluble sugar accumulation during the fruit growth period, in agreement with the findings in olive [36] and jujube [37]. Thus, our results indicate that reducing crop loads to some extent (40% and 60% thinning) facilitates soluble sugar and protein accumulation in seeds during the growth period, providing sufficient raw materials and enzymes for the synthesis of oil compared with high crop loads; this resulted in higher oil content under low crop load [38].
In edible oils, the composition of fatty acids in oil is the main index affecting the quality of edible oils. For example, saturated fatty acids (SFA) such as palmitic acid (PA) have been shown to elevate blood cholesterol, atherosclerosis, and body obesity [39]; polyunsaturated fatty acids (PUFA) such as linoleic acid (LA) can improve immune function, but high levels of LA cause inflammation and tumors [40,41]. In addition, monounsaturated fatty acids (MUFA) such as oleic acid (OA) are safe fatty acids; they alleviate cardiovascular and cerebrovascular diseases [42]. In the whole oil conversion process, the main fatty acid component in C. oleifera seeds is OA, which reaches approximately 78% at the mature stage, followed by PA and LA, accounting for approximately 9% and 8.5%, respectively. Compared with other cooking oils, such as peanut oil (60% OA, 30% LA, and 9% PA) [43], sunflower oil (45% OA, 45% LA, and 6% PA) [44], and soybean oil (22% OA, 52% LA, and 12% PA) [45], the proportion of SFA, MUFA, and PUFA in tea oil is close to the ideal ratio of 1:6:1 proposed by international nutritionists [46]. Therefore, with respect to the fatty acid components, tea oil is an edible oil with high healthcare value. This theory is supported by Wu et al. [41] and Bumrungpert et al. [47], whose results suggest that MUFA-rich tea oil can reduce cardiovascular risk and blood cholesterol, compared with SFA-rich cooking oil. Flower thinning promoted oleic acid accumulation but inhibited palmitic acid, palmitoleic acid, linoleic acid, and linolenic acid accumulation, consistent with the dynamic changes in fatty acid components during the ripening of C. oleifera fruits [20]. Similar to the findings of Li et al. on plums, the reduction in crop load promoted accumulation of glucose and fructose in grapes [25,35]. Thus, our results suggest that flower thinning promotes the mutual transformation of saturated fatty acids into unsaturated fatty acids, thereby accelerating the ripening of C. oleifera fruit.
In plants, auxins (IAA) promote the expansion of pulp cells and the transportation of assimilates to fruits but inhibit the ripening of fruits [32,48]. Meanwhile, ABA plays an important role in regulating sugar unloading and fruit maturity [49,50,51,52,53]. In ‘Ganshi 83-4′ fruits, an increase in oil content is closely correlated with an increase in ABA in the late stage, excluding flower bud differentiation and maturity stages. The oil accumulation also corresponded with the rise in IAA content, consistent with the earlier findings in C. oleifera [7,23]. These observations suggest that IAA and ABA regulation in C. oleifera fruit is probably similar to that in other plants; both IAA and ABA are conducive to nutrient storage [53,54]. Studies have proven that fruit load affects hormone content, regulating fruit growth and development [37,41,42]. In this study, heavy flower thinning increased fruit IAA and ABA during the oil accumulation period but decreased the IAA content at fruit maturity. Moreover, ABA and IAA content were positively correlated with the content of oil and soluble proteins at the oil conversion period, while IAA content was negatively correlated with the content of oil and soluble proteins at fruit maturity. Therefore, we speculated that low crop load increases IAA and ABA content in seeds to produce more soluble proteins for enhancing oil synthesis. Studies have shown that a high concentration of ABA restrains IAA synthesis, and fruit ABA content increases with fruit maturity [55,56,57], hence the increase in ABA content with the decrease in IAA content under heavy flower thinning treatments at C. oleifera fruit maturity.
Fruit yield is an important index that affects the economic benefits of that year, and this index is mainly determined by fruit number and weight. Compared with no thinning treatment, 40% and 60% thinning of the initial flowers significantly reduced fruit yield per plant but considerably improved fruit quality, consistent with the results on peach [50], prunus [58], and olive [16] trees. In our study, thinning significantly decreased fruit yield per tree but increased the degree of unsaturation of oil, and did not substantially affect oil yield per plant; these observations indicated that flower thinning is beneficial to increasing fruit production efficiency. Excessive amounts of fruits consumed more carbohydrates during C. oleifera fruit development, reducing the nutrient supply to each fruit and decreasing the fruit quality [14]. Moreover, crop load per plant affects the growth and development of fruits and influences flowering in the following year, affecting the yield of fruit trees in the second year [15]. Flowering strongly affects endogenous hormones and nutritional conditions [59,60]. Jia et al. [61] showed that fruit development leads to a decrease in growth-promoting hormones and an increase in growth-inhibiting hormones in C. oleifera flower buds, increasing the number of differentiated flower buds on no-fruiting branches compared to fruiting branches. Xie et al. [14] and You et al. [62] proved that an increase in the fruit-bearing capacity of the tree corresponds with a decrease in tree nutrients; therefore, excessive fruit load reduces the number of flowers. Consistent with these earlier findings, our study showed that the flower bud rate of the following year increased with the reduction in flowers per tree. Our data suggest that reducing the number of flower buds did not decrease the fruit economic benefits of that year but stabilized fruit yield in the following year.

5. Conclusions

Heavy flower thinning (40% and 60% thinning) accelerated the growth and development of fruit, promoted the accumulation of soluble sugars, increased the proportion of soluble sugars converted into oil, and increased oil content in seeds and oleic acid relative content in oil; however, these treatments significantly reduced fruit set and yield per plant. Low crop loads (40% and 60% thinning) significantly increased ABA and IAA content during the oil accumulation period and promoted flower differentiation in the following year. The findings suggest that low crop loads promote soluble sugar and protein accumulation during fruit growth, and ABA and IAA regulate soluble sugar and protein during oil accumulation. Although decreasing the flower number of C. oleifera in the fruit harvest period will reduce yield per tree in the following year, it will not affect oil production per plant and improves fruit quality and flower bud rate. Therefore, in the flat C. oleifera forest area, the picking machinery with a flower bud damage rate of less than 60% can be applied to fruit harvesting. In other forestland where machinery is difficult to operate, trees with too many flowers or fruits should be appropriately thinned to promote the growth of fruits and improve fruit quality and yield.

Author Contributions

Conceptualization, S.S.; data curation, T.Y.; formal analysis, T.Y. and X.L. (Xiaojie Liang); investigation, T.Y.; software, X.Z. and Q.B.; writing—original draft preparation, T.Y. and X.L. (Xue Liu); writing—review and editing, T.Y. and S.S.; funding acquisition, S.S. All authors have read and agreed to the published version of the manuscript.

Funding

The research was funded by grants from the National Key Research and Development Program of China (Grant No. 2019YFD1002401).

Institutional Review Board Statement

Not applicable.

Informed Consent Statement

Not applicable.

Data Availability Statement

Not applicable.

Acknowledgments

The authors would like to extend their sincere appreciation to the Researcher Supporting Project number (Grant No. 2019YFD1002401), Key Laboratory of Beijing Forestry University.

Conflicts of Interest

The authors declare no conflict of interest.

References

  1. Quan, W.; Wang, A.; Gao, C.; Li, C. Applications of Chinese Camellia oleifera and Its By-Products: A Review. Front. Chem. 2022, 10, 921246. [Google Scholar] [CrossRef] [PubMed]
  2. Ma, J.; Ye, H.; Rui, Y.; Chen, G.; Zhang, N. Fatty Acid Composition of Camellia oleifera Oil. J. Verbrauch. Leb. 2011, 6, 9–12. [Google Scholar] [CrossRef]
  3. Perona, J.S.; Botham, K.M. Olive Oil as a Functional Food: Nutritional and Health Benefits. Handb. Olive Oil Anal. Prop. 2013, 60, 677–714. [Google Scholar] [CrossRef]
  4. Wang, X.; Zeng, Q.; Verardo, V.; Contreras, M.M. Fatty Acid and Sterol Composition of Tea Seed Oils: Their Comparison by the “FancyTiles” Approach. Food Chem. 2017, 233, 302–310. [Google Scholar] [CrossRef] [PubMed]
  5. Zeng, W.; Endo, Y. Effects of Cultivars and Geography in China on the Lipid Characteristics of Camellia oleifera Seeds. J. Oleo Sci. 2019, 68, 1051–1061. [Google Scholar] [CrossRef] [Green Version]
  6. Yan, F.; Li, X.; Huang, G.; Li, X. Camellia oleifera Fresh Fruit Harvesting in China. In Proceedings of the 2020 5th International Conference on Mechanical, Control and Computer Engineering (ICMCCE), Harbin, China, 25–27 December 2020; pp. 699–702. [Google Scholar] [CrossRef]
  7. Tang, Y.; Zhou, H.; Wang, H.; Zhang, Y. Fruit Detection and Positioning Technology for a Camellia oleifera. Abel Orchard Based on Improved YOLOv4-Tiny Model and Binocular Stereo Vision. Expert Syst. Appl. 2022, 211, 118573. [Google Scholar] [CrossRef]
  8. Wang, D.; Tang, J.Y.; Fan, Z.Y.; Qu, Z. Design and Test of a Vibratory Camellia oleifera Fruit Harvester. For. Mach. Woodwork. Equip. 2020, 48, 4–7. [Google Scholar] [CrossRef]
  9. Peifer, L.; Ottnad, S.; Kunz, A.; Damerow, L.; Blanke, M. Effect of Non-Chemical Crop Load Regulation on Apple Fruit Quality, Assessed by the DA-Meter. Sci. Hortic. 2018, 233, 526–531. [Google Scholar] [CrossRef]
  10. Haouari, A.; Van Labeke, M.C.; Steppe, K.; Mariem, F.B.; Braham, M.; Chaieb, M. Fruit Thinning Affects Photosynthetic Activity, Carbohydrate Levels, and Shoot and Fruit Development of Olive Trees Grown under Semiarid Conditions. Funct. Plant Biol. 2013, 40, 1179–1186. [Google Scholar] [CrossRef]
  11. Castro, D.C.; ÁLvarez, N.; Gabriel, P.; Micheloud, N.; Buyatti, M.; Gariglio, N. Crop Loading Studies on ‘Caricia’ and ‘Eva’ Apples Grown in a Mild Winter Area. Sci. Agric. 2015, 72, 237–244. [Google Scholar] [CrossRef] [Green Version]
  12. Celton, J.M.; Kelner, J.J.; Martinez, S.; Bechti, A.; Touhami, A.K.; James, M.J.; Durel, C.E.; Laurens, F.; Costes, E. Fruit Self-Thinning: A Trait to Consider for Genetic Improvement of Apple Tree. PLoS ONE 2014, 9, e91016. [Google Scholar] [CrossRef] [PubMed] [Green Version]
  13. Zeng, W.; Xie, S.; Huang, H.; Jiang, Z.; Wang, D. Fruit Dropping Regularity of Cenruan-3 Camellia oleifera and Dynamic Change of Nutrient Element Contents in Leaves. Sci. Guangxi For. 2020, 49, 42–48. [Google Scholar] [CrossRef]
  14. Xie, Y.; Yu, K.Q.; Yin, B.Q.; Wang, Z.H.; Li, L.H.; Cun, M. Comparative Analysis of Main Mineral Elements in Branches and Leaves of “On and Off-Year” Camellia oleifera. For. Invent. Plan. 2021, 46, 17–20. [Google Scholar]
  15. Beyá-marshall, V.; Fichet, T. Crop Load Regulates the next Season’s Crop Potential and Fruit Components in Frantoio Olive Trees (Olea europaea L.). Sci. Hortic. 2017, 215, 149–156. [Google Scholar] [CrossRef]
  16. Smith, H.M.; Samach, A. Constraints to Obtaining Consistent Annual Yields in Perennial Tree Crops. I: Heavy Fruit Load Dominates over Vegetative Growth. Plant Sci. 2013, 207, 158–167. [Google Scholar] [CrossRef]
  17. Wang, W.; Liang, Y.Y.; Quan, G.; Wang, X.; Xi, Z. Thinning of Cluster Improves Berry Composition and Sugar Accumulation in Syrah Grapes. Sci. Hortic. 2022, 297, 110966. [Google Scholar] [CrossRef]
  18. Piernas, J.; Giménez, M.J.; Noguera-Artiaga, L.; García-Pastor, M.E.; García-Martínez, S.; Zapata, P.J. Influence of Bunch Compactness and Berry Thinning Methods on Wine Grape Quality and Sensory Attributes of Wine in Vitis vinifera L. cv. ‘Monastrell’. Agronomy 2022, 12, 680. [Google Scholar] [CrossRef]
  19. Li, T.S.; Du, G.G.; Diao, S.F.; Han, W.J.; Fu, J.M.; Yang, S.B.; Li, F.D. Crop Load Influences the Components of Sugar, Acid and Flavor in Prunus domestica × Armeniaca ‘Weidi’. J. China Agric. Univ. 2017, 22, 39–48. [Google Scholar]
  20. Yuan, J.; Shi, B.; Wu, Z.L.; Tan, X.F. Response of Fruit Quality and Leaf Photosynthesis to Different Sink-Source Relationships in Camellia oleifera. Plant Physiol. J. 2015, 51, 1287–1292. [Google Scholar] [CrossRef]
  21. Song, Q.; Ji, K.; Mo, W.; Wang, L.; Chen, L.; Gao, L.; Gong, W.; Yuan, D. Dynamics of Sugars, Endogenous Hormones, and Oil Content during the Development of Camellia oleifera Fruit. Botany 2021, 99, 515–529. [Google Scholar] [CrossRef]
  22. Yang, C.; Liu, X.; Chen, Z.; Lin, Y.; Wang, S. Comparison of Oil Content and Fatty Acid Profile of Ten New Camellia oleifera Cultivars. J. Lipids 2016, 2016, 1–6. [Google Scholar] [CrossRef] [PubMed]
  23. Cao, Y.; Yao, X.; Ren, H.; Wang, K. Changes in Contents of Endogenous Hormones and Main Mineral Elements in Oil-Tea Camellia Fruit during Maturation. J. Beijing For. Univ. 2015, 37, 76–81. [Google Scholar]
  24. Xiao, A.H.; Chen, F.; Jia, Z.; Sang, Z.; Zhu, Z.; Ma, L.Y. Determination of 4 Plant Hormones in Magnolia wufengensis by Gradient Elution High Performance Liquid Chromatography. Chin. J. Anal. Lab. 2020, 39, 249–254. [Google Scholar]
  25. Ding, N.; Chen, Q.; Zhu, Z.; Peng, L.; Ge, S.; Jiang, Y. Effects of Crop Load on Distribution and Utilization of 13C and 15N and Fruit Quality for Dwarf Apple Trees. Sci. Rep. 2017, 7, 14172. [Google Scholar] [CrossRef] [PubMed] [Green Version]
  26. Mészáros, M.; Hnátková, H.; Čonka, P.; Náměstek, J. Linking Mineral Nutrition and Fruit Quality to Growth Intensity and Crop Load in Apple. Agronomy 2021, 11, 506. [Google Scholar] [CrossRef]
  27. Fernández, F.J.; Ladux, J.L.; Hammami, S.B.M.; Rapoport, H.F.; Searles, P.S. Fruit, Mesocarp, and Endocarp Responses to Crop Load and to Different Estimates of Source: Sink Ratio in Olive (cv. Arauco) at Final Harvest. Sci. Hortic. 2018, 234, 49–57. [Google Scholar] [CrossRef]
  28. Choi, K.O.; Im, D.; Park, S.J.; Lee, D.H.; Kim, S.J.; Hur, Y.Y. Effects of Berry Thinning on the Physicochemical, Aromatic, and Sensory Properties of Shine Muscat Grapes. Horticulturae 2021, 7, 487. [Google Scholar] [CrossRef]
  29. Delgado, J.A.; Obis, E.; Yuste, V. Effects of Fruit Thinning on Fruit and Seed Features of Cistus Ladanifer. Plant Ecol. 2010, 211, 297–303. [Google Scholar] [CrossRef]
  30. Lemoine, R.; La Camera, S.; Atanassova, R.; Dédaldéchamp, F.; Allario, T.; Pourtau, N.; Bonnemain, J.L.; Laloi, M.; Coutos-Thévenot, P.; Maurousset, L. Source-to-Sink Transport of Sugar and Regulation by Environmental Factors. Front. Plant Sci. 2013, 4, 1–21. [Google Scholar] [CrossRef] [Green Version]
  31. Zhao, N.; Zhang, Y.; Wang, J.; Liu, X.; Zhao, C. Seed Development Lipid Accumulation and Its Relationship with Carbohydrates and Protein in Xanthoceras Sorbifolia Bunge. Bull. Bot. Res. 2015, 35, 140–145. [Google Scholar]
  32. Fang, L.S.; Liu, Z.; Liu, Z.; Geng, X.D.; Cai, Q.W.; Zhai, W.J.; Zhou, H. Changes of Contents Endogenous Hormones and Photosynthetic Characteristics of Idesia polocarpa Fruit at Different Developmental. Sci. Silvae Sin. 2020, 56, 41–45. [Google Scholar]
  33. Zhang, L.Y.; Wang, X.Y.; Cao, Y.B. Analysis on the Relationship between Sugar Content, Metabolism Related Enzyme Activity and Oil Accumulation in Camellia oleifera Fruits. J. Beijing For. Univ. 2013, 35, 18–23. [Google Scholar]
  34. King, S.P.; Lunn, J.E.; Furbank, R.T. Carbohydrate Content and Enzyme Metabolism in Developing Canola siliques. Plant Physiol. 1997, 114, 153–160. [Google Scholar] [CrossRef] [PubMed] [Green Version]
  35. Shi, Y.; Jiang, L.; Zhang, L.; Kang, R.; Yu, Z. Dynamic Changes in Proteins during Apple (Malus x Domestica) Fruit Ripening and Storage. Horti. Res. 2014, 1, 1–21. [Google Scholar] [CrossRef] [PubMed] [Green Version]
  36. Yang, L.; Wu, M.C.; Hu, H.T.; Yang, L. Proteomic Analysis of Up-Accumulated Proteins Associated with Fruit Quality during Autumn Olive (Elaeagnus umbellata) Fruit Ripening. J. Agric. Food Chem. 2011, 59, 577–583. [Google Scholar] [CrossRef]
  37. Leng, X.M.; Wang, D. Changes of Soluble Sugar and Protein Contents in Different Parts of Jin jiujuble in North Shananxi. J. Northwest For. Univ. 2019, 105–108. [Google Scholar]
  38. Shi, T.; Wu, G.; Jin, Q.; Wang, X. Camellia Oil Authentication: A Comparative Analysis and Recent Analytical Techniques Developed for Its Assessment. A Review. Trends Food Sci. Technol. 2020, 97, 88–99. [Google Scholar] [CrossRef]
  39. Micha, R.; Darisush, M. Saturated Fat and Cardiomentabolic Risk Factors, Coronary Heart Disease, Stroke and Diabetes: A Fresh Look at the Evidence. Lipids 2010, 45, 893–905. [Google Scholar] [CrossRef] [Green Version]
  40. Gottrand, F. Polyunsaturated Fatty Acids and Immunity. Arch. Pediatr. 2007, 14, 5–7. [Google Scholar] [CrossRef]
  41. Wu, M.Y.; Du, M.H.; Wen, H.; Wang, W.Q.; Tang, J.; Shen, L.R. Effects of N-6 PUFA-Rich Soybean Oil, MUFA-Rich Olive Oil and Camellia Seed Oil on Weight and Cardiometabolic Profiles among Chinese Women: A 3-Month Double-Blind Randomized Controlled-Feeding Trial. Food Funct. 2022, 13, 4375–4383. [Google Scholar] [CrossRef]
  42. Joris, P.J.; Mensink, R.P. Role of Cis-Monounsaturated Fatty Acids in the Prevention of Coronary Heart Disease. Curr. Atheroscler. Rep. 2016, 18, 38. [Google Scholar] [CrossRef] [PubMed] [Green Version]
  43. Shokri, Z.; Ashouri, M.; Doroudian, H.R.; Roshan, N.M.; Sadeghi, S.M. Evaluating the Yield, Fatty Acid Composition, and the Seed Micronutrients Content in Peanut Cultivars under the Influence of Various Rates of Sulfur and Zinc Application. J. Nuts 2022, 13, 183–197. [Google Scholar] [CrossRef]
  44. Harun, M. Fatty Acid Composition of Sunflower in 31 Inbreed and 28 Hybrid. Biomed. J. Sci. Tech. Res. 2019, 16, 12032–12038. [Google Scholar] [CrossRef]
  45. Abdelghany, A.M.; Zhang, S.; Azam, M.; Shaibu, A.S.; Feng, Y.; Li, Y.; Tian, Y.; Hong, H.; Li, B.; Sun, J. Profiling of Seed Fatty Acid Composition in 1025 Chinese Soybean Accessions from Diverse Ecoregions. Crop J. 2020, 8, 635–644. [Google Scholar] [CrossRef]
  46. Orsavova, J.; Misurcova, L.; Vavra Ambrozova, J.; Vicha, R.; Mlcek, J. Fatty Acids Composition of Vegetable Oils and Its Contribution to Dietary Energy Intake and Dependence of Cardiovascular Mortality on Dietary Intake of Fatty Acids. Int. J. Mol. Sci. 2015, 16, 12871–12890. [Google Scholar] [CrossRef]
  47. Bumrungpert, A.; Pavadhgul, P.; Kalpravidh, R.W. Camellia Oil-Enriched Diet Attenuates Oxidative Stress and Inflammatory Markers in Hypercholesterolemic Subjects. J. Med. Food 2016, 19, 895–898. [Google Scholar] [CrossRef]
  48. Kou, X.; Feng, Y.; Yuan, S.; Zhao, X.; Wu, C.; Wang, C.; Xue, Z. Different Regulatory Mechanisms of Plant Hormones in the Ripening of Climacteric and Non—Climacteric Fruits: A Review. Plant Mol. Biol. 2021, 107, 477–497. [Google Scholar] [CrossRef]
  49. Zhang, A.; Xu, Y.; Pan, H.; Zhang, J.; Gao, Z.; Shu, B.; Guo, C. Dynamic Changes of Endogenous Hormone Content in Dangshansu Pear during Fruit Development. Agric. Sci. Technol. 2011, 12, 940–942. [Google Scholar] [CrossRef]
  50. Sutton, M.; Doyle, J.; Chavez, D.; Malladi, A. Optimizing Fruit-Thinning Strategies in Peach (Prunus persica) Production. Horticulturae 2020, 6, 41. [Google Scholar] [CrossRef]
  51. Ren, J.; Chen, P.; Dai, S.J.; Li, P.; Li, Q.; Ji, K.; Wang, Y.P.; Leng, P. Role of Abscisic Acid and Ethylene in Sweet Cherry Fruit Maturation: Molecular Aspects. N. Z. J. Crop Hortic. Sci. 2011, 39, 161–174. [Google Scholar] [CrossRef]
  52. Luo, Y.; Ge, C.; Ling, Y.; Mo, F.; Yang, M.; Jiang, L.; Chen, Q.; Lin, Y.; Sun, B.; Zhang, Y. ABA and Sucrose Co-Regulate Strawberry Fruit Ripening and Show Inhibition of Glycolysis. Mol. Genet. Genom. 2020, 295, 421–438. [Google Scholar] [CrossRef] [PubMed]
  53. Romero, P.; Lafuente, M.T. Abscisic Acid Deficiency Alters Epicuticular Wax Metabolism and Morphology That Leads to Increased Cuticle Permeability during Sweet Orange (Citrus sinensis) Fruit Ripening. Front. Plant Sci. 2020, 11, 594184. [Google Scholar] [CrossRef] [PubMed]
  54. Böttcher, C.; Boss, P.K.; Davies, C. Delaying Riesling Grape Berry Ripening with a Synthetic Auxin Affects Malic Acid Metabolism and Sugar Accumulation, and Alters Wine Sensory Characters. Funct. Plant Biol. 2012, 39, 745–753. [Google Scholar] [CrossRef] [PubMed]
  55. Liang, B.; Sun, Y.; Li, Z.; Zhang, X.; Yin, B.; Zhou, S.; Xu, J. Crop Load Influences Growth and Hormone Changes in the Roots of “Red Fuji” Apple. Front. Plant Sci. 2020, 11, 665. [Google Scholar] [CrossRef] [PubMed]
  56. Mcatee, P.; Karim, S.; Schaffer, R.; David, K. A Dynamic Interplay between Phytohormones Is Required for Fruit Development, Maturation, and Ripening. Front. Plant Sci. 2013, 4, 79. [Google Scholar] [CrossRef] [PubMed] [Green Version]
  57. Niu, J.; Wang, J.; An, J.; Liu, L.; Lin, Z.; Wang, R.; Wang, L.; Ma, C.; Shi, L.; Lin, S. Integrated MRNA and MiRNA Transcriptome Reveal a Cross-Talk between Developing Response and Hormone Signaling for the Seed Kernels of Siberian Apricot. Sci. Rep. 2016, 6, 35675. [Google Scholar] [CrossRef] [PubMed] [Green Version]
  58. Seehuber, C.; Damerow, L.; Blanke, M. Regulation of Source: Sink Relationship, Fruit Set, Fruit Growth and Fruit Quality in European Plum (Prunus domestica L.)—Using Thinning for Crop Load Management. Plant Growth Regul. 2011, 65, 335–341. [Google Scholar] [CrossRef]
  59. Hehnen, D.; Hanrahan, I.; Lewis, K.; Mcferson, J.; Blanke, M. Mechanical Flower Thinning Improves Fruit Quality of Apples and Promotes Consistent Bearing. Sci. Hortic. 2012, 134, 241–244. [Google Scholar] [CrossRef]
  60. Samant, A.P.; Warang, O.S.; Kulkarni, M.M.; Bhuwad, A.V.; Bhingarde, R.T.; Salvi, B.R.; Haldankar, P.M.; Parulekar, Y.R. Relationship between Plant Canopy Volume, Leaf Area Index and Yield in Mango (Mangifera indica L.) cv. Alphonso. Int. J. Curr. Microbiol. Appl. Sci. 2021, 11, 859–863. [Google Scholar]
  61. Jia, T.T.; Su, S.; Ma, L.Y.; Su, Q.W. Effects of Different Sink Source Relationships on Flower Bud Differentiation of Camellia oleifera. J. Northeast For. Univ. 2018, 46, 19–23. [Google Scholar] [CrossRef]
  62. You, L.; Yu, S.; Liu, H.; Wang, C.; Zhou, Z.; Zhang, L.; Hu, D. Effects of Biogas Slurry Fertilization on Fruit Economic Traits and Soil Nutrients of Camellia oleifera Abel. PLoS ONE 2019, 14, e0208289. [Google Scholar] [CrossRef] [PubMed]
Figure 1. Changes in the transverse diameter (a), longitudinal diameter (b), weight (c), and moisture content (d) of C. oleifera fruits under different flower treatments from 190 days after full bloom (DAFB) to 320 DAFB. Treatments: T0, removed 0% of the tree flowers; T1, removed 20% of the tree flowers; T2, removed 40% of the tree flowers; T3, removed 60% of the tree flowers. Values represented are means ± S.E. (n = 3). Different lowercase English letters (a, b, c and d) in the graph indicate significant differences between treatments (p < 0.05).
Horticulturae 08 01077 g001
Figure 2. (a) Images of seeds and kernels at different fruit development stages: 190–230 days after full bloom (DAFB) (I), rapid fruit growth period; 240–300 DAFB (II), oil conversion period; 310–320 DAFB (III), fruit ripening period. The change in (b) fresh seed ratios (FSRF) and (c) dry kernel ratios of fruit (DKRF) under different flower load treatments from 190 to 320 DAFB. Treatments: T0, removed 0% of the tree flowers; T1, removed 20% of the tree flowers; T2, removed 40% of the tree flowers; T3, removed 60% of the tree flowers. Different lowercase English letters (a, b) in the graph indicate significant differences between treatments (p < 0.05).
Horticulturae 08 01077 g002
Figure 3. Changes in the (a) soluble sugar content (SSCSK), (b) soluble protein content (SPCSK), and (c) oil content (OCSK) of C. oleifera fruit seed kernel under different flower load treatments from 200 to 320 DAFB. Treatments: T0, removed 0% of the tree flowers; T1, removed 20% of the tree flowers; T2, removed 40% of the tree flowers; T3, removed 60% of the tree flowers. Different lowercase English letters (a, b and c) in the graph indicate significant differences between treatments (p < 0.05).
Horticulturae 08 01077 g003
Figure 4. Changes in the palmitic acid (PA (a)), stearic acid (SA (b)), palmitoleic acid (POA (c)), oleic acid (OA (d)), linoleic acid (LA (e)), and linolenic acid (LOA (f)) contents of C. oleifera fruit seed kernel under different flower bud load treatments from 240 days after full bloom (DAFB) to 320 DAFB. Treatments: T0, removed 0% of the tree flowers; T1, removed 20% of the tree flowers; T2, removed 40% of the tree flowers; T3, removed 60% of the tree flowers. Different lowercase English letters (a, b and c) in the graph indicate significant differences between treatments (p < 0.05).
Horticulturae 08 01077 g004
Figure 5. Changes in the endogenous hormones (a) abscisic acid (ABA) and (b) auxin (IAA) of C. oleifera fruit peel under different flower load treatments from 260 days after full bloom (DAFB) to 320 DAFB. Treatments: T0, removed 0% of the tree flowers; T1, removed 20% of the tree flowers; T2, removed 40% of the tree flowers; T3, removed 60% of the tree flowers. Values represent means ± S.E. (n = 3). Different lowercase English letters (a, b, c and d) in the graph indicate significant differences between treatments (p < 0.05).
Horticulturae 08 01077 g005
Table 1. Effect of flower numbers per tree on fruit set and flower bud differentiation rate in the following year of C. oleifera. Values shown are means ± S.E. (n = 4).
TreatmentFlower Number per TreeFruit NumbersFruit Set (%)Flower Bud Rate (%)
60 DAFB320 DAFB60 DAFB320 DAFB
T02350863 ± 54.5 a357 ± 8.2 a38.5 ± 0.3 a16.3 ± 1.1 a23.1 ± 1.8 a
T11800646 ± 47.9 b339 ± 15.8 a38.7 ± 1.2 a20.3 ± 1.5 ab25.3 ± 1.9 b
T21360537 ± 50.5 bc321 ± 12.4 b44.0 ± 2.3 b24.3 ± 2.4 bc28.8 ± 2.7 c
T3920435 ± 10.5 c293 ± 17 b47.0 ± 1.2 b28.0 ± 2.7 c33.3 ± 2.9 d
DAFB, days after full bloom. Treatments: T0, removed 0% of the tree flowers; T1, removed 20% of the tree flowers; T2, removed 40% of the tree flowers; T3, removed 60% of the tree flowers.Values represented are means ± S.E. (n = 3). Different lowercase English letters (a, b, c, d) in the graph indicate significant differences between treatments (p < 0.05).
Table 2. Correlation analysis of seed oil with soluble sugar and protein at different stages of fruit development.
Fruit Development StageOil and Soluble Sugar ContentOil and Soluble Protein
Rapid growth0.601 *0.458
Oil conversion stage−0.944 **0.553 *
Ripe stage−0.6970.872 **
* In the same line, * indicates a significant correlation at the 0.05 level, ** indicates a significant correlation at the 0.01 level.
Table 3. Fruit economic index at mature stage of different flower loads per plant treatment.
TreatmentsFruit Yield (kg/plant)Dry Kernel Yield (kg/plant)Kernel Oil Content (%)Oil Yield (kg/plant)Unsaturated Fatty Acids (%)
T014.64 ± 0.37 A2.23 ± 0.06 a46.95 ± 0.16 a1.05 ± 0.03 a88.17 ± 0.01 a
T114.49 ± 0.26 A2.26 ± 0.04 a47.95 ± 1.06 a1.09 ± 0.02 a88.39 ± 0.02 ab
T212.94 ± 0.63 B2.11 ± 0.11 ab48.16 ± 0.65 b1.03 ± 0.05 a88.45 ± 0.12 b
T310.53 ± 0.11 C1.97 ± 0.01 b48.95 ± 0.81 b0.96 ± 0.01 a88.71 ± 0.10 c
Different lowercase (a, b and c) or uppercase English (A, B and C) letters in the same line indicate significant differences between treatments (p < 0.05, or <0.01).
Table 4. Correlation coefficient between hormones and nutrient content of C. oleifera at oil conversion and fruit ripening stages.
FactorsOil Conversion PeriodFruit Ripening Period
OCPCSCOCPCSC
IAA0.520 *0.285−0.519 *−0.944 **−0.902 *0.676
ABA0.717 **0.388−0.3180.909 **0.773 *−0.689
* PC, soluble protein content; SC, soluble sugar content; OC, oil content. All data shown indicate the mean of three biological replicates; * and ** represent significant correlations at the 0.05 and 0.01 levels, respectively.
Publisher’s Note: MDPI stays neutral with regard to jurisdictional claims in published maps and institutional affiliations.

