Article

Screening of Morphophysiological, Anatomical, and Ultrastructural Traits to Improve the Elite Genotype Selection in Sugarcane (Saccharum officinarum L.)

by
Marcelo F. Pompelli
*,†,
Alfredo Jarma-Orozco
and
Luis Rodríguez-Páez
Regional Group of Participatory Research of the Small Producers of the Atlantic Coast, University of Cordoba, Montería 230003, Colombia
*
Author to whom correspondence should be addressed.
These authors contributed equally to this work.
Horticulturae 2022, 8(11), 1069; https://doi.org/10.3390/horticulturae8111069
Submission received: 10 September 2022 / Revised: 17 October 2022 / Accepted: 21 October 2022 / Published: 14 November 2022

Abstract

:
Sugarcane is a highly productive crop with high water requirements. In addition, its growth and sugar content are limited by the water deficit, a major problem affecting agriculture due to climate change. However, monitoring strategies are being developed worldwide that seek to increase productivity in the same area and with less water consumption. The sugarcane plants are produced sugar table, ethanol, and, from the hydrolysis of biomass, produce second-generation bioethanol, in addition to generating energy in thermoelectric plants. This research described the strategies and mechanisms used by sugarcane to tolerate water deficit. For this, a series of physiological, biochemical, enzymatic, morphological, anatomical, and ultrastructural analyses were developed. We used four commercial varieties of sugarcane, two tolerant and two sensitives, which were tested in all phases of the study. It was concluded that the variety RB92579 is drought tolerant as well as RB867515 and RB72454 genotype is sensitive to drought stress. Therefore, we proposed that variety RB855536 be assigned as an intermediary due to tolerance and sensitivity to water deficit.

Graphical Abstract

1. Introduction

Food and water are essential elements for human existence and, along with energy, are important for economic growth, poverty reduction, and social development. However, areas for food cultivation and energy-generating species are being depleted, with an increased risk due to global climate change, provoking abiotic stressors [1]. Water stress is very limiting to crop production, including sugarcane culture [2]. Moreover, it has been estimated that soil and water salinity is pervasive throughout the globe, reaching 20% of the total irrigated land area in the world [3].
Sugarcane (Saccharum spp.) is a widely known grass that stands out in world agriculture, mainly due to its participation in the production of table sugar (80% worldwide) and bioethanol (60% worldwide) [4]. In a recent paper, Zan et al. [4] studying 236 global accessions of sugarcane, described 39 accessions from Australia, 13 from Brazil, 81 from France, 30 from the Philippines, two from Cuba, one from Malaysia, 16 from the USA, three from Bangladesh, 14 from Mexico, five from the Republic of Sudan, two from India, and 30 from China. Sugarcane is cultivated in tropical and sub-tropical areas in over 100 countries covering ~27.1 million ha with a total harvest of 1.9 billion metric tons/year [5]. However, Cursi et al. [6] described that Brazil is the world’s largest producer of sugarcane, followed by India, China, Thailand, Pakistan, and Mexico, reducing the main production countries to six. In the last 40 years, the cultivation of sugarcane has made significant progress, thereby making Brazil a world leader in technologies for the production and processing of table sugar [6,7]. In accordance with Cursi et al. [5] revision, Brazil has 404 sugar, flex-ethanol, and distillery plants (sugarcane mills) and approximately 70,000 growers. These statements reveal that during the 2019–2020 crop year, 642.7 million tons of sugarcane were produced in Brazil in a harvest area of 8.44 million hectares. Currently, Brazil is the largest producer of sugarcane in the world, representing 39% of production and 45% of world exports [7]. So, according to the Organization for Economic Co-operation and Development-Food and Agriculture Organization (OECDFAO) Agricultural Panorama 2019–2028, Brazil will continue to be the primary sugar and sugarcane-based ethanol producer in the coming decade [8]. Due to human population growth and dwindling fossil-fuel reserves, the demand for sugar and bioethanol requires significant improvement in sugarcane production [4]. From 2021 to 2022, Brazil harvested 578.77 thousand tons of sugarcane and is expected to be harvested 2022/2023 572,875 thousand tons of sugarcane with an expected decrease of 1% in 2022 when compared to the 2021 harvest [8,9,10]. It is expected to produce 33.89 thousand tons of sugar and another 25.387 thousand liters of total bioethanol. Only in the northeast region, it was expected to produce 54.107 thousand tons of sugarcane (9.4% Brazilian harvest), from which approximately 3.08 thousand tons of sugar (9.1%) and 2,073,078 thousand liters of total bioethanol (8.01%). In absolute values this means denote of 55,929.16 and 68,492.42 million dollars, respectively to 2021 and estimation for 2022 [9]. It should be noted that the northeast region has low productivity per planted area compared to other regions of the country [9], which emphasizes the need to increase productivity in this region. Increased productivity, in general, is attributed to the development and widespread use of improved cultivars with increased resistance to stress conditions and better management of water and nutrients [7].
Brasileiro et al. [11] describe that commercial sugarcane varieties currently cultivated came from plant breeding, carried out in the late nineteenth century, among species of the genus Saccharum. Modern sugarcane genotypes are derived from inter-specific hybridization between S. spontaneum (2n = 40–128, x = 8) and S. officinarum (2n = 80, x = 10) followed by several backcrosses with S. officinarum [4,11,12]. S. officinarum transmits high sucrose content and suitable grinding characteristics, while S. spontaneum contributes physiological characteristics that allow hybrids to be cultivated in diverse environments and less susceptible to abiotic and biotic stress [13].
Supporting the increased demand for sugar and alcohol production, new varieties of Saccharum are widely needed [14]. In the process of obtaining new varieties, crosses between superior individuals are carried out to select elite genotypes that present advantageous characteristics in agroindustrial productivity and tolerance to the main stresses, e.g., pests, diseases, drought, frost, and salinity. The genetic improvement in sugarcane varieties aims to continuously increase productivity, improve adaptation to climate variations and types of soil, as well as save water and land, with strong positive impacts on the environment. Based on these indicators, the sugarcane industry is being remodeled to improve its profitability by reducing costs and increasing productivity through greater production of sugar and alcohol [7]. In this sense, the production of drought-tolerant varieties has driven the need for studies involving the biological, physiological, and anatomical aspects of these varieties. Thus, the main goals of this study were the identification of physiological, morphological, and anatomical variations in sugarcane cultivated at two distinct natural water regimes. These characteristics enable us to identify the differences correlated with the mechanisms of gas exchange and hydraulic conductivity in different varieties tolerant- and sensitive-like to water deficit of sugarcane. This study should act as a guide to understand how such changes have improved the performance of new drought-tolerant sugarcane varieties.

2. Materials and Methods

2.1. Study Area and Sugarcane Varieties

This study was carried out at Santa Izabel Farm (9°46′47″ S, 36°21′2″ W; 130 m. asl.) in Campo Alegre City, Alagoas State, Brazil, from June to December 2020. The average annual rainfall in the region is 1254 ± 359 mm, with May to July being the wettest months (208 mm months−1) and November to December the driest months (27 mm months−1) [15]. The historical data and precipitation for 2020 were obtained from the Meteorological Station of Campo Alegre—AL, available in Proclima [15] (more details in Supplementary File S1), while the temperature, relative humidity, and global radiation data were obtained from the Meteorological Station of Arapiraca (~40 km away), available from INMET [16]. In accordance with the Köppen classification [17], the climate is considered to have As. In this region, the De-Martone aridity index [ ( P T + 10 ) , where P denote annual accumulated rainfall and T annual mean temperature] is 37.4, denoting a winter cloudy and rainy and dry summer.
As shown in Table 1, the tolerant-like (RB92579 and RB867515) and sensitive-like (RB855536 and RB72454) variables to water deficit were planted on the Santa Isabel Farm, in a commercial cultivation area of about 38 m × 30 m where eight sample plots were installed, each presenting 8 m long and 5 m wide. All culture techniques applied to the crop were the standard techniques required for sugarcane grown in the field adapted to Brazilian climatic conditions. Mature (at least 9 months) ratoon sugarcane plants (S. officinarum) i.e., sugarcane from the second year of production (2nd cycle) of the same individual, were randomly (as a bingo ball) selected for this study.
Pearson’s correlation coefficient was used to examine the relationships among variables. The similarity between groups of data was calculated using an adjusted r coefficient through Sigmaplot 14.0 (Systat Software, Inc., San Jose, CA, USA). The diagram with true and false colors was constructed in Excel 360 for Windows® as a scale color.

2.2. Leaf Water Potential Measurements (Ψw)

Nine-month sugarcane plants of each variety were selected for this study. The leaf water potential (Ψw) measurements were performed using a Scholander-type pressure chamber (PMS-615D Pressure Chamber, PMS Instrument Company, Albany, OR, USA). The measurements were carried out at predawn (4:00 a.m.) and at midday (12:00 p.m.) using the +3 attached fully expanded leaf from the apex of each variety.

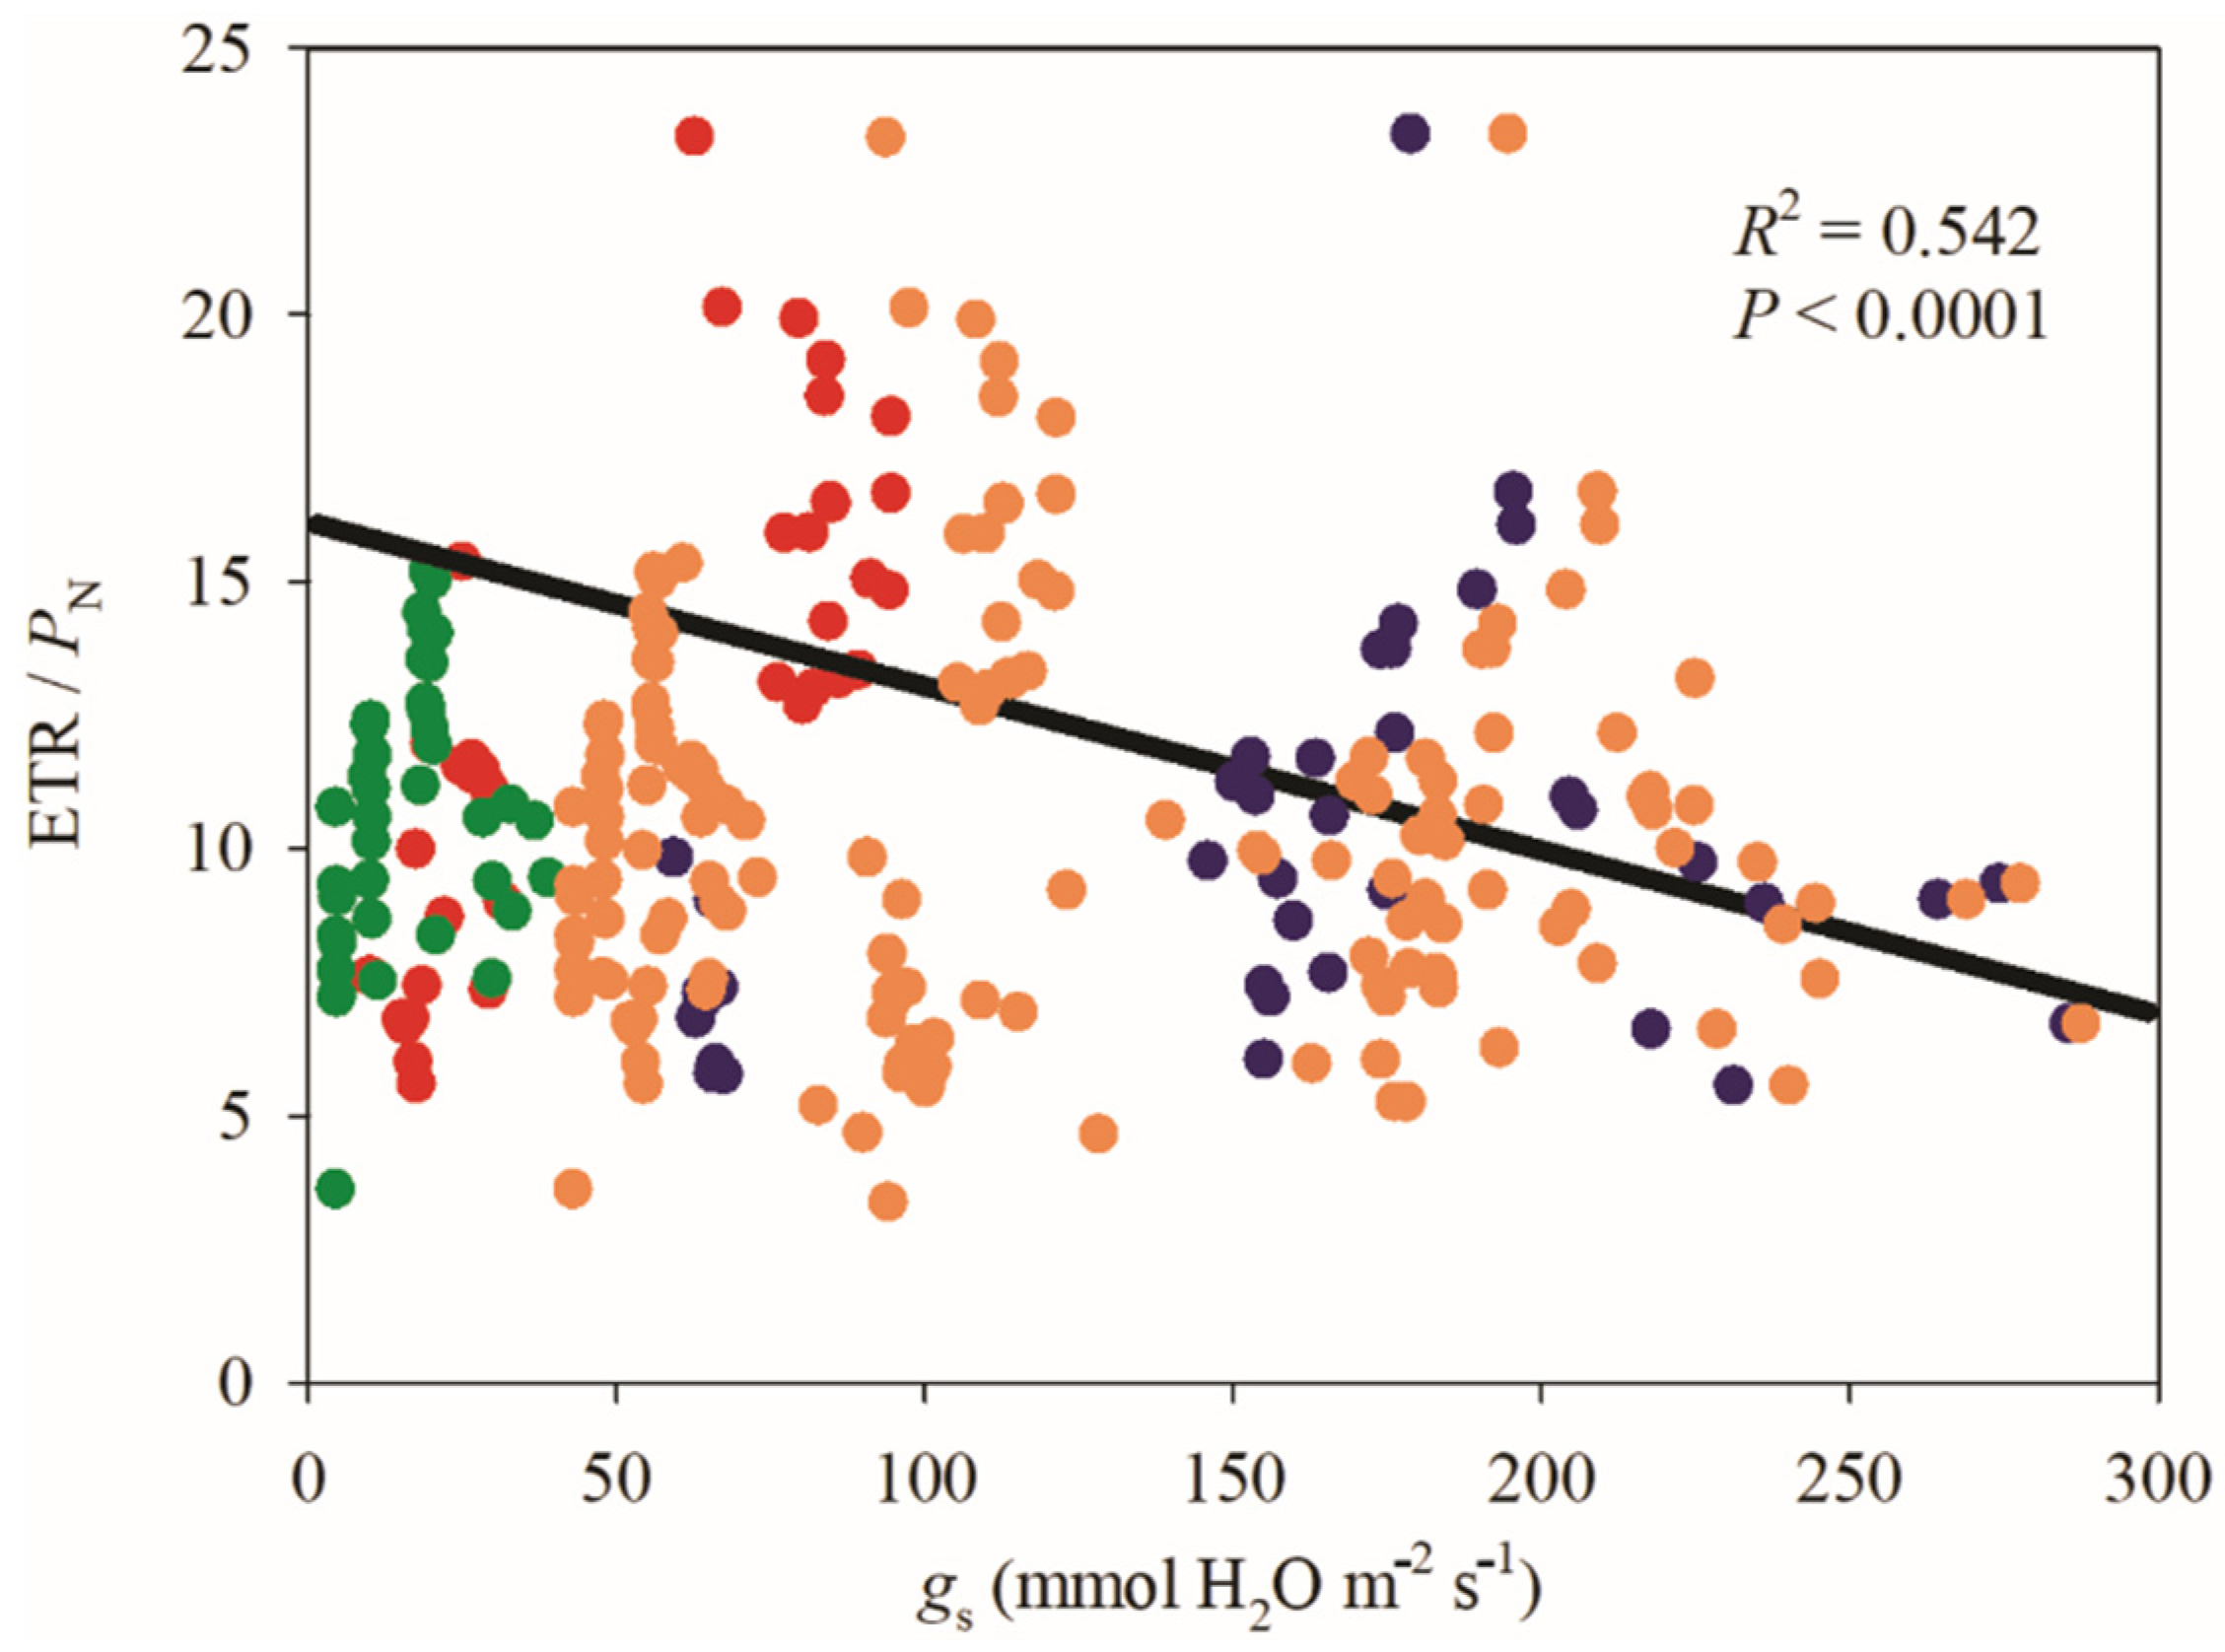
2.3. Leaf Gas Exchange Parameters and Chlorophyll a Fluorescence

The leaf gas exchange and chlorophyll a fluorescence was determined on the +3 attached fully expanded leaf from the apex, using a portable open-flow infrared gas analyzer (LI-6400XT; LI-COR Inc., Lincoln, NE, USA) integrated fluorescence chamber heads (LI-157 6400-40; LI-COR Inc.). The net photosynthesis (PN, μmol CO2 m−2 s−1), stomatal conductance (gs, mmol H2O m−2 s−1), transpiration (E, mmol H2O m−2 s−1), leaf temperature (Tleaf, °C), vapor pressure deficit (VPD, kPa), and internal CO2 concentration (Ci, μmol CO2 mol−1) were obtained in rapid growth phase without flowering S. officinarum plants on July 2014 and December 2014. Two solar time (08:00–10:00 h; early morning; EM and 11:00–13:00 h; midday; MD) were evaluated. All analysis was under a clear sky and leaf irradiance of saturation of 1000 μmol photons m−2 s−1, fixed CO2 concentration in 390 μmol mol−1 and airflow of 400 μmol s−1 [18]. The fluorescence analysis was carried out as described by Pompelli et al. [19]. With these parameters the intrinsic water use efficiency (PN/gs; WUEi), electron transport rate/photosynthesis ratio (ETR/PN) were calculated. The leaf hydraulic conductance (KL, mmol H2O m−2 s−1 MPa−1) was calculated using Ψwpredawn to approximate soil water potential, and gs and VPD were measured at the same time as Ψwmidday according to Dos Santos et al. [20].
Table 1. Variety, origin, commercial availability, progenitors, and main characteristics of four varieties (RB92579, RB867515, RB855536, and RB72454) of sugarcane.
VarietyOriginCommercial AvailabilityFatherMotherMain Characteristics
RB92579Alagoas State2003RB72199RB75126Tall size, but with low growth rate. Higher responsive to irrigation and very efficient in water use, with suitable recovery after drought periods. High agroindustrial productivity, reaching more than 35% of the sugarcane area in the northeast between 2010 and 2015. It improved sugarcane productivity in the northeast region, with yields increasing up to 60% above previously cultivated varieties. Low growth rate, medium-late maturation, long period of industrialization. High sucrose level and medium fiber content. Very resistance to water deficit.
RB867515Minas Gerais State1997RandomRB72454High agroindustrial productivity. Intermediate growth rate, tall size. The root zone is medium width, without aerial rooting. Best performance in light textured soils and medium fertility. Medium period of industrialization. Medium-late maturation, high sucrose content, and median fiber content. Very resistance to water deficit.
RB855536São Paulo State1998SP70-1143RB72454High agricultural productivity. High growth rate, medium sized, medium-late maturation. Median period of industrialization. Median-High sucrose content and medium fiber content. Sensitive to water deficit.
RB72454Alagoas State1982RandomCP53-76High agricultural productivity in any type of soil, but the greatest emphasis is on light textured soils and in less fertile soils. Tall size, medium-late maturation. Long period of industrialization. High sucrose content and medium fiber content. Sensitive to water deficit.
Source: Ridesa [21], Júnior [22], and Diniz et al. [23].

2.4. Sap Flow Measurements

The driving force, which drives sap ascent in the xylem (SAP flow velocity) was measured with heat dissipation sensors (Heat Pulse Velocity, Dual Method Approach, Implexx Sap Flow Sensor, Moorabbin, Australia) connected to an internal datalogger (Implexx Sap Flow Datalogging, Moorabbin, Australia). The measurements were carried out for 24 h in open field cultivated sugarcane plants (from 5:30 p.m. to 4:30 p.m.; +1) in on 20 July 2020, and 17 December 2020, to characterize the pattern of sap flow over 24 h in two extreme rainfall regimes.

2.5. Biochemical and Enzymes Activity Measurements

For biochemical and enzyme measurements, the +3 leaf fragments were collected around 10:00 a.m., immediately immersed in liquid nitrogen, and stored in the freezer (−20 °C) until used. The extraction of all biochemical compounds and the enzyme activity from the tissues was thoroughly ground with a cold mortar and pestle in an ice bath, plus 0.1 g of the sand river to improve the extraction until no fibrous residue could be seen. Chlorophyll a + b and total carotenoids were extracted with 80% (v/v) aqueous acetone and quantified spectrophotometrically [24]. Quantification of total free amino acids and protein contents of crude extracts were determined using the Moore and Stein [25] and Bradford [26] methods, respectively. To measure the superoxide dismutase (SOD; EC 1.1.5.1.1), catalase (CAT; EC 1.11.1.6), ascorbate peroxidase (APX; EC 1.11.1.11) and malondialdehyde (MDA) analysis was carried out in accordance with Pompelli et al. [27]. The proline concentration was determined via the method of Bates et al. [28] with fine adjustment described in Mendes et al. [29].
Plant height was measured from the soil surface to the highest point of insertion of the leaves using a metric tape attached to a broomstick. The stalk diameter was measured at 50 cm above the plant base through a pachymeter (Electronic Digital Vernier Caliper, Stainless Steel Caliper 150 mm/0–6 inch). The leaf area was measured using the allometric equations proposed by triticale as a gramineous plant-like [30].
For optical anatomical measurements, +3 leaf fragments were collected at around 10:00 a.m. and fixed in FAA50 for 48 h and then kept in 70% (v/v) ethanol [31] until use. All steps from FAA fixed to optical photomicrograph as described in detail in Pompelli et al. [32]. For scanning electron microscopy (SEM) measurements, the +3 leaf fragments were collected around 10:00 a.m. and immediately fixed in Karnovsky solution [33], prepared in 0.1 M cacodylate buffer (sodium cacodylate trihydrate, Sigma Aldrich, St. Louis, MO, USA), pH 7.4 and 2.5% glutaraldehyde (part number G5882, Sigma Aldrich) for 60 h at 4 °C. Thereupon the leaf fragments were dehydrated in an ethanol series (10–100%), subjected to a critical point with carbon dioxide (CPD 030, Critical Point Dryer, Bal-tec, Balzers, Liechtenstein, German), mounted on metallic supports (stubs) and metallized with gold, for analysis in the scanning electron microscope (Zeiss Leo 1530, ETH Zurich, Zurich, Switzerland). Stomatal density (SD) was measured by using Salisbury equations [34] with modifications proposed by Pompelli et al. [19]. However, stomatal area and stomatal pore aperture measurements were performed using SEM photomicrograph. For stomatal, counting was taken into an SEM photomicrograph with at least 20 replicates per treatment and leaf surface (adaxial and abaxial), using Image-Pro Plus® software 4.0 (Media Cybernetics, Silver Spring, MD, USA). The stomata per micrograph were converted to stomata mm−2. To measure the stomata aperture, we measured the ostiole in equatorial aperture using Image-Pro Plus software.

2.6. Plasticity Index

Differences in the plasticity index associated with physiological, biochemical, enzymatical, anatomical, and ultrastructure ranging from 0 (no plasticity) to 1 (maximal plasticity), were calculated as described in Dos Santos et al. [35].

2.7. Statistical Procedures

The experiments were conducted in a completely randomized block design with four sugarcane varieties (RB92579, RB867515, RB855536, and RB72454), two rainfall regimes (2020, July—rainy season and 2020, December—dry season), and two solar times (08:00–10:00 h and 11:00–13:00 h), with 10 replicates. First, all the data were evaluated for normality using the Shapiro–Wilk test, and homogeneity of variance was tested with a Brown–Forsyth test. All data were analyzed by two-way ANOVA, and means were compared using an SNK test (p < 0.05) by Sigmaplot 14.0.

3. Results

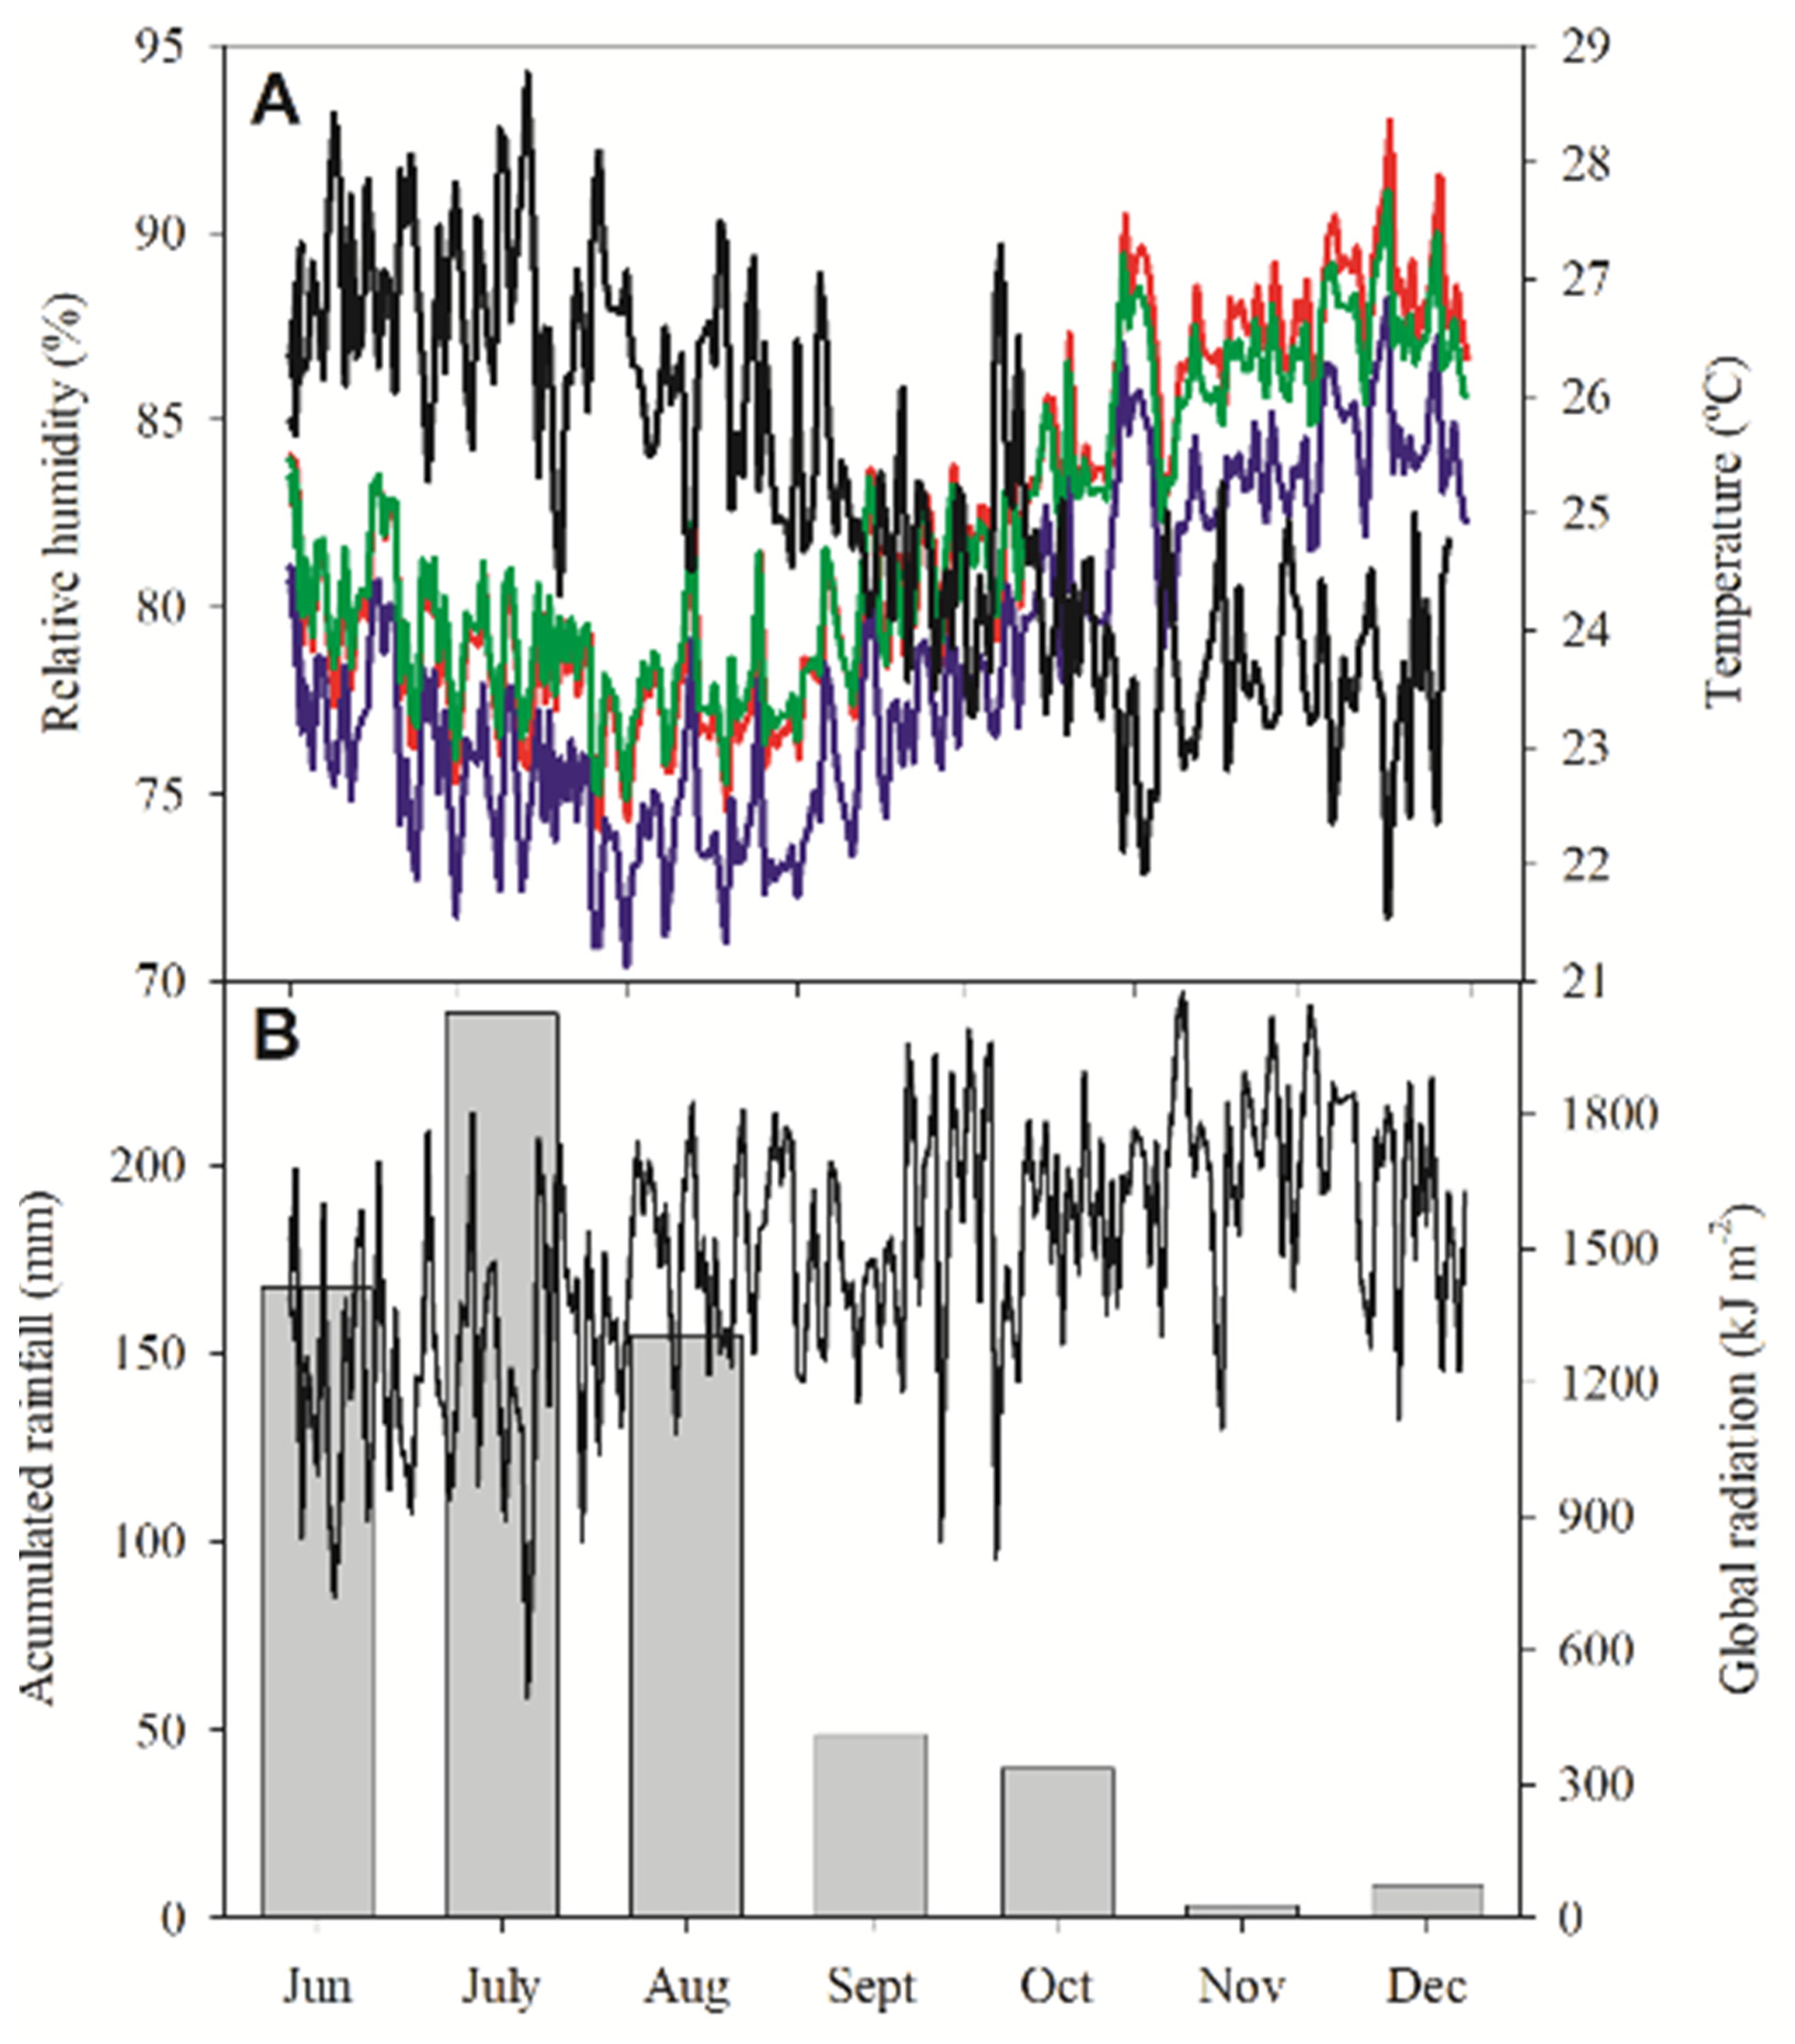
3.1. Climatological Data

According to Figure 1, the accumulation rainfall in 2020 (Jan to December) was 1257 mm. The rainfall tendency was followed by the temperature variation, where the rainy months recorded the lowest temperatures, while the driest months recorded the highest temperature.

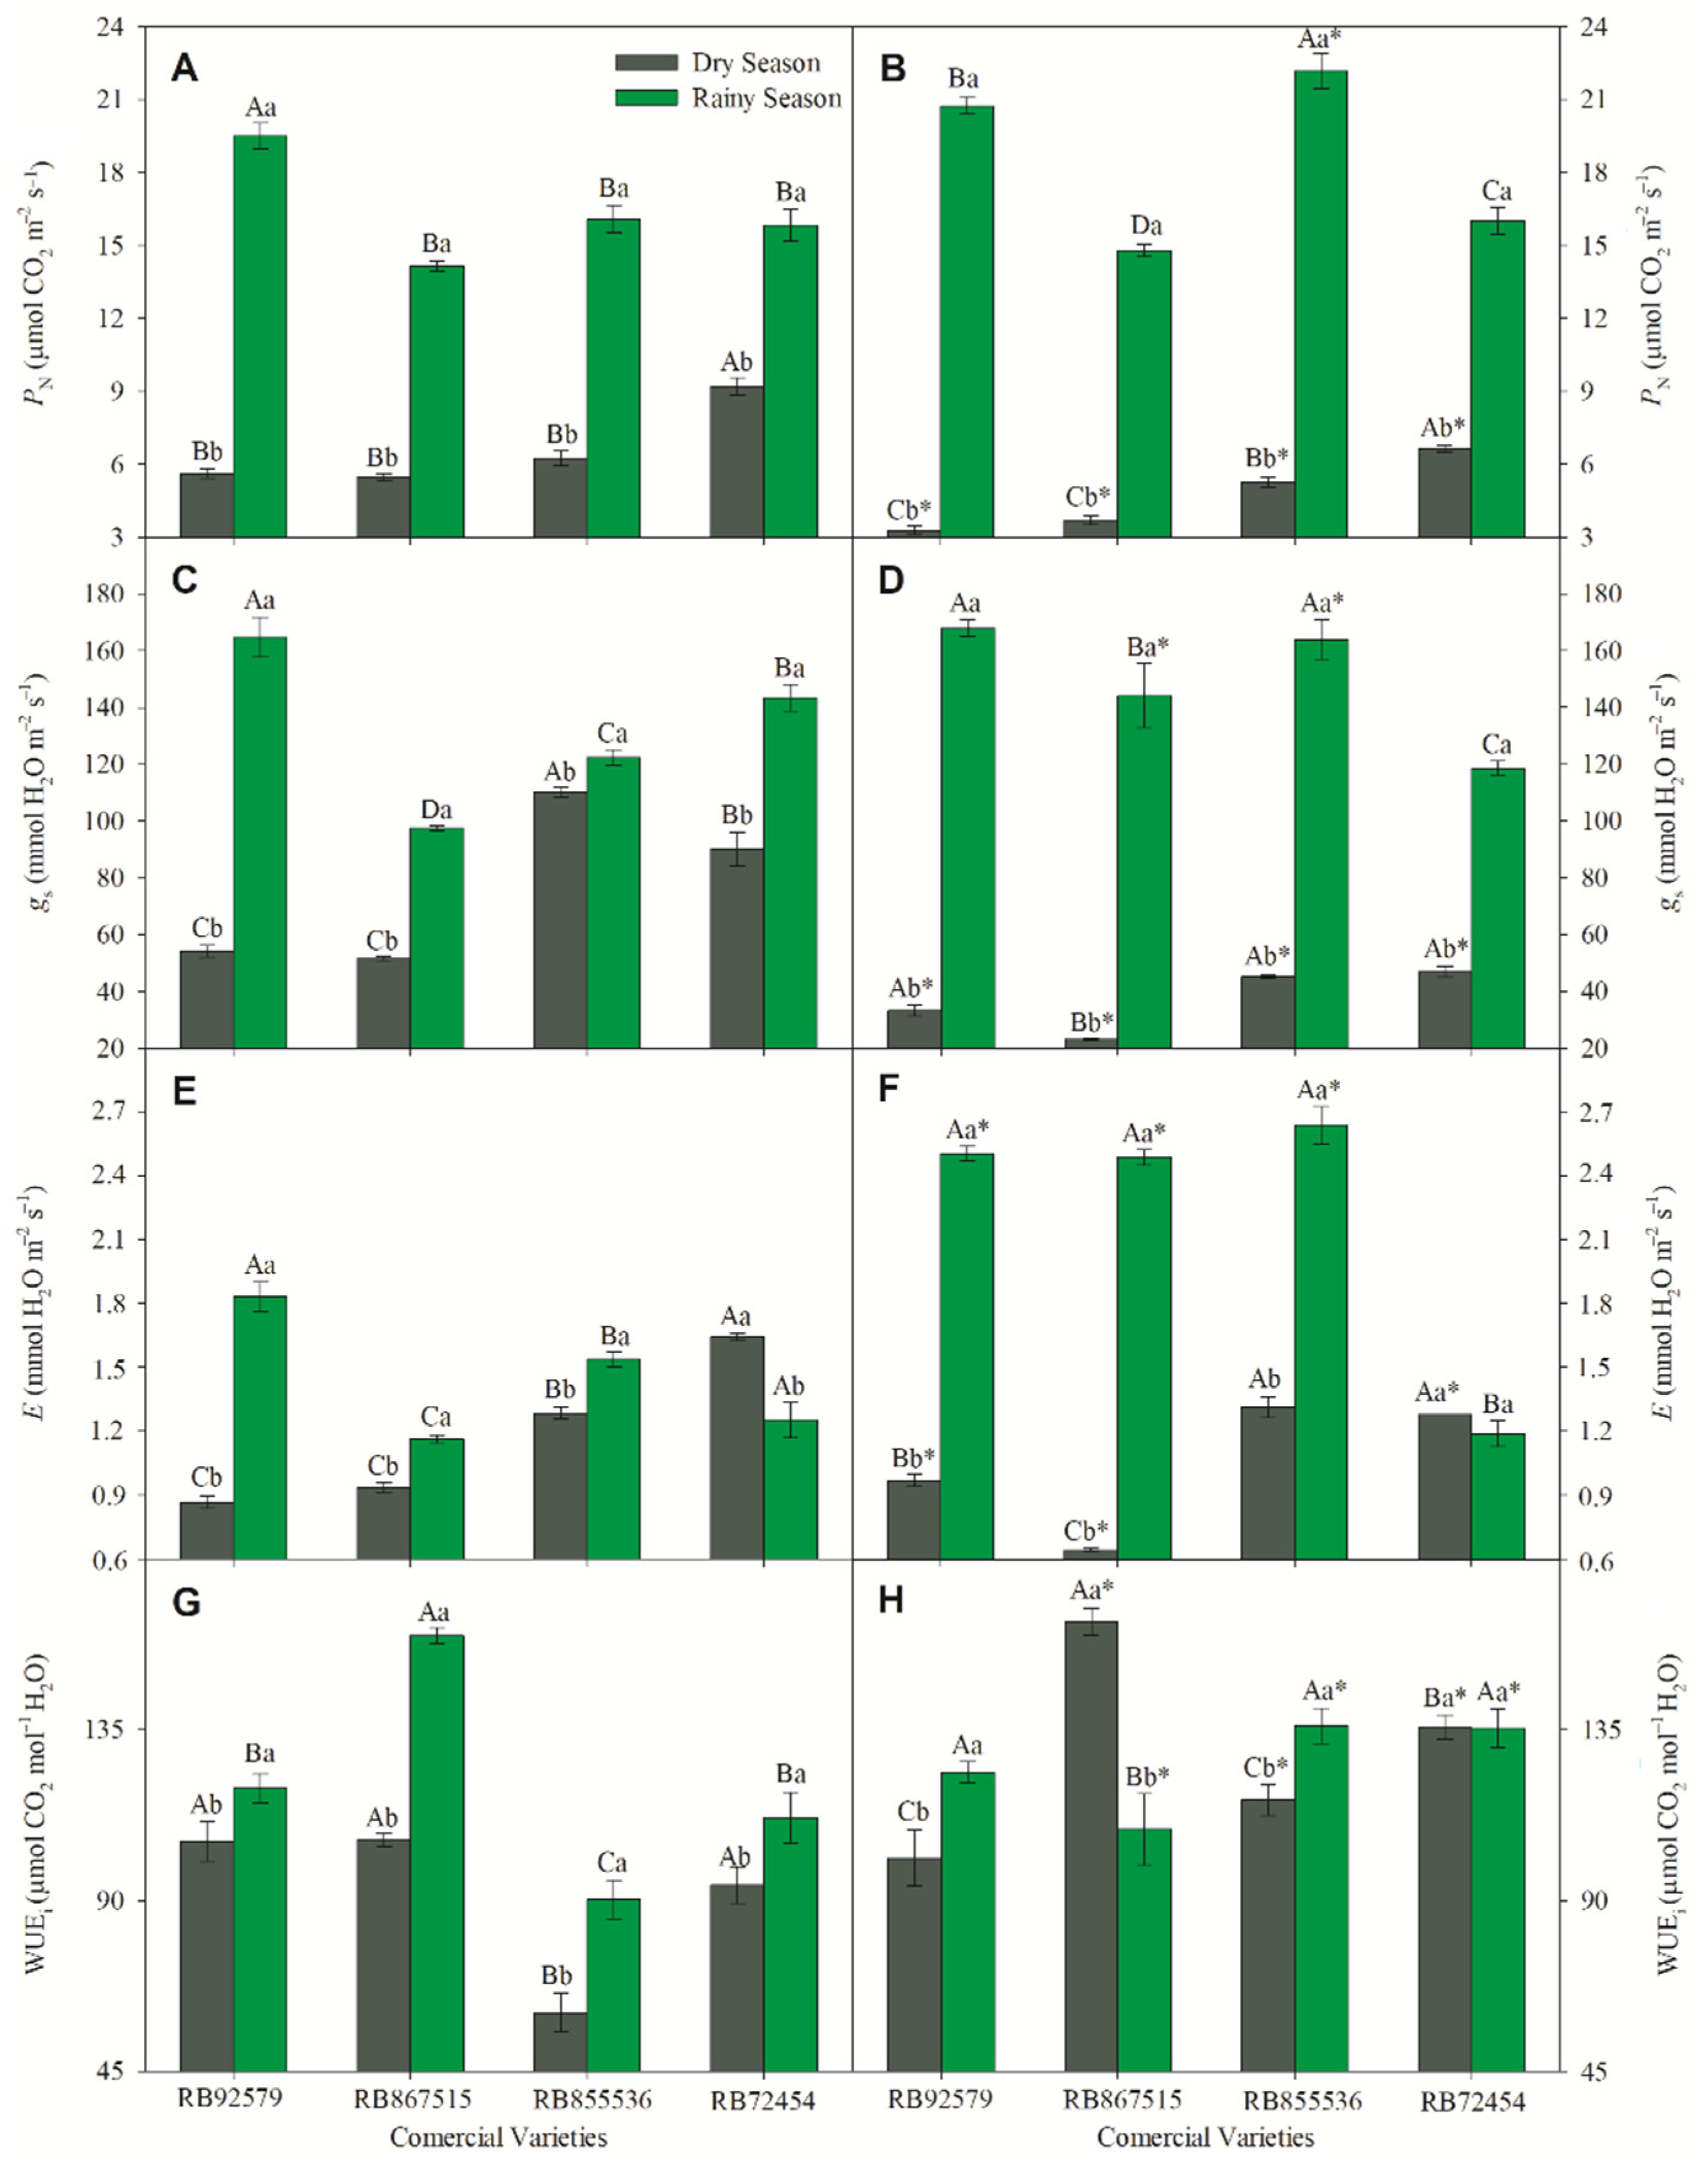
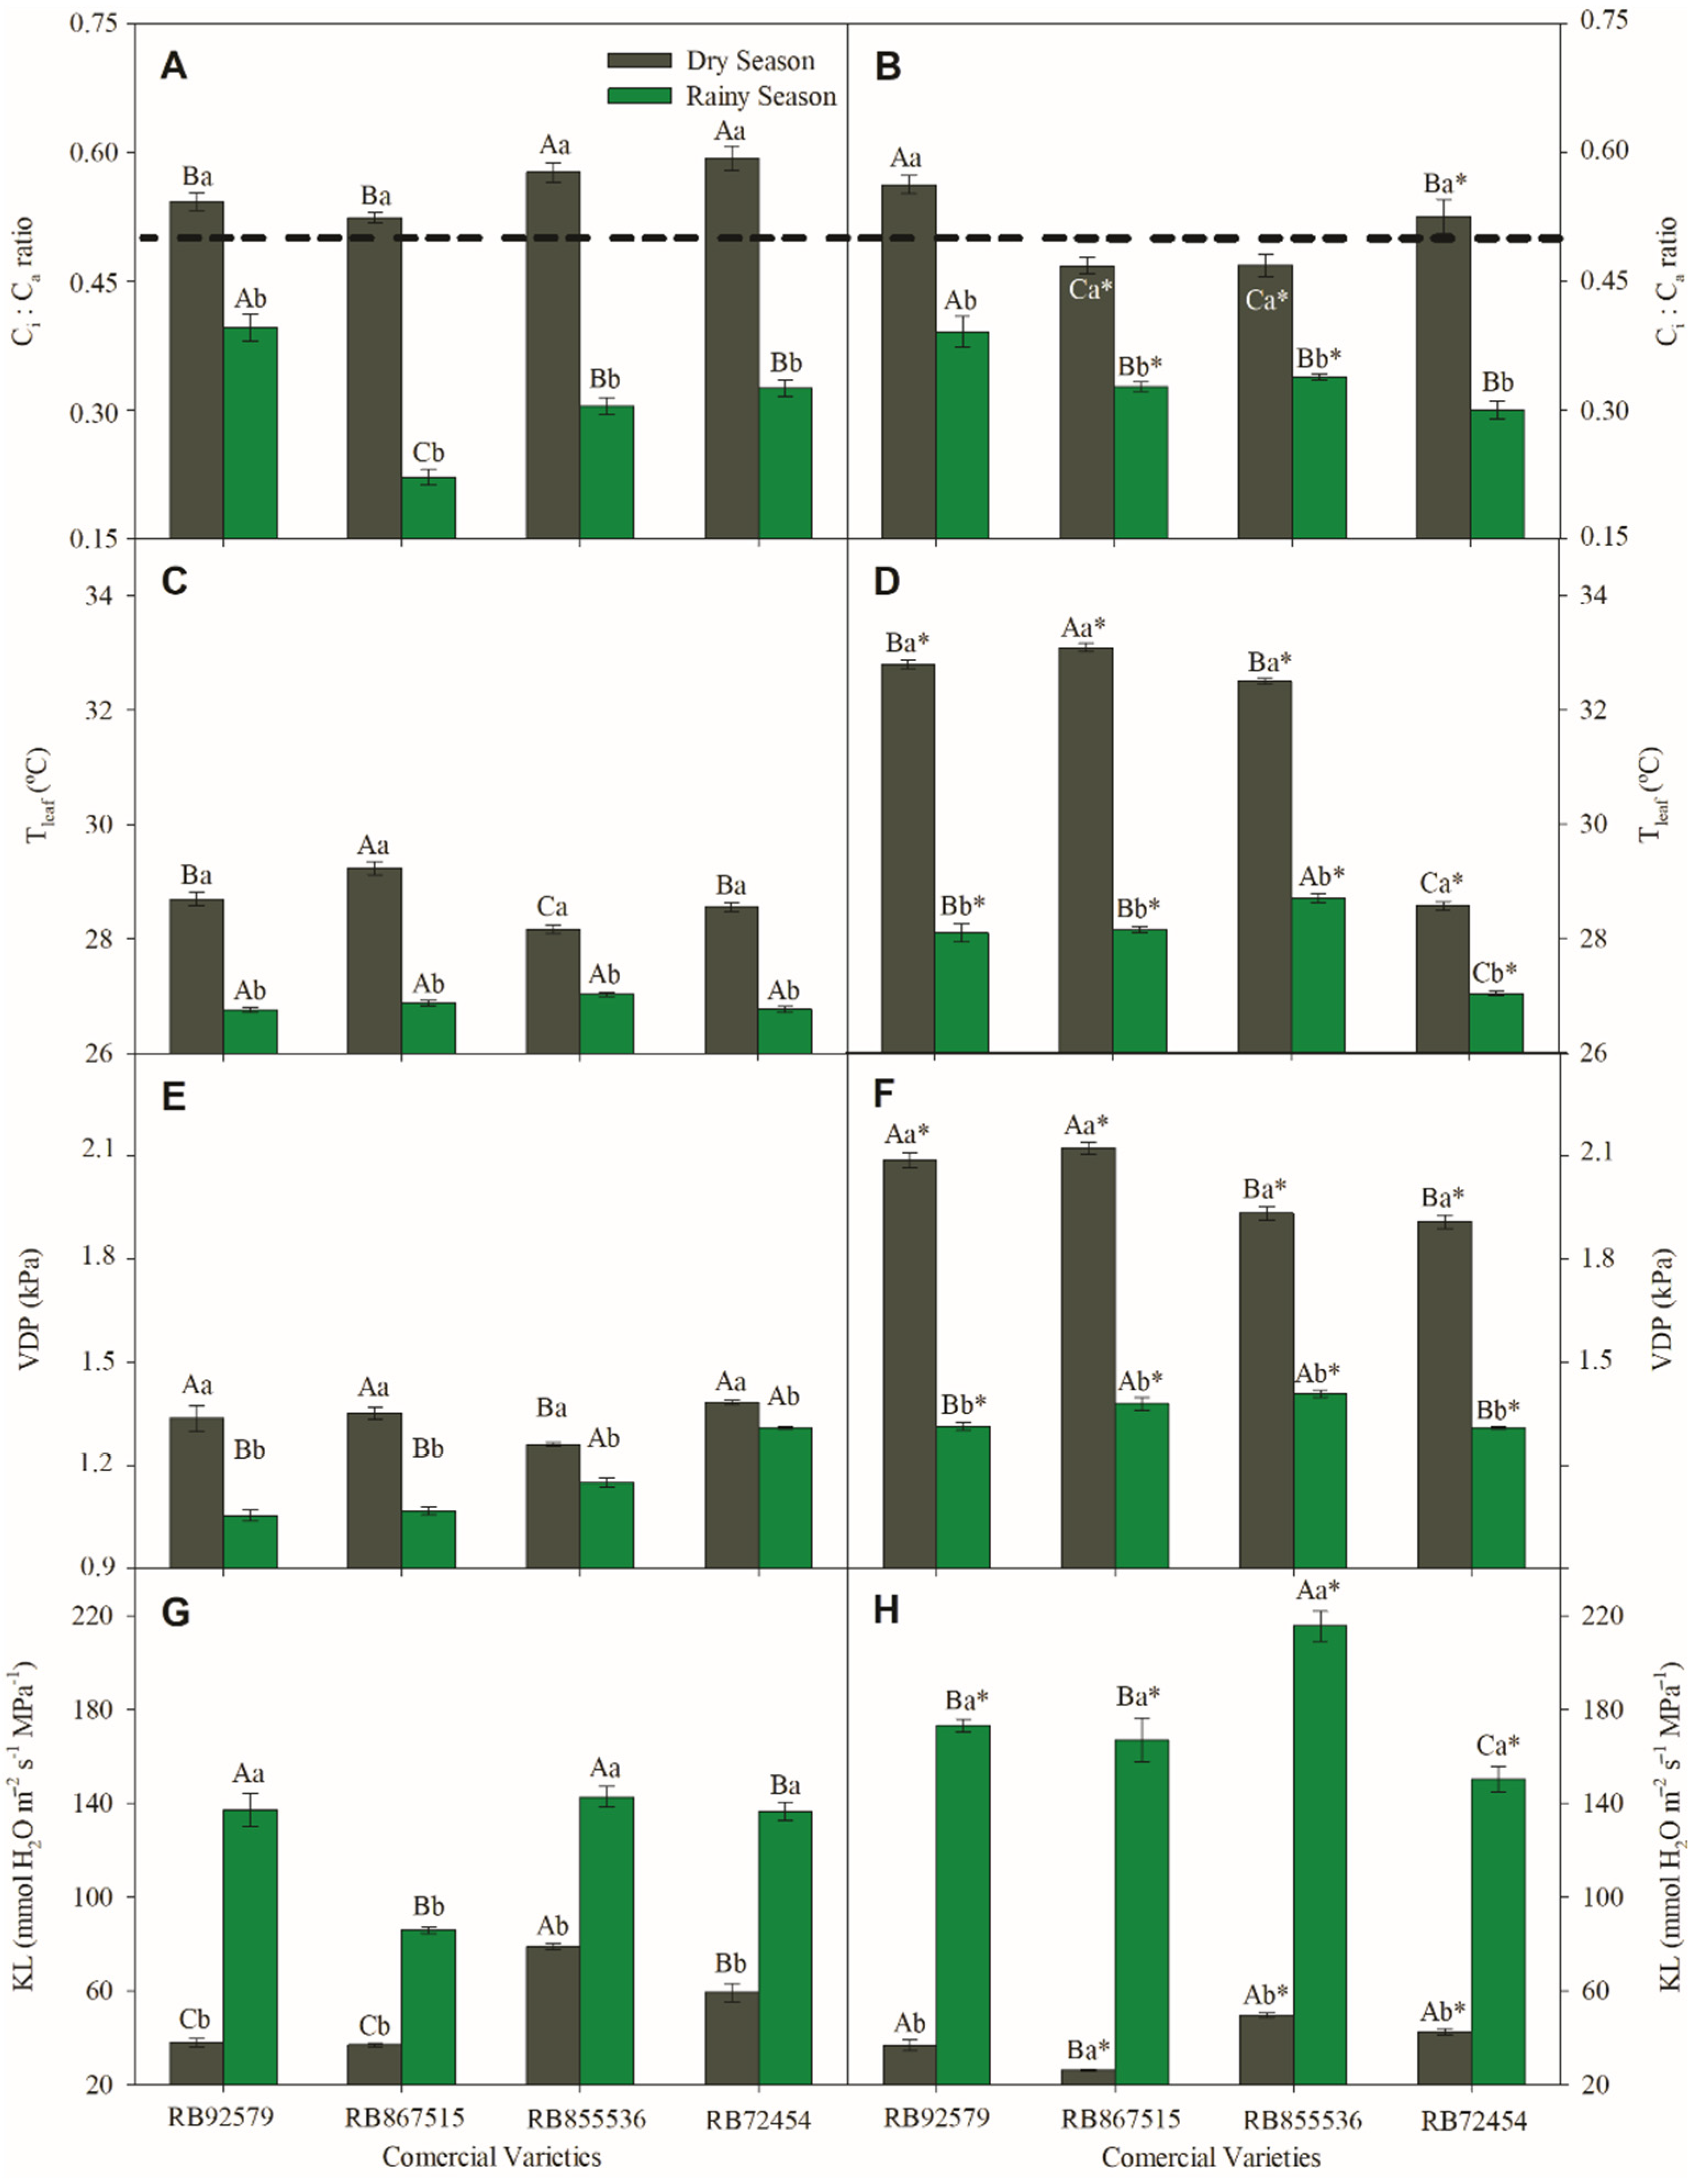
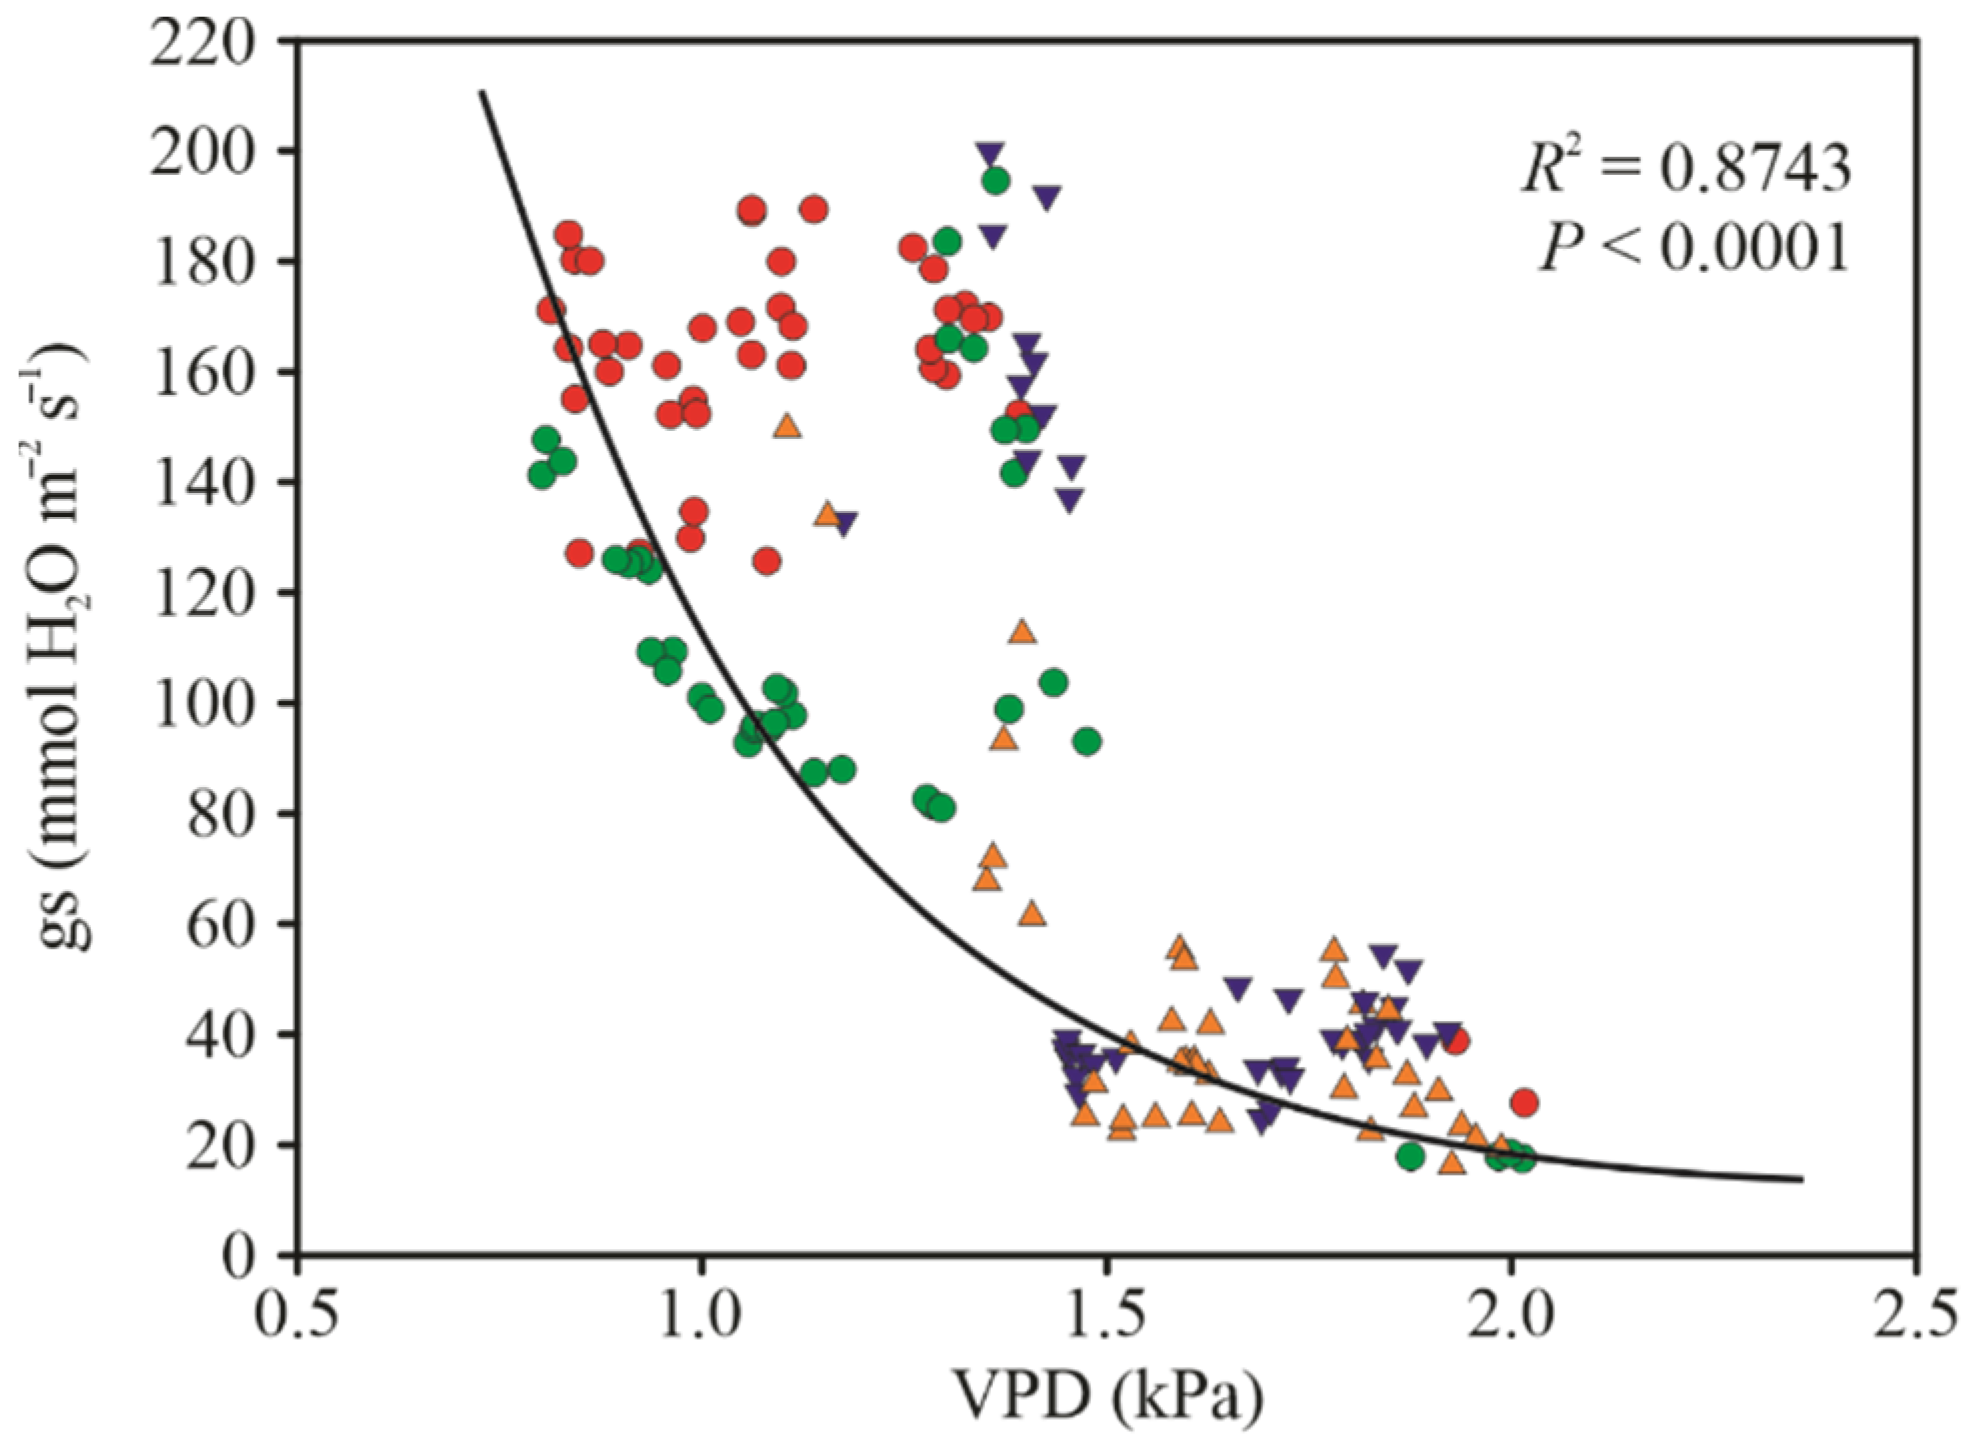
3.2. Gas Exchange Parameters

The gas exchange parameters perfectly reflect the climatological data, where PN, gs, E, WUEi, show the highest values in the rainy season. The PN values registered in the early morning (08:00–10:00 h) ranged from 1.17- to 4.75-fold higher in the rainy season compared to dry season plants. In the MD (11:00–13:00 h) the range of PN was greater than EM, ranging from 0.41- to 5.95-fold higher in rainy season than compared to dry season plants. Even though the fold measured in MD (mean 2.83-fold) is higher than EM (mean 2.68-fold) this range is not significant (p-value = 0.609).
In rainy season plants, the lesser PN was verified in RB72454 (12.38 μmol CO2 m−2 s−1) and higher in RB855536 (25.64 μmol CO2 m−2 s−1). In other ways, in the dry season plants, the lesser PN was verified in RB867515 (2.37 μmol CO2 m−2 s−1) and higher was verified in RB72454 (7.44 μmol CO2 m−2 s−1). This pattern is remarkably interesting because the same variety (RB72454) showed a lesser value in the rainy season and the highest value in the dry season Figure 2). In this sense, PN values registered in variety RB72454 show the lesser fold (1.72-fold higher) from 15.83 μmol CO2 m−2 s−1) in the rainy season to 9.21 μmol CO2 m−2 s−1 in the dry season, both in EM (Figure 2). In another way, the dataset registered in the EM, variety RB92579 shows the highest fold change when comparing the rainy (19.51 ± 0.53 μmol CO2 m−2 s−1) to dry (5.63 ± 0.19 μmol CO2 m−2 s−1) or 3.46-fold higher in the rainy season when compared to dry season plants. This last variety also showed the highest amplitude in the PN values (6.32-fold higher), registered in rainy (20.74 ± 0.35 μmol CO2 m−2 s−1) and dry season (3.28 ± 0.18 μmol CO2 m−2 s−1) on the MD dataset. In this scenario, we highlighted in the first plan one of the most tolerant varieties (RB92579) and in the second plan to more sensitive (RB72454) variety to water stress. When the comparison was taken PN values between EM to MD values in the same variety and the same season, we showed that the RB867515 varieties show a ratio of 1.04-fold higher in the EM when compared to MD. For clarity, only RB867515 variety shows higher PN values in the EM, while the other three variety RB855536, RB92579, and RB72454, showed 0.73-, 0.94-, and 0.99-fold higher in the EM values when compared to MD values. The less than 1-fold values denote that EM PN values were lesser than those registered in MD (Figure 2A,B).
The same tendency to show largest amplitudes in the MD dataset to gs and E. In this scenario we highlighted the RB867515 variety that showed 6.2- and 3.9-fold higher, respectively to gs and E when compared to the rainy than dry season dataset. In another way the variety RB72454 showed a lesser amplitude between values registered in the rainy and dry seasons, when rainy season gs and E dataset were 1.6- and 0.8-fold higher than dry season ones. It is worth noting that this 0.8-fold higher or 1.25 ± 0.08 mmol H2O m−2 s−1 (rainy season) is not statistically different to 1.28 ± 0.06 mmol H2O m−2 s−1 (dry season) (p-value = 0.33). In the EM were RB92579 and RB855536 varieties that showed, respectively the highest (3.1-fold) and lesser (1.1-fold) amplitude to gs, values registered, respectively in the rainy and dry seasons. The RB92579 also registered a moderated amplitude on E (2.1-fold), when comparing the rainy (1.83 ± 0.07 mmol H2O m−2 s−1) to dry (0.87 ± 0.03 mmol H2O m−2 s−1) season plants. In this variable, the RB72454 shows a lesser amplitude (0.76-fold), in the rainy season (1.25 ± 0.08 mmol H2O m−2 s−1) than those registered in the dry season (1.64 ± 0.02 mmol H2O m−2 s−1).
The values for WUEi, measured in EM were statistically different from those registered in the dry season, while in the MD dataset only RB92579 and RB855536 show higher values in the rainy season compared to from those registered in the dry season. When we compared the varieties using only rainy season plants on an EM, we verified that the highest and lowest value were registered in the RB867515 (159.73 ± 2.4 μmol CO2 mol−1 H2O) and RB855536 (90.30 ± 6.6 mmol CO2 mol−1 H2O). In another way, when we compared the dry season, it was verified that except for the RB855536 variety all other means that do not were statistically different. All sugarcane plants showed a high value of WUEi, measured in the rainy season when compared to the dry season, except RB867515 variety where the dry season plants showed an increase of 50.3% in the dry season compared to rainy season plants.
Figure 3 showed that all the varieties measured at MD reinforce that higher PN provokes lower Ci:Ca ratio, with depletion of Ci in the substomatal space except in RB867515, RB855536. This hypothesis is corroborated by a higher Ci:Ca ratio, which was higher than 0.5, due to lower PN in these varieties, at least on MD. Another fact that reinforces this hypothesis is the lower Ci:Ca ratio in the rainy season, in the same moments when the PN is higher. This fact also is improved by the strong negative correlation between PN and Ci:Ca ratio (r = −0.731; p = 5.71 × 10⁻²⁸). The values of Ci:Ca ratio in the dry season is partially due to lower gs, which shows a moderate and negative correlation between Ci:Ca ratio and gs (r = −0.485; p = 8.02 × 10⁻¹¹). A similar pattern was verified with Tleaf, where higher values are provoked to lower E (r = −0.242; p = 2.09 × 10⁻³). Another feature that confirms our hypothesis that higher Tleaf is provokes by lower gs, is verified with the highest correlationship between Tleaf and Ci:Ca ratio (r = 0.509; p = 6.43 × 10⁻¹²). Therefore, we can infer that there are three forces governing gas exchange, (i) the increase in gs and E, (ii) the higher VDP, (iii) the low rates of hydraulic conductivity of the stems, which, in turn, is strongly decreased by the very negative water potencies (see more details in Discussion). The strong influence of VPD on lower gs can be confirmed by both strong negative correlation between these value (r = −0.638; p = 1.15 × 10⁻¹⁹) (Figure 4).

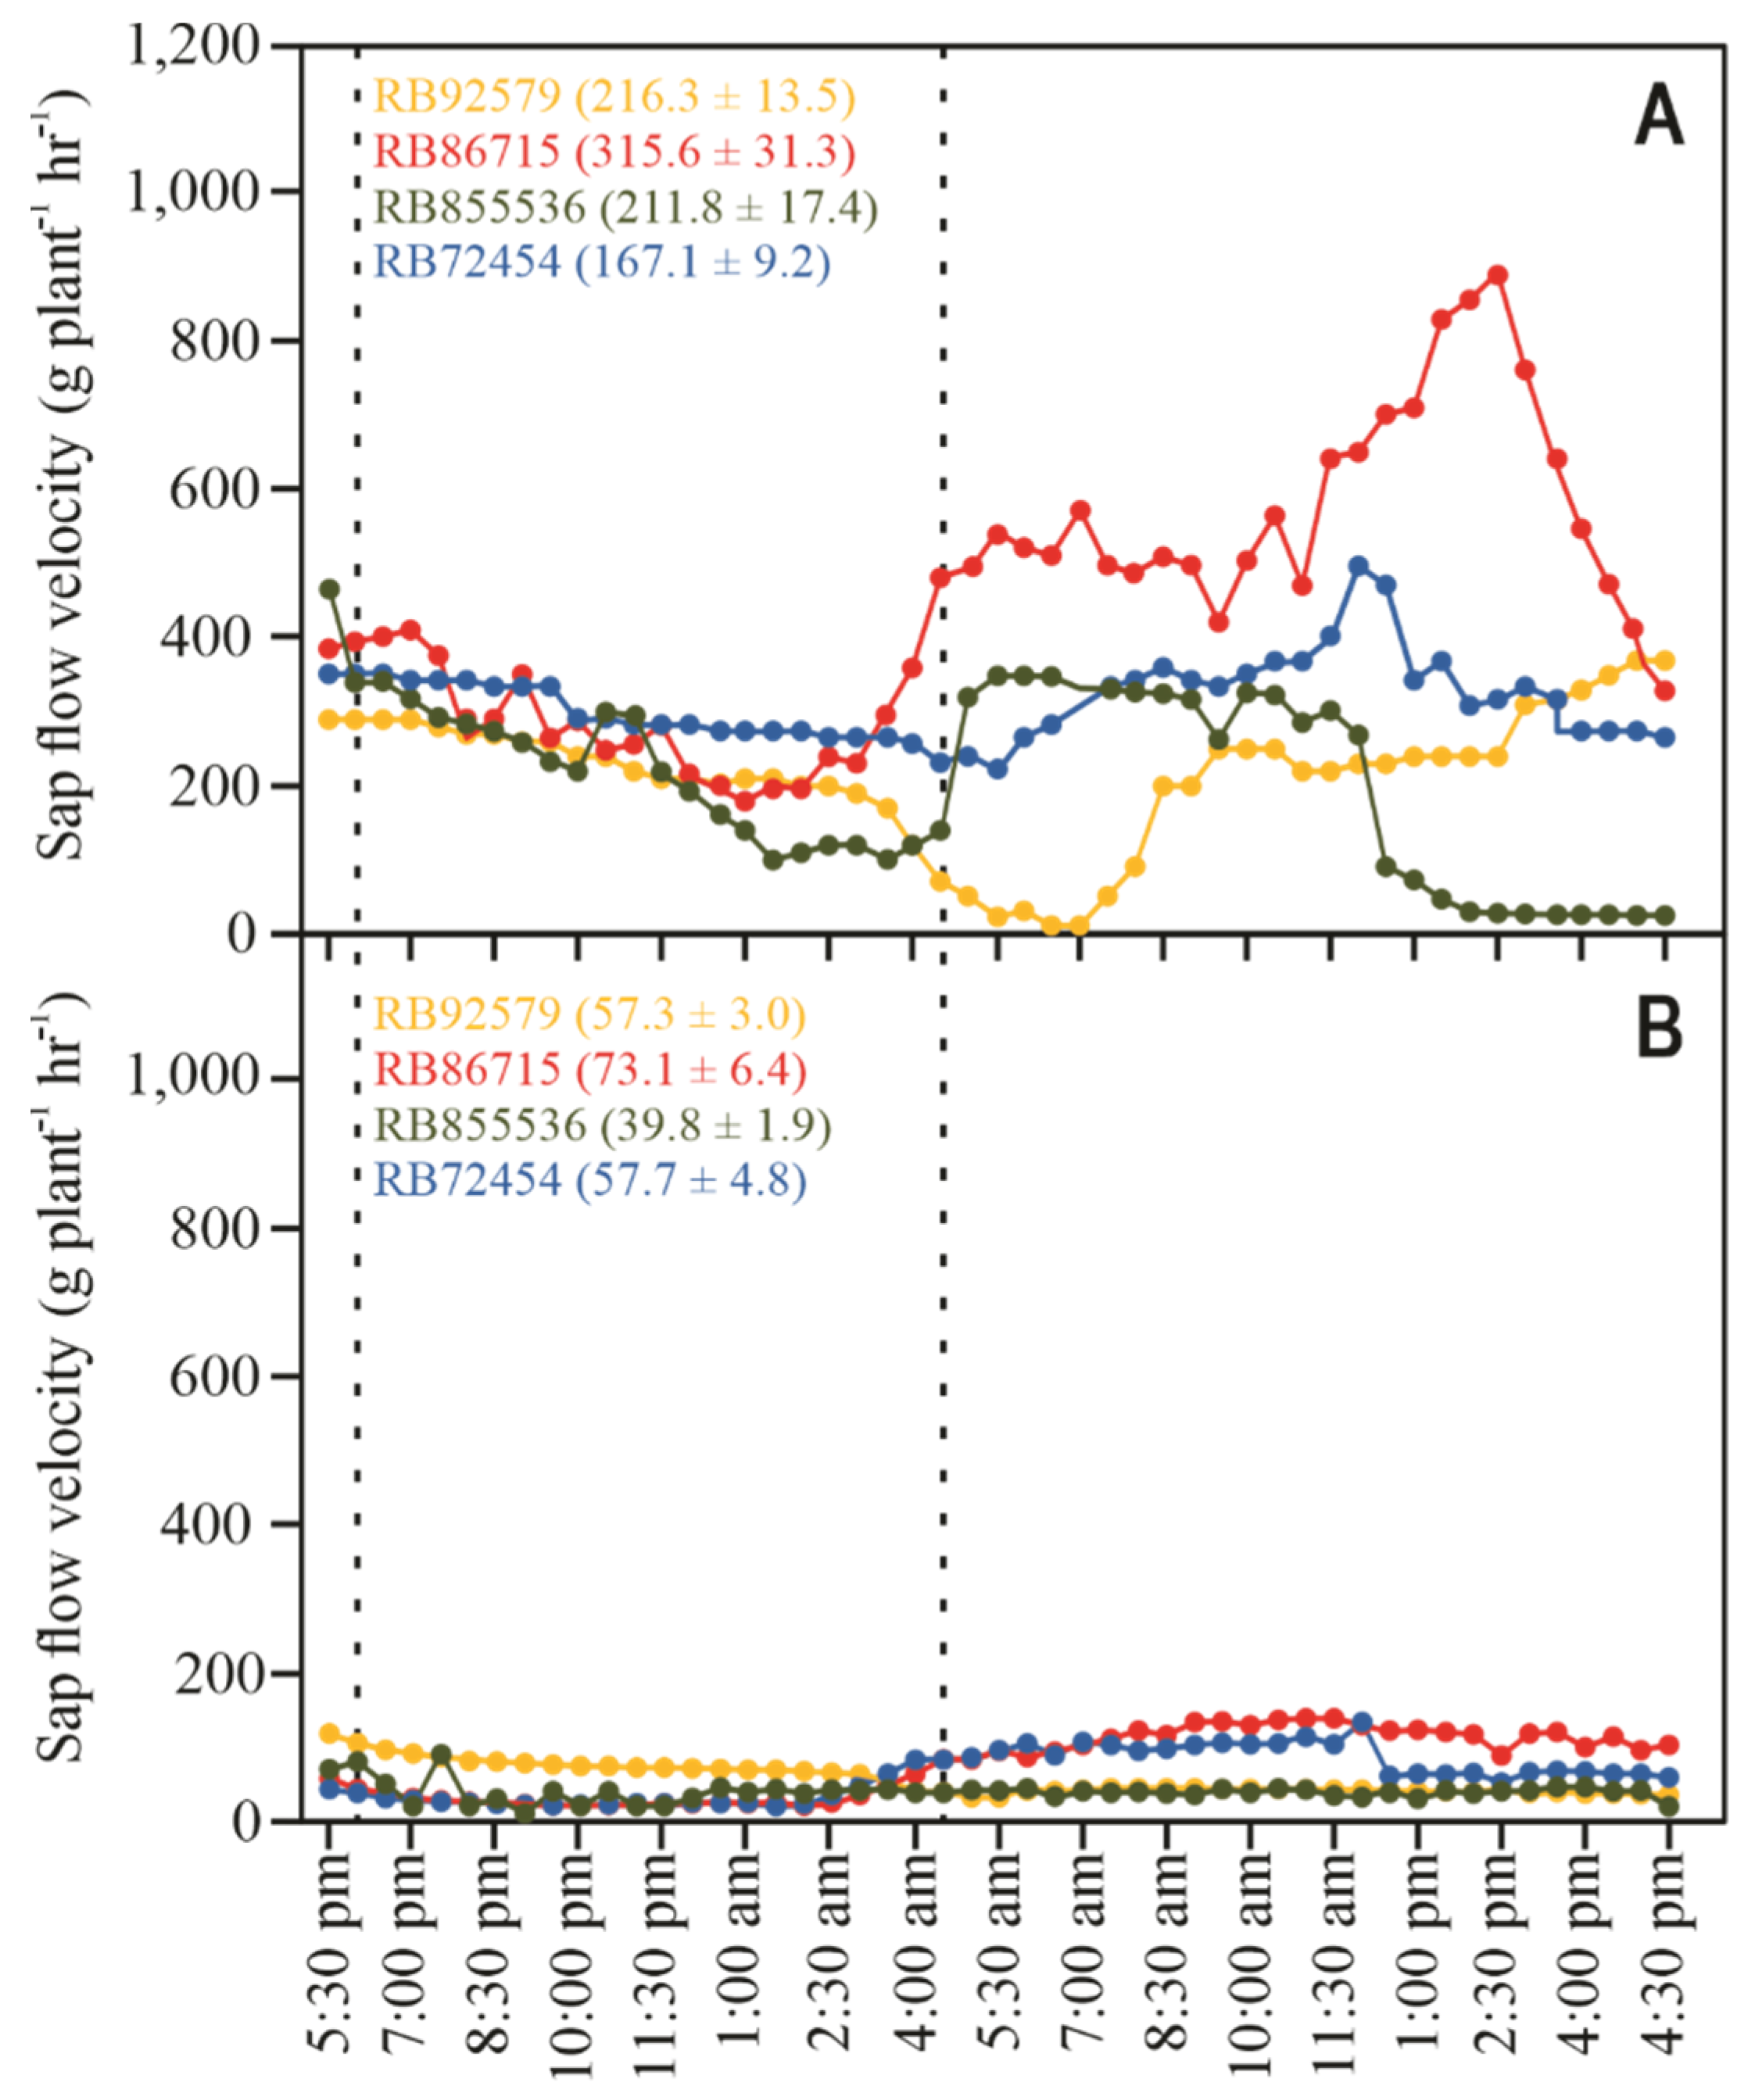
3.3. Sap Flow Measurements

Figure 5 showed us that between 5:30 p.m. and 4:00 a.m. the sap flow in all variety is not significantly different with others. After predawn, the varieties start to show different patterns. While RB86715 rose moderately, accelerating later and from 2:30 p.m. showed a sharp drop, returning the initial values, the RB92579 showed a more delayed and continuous increase until 4:30 p.m. with no significant reduction in sap flow. These two varieties are considered to be more drought-tolerant than others (Figure 5A). The varieties RB855536 and RB72454 showed an increase in the sap flow from 5 a.m., but RB855536 showed a more abrupt rise than RB72454. However, while RB855536 start a drop in sap flow around 11:30 a.m. and showed an abruptly decrease to null sap flow from 1:00 p.m., the RB72454 remain increase the sap flow to 12:00 p.m. as it slowly dropped to initial value. In the dry season, all plants do not show a significant increase in its sap flow values (Figure 5B). The rate of sap flow in the rainy season was 2- to 5-fold higher than sap flow in the dry season, independent of the variable.

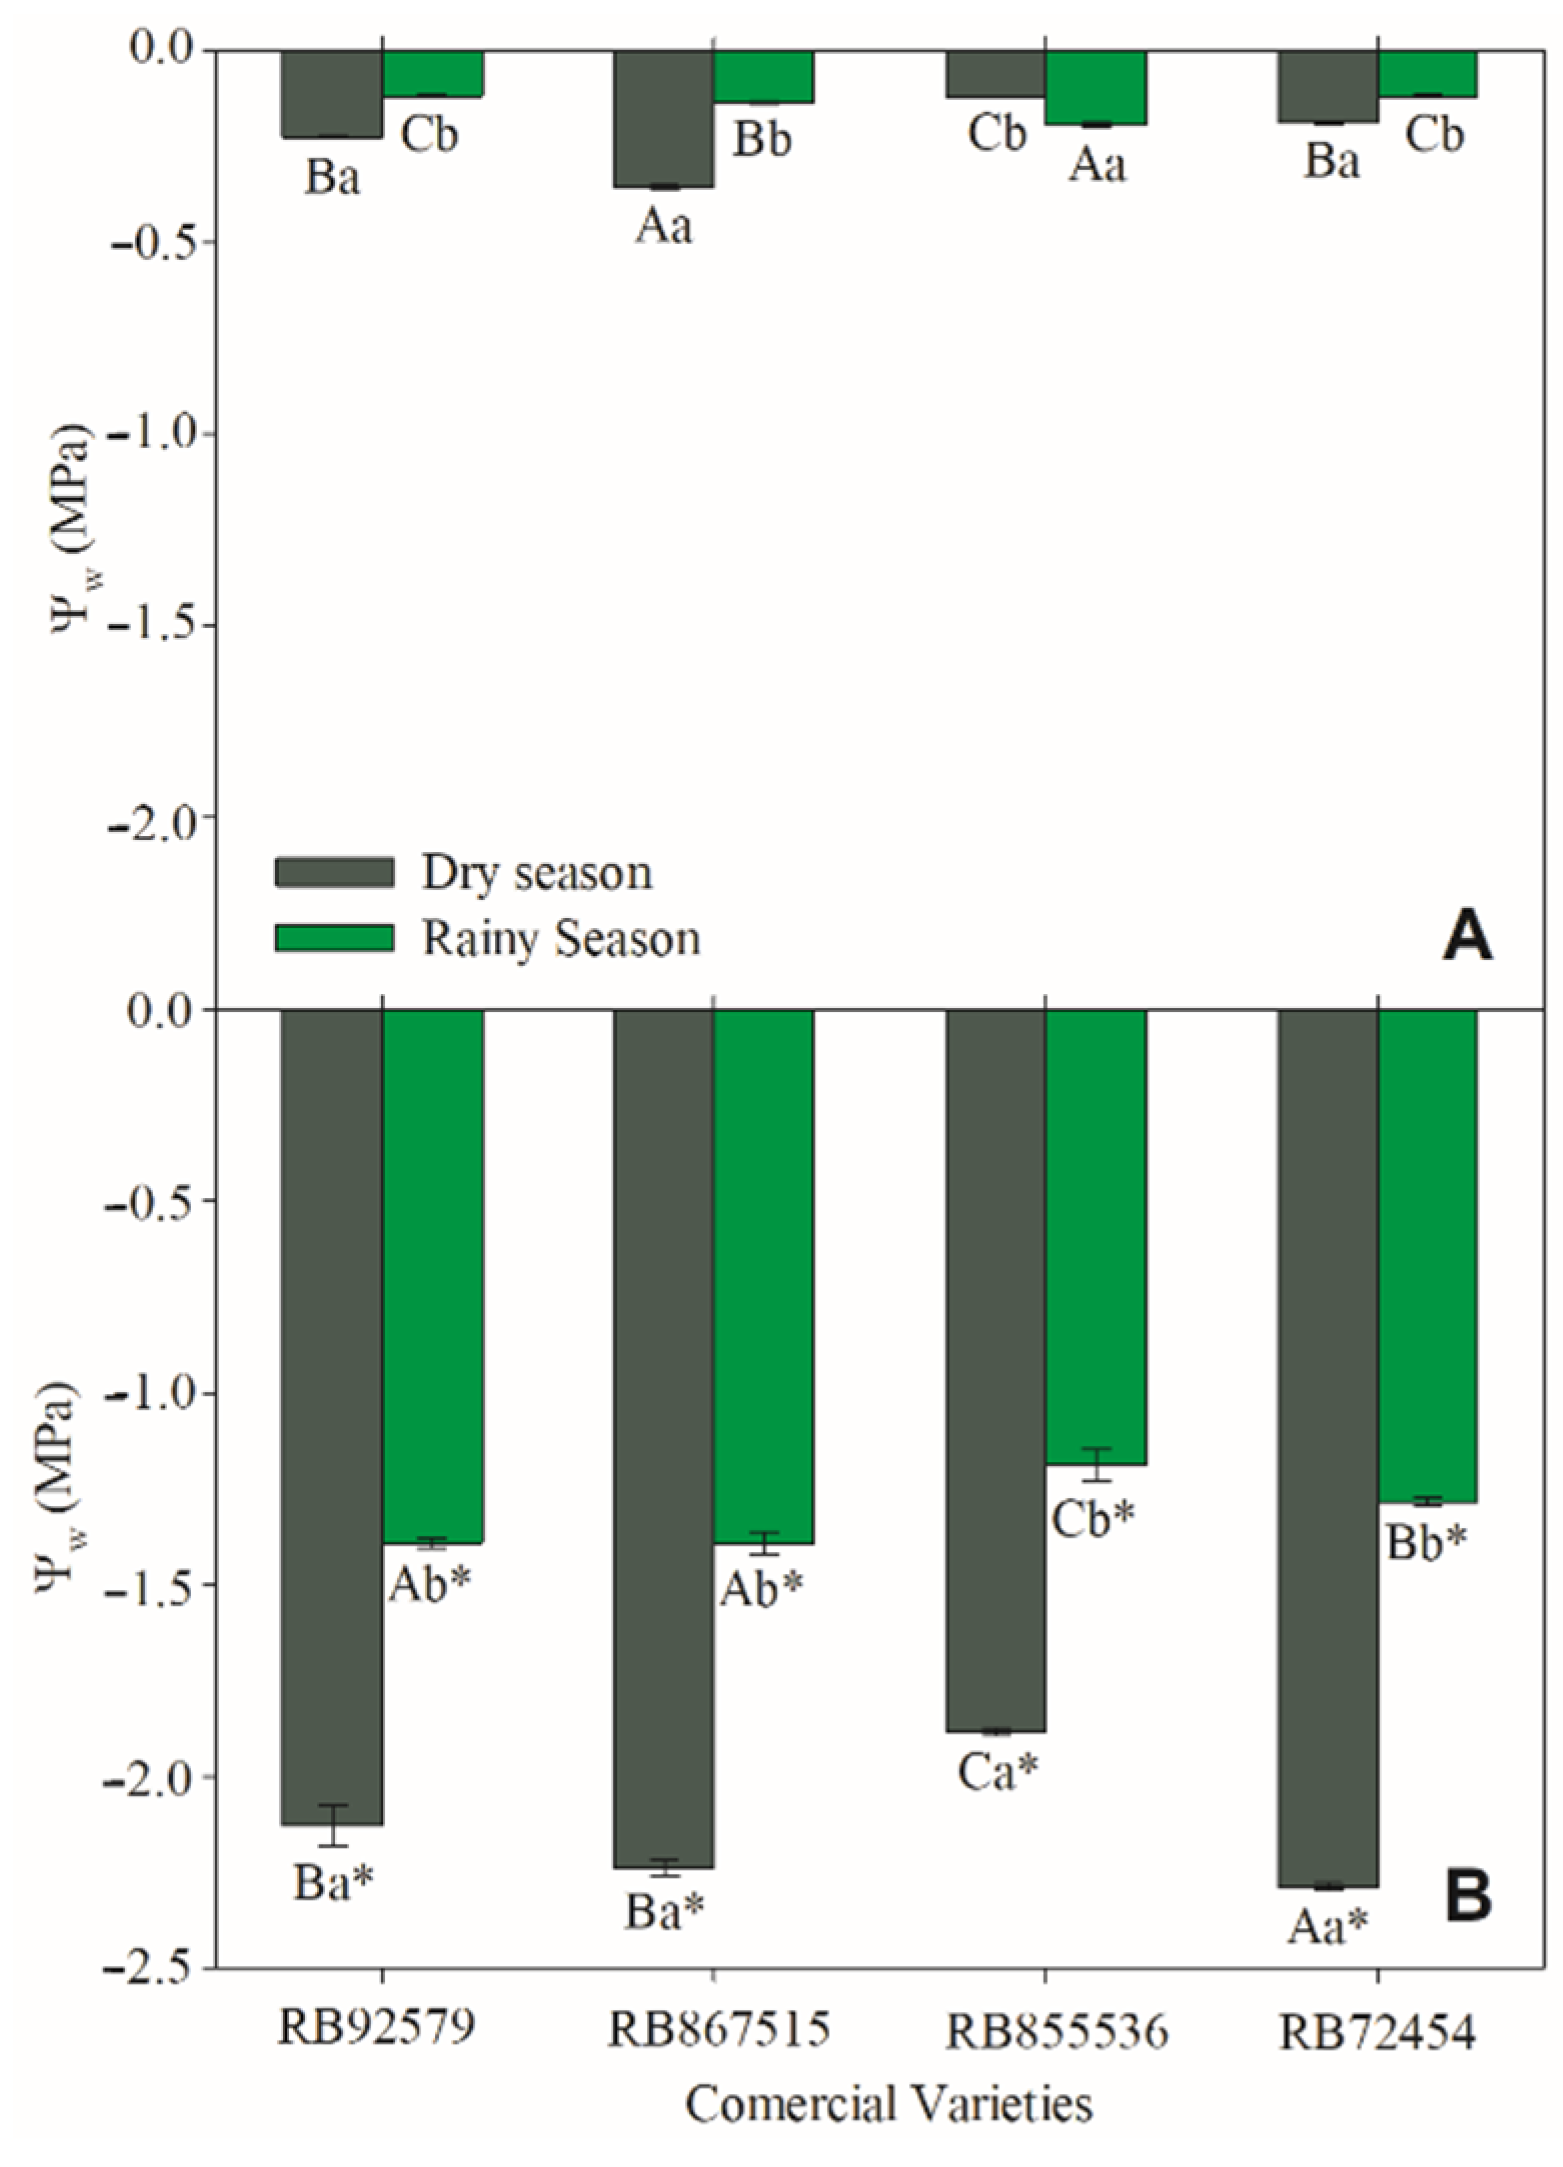
3.4. Water Potential (Ψw)

The Ψw closes the water flux in the soil-plant-atmosphere system. In the rainy season, we described a slight difference to Ψwpredown. However, in Ψwmidday the varieties RB855536 (Ψwmidday −1.39 MPa) and RB72454 (Ψwmidday −1.38 MPa) varieties benefited due to less negative shown Ψwmidday in comparison to RB92579 and RB867515, values that were 10.8% higher than those shown to RB92579 and RB867515. The Ψwpredown was 4- to 5-fold higher than those values registered in the midday, independently of the season (rainy or dry). The rainy season Ψwpredown ranged from −0.12 MPa (RB72454) to −0.19 MPa (RB855536), a range of −0.07 MPa. In distinct form, in the dry season, the Ψwpredown ranged from −0.12 MPa (RB855536) to −0.36 MPa (RB867515), a range of −0.24 MPa (Figure 6).

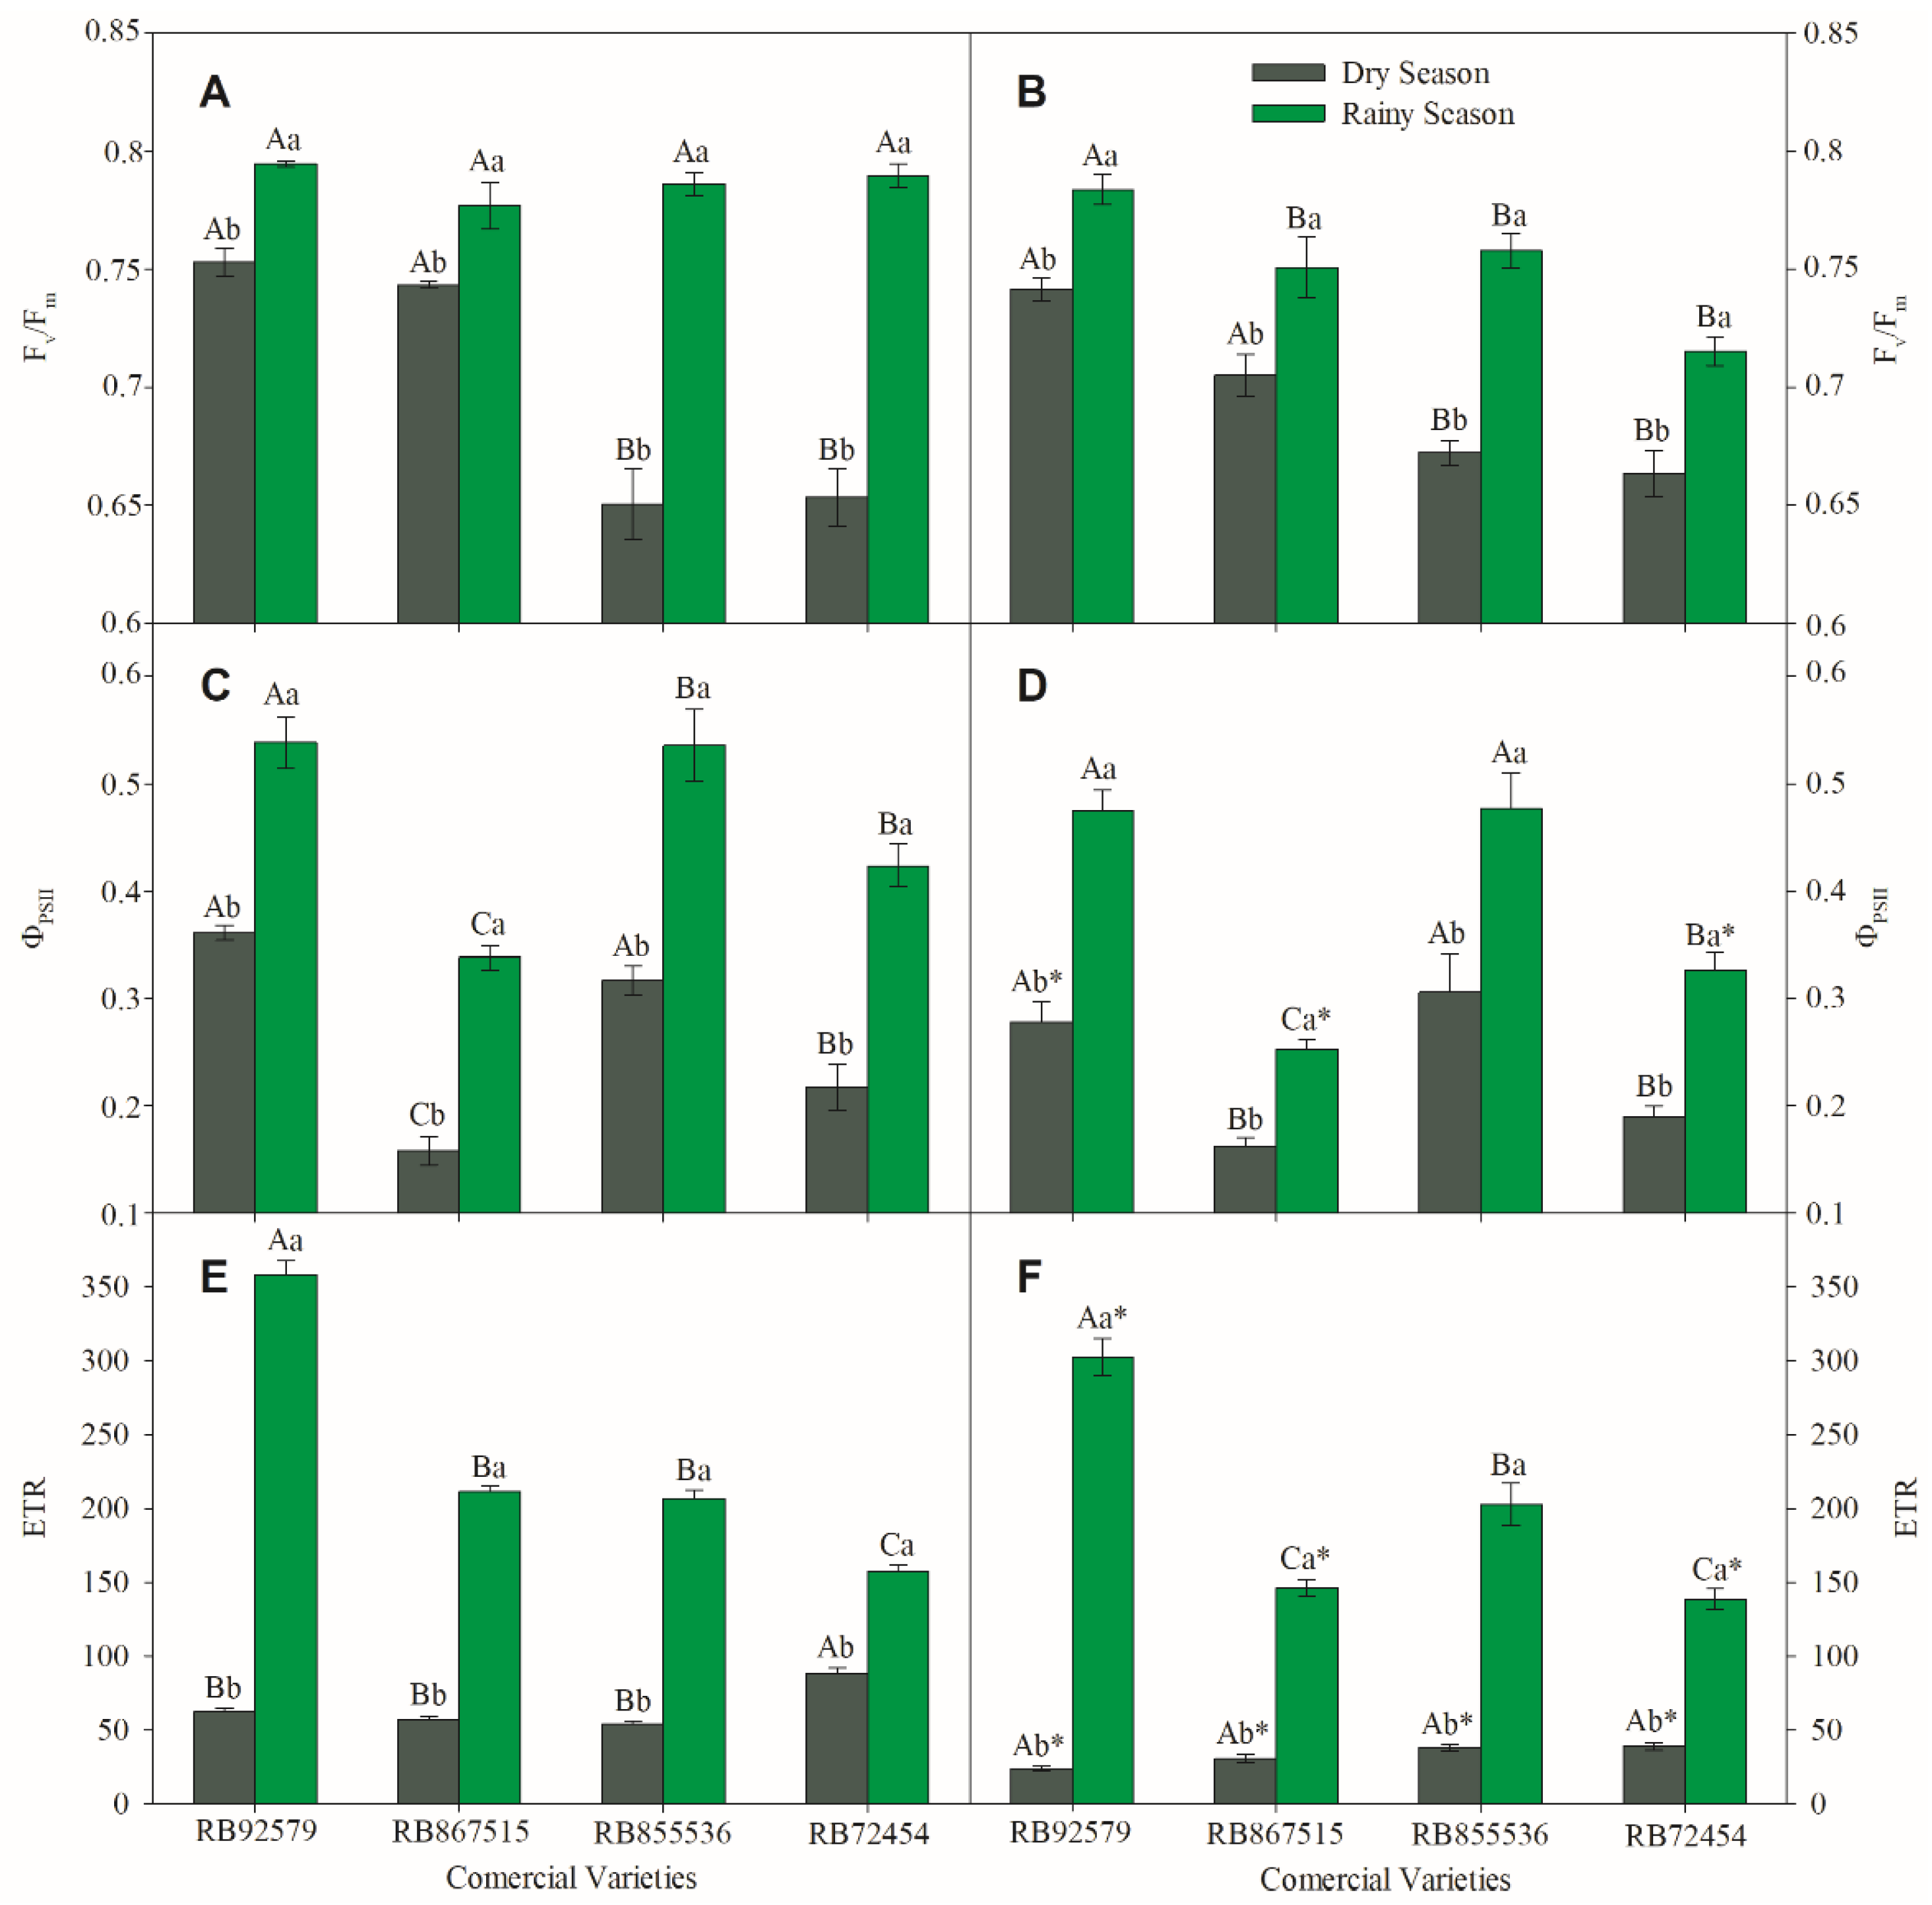
3.5. Chlorophyll a Fluorescence Measurements

Without exception, all rainy season sugarcane plants showed higher values of Fv/Fm, ΦPSII, and ETR, when compared to those registered in the dry season, independently of the sample time (Figure 7). The Fv/Fm measured EM in rainy season plants is nonsignificant. Contrasting, the dry season plants showed a 2-level pattern: one joining the RB92579 and RB867515 and the other joining the RB855536 and RB72454, with the last two varieties showing an increase of 20.9% of the Fv/Fm measured in the first varieties. The MD Fv/Fm measurements in the rainy season tend to be not physiologically different because the values ranged from 0.72 (RB72454) to 0.78 (RB92579). In another way, the dry season sugarcane plants, the Fv/Fm values registered in MD plants were higher in RB92579 with sharp decrease in other varieties RB867515 (4.9%), RB855536 (9.4%), and RB72454 (10.4%). The pattern verified in ΦPSII and ETR tended to be same as the pattern described to Fv/Fm measurements. So, we presented more integration of these parameters in the discussion. However, in suitable agreement, the reductions in AN may be associated with the lower availability of NADPH and ATP, since both ΦPSII and ETR decreased due to drought stress (Figure 7).

3.6. Biochemical Analysis

3.6.1. Chlorophyll and Carotenoids

Independently of variety, the chlorophyll (Chl) a showed a decrease of ~34.1% on dry season plants when compared to rainy season ones. The highest and lesser drop was shown in RB72454 (41.3%) and RB867515 (28.4%). Both within rainy and dry season plants, variety RB92579 stood out for showing greater concentrations than the other varieties that did not show significant differences between them (Table 2).
A different situation was shown in the Chl b concentration, where the two drought-tolerant-like varieties had an average of 0.40 g kg−1 DW, while the variety RB855536 had 0.42 ± 0.03 g kg−1 DW and variety RB72454 had 0.36 ± 0.02 g kg−1 DW, only when compared between rainy season plants. In this sense, there was a strong drop in Chl b in the tolerant varieties (RB92579 and RB867515) of 49.2% and 28.4%, while in RB855536 there was a nonsignificant decline (5.5%) and an increase of ~14% in the variety RB72454 (Table 2).
With differences in Chl a and Chl b patterns, the Chl total was modulated more by reductions in Chl a than in Chl b. However, the rainy season plants showed a level of Chl total of 1.6-, 1.4-, 1.3-, and 1.4-fold higher in favor of the rainy season plants, respectively to RB92579, RB867515, RB855536, and RB72454 (Table 2).
While Chl levels, in general, decreased in dry season plants, total carotenoids were increased in dry season ones by 37% (RB92579) and 56.2% (RB72454), while the varieties RB867515 and RB855536 presented a median and very low, but not significant fall of 15.5% and 2.4% in dry season plants when compared to rainy season plants (Table 2).
With the significant decreases in total chlorophylls and a slight increase in carotenoid levels in dry season plants, we showed an increase in the total carotenoids/chlorophylls (Car/Chl) ratio. In this sense, it was shown that the varieties RB92579 and RB72454 presented a strong increase in the Car/Chl ratio in the order of 120.9% and 120.8%, while in the varieties RB867515 and RB855536 the increase was slight in the variety RB867515 (17%) and moderate in the variety RB855536 (32%).

3.6.2. Free Amino Acids and Total Proteins

The concentration of free amino acids [aa] showed a quite different pattern between tolerant and sensitive sugarcane plants to water deficit. While varieties RB92579 and RB867515 showed an increase in concentrations in dry season plants (21.6% and 9.9%, respectively), the sensitive plants showed a moderate (RB855536; 29.2%) and negligible (RB72454; 1.6%) decrease in free [aa]. However, when comparing the varieties within the same season, in the rainy season sugarcane plants, the variety RB855536 showed an [aa] of 16.73 ± 0.25 mmol kg−1 DW, which was 1.1%, 5.6%, and 12.6% higher than those presented in the varieties RB72454, RB867515, and RB92579, respectively. A completely different pattern was verified in the dry season sugarcane plants, where the variety RB92579 presented the highest [aa] than the other varieties, values that were 2.4%, 8.4%, and 33.4% higher than the other varieties (RB867515, RB72454, and RB855536, respectively). However, the difference between [aa] in RB92579 and RB867515 or RB72454 is not significant.
Regardless of variety, dry season sugarcane plants showed a moderately lower protein concentration than rainy season sugarcane plants. The varieties RB867515, RB92579, RB72454 and RB855536 presented a decrease of 13.6%, 19.9%, 20.6%, and 23.1% in dry season, respectively. Moreover, when the comparison is performed by the variety within rainy season plants, the variety RB92579 presented a protein concentration of 112.36 ± 3.93 g kg−1 DW, a value that was 13.8%, 18.4%, and 26.2% higher than the concentration of total proteins in the varieties RB855536, RB867515, and RB72454, respectively. However, when comparing the dry season sugarcane plants, the RB92579 variety showed the highest protein concentration (89.97 ± 1.16 g kg−1 DW), a value that was 11.9%, 17.2%, and 26.8% higher than the total protein concentration of the varieties RB867515, RB855536 and RB72454, respectively (Table 2).

3.6.3. Antioxidant System

The antioxidant system was strongly modulated by water deficit, especially in the varieties RB92579 and RB855536. SOD activity was respectively increased by 52.4% and 74% in these two varieties. However, the other two varieties also showed a very expressive increase in SOD activity, with 60% (RB867515) and 107.8% (RB72454). Moreover, it was the RB855536 variety that showed the highest SOD activity in both rainy and dry season plants. When comparing SOD activity within rainy season plants, the variety RB855536 showed an activity of 23.7%, 28.5%, and 39.1% higher when compared to RB867515, RB92579, and RB72454, respectively. When SOD activity was compared only in dry season plants, the RB855536 was increased in the greatest proportion, being 16.5%, 34.5%, and 46.8% higher than the SOD activity of the varieties RB72454, RB867515, RB92579, respectively (Table 2).
Like SOD activity, the dry season plants showed an increase in CAT activity of 15.8%, 34.3%, 70.8%, and 85.3%, respectively in RB72454, RB867515, RB855536, and RB92579 varieties. When comparing the CAT activity within the rainy season plants, it was verified that the variety RB92579 presented a 21.2% lower CAT activity than the other varieties that did not differ statistically between them. However, in dry season plants, the variety RB855536 showed the highest activity among all other varieties (36.26 ± 0.53), or 13.2%, 27.5%, and 48.3% higher than the activity shown, respectively, in varieties RB92579, RB867515, RB72454 (Table 2).
APX activity was distinctly modulated in the varieties. In varieties RB92579 and RB855536 the APX activity was mild, but statistically increased by 5.1% and 11.4%, while in the varieties RB867515 and RB72454, an APX activity in dry season plants was 7.3% and 28.8% lower than those activities showed in rainy season plants. When comparing the varieties in dry season plants, the variety RB855536 presented a 10.8%, 20.1%, and 62.6% higher APX activity than the varieties RB92579, RB867515, and RB72454, respectively (Table 2).
As a result of water stress, the dry season sugarcane shows a higher concentration proline when compared to the rainy season plants, with expressive increases in the RB92579 (53.1%) and RB855536 (71.8%). In the varieties RB867515 and RB72454, the proline concentration in the dry season plants was respectively increased by 16.1% and 15.9%. Within the rainy season plants variety RB72454 had the highest proline concentration (51.10 ± 0.28 mmol kg−1 DW), which was 1.1-, 1.3-, and 1.3-fold higher proline than accumulated in RB867515, RB92579, and RB855536, respectively. While the dry season plants, RB855536 plants had a higher proline concentration (66.81 ± 0.32 mmol kg−1 DW), which was 8.8%, 12.8%, and 21.4% higher than those concentrations in RB92579, RB72454, and RB867515, respectively (Table 2).
The MDA was strongly (91.3% and 79.2%) increased in RB72454 and RB867515 and slightly increased (10.5%) in the RB92579 variety, while in the RB855536 variety the value of rainy and dry season plants was not statistically different, and the dry season plants accumulated 0.61% less MDA than rainy season plants. In relative values, the MDA accumulation in the rainy season was 24.4% (RB92579), 34.9% (RB867515), and 39.8% (RB855536) lower than that accumulated in RB72454 (25.23 ± 0.61 mmol kg−1 DW). However, when only the dry season plants are compared, the variety RB72454 presented a concentration of 48.27 ± 0.15 mmol kg−1 DW or of 44 g kg−1 DW %, 115.3%, and 169.2% more MDA, respectively in relation to the varieties RB867515, RB92579, and RB855536 (Table 2).
It can be considered that the RB855536 genotype, even with a lower Fv/Fm ratio, did not have their photosynthetic and hydraulic apparatus negatively affected, since the predawn potential was 62% higher in the dry season in comparison with the rainy season, which in part can be explained by the anticipation of the decrease in sap flow (Figure 5).
Thus, during the hottest moments of the day, these plants reduce their sap flow, causing a stomatal closing that is more affected in dry season plants (Figure 8). The mechanisms that command this modulation could have the higher concentration of Car/Chl ratio, or the higher ΦPSII, since higher the ΦPSII reduce the need to dissipate heat, promoting a security thermal dissipation. These hypothesis gives more strength by positive correlation with Fv/Fm ratio and Chl a (r = 0.522; p = 7.03 × 10⁻⁷) or with total chlorophyll (r = 0.428; p = 7.47 × 10⁻⁵). The antioxidative enzymes also corroborates this hypothesis, where Fv/Fm ratio and SOD (r = −0.758; p = 3.71 × 10⁻¹⁶), CAT (r = −0.546; p = 1.37 × 10⁻⁷) and proline (r = −0.694; p = 9.53 × 10⁻¹³) had strong negative correlations.

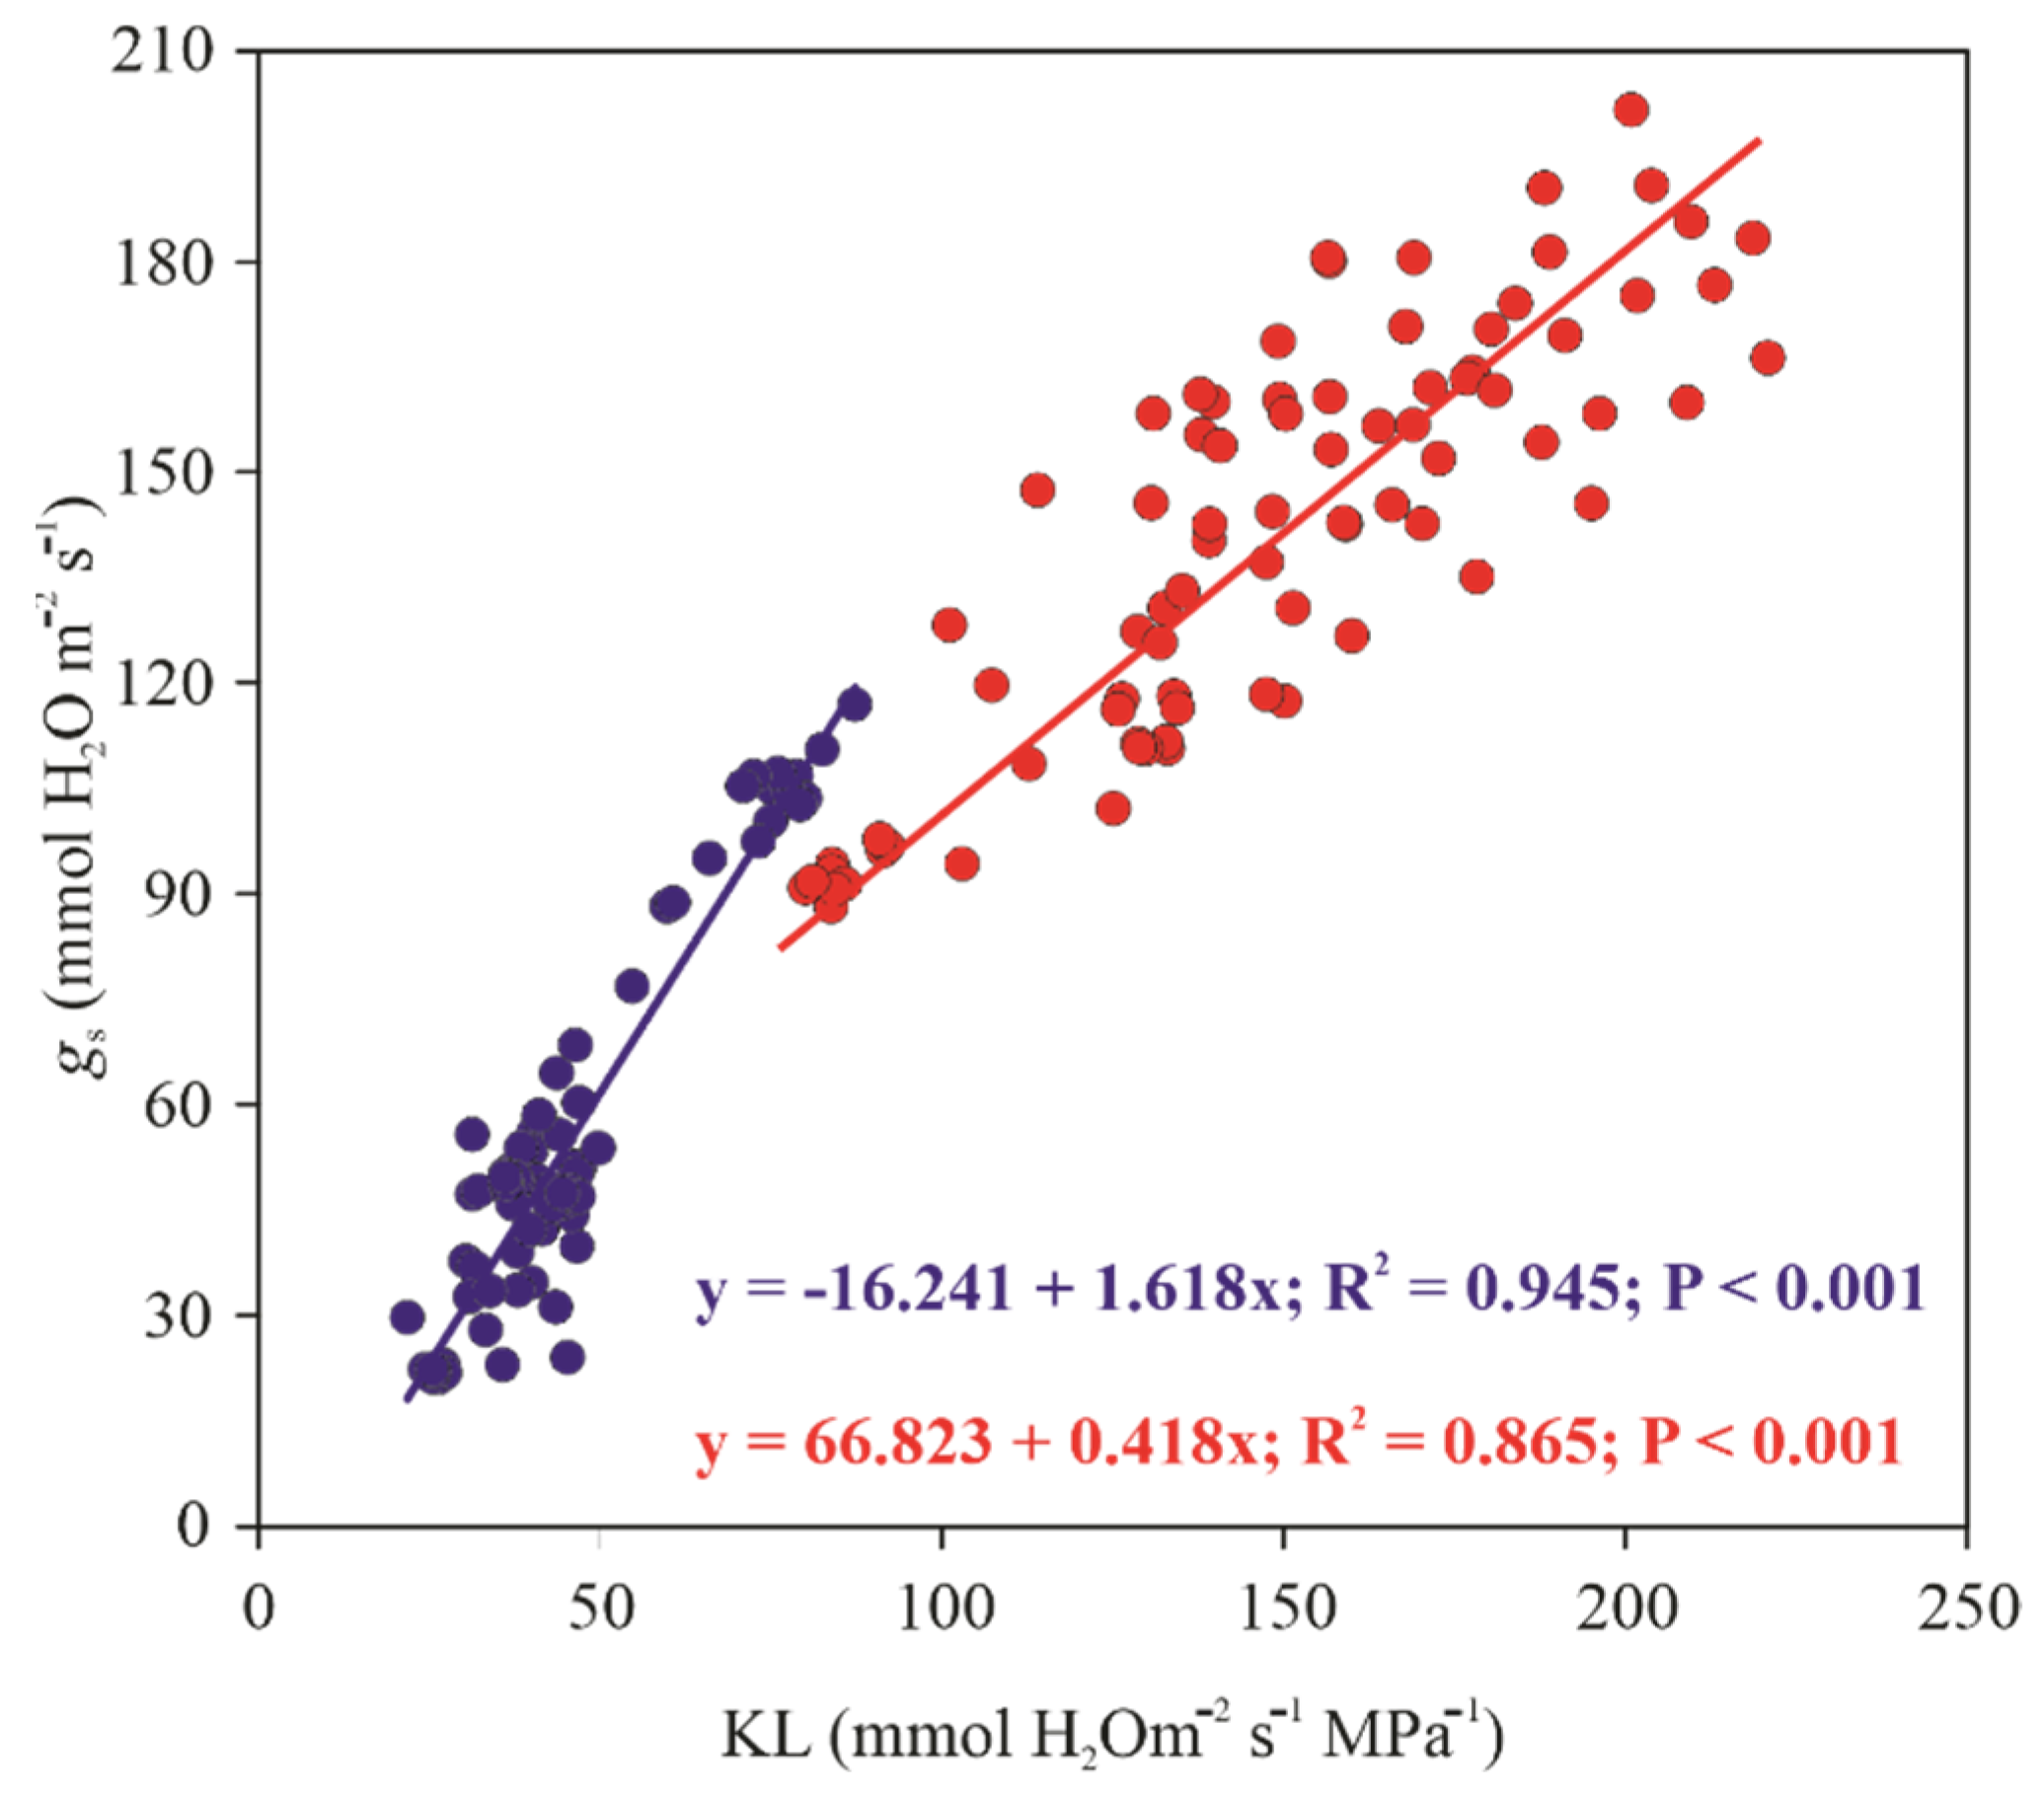
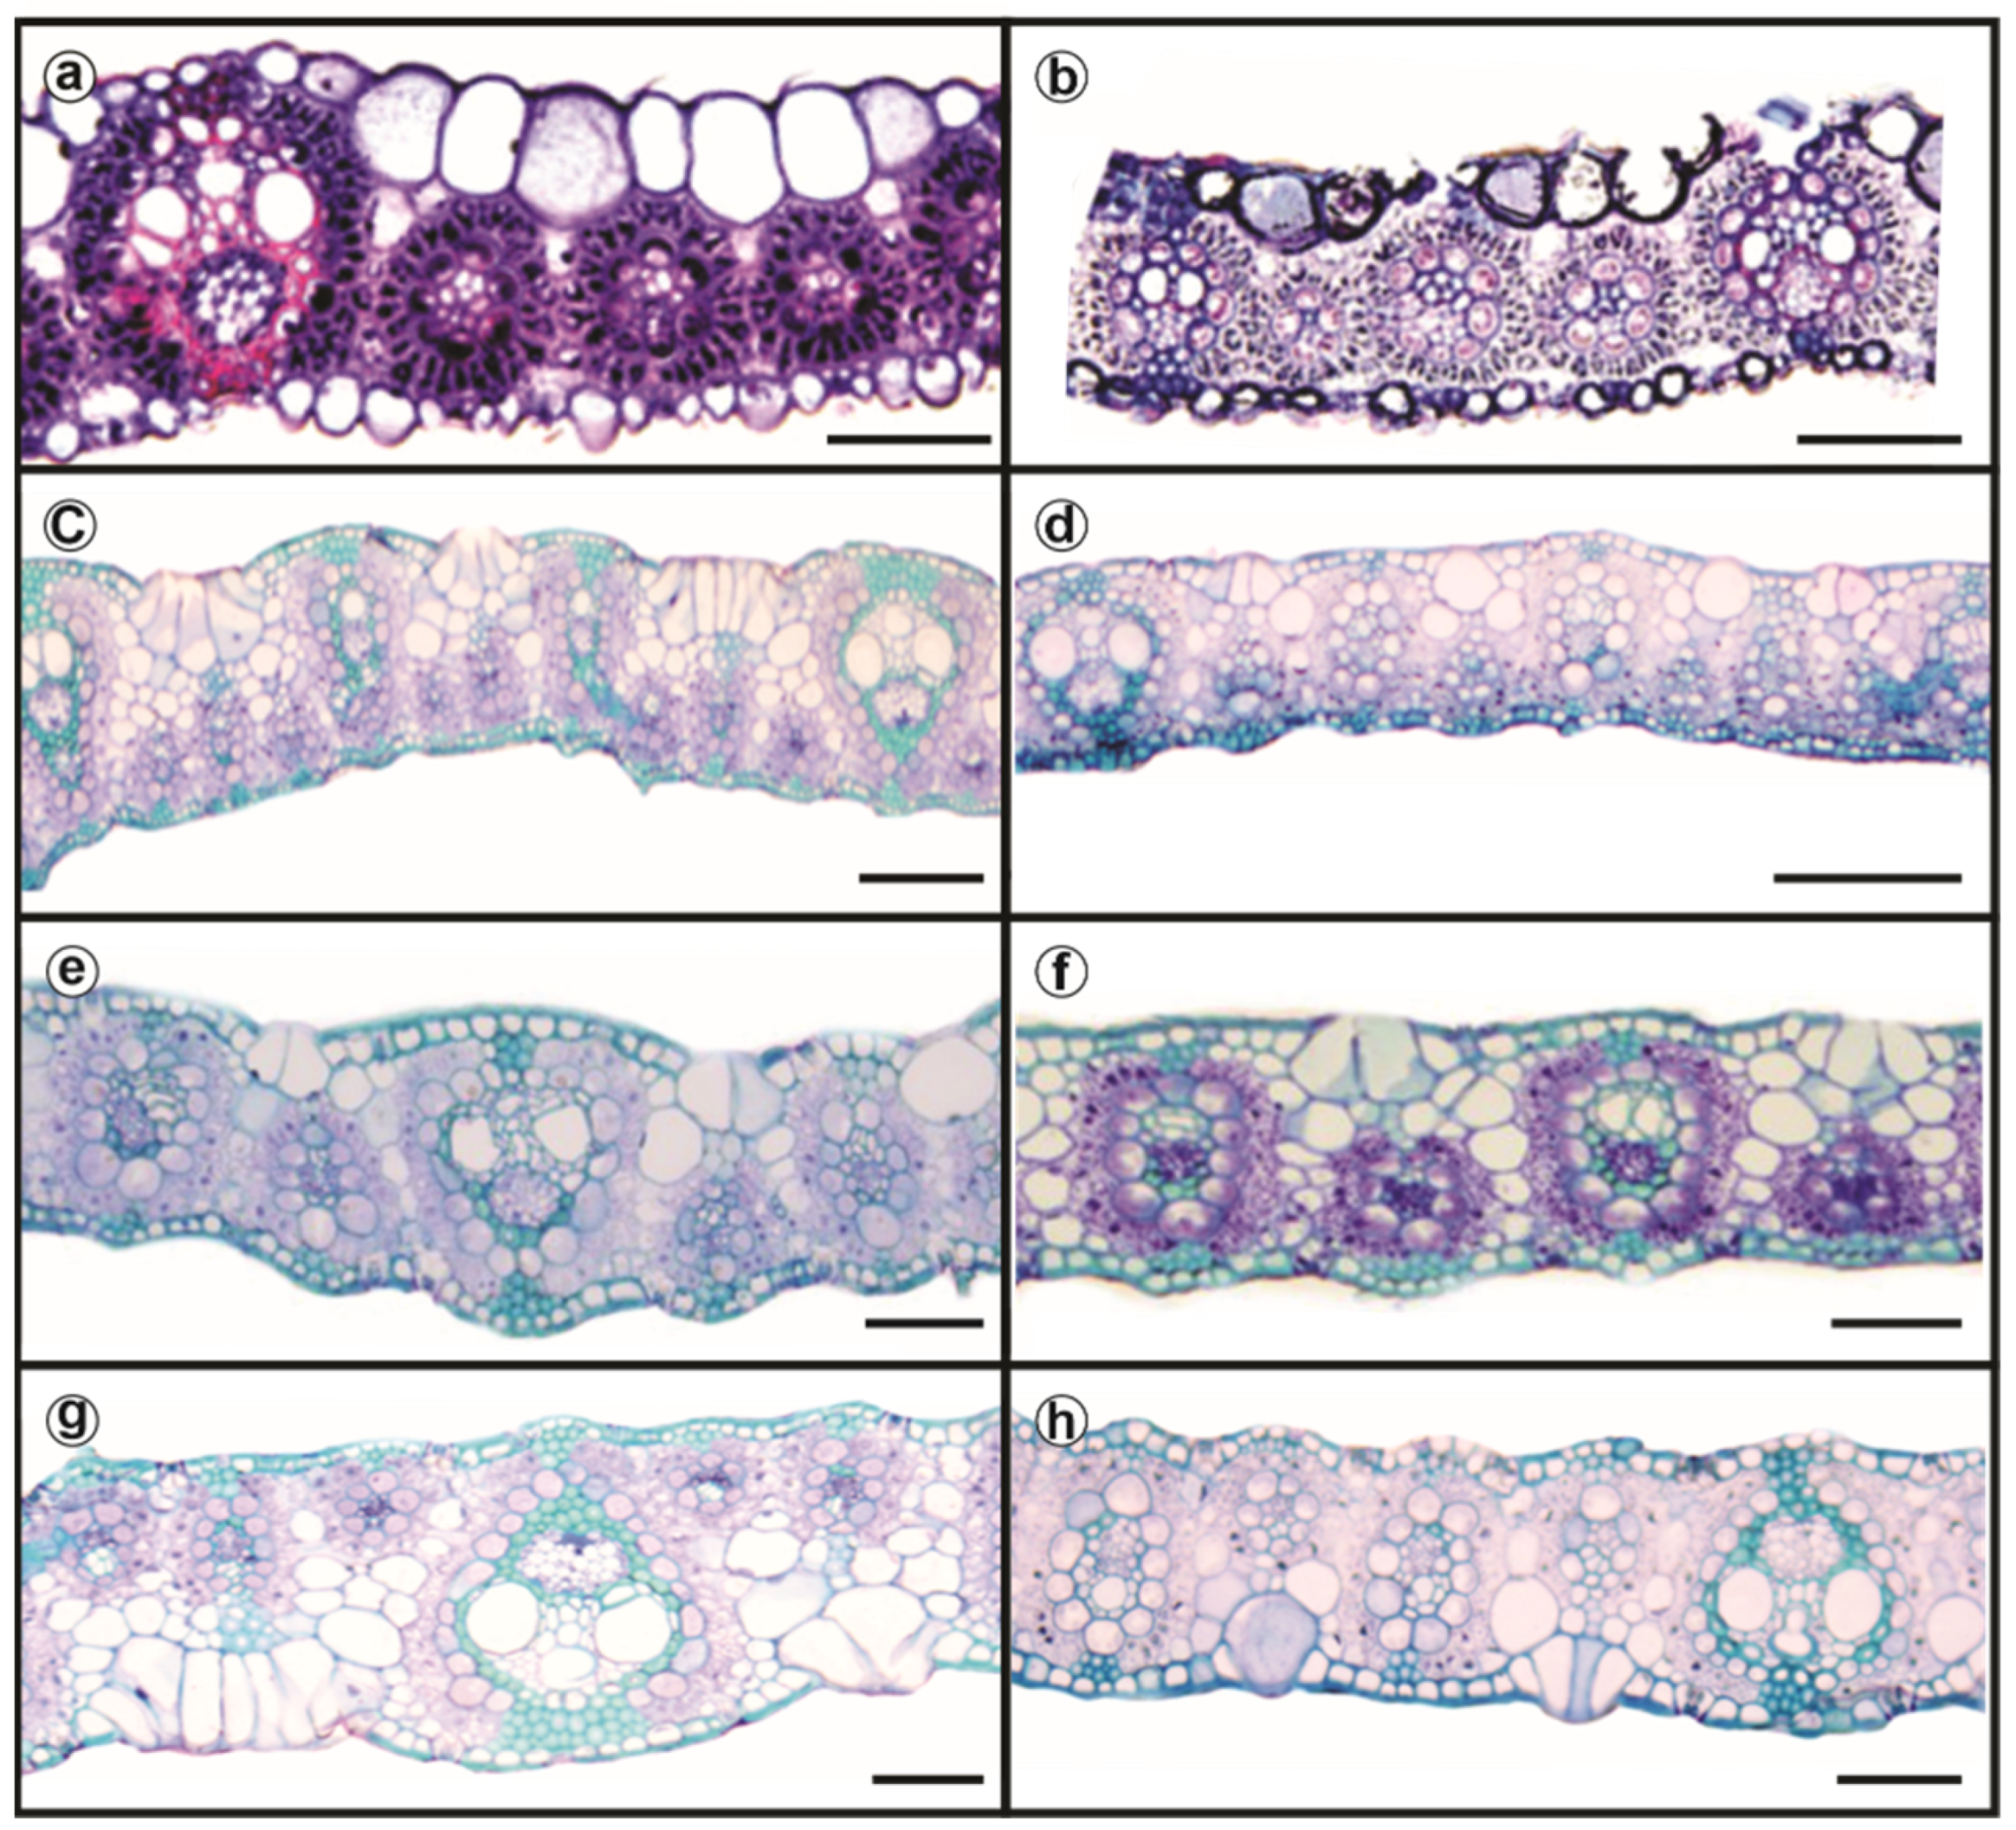
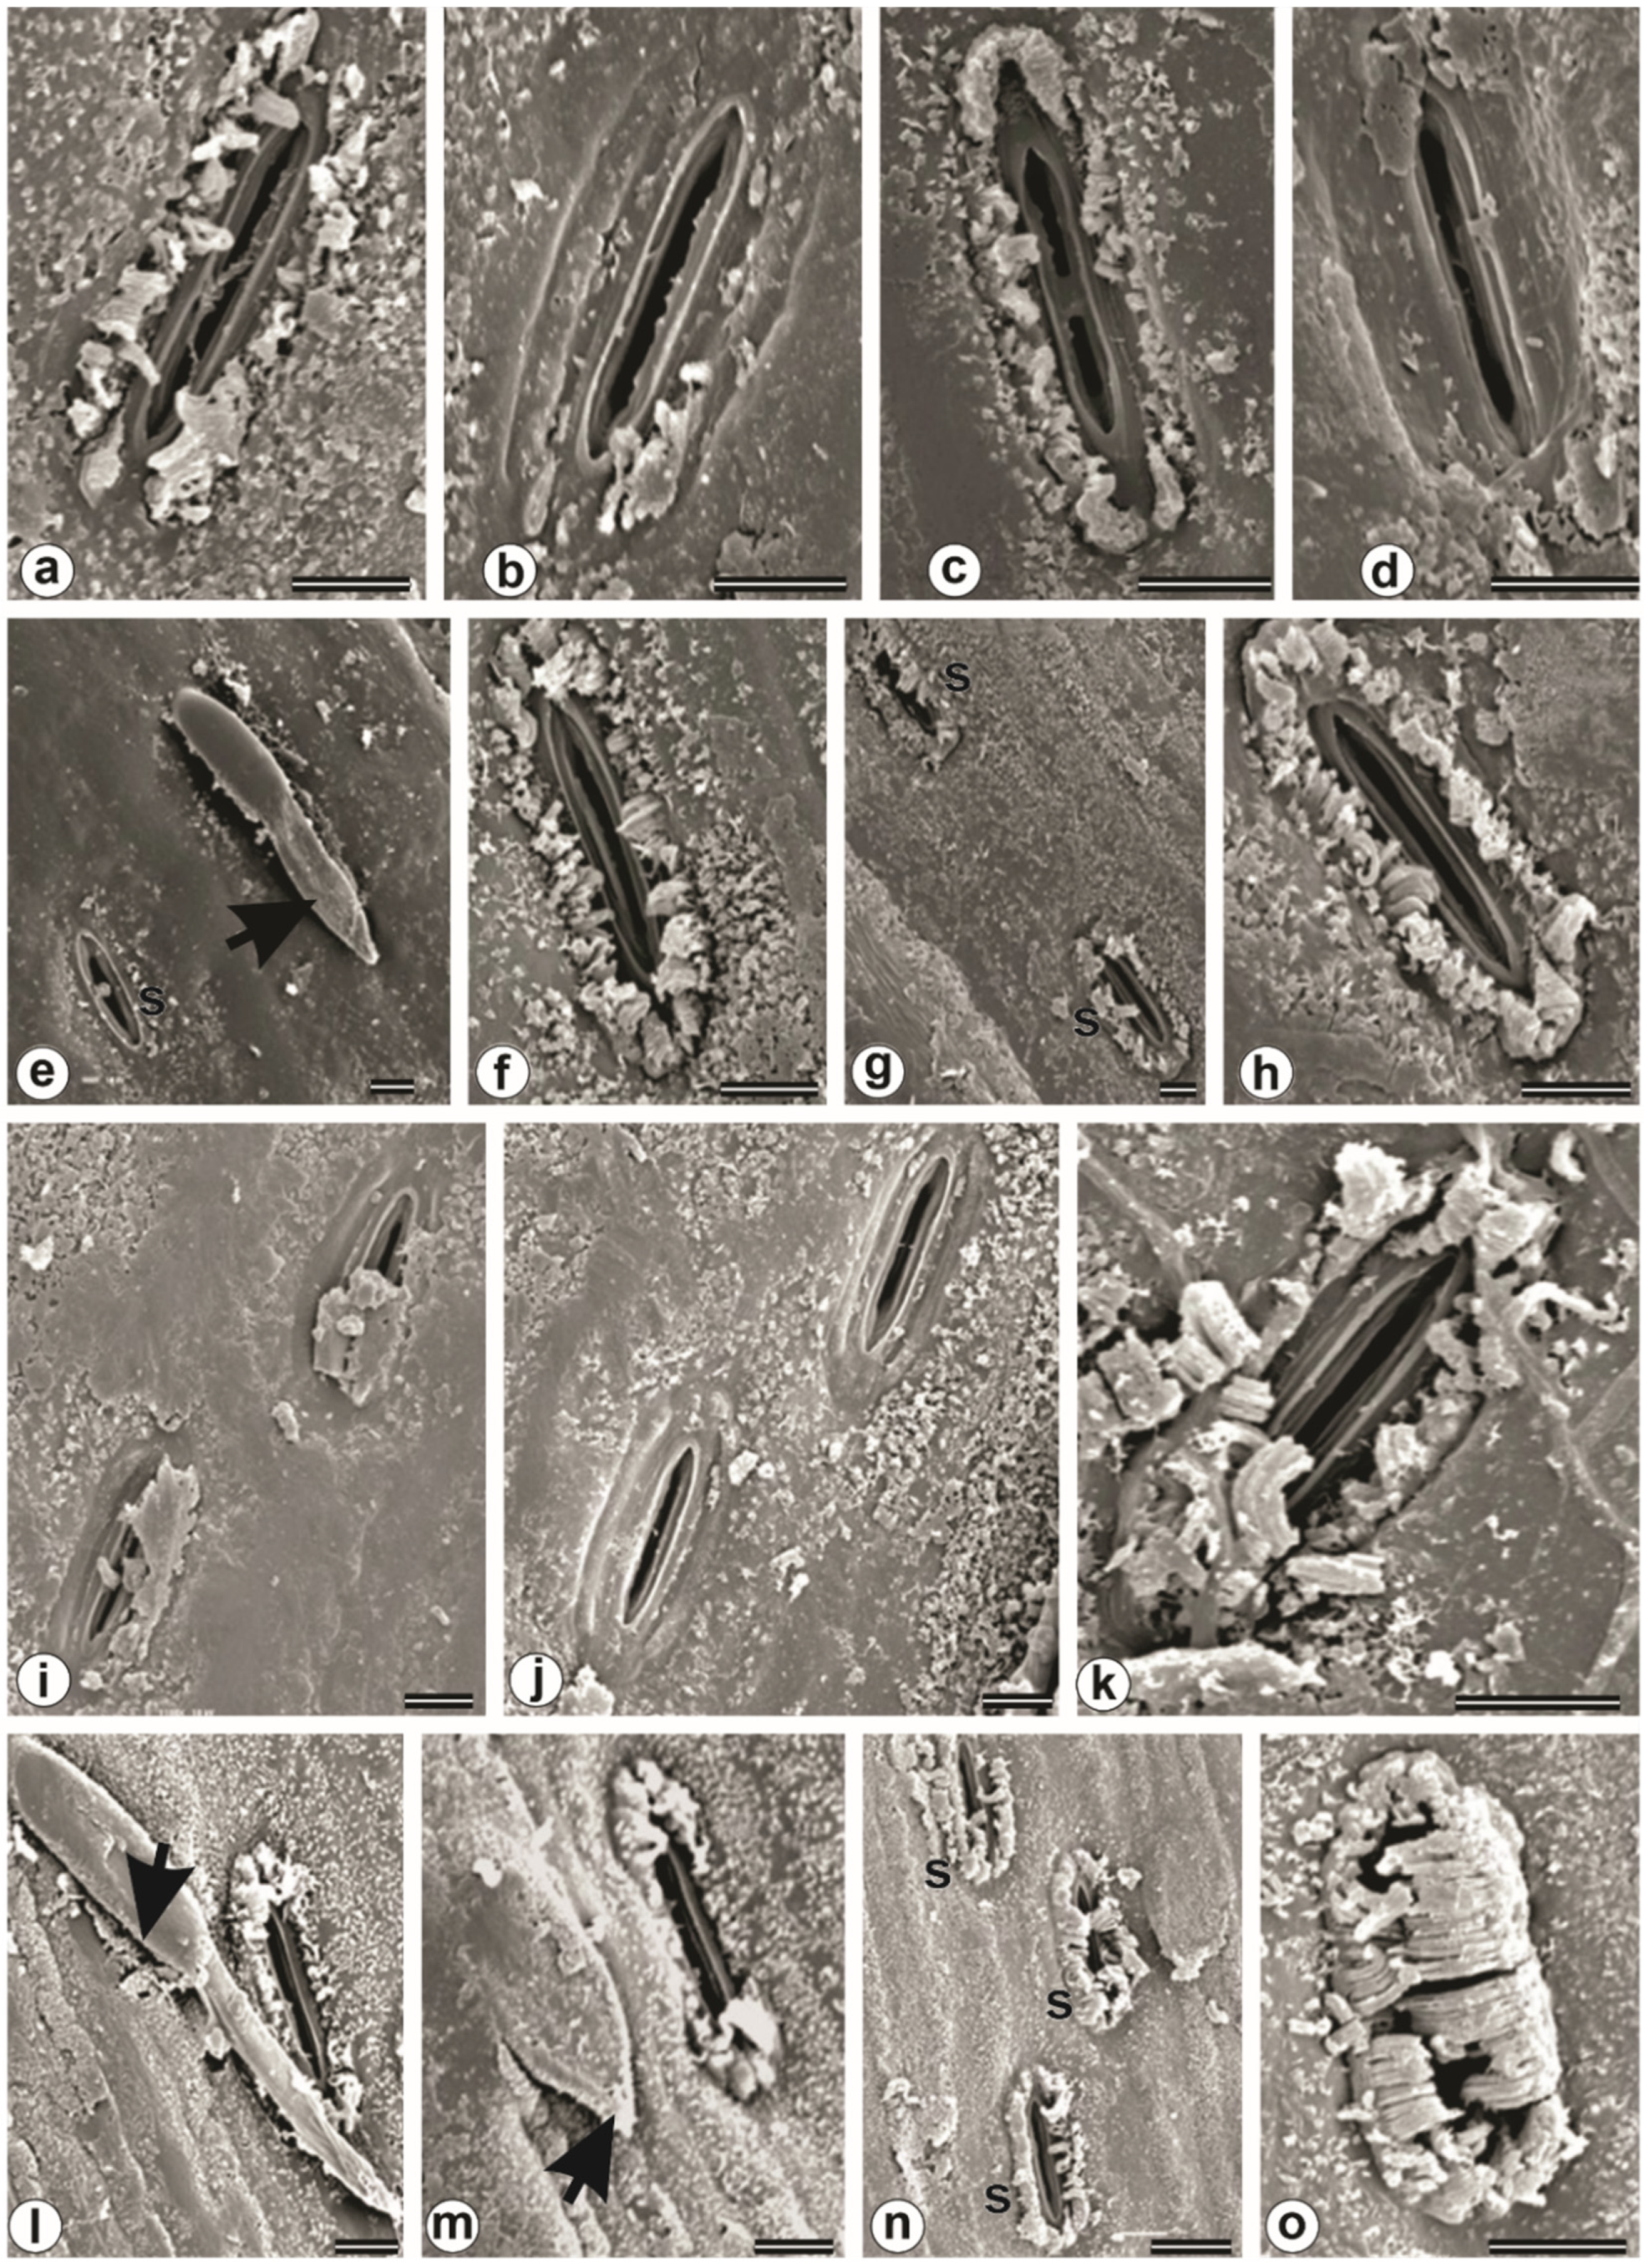
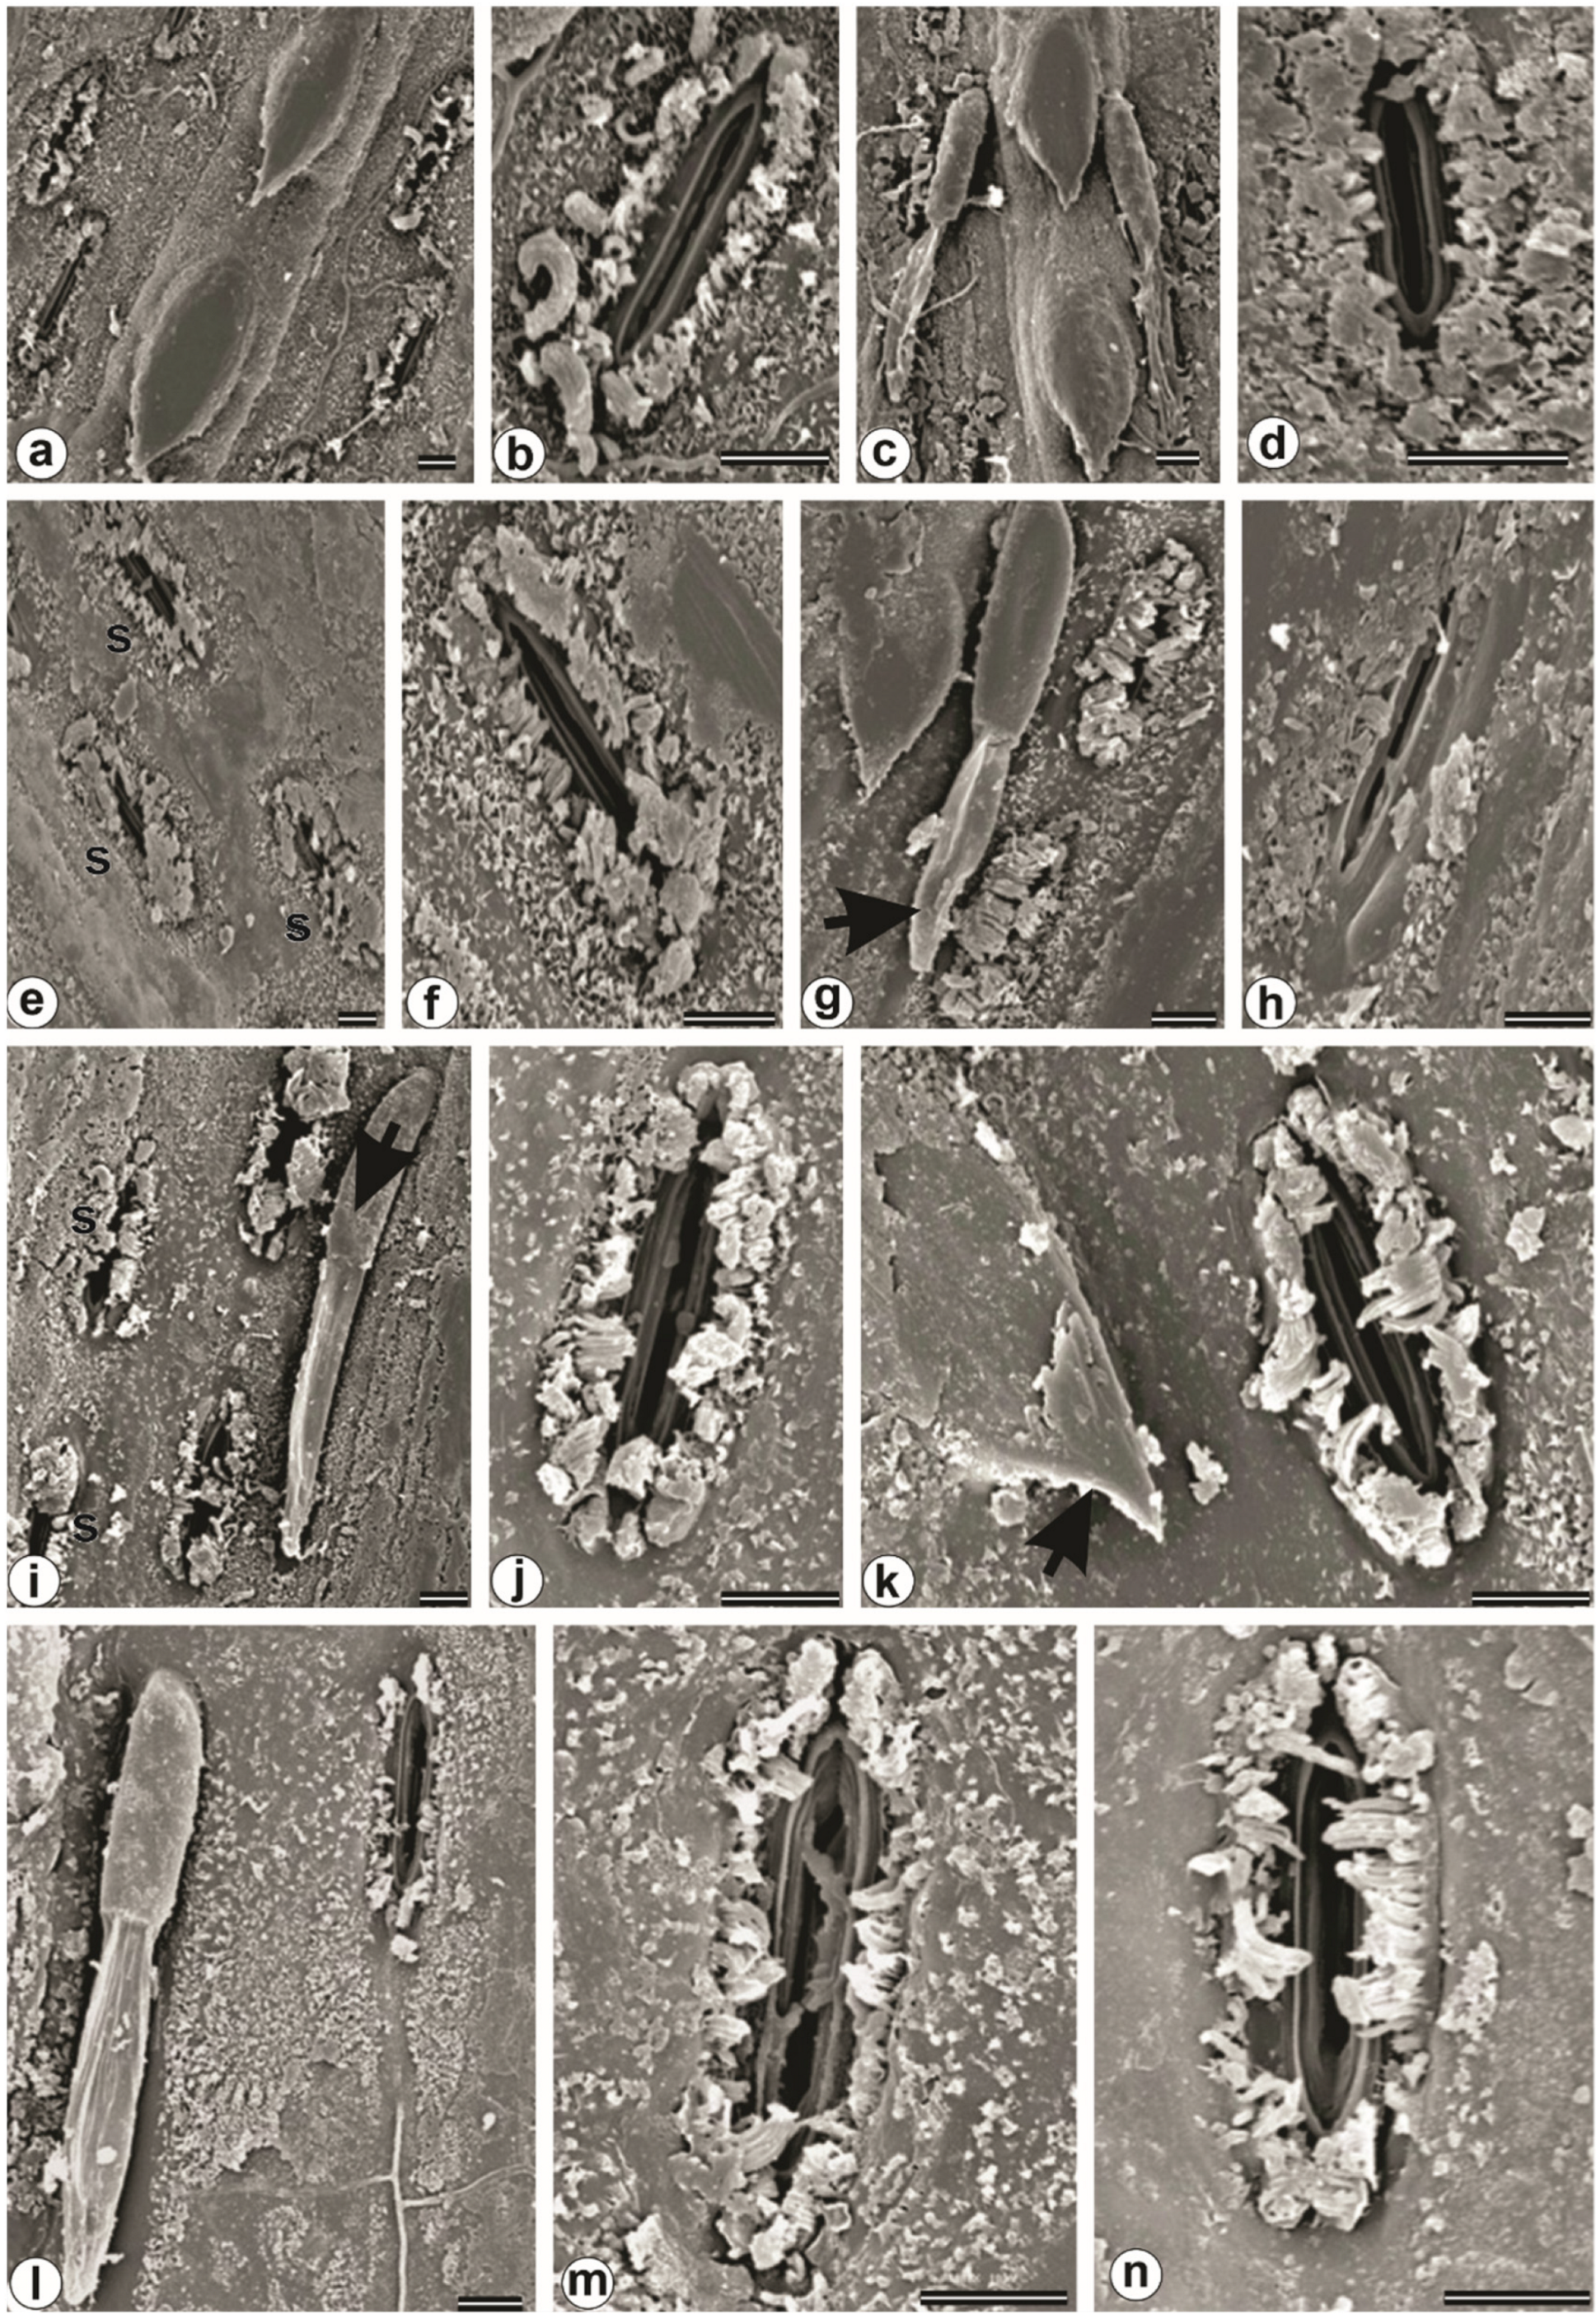
3.7. Plant Anatomy and Ultrastructure
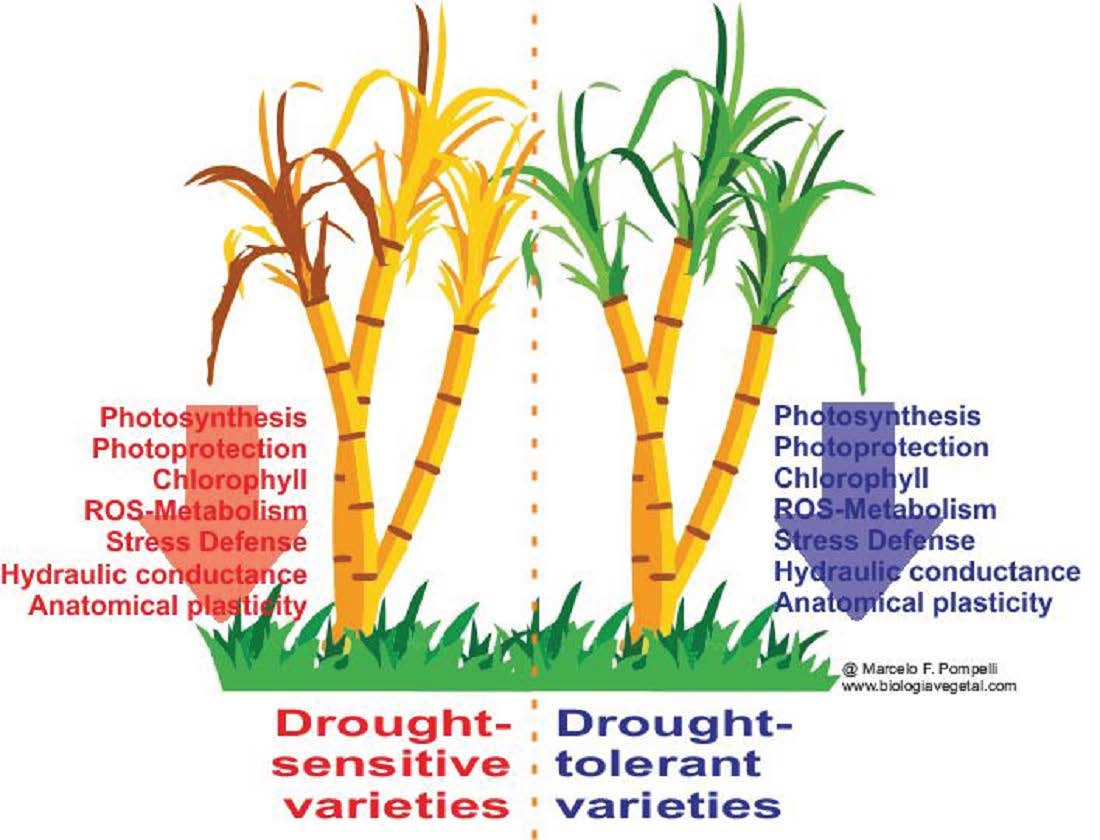
The total leaf thickness measured in dry season plants (Table 3) showed 15.1% (RB855536), 22% (RB72454), 24.1% (RB867515), and 25.8% (RB92579) thinner leaf thickness than the rainy season plants. Within the rainy season plants the variety RB72454 has leaf thickness being 14.7%, 27.8%, and 67.9% thicker than RB855536, RB867515, and RB92579, respectively. Within the dry season plants, the variety RB72454 presented a 7.1%, 29.7%, and 69.5% thicker than RB855536, RB867515, and RB92579, respectively (Table 3).
Morphologically, the transversally cut leaf (Figure 9) demonstrates that the leaf thickness is quite irregular, and, for this reason, we had to increase the sampling for leaf thickness measurement to 30 true repetitions instead of 10 as shown in Table 3. Regardless of that, were performed 20 measurements (false repetition) along with the leaf fragment to give more fidelity to the data. The leaf morphology has a characteristic pattern of the species of the Poaceae family, without a distinction between palisade and spongy parenchyma. It features very prominent bundle sheath cells arranged with 2–3 layers, where the second part of photosynthesis takes place. Mesophyll cells are rarely far from bundle sheath cells. In the epidermis, the presence of bulliform cells is quite common, which are large and favor thermal dissipation (more information, see Discussion).
Except for the variety RB72454, which presented an adaxial stomatic density (SDadaxial) of 7.85 ± 0.17 stomata mm−2 (rainy) and 6.62 ± 0.12 stomata mm−2 (dry) with a reduction of 15.7% in dry season than compared to rainy season, all other varieties presented a higher SDadaxial in dry season plants in this order: RB92579 (11.1%), RB867515 (17.1%), and RB855536 (25.6%). When comparing only between rainy season plants, the variety RB72454 showed an SDadaxial of 7.85 ± 0.17 stomata mm−2, a value that was 14.6%, 15.4%, and 20.7% higher than RB855536, RB867515, and RB92579 varieties, respectively. In another way in the dry season plants, the varieties RB867515 and RB855536 showed an average SDadaxial of 8.3 stomata mm−2, the varieties RB92579 and RB72454 showed an average SDadaxial of 6.9 stomata mm−2. A similar pattern was verified in abaxial stomatal density (SDabaxial), where the variety RB72454 showed no significant difference (reduction of 2.4%) between the rainy and dry season plants. In another way, the varieties RB855536, RB92579, and RB867515 had a moderate reduction in SDabaxial in the order of 10.6%, 11.5%, and 14.1%. When the comparison is made only between the rainy season plants, the RB855536 variety, showed an SDabaxial of 16.50 ± 0.22 stomata mm−2, a value that was 7.2%, 8.7%, and 14.7% higher than the varieties RB72454, RB867515, and RB92579. However, when the analyses are carried out between the dry season plants, there was a strong significant variation between the means, establishing the following sequence: RB855536 > RB867515 > RB92579 > RB72454.
The ostiole opening (OO) showed a similar pattern on both sides of the sugarcane epidermis. Thus, in the tolerant-like varieties, (RB92579 and RB867515) there was a decrease in 34.8% and 34.4% to OOadaxial and 21.2% and 9.1% to OOabaxial in dry season plants in comparison with rainy season plants. On the other hand, in sensitive-like varieties (RB855536 and RB72454), dry season plants showed an increase in ostiole opening in the order of 35% and 7.8% (OOadaxial) and 8.4% and 62.2% (OOabaxial). However, when comparing the OOadaxial only among the rainy season plants, the varieties RB867515 (5.36 ± 0.10 μm) and RB72454 (5.48 ± 0.18 μm) showed the highest OOadaxial. In another way the varieties RB92579 and RB855536 presented an OOadaxial 10.1% and 39.7% higher in relation to RB72454. When the comparison is only between the dry season plants, the RB72454 OOadaxial (5.91 ± 0.07 μm) was 11.6%, 68%, and 82.1%, respectively for RB855536, RB867515, RB92579. To comparison in the OOabaxial of rainy season plants, the variety RB855536 presented an OOabaxial of 5.93 ± 0.19 μm, a value that was 56.4%, 83.7%, and 149.8% higher than that registered in the varieties RB92579, RB867515, and RB72454, respectively. However, when the comparison is made only between the dry season plants, the variety RB855536 presented an OOabaxial of 6.43 ± 0.05 mm, a value that was 67%, 115.3%, and 119% higher than that registered in the varieties RB72454, RB92579, and RB867515, respectively.
Ultrastructural, the epidermis is quite rough with an expressive deposition of epicuticular wax, which is more prominent in the abaxial epidermis. As seen in Figure 10 and Figure 11, the epicuticular wax partially and sometimes even completely covers the stomata. Especially on the abaxial face, the leaf showed a strong increase in fiber concentration.

4. Discussion

4.1. Physiological and Biochemical Features

Abiotic stress, such as drought stress, high salt, extreme temperature, and heavy metal toxicity, frequently leads to oxidative stress. In the present study, physiological, biochemical, enzymatical, leaf anatomical, and ultrastructural features were analyzed with sugarcane varieties to understand the drought-tolerance mechanism responses when they were exposed to the rainy and dry seasons. It is known that gas exchange variables and plant ecophysiology have a suitable correlation with each other and may help to identify genotypes with drought-tolerance characteristics [18,20]. Leaf Ψwpredown is directly related to soil water potential, which in times of drought leads to a reduction in plant water potential, which can indirectly lead to a decrease in stomatal conductance [27]. When the objective is to compare the capacity of a plant to recover after a water stress event, the measurement of the Ψwpredown is the most indicated; moreover, when the purpose is to measure the degree of impact of the abiotic stressor, it should consider the Ψwmidday. The fact that all varieties recovered their Ψwpredown suggests that all varieties could be considered slight or mildly drought tolerant. However, the fact that the variety RB867515, considered by many authors as resistant [20,37,38], presented a 2.61-fold higher Ψwpredown in the dry season plants when compared to the rainy season is very interesting. To make a comparison, the variety RB855536, which, unlike the previous one, is considered as sensitive, the potential was modulated by 0.64-fold, i.e., Ψwpredown of dry plants was higher than that of wet plants.
For photosynthesis to start, it is necessary to have light that is captured by leaf chlorophyll and carotenoid molecules [39]. However, in situations of abiotic stress, two ways can happen to protect the plant from the excess of captured photons: (1) adjustments in light capture, use, and dissipation are required to provide photoprotection to the photosynthetic apparatus, particularly under full sunlight, a process called photobleaching; (2) increase in the concentration of carotenoids, which act more intensely in the dissipation of heat and fluorescence as it was observed to affect the major protective carotenoids and antioxidants [40,41,42]. Commonly, the chlorophyll content of drought-sensitive varieties showed a more decline than those of drought-tolerant varieties [39,42]. The data presented in this study contradicts this description because, in chlorophyll a, the drop is moderate, while in chlorophyll b does not show a statistical difference between tolerant and sensitive sugarcane plants, reflected in the level of chlorophyll a + b, which does not shows the statistical difference between tolerant and sensitive sugarcane plants. It should be noted that Devi et al. [42] did not measure the concentration of chlorophyll by a standard method, instead measured the intensity of green through the SPAD, a very old technique that is currently in disuse.
Net photosynthesis is the preferred pathway for electrons under optimal conditions; however, PN is extremely sensitive and decreases more rapidly than ETR. Under stress condition and this promotes an increase in the ETR/PN ratio, which indicate that energy compromise takes place, and thus, it can be linked to ROS production [43]. ETR/PN ratio reflects the energy transfer to PN and an increase in this ratio, as noted in water-stressed sugarcane, indicates that alternative electron sinks most likely increased due to the stressful conditions [43]. When ETR/PN is correlated with gs, a lesser ETR/PN ratio denotes better use of electrons for photosynthesis, indicating high efficiency of radiation use by carbon assimilation reactions [18,43]. In another way, the higher ETR/PN ratio led to inferring that other pathways than photosynthesis using the electrons that are being transported by the photosynthetic electron transfer system (PETS) to NADP+. Figure 12 clearly shows this hypothesis, since the tolerant varieties (RB92579 and RB867515) showed higher ETR/PN values, even with low gs values, while the sensitive varieties (RB855536 and RB72454) showed intermediary-to-high ETR/PN at the expense of higher gs.
Dos Santos [20] suggests that lower KL with lower sap flow may be translated to stomata closing since the plants, even if the atmosphere is dry and with very negative water potential or more, accumulated ABA. ABA not only directly mediates stomatal closure (chemical signaling) but also systemically decreases (KL) upstream of the stomata [44]. This work showed that KL has a strong influence on gas exchange, significantly and positively influencing PN (r = 0.843; p = 2.19 × 10−44), gs (r = 0.885; p = 2.18 × 10−54), and E (r = 0.762; p = 2.27 × 10⁻³¹), while it is reduced by lowering the Ψw (r = 0.262; p = 0.03) and rainfall (r = 0.595; p = 1.85 × 10⁻³). The lowering of KL in the same proportion is hardly discussed previously in this specie [20].
The main sap flow in 24 h tended to be more favorable to drought tolerant-like (RB92579 and RB86715), which shows 265.95 g H2O plant−1 h−1, while the sensitive-like drought (RB855536 and RB72454) varieties showed 189.5 g H2O plant−1 h−1, a reduction of 28.8% in sap flow around 24 h of measurement. Noteworthy that even in the rainy season, the anticipation of drop sap flow in the RB855536 should be a safe water strategy, corroborating other measurements that pointed to this variable as more intermediary than sensitive to water deficit. A wide range of literature covers that high VPD commands the water loss by leaf through stomatal conductance or transpiration [18,38,45,46] that leads to the increased sap flow. If it is true, many correlations may be translated as VPD and gs (r = −0.638; p = 1.14 × 10⁻¹⁹) or E (r = −0.286; p = 0.019), impacting to lower KL (r = −0.532; p = 4.67 × 10⁻¹³), which is provoked lower gs (r = 0.885; p = 2.18 × 10−54), that along soil-plant-atmosphere was provoke a lesser Ψw (r = −0.857; p = 2.77 × 10−47). These correlations confirm our hypothesis that higher VPD supports higher stomata pressure (r = 0.937; p = 5.07 × 10−96) that requires higher KL, which should exert strong pressure on the sap flow; but, this does not happen because the soils are dry with very negative water potential (mean Ψw = −2.14 MPa and −1.31 MPa, respectively, in dry and rainy plants evaluated in the MD). These features may lead to cavitation, which leads to inhibit the sap flow in the cavitated vessel.
The Fv/Fm ratio is often used as an indicator of the degree of photoinhibition in PSII [47]. We believed that the lower predawn Fv/Fm, particularly in dry season plants, may be partially associated with sustained xanthophyll cycle-dependent thermal energy dissipation, as previously reported in Coffea arabica [41], Alpinia oxyphylla [48], Cicer arietinum L. [49], and Spondias tuberosa [50] plants. In this study, we only measured total carotenoids, where plants of the RB855536 had the lowest Fv/Fm ratio but linked to the highest Car/Chl ratio (0.65 ± 0.02) which was 1,6-, 2.1, and 2.1-fold higher than RB92579, RB72454, RB867515 varieties, respectively. The correlation between Car/Chl ratio and rainfall was strongly negatively correlated (r = −0.741; p = 1.36 × 10⁻⁸). In the same way, the Car/Chl ratio was strongly and negatively correlated with PN (r = −0.698; p = 1.08 × 10⁻¹³). Summarily, it can be considered that RB855536 genotype, even with a lower Fv/Fm ratio, did not have their photosynthetic and hydraulic apparatus negatively affected, since the predawn potential was 62% higher in the dry season in comparison with the rainy season, which in part can be explained by the anticipation of the decrease in sap flow (Figure 5). Thus, during the hottest moments of the day, these plants reduce their sap flow, causing a stomatal closing affecting the high magnitude in dry season plants (Figure 8). The mechanisms that command this modulation could have the higher concentration of Car/Chl ratio, or the higher ΦPSII, since higher the ΦPSII reduce the mandatory dissipate heat, promoting a security thermal dissipation. These hypothesis gives more strength by positive correlation with Fv/Fm ratio and Chl a (r = 0.522; p = 7.03 × 10⁻⁷). The antioxidative enzymes also corroborates this hypothesis, where Fv/Fm ratio and SOD (r = −0.758; p = 3.71 × 10⁻¹⁶), CAT (r = −0.546; p = 1.37 × 10⁻⁷) and proline (r = −0.694; p = 9.53 × 10⁻¹³) had strong negative correlations.
Less rainfall impacts more synthesis of proline (r = −0.802; p = 9.94 × 10⁻¹¹), where proline synthesis is provoked by less PN (r = −0.828; p = 2.70 × 10⁻²¹), gs (r = −0.592; p = 7.58 × 10⁻⁹), ETR (r = −0.841; p = 1.68 × 10⁻²²), ΦPSII (r = −0.668; p = 1.25 × 10⁻¹¹) and had a very strong participation in the increase activities of antioxidant enzymes, like SOD (r = 0.722; p = 1.96 × 10−37) and CAT (r = 0.841; p = 3.93 × 10−61). In accordance with Naheed et al. [39], the degree of tolerance to drought stress is strongly correlated with the increase in the concentration of proline. In the present study, the sugarcane varieties RB92579 and RB855536 showed an increase in proline to ~53% and ~72%, translated to low production of MDA than the other two sugarcane varieties. Here, we reported that under water stress, some proteins can be cleaved, increasing the level of amino acids that could be important in osmoregulation or used as building blocks to generate other types of proteins, such as membrane proteins, defense proteins [18,51], or used as a carbon source to maintain the cellular respiration and ATP synthesis [18,51]. Furthermore, contrary to Dos Santos et al. [20], here, we described the most recent version of the role of proline, not as an osmoprotectant but as a stress preventer as reported by others [2,39,52] that defends the proline synthesis as a consequence of stress. In this way, the synthesis of proline comes from an alternative route of metabolizing glutamate, which is phosphated by 1 mole of ATP and reduced to proline from the consumption of 2 moles of NADPH, by activity of glutamate dehydrogenase and pyrroline-5-carboxylate reductase, which uses one mole of FADH2 as a cofactor. Consequently, a stressed plant tends to proportionally reduce the stomatal opening, which limits the input of CO2. With less CO2 in the system, the Calvin-Benson cycle is compromised, and the ATPs and NADPHs that formed and continue to form through the PETS remain in their reduced form [18]. At the end of the PETS, ATP and NADPH were reduced and remained in the reduced form because the Calvin-Benson cycle is operating at the lowest potential oxidizing less ATP and NADPH. Once these molecules are reduced, there are no oxidized forms of them to receive more electrons that come from the PETS, and these would be quickly captured by O2, forming the terrible reactive oxygen species (ROS) [53]. So, proline may have strong importance because it acts as stress prevention than osmoregulation.
Superoxide dismutase forms the very first line of defense against reactive oxygen species. Naheed et al. [39] describe the higher activity of SOD in drought-sensitive sugarcane plants as described in this study. Strong evidence for the role of chloroplast SOD has been shown from the interruption of PETS by methyl viologen [39]. After that, intense SOD activity was verified, both directly measuring the activity of the enzyme and indirectly by the production of H2O2. The latter can inactivate PETS, generating even more H2O2. In accordance with these authors, the restriction of electron transport from PSII to NADP+ may cause the total interruption of PETS by peroxidation induced by ROS. The highest antioxidative enzymes are inversely proportional to the damage caused by oxidative stress in sugarcane as previously described [39] and reported in this study were less precipitation increase in SOD (r = −0.756; p = 4.51 × 10⁻⁹), CAT (r = −0.775; p = 1.03 × 10⁻⁹), and APX (r = −0.248; p = 0.011) activity. To prevent the deleterious effect of H2O2 produced by SOD, CAT and APX promote the dismutation of this molecule as H2O + O2. To plant defense, the activity of APX is a better choice than CAT [54] because while CAT only dismutates H2O2 into H2O + O2, APX needs the reduced ascorbate as a cofactor. In the recycling of ascorbate, the cycle will need monodehydroascorbate, which is reduced to ascorbate with the spend of 1 mole of NADPH to contribute as another line of defense as it acts to prevent ROS production. So, the APX act in two ways: promoting reoxidation of NADPH and dismutating H2O2. Thus, it is expected that the activity of APX is more efficient in plants under severe stress since the synthesis of ascorbate is a costly process for the plant. In plants with a lower degree of stress, the APX activity is expected to be overwhelmed by the CAT activity. This hypothesis is also described here since genotypes RB867515 and RB72454 showed an increase in CAT activity by 34.3% and 15.8%, while APX activity in these same two varieties was decreased by 7.3% and 28.8%.

4.2. Morphological, Anatomical, and Ultrastructural Features

Circumstantial evidence that the lower photosynthetic rates verified in the tolerant varieties may not be exclusively linked to the stomata, but the greater leaf thickness, around 30%, in the tolerant varieties compared to the related varieties. However, less transpiration in the tolerant varieties may have been caused by the presence of bulliform cells on the adaxial surface of the epidermis (Figure 9) compared to sensitive varieties. Larger bulliform cells facilitate leaf curling [55], allowing the abaxial, the more hairy, reflective, and stomata-bearing surface to become sun-facing (Figure 11) [55,56]. Our SEM micrograph is supported by the description by Kadioglu et al. [55] since the abaxial face, easily exposed in the case of tolerant varieties, with a marked presence of epidermal hair trichomes and hook-shaped trichomes (Figure 10 and Figure 11). Furthermore, the more prominent arrangement of bulliform cells in the tolerant varieties presented in this study corroborates previous studies with the species [57,58]. These authors described that bulliform cells are often located slightly above the level of other epidermal cells. Regardless of this, it is known that the size and height of epidermal cells and their accessory structures are related to ecological aspects, presenting responses to environmental changes [55].
The cuticle that covers the leaf is nearly impermeable to CO2, so the main input of CO2 into the leaf is the stomatal pore, hampered by epicuticular waxes and hydrophobic by nature. Even with the intense activity of carbonic anhydrase (EC 4.2.1.1), CO2 has difficulty in permeability to the substomatal chamber. The lower stomatal conductance of the tolerant varieties may be due not only to the lower degree of stomatal opening in these varieties but also to the remarkable deposition of waxes around and on the stomatal pore, which is significantly higher in the tolerant varieties compared to the sensitive ones as previously reported in sensitive and tolerant wheat varieties [59]. Studies with Nicotiana glauca [60], Carex hirta [61], and sugarcane [62] also described the influence of wax deposition on the stomatal pore. The cuticular layer can vary widely in its ultrastructure and the number of cuticles deposited on leaves [63]. The cuticle consists of two types of lipophilic substances: cutin and cuticular waxes (intracuticular or extracuticular). These waxes can crystallize and leak out of the cuticle giving the surface a grainy or ornate appearance [64].
Zan et al. [4], studying 236 sugarcane accessions, including 13 Brazilian accessions, described many characteristics to search elite accessions, to be cultivated because they present characteristics of agronomic interest and from the point of view of molecular biology. However, de Paula et al. [65], studying the establishment of gene pools for systematic heterosis exploitation in sugarcane, indicated that 7 of 13 accessions studied by Zan et al. [57] are no longer cultivation in Brazil, data that is corroborated by other studies [6,66,67,68]. While RB83-5054 cultivation in Brazil is currently inadvisable [65], both RB85-5113 and SP80-181 currently is used as mother parents in crop breeding programs, and SP81-3250 is currently used as father parents in crop breeding programs. Table 4 summarizes this information and shows the expected sugarcane Brazilian production of SP80-1816, SP80-3280, SP81-3250, and SP83-2847 genotypes in 2021 when compared to 2020 cultivation. The genotypes RB92579 and RB867515 have been detached, with 3% and 26.4% more harvested in 2021 when compared to 2020 (Table 4). Apart from genotypes described by de Paula et al. [58], Carneiro et al. [69] describe another Brazilian cultivar with high agroindustrial yield and disease resistance.

5. Conclusions

As signaling of stress-tolerant plants is the very first priority of the researchers. In the current study, employing sugarcane, the physiological strategy involving gas exchange, fluorescence parameters, sap flow, water potential, and biochemical and enzymatic features linked to drought stress were evaluated. In addition, morphological, anatomical, and ultrastructural features allow us to assess how the growth and tolerance of sugarcane behave to low rainfall and how these same variables are modulated when the plant receives a higher rainfall.
So, our data support that sugarcane productivity is largely affected by photosynthesis, and the identification of the most photosynthetically efficient variables under water stress conditions is extremely important. So, sugarcane plants must be continuously improved to produce more sugar per square meter and be less affected by environmental stressors.
The data presented here support the idea that the RB92579 genotype is drought tolerant, as well as RB867515, and introduce the RB855536, as a tolerant-like, due to its high capacity to increase its antioxidant system to cope and protect the PETS from ROS, disruption, and less level of MDA, even so, many characteristics lead RB855536 to drought tolerance.
The morphological features gave us confirmation that sugarcane under water stress produced smaller leaves, with shorter plants and a large increase in the bulliform cells that help the leaf curl, which allows it to expose its abaxial face, which has a higher concentration of reflective trichomes and hook-shaped trichomes.
The anatomical features confirmed that all physiological and biochemical features could be translated to an anatomical modulation, like thinner leaves, as a strategy to promote latent heat loss. Linking this idea with gas exchange parameters permits us to infer that the lower net photosynthesis in dry season plants could be a result of thinner leaves because the gas exchange parameters are given in m−2 s−1, so a thinner leaf, with less photosynthetic tissue per square meters, could be underestimating of net photosynthesis.
We confirmed the hypothesis that the sugarcane, as well as the connected soil-plant-atmosphere plant, could be modulated by some features. To complete this idea, we measured each degree of each physiological, biochemical, morphological, anatomical, and ultrastructure feature that has an plant acclimation to stress. To our surprise, all these features contribute to plant plasticity and modulation of water deficit. This dataset can be uploaded in Supplementary File S2.

Supplementary Materials

The following supporting information can be downloaded at: https://www.mdpi.com/article/10.3390/horticulturae8111069/s1, Supplementary File S1: The Supplementary S1 shows us day-by-day rainfall registered in Campo Alegre city—between 1999, January and 2020, December; Supplementary File S2: Plasticity index (PI) of physiological, biochemical, morphological, and ultrastructural features measured in four varieties (RB92579, RB867515, RB855536, and RB72454) of sugarcane. Numbers in bold denote the mean (±SE). Supplementary Data File: Correlation matrix showing all pairwise correlations between physiological, morphological, and ultrastructure features. The color code following the scale. An asterisk (*) denotes significant correlation (p < 0.05).

Author Contributions

All authors contributed equally. All authors have read and agreed to the published version of the manuscript.

Funding

This research does not receive any financial input.

Institutional Review Board Statement

Not applicable.

Informed Consent Statement

Not applicable.

Data Availability Statement

Not applicable.

Acknowledgments

The authors thank the Facultad de Agronomía, Universidad de Córdoba, Montería, Colombia, for permitting experiments and the anonymous reviewers that improved this paper. The authors thank Laurício Endres (Federal University of Alagoas, Maceió, AL, Brazil) for all farm and laboratory assistance in giving us an opportunity to develop this study in Alagoas state. The first author extends special thanks to Tatiana Hertel Pinto for technical assistance and for revising this manuscript before submission.

Conflicts of Interest

The authors declare no conflict of interest.

References

  1. Beekma, J.; Bird, J.; Mersha, A.N.; Reinhard, S.; Prathapar, S.A.; Rasul, G.; Richey, J.; Van Campen, J.; Ragab, R.; Perry, C.; et al. Enabling policy environment for water, food and energy security. Irrig. Drain. 2021, 70, 392–409. [Google Scholar] [CrossRef]
  2. Gaber, A.A.; Abou-Hadid, A.F.; El-Gabry, Y.A.; Ebid, M.H.M. Morphological and physiological study for sugarcane early selection to drought tolerance. Plant Arch. 2021, 21, 1935–1944. [Google Scholar] [CrossRef]
  3. Pompelli, M.F. Benefits and harms of wastewater in agriculture. Acta Sci. Agric. 2021, 5, 112–113. [Google Scholar] [CrossRef]
  4. Zan, F.; Zhang, Y.; Wu, Z.; Zhao, J.; Wu, C.; Zhao, Y.; Chen, X.; Zhao, L.; Qin, W.; Yao, L.; et al. Genetic analysis of agronomic traits in elite sugarcane (Saccharum spp.) germplasm. PLoS ONE 2020, 16, e0253363. [Google Scholar] [CrossRef]
  5. Flack-Prain, S.; Shi, L.; Zhu, P.; Rocha, H.R.; Cabral, O.; Hu, S.; Williams, M. The impact of climate change and climate extremes on sugarcane production. GCB Bioenergy 2021, 13, 408–424. [Google Scholar] [CrossRef]
  6. Cursi, D.E.; Hoffmann, H.P.; Barbosa, G.V.S.; Bressiani, J.A.; Gazaffi, R.; Chapola, R.G.; Junior, A.R.F.; Balsalobre, T.W.A.; Diniz, C.A.; Santos, J.M.; et al. History and current status of sugarcane breeding, germplasm development and molecular genetics in Brazil. Sugar Tech 2022, 24, 112–133. [Google Scholar] [CrossRef]
  7. de Amorim, F.R.; Queiroz, T.R.; de Oliveira, S.C.; Lourenzani, W.L. Cultivation practices of sugarcane: An analysis of the competitiveness of sugarcane suppliers in Brazil. Sugar Tech 2021, 23, 476–483. [Google Scholar] [CrossRef]
  8. Picoli, M.C.A.; Machado, P.G. Land use change: The barrier for sugarcane sustainability. Biofuels Bioprod. Biorefin. 2021, 15, 1585–1590. [Google Scholar] [CrossRef]
  9. Conab. Acompanhamento Da Safra Brasileira de Cana-De-Açúcar, Safra 2022/23, Segundo Levantamento Em Agosto 2022; Companhia Nacional de Abastecimento: Brasília, Brazil, 2022.
  10. FAO. FAOSTAT, FAO Statistical Databases 2021. In Food Systems; FaoStat: Rome, Italy, 2022; Available online: http://faostat3.fao.org (accessed on 1 October 2022).
  11. Brasileiro, B.P.; Marinho, C.D.; Costa, P.M.A.; Peternelli, L.A.; Resende, M.D.V.; Cursi, D.E.; Hoffmann, H.P.; Barbosa, M.H.P. Genetic diversity and coefficient of parentage between clones and sugarcane varieties in Brazil. Genet. Mol. Res. 2014, 13, 9005–9018. [Google Scholar] [CrossRef]
  12. D’Hont, A.; Grivet, L.; Feldmann, P.; Glaszmann, J.C.; Rao, S.; Berding, N. Characterisation of the double genome structure of modern sugarcane cultivars (Saccharum spp.) by molecular cytogenetics. Mol. Genet. Genom. 1996, 250, 405–413. [Google Scholar] [CrossRef]
  13. Oliveira, R.A.; Daros, E.; Hoffmann, H.P. Liberação Nacional de Variedades RB de Cana-De-Açúcar, 1st ed.; Graciosa: Curitiba, Brazil, 2015. [Google Scholar]
  14. Aguiar, A.; Milessi, T.S.; Mulinari, D.R.; Lopes, M.S.; Costa, S.M.; Candido, R.G. Sugarcane straw as a potential second generation feedstock for biorefinery and white biotechnology applications. Biomass Bioenergy 2021, 144, 105896. [Google Scholar] [CrossRef]
  15. Proclima. Programa de Monitoramento Climático Em Tempo Real Da Região Nordeste. Available online: http://proclima.cptec.inpe.br/balanco_hidrico/balancohidrico.shtml (accessed on 6 October 2021).
  16. INMET. Dados históricos anuais. In Instituto Nacional de Meteorologia, 2014th ed.; Ministério da Agricultura, Pecuária e Abastecimento, Brazil: Brasília, Brazil, 2014. [Google Scholar]
  17. Koppen, W. Climatologia: Con Un Estudio de Los Climas de la Tierra; Fondo de Cultura Economica: Mexico City, Mexico, 1948; p. 478. [Google Scholar]
  18. Pompelli, M.F.; Ferreira, P.P.B.; Chaves, A.R.M.; Figueiredo, R.C.Q.Q.; Martins, A.O.; Jarma-Orozco, A.; Batista-Silva, W.; Endres, L.; Araújo, W.L. Physiological, metabolic, and stomatal adjustments in response to salt stress in Jatropha curcas. Plant Physiol. Bioch. 2021, 168, 116–127. [Google Scholar] [CrossRef] [PubMed]
  19. Pompelli, M.F.; Martins, S.C.; Celin, E.F.; Ventrella, M.C.; DaMatta, F.M. What is the influence of ordinary epidermal cells and stomata on the leaf plasticity of coffee plants grown under full-sun and shady conditions? Braz. J. Biol. 2010, 70, 1083–1088. [Google Scholar] [CrossRef] [Green Version]
  20. Dos Santos, C.M.; Endres, L.; Da Silva, A.C.S.; Silva, J.V.; De Souza, B.; Veríssimo, G.; Froehlich, A.; Menossi, M. Water relations and osmolite accumulation related to sugarcane yield under drought stress in a tropical climate. Int. J. Plant Prod. 2019, 13, 227–239. [Google Scholar] [CrossRef]
  21. Ridesa. Catálogo Nacional de Variedades “RB” de Cana-De-Acúcar; Rede Interuniversitária para o Desenvolvimento do Setor Sucroalcooleiro: Curitiba, Brazil, 2010. [Google Scholar]
  22. Daros, E.; de Oliveira, R.A.; Barbosa, G.V.S. 45 Anos de Variedades RB de Cana-De-Açúcar: 25 Anos de Ridesa; Graciosa: Curitiba, Brazil, 2015; p. 156. [Google Scholar]
  23. Diniz, A.L.; da Silva, D.I.R.; Lembke, C.G.; Costa, M.D.L.; Ten-Caten, F.; Li, F.; Vilela, R.D.; Menossi, M.; Ware, D.; Endres, L.; et al. Amino acid and carbohydrate metabolism are coordinated to maintain energetic balance during drought in sugarcane. Int. J. Mol. Sci. 2020, 21, 9124. [Google Scholar] [CrossRef]
  24. Pompelli, M.F.; França, S.C.S.; Tigre, R.C.; Oliveira, M.T.; Sacilot, M.; Pereira, E.C.G. Spectrophotometric determinations of chloroplastidic pigments in acetone, ethanol and dimethylsulphoxide. Braz. J. Biosc. 2013, 11, 52–58. [Google Scholar]
  25. Moore, S.; Stein, W.H. A modified ninhydrin reagent for the photometric determination of amino acids and related compounds. J. Biol. Chem. 1954, 221, 907–913. [Google Scholar] [CrossRef]
  26. Bradford, M. A rapid and quantitative method for quantitation of microgram quantities of protein utilizing the principle of protein-dye binding. Annual. Biochem. 1976, 72, 248–254. [Google Scholar] [CrossRef]
  27. Pompelli, M.F.; Barata-Luís, R.M.; Vitorino, H.S.; Gonçalves, E.R.; Rolim, E.V.; Santos, M.G.; Almeida-Cortez, J.S.; Endres, L. Photosynthesis, photoprotection and antioxidant activity of purging nut under drought deficit and recovery. Biomass Bioenergy 2010, 34, 1207–1215. [Google Scholar] [CrossRef]
  28. Bates, L.S.; Waldren, R.P.; Teare, I.D. Rapid determination of free proline for water-stress studies. Plant Soil 1973, 39, 205–207. [Google Scholar] [CrossRef]
  29. Mendes, K.R.; Granja, J.A.A.; Ometto, J.P.; Antonino, A.C.D.; Menezes, R.S.C.; Pereira, E.C.; Pompelli, M.F. Croton blanchetianus modulates its morphophysiological responses to tolerate drought in a tropical dry forest. Funct. Plant Biol. 2017, 44, 1039–1051. [Google Scholar] [CrossRef] [PubMed]
  30. Toebe, M.; de Melo, P.J.; de Souza, R.R.; Mello, A.C.; Tartaglia, F.L. Leaf area estimation in triticale by leaf dimensions. Rev. Bras. Cienc. Agrar. 2019, 14, e5656. [Google Scholar] [CrossRef]
  31. Johansen, D.A. Plant Microtechnique, 3rd ed.; Paul B. Hoeber, Inc.: New York, NY, USA, 1940; p. 790. [Google Scholar]
  32. Pompelli, M.F.; Pompelli, G.M.; Cabrini, E.C.; Alves, C.J.L.; Ventrella, M.C. Leaf anatomy, ultrastructure and plasticity of Coffea arabica L. in response to light and nitrogen availability. Biotemas 2012, 25, 13–28. [Google Scholar] [CrossRef] [Green Version]
  33. Karnovsky, M.J. A formaldehyde-glutaraldehyde fixative of high osmolality for use in electron microscopy. J. Cell Biol. 1965, 27, 137–138. [Google Scholar]
  34. Salisbury, E.J. On the causes and ecological significance of stomatal frequency, with special reference to the woodland flora. Philos. Trans. R. Soc. Lond. Ser. B Contain. Pap. A Biol. Character 1928, 216, 1–65. [Google Scholar]
  35. Dos Santos, O.O.; Mendes, K.R.; Martins, S.V.C.; Batista-Silva, W.; dos Santos, M.A.; Figueirôa, J.M.; Souza, E.R.; Fernandes, D.; Araújo, W.L.; Pompelli, M.F. Physiological parameters and plasticity as key factors to understand pioneer and late successional species in the Atlantic Rainforest. Acta Physiol. Plant. 2019, 41, 145. [Google Scholar] [CrossRef]
  36. INMET. Estações Climáticas, Gráficos. In Diário; Instituto Nacional de Meteorologia: Brasília, Brazil, 2021. Available online: https://portal.inmet.gov.br/dadoshistoricos (accessed on 30 September 2022).
  37. Vilela, R.D.; Bezerra, B.K.L.; Froehlich, A.; Endres, L. Antioxidant system is essential to increase drought tolerance of sugarcane. Ann. Appl. Biol. 2017, 171, 451–463. [Google Scholar] [CrossRef]
  38. Endres, L.; Dos Santos, C.M.; Silva, J.V.; Barbosa, G.V.S.; Silva, A.L.J.; Froehlich, A.; Teixeira, M.T. Inter-relationship between photosynthetic efficiency,Δ13C, antioxidant activity and sugarcane yield under drought stress in field conditions. J. Agron. Crop Sci. 2019, 205, 433–446. [Google Scholar] [CrossRef]
  39. Naheed, R.; Arfan, M.; Farhat, F.; Ijaz, S.; Khalid, H. Acclimatization of drought tolerance with somaclonal variants of sugarcane (Saccharum officinarum L.). Adv. Life Sci. 2020, 8, 57–62. [Google Scholar]
  40. Zulfiqar, S.; Sharif, S.; Saeed, M.; Tahir, A. Role of Carotenoids in Photosynthesis. In Carotenoids: Structure and Function in the Human Boby; Zia-Ul-Haq, M., Dewanjee, S., Riaz, M., Eds.; Springer Nature: Cham, Switzerland, 2021; Volume 189–208. [Google Scholar]
  41. Pompelli, M.F.; Martins, S.C.V.; Antunes, W.C.; Chaves, A.R.M.; DaMatta, F.M. Photosynthesis and photoprotection in coffee leaves is affected by nitrogen and light availabilities in winter conditions. J. Plant Physiol. 2010, 167, 1052–1060. [Google Scholar] [CrossRef]
  42. Devi, K.; Gomathi, R.; Kumar, R.A.; Manimekalai, R.; Selvi, A. Field tolerance and recovery potential of sugarcane varieties subjected to drought. Indian J. Plant Physiol. 2018, 23, 271–282. [Google Scholar] [CrossRef]
  43. Fonseca-Pereira, P.; Daloso, D.M.; Gago, J.; Nunes-Nesi, A.; Araújo, W.L. On the role of the plant mitochondrial thioredoxin system during abiotic stress. Plant Signal. Behav. 2019, 14, 1592536. [Google Scholar] [CrossRef] [PubMed]
  44. Dodd, I.C. Abscisic acid and stomatal closure: A hydraulic conductance conundrum? New Phytol. 2013, 197, 6–8. [Google Scholar] [CrossRef] [PubMed]
  45. Pompelli, M.F.; Ferreira, D.T.R.G.; Cavalcante, P.P.G.S.; Salvador, T.L.; Hsie, B.S.; Endres, L. Environmental influence on the physico-chemical and physiological properties of Jatropha curcas L. seeds. Aust. J. Bot. 2010, 58, 421–427. [Google Scholar] [CrossRef]
  46. Hsie, B.S.; Mendes, K.R.; Antunes, W.C.; Endres, L.; Campos, M.L.O.; Souza, F.C.; Santos, N.D.; Singh, B.; Arruda, E.C.P.; Pompelli, M.F. Jatropha curcas L. (Euphorbiaceae) modulates stomatal traits in response to leaf-to-air vapor pressure deficit. Biomass Bioenergy 2015, 81, 273–281. [Google Scholar] [CrossRef]
  47. Demmig-Adams, B.; Adams, W.W., III. Photoprotection in an ecological context: The remarkable complexity of thermal energy dissipation. New Phytol. 2006, 172, 11–21. [Google Scholar] [CrossRef]
  48. Cheng, H.; Wang, X.; Wang, J.; Li, Q. Key photoprotective pathways of a shade-tolerant plant (Alpinia oxyphylla) for precipitation patterns change during the dry season: Thermal energy dissipation and water-water cycle. Plant Stress 2021, 2, 100016. [Google Scholar] [CrossRef]
  49. Kumar, P.; Yadav, S.; Singh, M.P. Possible involvement of xanthophyll cycle pigments in heat tolerance of chickpea (Cicer arietinum L.). Physiol. Mol. Biol. Plants 2020, 26, 1773–1785. [Google Scholar] [CrossRef]
  50. Antunes, W.C.; Mendes, K.R.; Chaves, A.R.M.; Ometto, J.P.; Jarma-Orozco, A.; Pompelli, M.F. Spondias tuberosa trees grown in tropical, wet environments are more susceptible to drought than those grown in arid environments. Rev. Colomb. De Cienc. Hortícolas 2016, 10, 9–27. [Google Scholar] [CrossRef]
  51. Batista-Silva, W.; Heinemann, B.; Rugen, N.; Nunes-Nesi, A.; Araújo, W.L.; Hildebrandt, T.M. The role of amino acid metabolism during abiotic stress release. Plant Cell Environ. 2018, 42, 1630–1644. [Google Scholar] [CrossRef] [Green Version]
  52. Masoudniaragh, A.; Oraei, M.; Gohari, G.; Akbari, A.; Faramarzi, A. Using halloysite nanotubes as carrier for proline to alleviate salt stress effects in sweet basil (Ocimum basilicum L.). Sci. Hortic. 2021, 285, 110202. [Google Scholar] [CrossRef]
  53. Freire, F.B.S.; Bastos, R.L.G.; Bret, R.S.C.; Cândido-Sobrinho, S.A.; Medeiros, D.B.; Antunes, W.C.; Fernie, A.R.; Daloso, D.M. Mild reductions in guard cell sucrose synthase 2 expression leads to slower stomatal opening and decreased whole plant transpiration in Nicotiana tabacum L. Environ. Exp. Bot. 2021, 18, 104370. [Google Scholar] [CrossRef]
  54. Rizhsky, L.; Hallak-Herr, E.; Van Breusegem, F.; Rachmilevitch, S.; Barr, J.E.; Rodermel, S.; Inze, D.; Mittler, R. Double antisense plants lacking ascorbate peroxidase andcatalase are less sensitive to oxidative stress than singleantisense plants lacking ascorbate peroxidase or catalase. Plant J. 2002, 32, 329–342. [Google Scholar] [CrossRef] [PubMed] [Green Version]
  55. Kadioglu, A.; Terzia, R.; Saruhanb, N.; Saglama, A. Current advances in the investigation of leaf rolling caused by biotic and abiotic stress factors. Plant Sci. 2012, 182, 42–48. [Google Scholar] [CrossRef] [PubMed]
  56. Fahn, A. Plant Anatomy, 2nd ed.; Butterworth Heinemann: Oxford, MS, USA, 1990; p. 588. [Google Scholar]
  57. Zhang, F.J.; Zhang, K.K.; Du, C.Z.; Li, J.; Xing, Y.X.; Yang, L.T.; Li, Y.R. Effect of drought stress on anatomical structure and chloroplast ultrastructure in leaves of sugarcane. Sugar Tech 2014, 17, 41–48. [Google Scholar] [CrossRef]
  58. Sánchez-Elordi, E.; Díaz, E.M.; Armas, R.; Armas, R.; Alarcón, B.; Vicente, C.; Legaz, M.E. Effects of abiotic stresses on sugarcane plants with emphasis in those produced by wounds and prolonged post–harvest periods. In Plant Life under Changing Environment: Responses and Management; Tripathi, D.K., Singh, V.P., Sharma, S., Prasad, S., Dubey, N.K., Ramawat, N., Eds.; Academic Press: London, UK, 2020; pp. 251–269. [Google Scholar] [CrossRef]
  59. Elham, F.; Khavari-Nejad, R.A.; Salekdeh, G.H.; Najafi, F. Evaluation of cuticular wax deposition, stomata and carbohydrate of wheat leaves for screening drought tolerance. Adv. Environ. Biol. 2012, 6, 4035–4040. [Google Scholar]
  60. Cameron, K.D.; Teece, M.A.; Smart, L.B. Increased Accumulation of Cuticular Wax and Expression of Lipid Transfer Protein in Response to Periodic Drying Events in Leaves of Tree Tobacco. Plant Physiol. 2006, 140, 176–183. [Google Scholar] [CrossRef] [Green Version]
  61. Molina, A.; Acedo, C.; Llamas, F. The relationship between water availability and anatomical characters in Carex hirta. Aquat. Bot. 2006, 85, 257–262. [Google Scholar] [CrossRef]
  62. Wu, X.; Wang, L.W.; Deng, Y.C.; Liao, J.X.; Tan, F.; Jing, Y. Detection of epicuticular wax on sugarcane leaves and its correlation with agronomic characters and stress resistance. J. South. Agric. 2018, 49, 1712–1721. [Google Scholar]
  63. Eglinton, G.; Hamilton, R.J. Leaf epicuticular waxes. Science 1967, 156, 1322–1335. [Google Scholar] [CrossRef]
  64. Post-Beittenmiller, D. Biochemistry and molecular biology of wax production in plants. Annu. Rev. Plant Physiol. Plant Mol. Biol. 1996, 47, 405–430. [Google Scholar] [CrossRef] [PubMed] [Green Version]
  65. de Paula, T.O.M.; Brasileiro, B.P.; Cursi, D.E.; de Freitas, E.G.; dos Santos, J.M.; de Resende, M.D.V.; Kimbeng, C.; Barbosa, M.H.P. Establishment of gene pools for systematic heterosis exploitation in sugarcane breeding. Agron. J. 2020, 112, 3847–3858. [Google Scholar] [CrossRef]
  66. Matsuoka, S.; Gheller, A.C.A.; Bassinello, A.I.; Giglioti, E.A.; Santos, G.H.R.; Hoffmann, H.P.; Arizono, H.; Masuda, Y.; Salibe, A.C.; Abramo Filho, J.; et al. The sugarcane breeding program of the Federal University of São Carlos, Brazil. Sugar J. 1999, 62, 18–23. [Google Scholar]
  67. de Morais, L.K.; de Aguiar, M.S.; de Albuquerque e Silva, P.; Câmara, T.M.M.; Cursi, D.E.; Júnior, A.R.F.; Chapola, R.G.; Carneiro, M.S.; Bespalhok Filho, J.C. Breeding of Sugarcane. In Industrial Crops. Handbook of Plant Breeding; Cruz, V.M.V., Dierig, D.A., Eds.; Springer: New York, NY, USA, 2015; Volume 9. [Google Scholar] [CrossRef]
  68. Barreto, F.Z.; Balsalobre, T.W.A.; Chapola, R.G.; Garcia, A.A.F.; Souza, A.P.; Hoffmann, H.P.; Gazaffi, R.; Carneiro, M.S. Genetic variability, correlation among agronomic traits, and genetic progress in a sugarcane diversity panel. Agriculture 2021, 11, 533. [Google Scholar] [CrossRef]
  69. Carneiro, M.S.; Chapola, R.G.; Junior, A.R.F.; Cursi, D.E.; Balsalobre, T.W.A.; Hoffmann, H.P. RB985476—A sugarcane cultivar with high agroindustrial yield and disease resistanc. Crop Breed. Appl. Biotechnol. 2020, 20, e304020210. [Google Scholar] [CrossRef]
  70. RIDESA-BRASIL. Liberações—2021. In Relatório Ridesa-Brasil, PMGCA, UFSCar; Universidade Federal de São Carlos: São Carlos, Brazil, 2021; Available online: https://www.ridesaufscar.com.br/catalogo-rb (accessed on 30 September 2022).
Figure 1. Climatological data. (A) Minimum (blue), maximum (red), and mean (green) temperature (right axes), and relative humidity (left axes). (B) Accumulated rainfall (left axes) and global radiation (right axes). All data were automatically registered by a climatologic tower daily between 1 June 2020 and 31 December 2020. Source INMET [36].
Horticulturae 08 01069 g001
Figure 2. Net photosynthesis (PN; (A,B)), stomatal conductance (gs; (C,D)), transpiration (E; (E,F)), and intrinsic water use efficiency (WUEi; (G,H)) measured in four varieties (RB92579, RB867515, RB855536, and RB72454) of sugarcane. The evaluations were made in dry season (gray bars) and rainy season (green bars) at 8:00 to 10:00 h (A,C,E,G) or at 12:00 to 13:00 h (B,D,F,G). Different lowercase letters denote significance within season for each variety, and different capital letters denote significance within varieties for the same season. An asterisk (*) denotes significance within 8:00 to 10:00 h and 12:00 to 13:00 h measurements in the same treatment.
Horticulturae 08 01069 g002
Figure 3. Internal-to-ambient CO2 concentration ratio (Ci:Ca ratio, (A,B)), leaf temperature (Tleaf; (C,D)), vapor pressure deficit (VPD; (E,F)), and leaf hydraulic conductance (KL; (G,H)) measured in four varieties (RB92579, RB867515, RB855536, and RB72454) of sugarcane. The evaluations were made in dry season (gray bars) and rainy season (green bars) at 8:00 to 10:00 h (A,C,E,G) or at 12:00 to 13:00 h (B,D,F,G). Different lowercase letters denote significance within season for each variety, and different capital letters denote significance within varieties for the same season. An asterisk (*) denotes significance within 8:00 to 10:00 h and 12:00 to 13:00 h measurements in the same treatment. The doted line (A,B) denotes que arbitrary value proposed to determine the stomatal or non-stomatal restriction.
Horticulturae 08 01069 g003
Figure 4. Relationship between VPD and gs measured at 08:00 and 12:00 h in dry and rainy season in four varieties (RB92579, red spheres; RB867515, green spheres; RB855536, blue triangle; and RB72454, orange triangle) of sugarcane. The black line represents the regression analysis. Each point denotes one sugarcane plant. Regression coefficient (R2) and p-value are shown.
Horticulturae 08 01069 g004
Figure 5. Motive force that drives sap ascent in the xylem (SAP flow velocity) measured over 24 h in open field cultivated sugarcane plants. Each point represents a measurement and the values, in parentheses, represent the average SAP over 24 h (for comparison purposes only), with 49 readings per plant, measured every 30 min. The period of time between the two dotted lines denotes the period of darkness in the coastal region (AL, Brazil). Data in (A) were measured in rainy season (2020, July) and data shown in (B) were measured in dry season (2020, December).
Horticulturae 08 01069 g005
Figure 6. Predawn (A) and midday (B) water potential measured in four varieties (RB92579, RB867515, RB855536, and RB72454) of sugarcane. The evaluations were made in dry season (gray bars) and rainy season (green bars). Different lowercase letters denote significance within season for each variety, and different capital letters denote significance within varieties for the same season. An asterisk (*) denotes significance within predawn and midday measurements in the same treatment.
Horticulturae 08 01069 g006
Figure 7. Variable-to-initial Chl fluorescence (Fv/Fm; (A,B)), the actual PSII efficiency during the exposure to sunlight (ΦPSII; (C,D)), and electron transport rate (ETR; (E,F)) measured in four varieties (RB92579, RB867515, RB855536, and RB72454) of sugarcane. The evaluations were made in dry season (gray bars) and rainy season (green bars) at 8:00 to 10:00 h (A,C,E) or at 12:00 to 13:00 h (B,D,F). Different lowercase letters denote significance within season for each variety, and different capital letters denote significance within varieties for the same season. An asterisk (*) denotes significance within 8:00 to 10:00 h and 12:00 to 13:00 h measurements in the same treatment.
Horticulturae 08 01069 g007
Figure 8. Relationship between leaf hydraulic conductance (KL) and stomatal conductance (gs) in sugarcane varieties in dry (blue symbols) and rainy (red symbols) seasons. Regression coefficient (R2) and p-value are shown.
Horticulturae 08 01069 g008
Figure 9. Light micrographs of cross-sections in four varieties (RB92579, (a,b); RB867515, (c,d); RB855536, (e,f); and RB72454, (g,h)) of sugarcane. The leaf fragments were collected in rainy season (a,c,e,g) and dry season (b,d,f,h) at 8:00 to 10:00 h. Scale = (a,b), 20 μm; (ch), 50 μm. For more information, see Table 3.
Horticulturae 08 01069 g009
Figure 10. SEM micrograph of adaxial epidermis in four varieties (RB92579, (ad); RB867515, (eh); RB855536, (ik); and RB72454, (lo)) of sugarcane. The leaf fragments were collected in rainy season (a,b,e,f,i,j,l,m) and dry season (c,d,g,h,k,m,o) at 8:00 to 10:00 h. Scale = 10 μm. In (e,l,m) the arrow points to the epidermal hair. s. denotes stomata. For more information, see Table 3.
Horticulturae 08 01069 g010
Figure 11. SEM micrograph of abaxial epidermis in four varieties (RB92579, (ad); RB867515, (eh); RB855536, (ik); and RB72454, (ln)) of sugarcane. The leaf fragments were collected in rainy season (a,b,e,f,i,j,l,m) and dry season (c,d,g,h,k,n) at 8:00 to 10:00 h. Scale = 10 μm. In (g,i,k), the arrow points to the epidermal hair. s. denote stomata. For more information, see Table 1.
Horticulturae 08 01069 g011
Figure 12. Relationship between the ratio of electron transport rate (ETR) and net photosynthesis (PN) versus stomatal conductance (gs) measured in four varieties (RB92579, red; RB867515, green; RB855536, blue; and RB72454, orange) of sugarcane. The evaluations were made in the dry season and rainy season with que points joined. Each point denotes one sugarcane plant. Regression coefficient (R2) and p-value are shown.
Horticulturae 08 01069 g012
Table 2. Biochemical and antioxidative features measured of four varieties (RB92579, RB86751, RB855536, and RB72454) of sugarcane. The evaluations were made in rainy season (2020, July) and dry season (2020, December) at 8:00 to 10:00 h. Different lowercase letters denote significance within season for each variety, and different capital letters denote significance within varieties for the same season. All value denotes median ± SE (n = 10).
CharacteristicsRB92579RB867515RB855536RB72454
RainyDryRainyDryRainyDryRainyDry
Chlorophyll “a” (g kg−1 DW)1.97 ± 0.11 Aa1.26 ± 0.08 Ab1.37 ± 0.06 Ba0.98 ± 0.04 Bb1.48 ± 0.09 Ba1.02 ± 0.12 Bb1.40 ± 0.07 Ba0.82 ± 0.04 Bb
Chlorophyll “b” (g kg−1 DW)0.39 ± 0.02 Aa0.20 ± 0.01 Cb0.39 ± 0.02 Aa0.29 ± 0.01 Bb0.42 ± 0.03 Aa0.39 ± 0.03 Aa0.36 ± 0.02 Ab0.42 ±0.02 Aa
Chlorophyll “a + b” (g kg−1 DW)2.37 ± 0.14 Aa1.47 ± 0.09 Ab1.76 ± 0.08 Bb1.27 ± 0.05 Ab1.90 ± 0.12 Ba1.42 ± 0.12 Ab1.76 ± 0.099 Ba1.24 ± 0.06 Ab
Total carotenoids (g kg−1 DW)0.43 ± 0.03 Aa0.59 ± 0.04 Ba0.47 ± 0.02 Aa0.40 ± 0.01 Ca0.46 ± 0.03 Aa0.45 ± 0.03 Ca0.51 ± 0.02 Ab0.80 ± 0.03 Aa
Carotenois/chlorophyll ratio0.18 ± 0.01 Db0.40 ± 0.01 Ba0.27 ± 0.01 Bb0.31 ± 0.01 Ca0.24 ± 0.01 Cb0.65 ± 0.02 Aa0.30 ± 0.01 Ab0.32 ± 0.01 Ca
Amino acids (mmol kg−1 DW)14.62 ± 0.28 Bb17.78 ± 0.47 Aa15.80 ± 0.62 Bb17.36 ± 0.25 Aa16.73 ± 0.68 Aa11.84 ± 0.54 Bb16.55 ± 0.48 Ba16.28 ± 0.47 Aa
Total proteins (g kg−1 DW)112.36 ± 3.93 Aa89.97 ± 1.16 Ab91.72 ± 1.94 Ba79.28 ± 2.83 Bb96.84 ± 1.72 Ba74.47 ± 4.63 Bb82.93 ± 1.58 Ca65.86 ± 1.18 Cb
SOD activity (U kg−1 DW)11.98 ± 0.18 Db18.26 ± 0.32 Ca12.44 ± 0.20 Bb19.92 ± 0.43 Ca15.40 ± 0.33 Ab26.79 ± 0.83 Aa11.07 ± 0.15 Cb23.00 ± 0.38 Ba
CAT activity (mmol H2O2 min−1 kg−1 DW)17.28 ± 0.32 Bb32.03 ± 0.37 Ba21.18 ± 0.17 Ab28.44 ± 0.33 Ca21.23 ± 0.25 Ab36.26 ± 0.53 Aa21.11 ± 0.53 Ab24.45 ± 0.25 Da
APX activity (mmol H2O2 min−1 kg−1 DW)5.26 ± 0.10 Ab5.53 ± 0.11 Ca5.50 ± 0.06 Aa5.10 ± 0.12 Bb5.50 ± 0.08 Ab6.12 ± 0.10 Aa5.28 ± 0.04 Aa3.76 ± 0.09 Bb
Proline (mmol kg−1 DW)40.12 ± 0.34 Cb61.44 ± 0.55 Ba47.40 ± 0.28 Bb55.04 ± 0.14 Da38.90 ± 0.39 Db66.81 ± 0.32 Aa51.10 ± 0.28 Ab59.24 ± 0.55 Ca
Malondialdehyde (mmol kg−1 DW)20.28 ± 0.31 Bb22.41 ± 0.27 Ca18.70 ± 0.21 Cb33.51 ± 0.83 Ba18.04 ± 0.15 Ca17.93 ± 0.21 Da25.23 ± 0.61 Ab48.27 ± 0.15 Aa
Table 3. Morphological and anatomical features of four varieties (RB92579, RB86751, RB855536, and RB72454) of sugarcane. The evaluations were made in rainy season (2020, July) and dry season (2020 December) at 8:00 to 10:00 h. Different lowercase letters denote significance within season for each variety, and different capital letters denote significance within varieties for the same season. All value denotes median ± SE (n = 10).
CharacteristicsRB92579RB867515RB855536RB72454
RainyDryRainyDryRainyDryRainyDry
Plant height (cm)130.05 ± 4.60 Aa91.21 ± 2.74 Ab134.77 ± 4.66 Aa95.25 ± 3.39 Ab99.48 ± 3.78 Ba65.05 ± 1.51 Bb97.38 ± 3.47 Ba96.69 ± 2.01 Aa
Leaf area (cm2)371.24 ± 19.11 ABa307.09 ± 21.27 ABb424.86 ± 21.32 Aa345.38 ± 23.41 Ab310.69 ± 16.14 Ba254.84 ± 17.78 Bb364.17 ± 16.92 ABa283.86 ± 17.84 ABb
Stalk diameter (cm)30.96 ± 0.07 Ba21.74 ± 0.01 Cb33.66 ± 0.07 Aa25.15 ± 0.01 Ab24.11 ± 0.05 Da24.89 ± 0.08 Ba27.03 ± 0.05 Ca19.82 ± 0.05 Db
Leaf thickness (mm)45.13 ± 0.68 Da33.48 ± 0.28 Db101.42 ± 2.09 Ca77.01 ± 0.61 Cb119.90 ± 5.31 Ba101.82 ± 1.56 Bb140.56 ± 2.48 Aa109.60 ± 0.78 Ab
Adaxial stomal density (mm−2)6.5 ± 0.36 Bb7.23 ± 0.30 Ba6.80 ± 0.11 Bb7.96 ± 0.18 Aa6.85 ± 0.24 Bb8.60 ± 0.25 Aa7.85 ± 0.17 Aa6.62 ± 0.12 Bb
Abaxial stomal density (mm−2)14.38 ± 0.10 Cb16.04 ± 0.14 Ca15.18 ± 0.12 Bb17.33 ± 0.19 Ba16.50 ± 0.22 Ab18.25 ± 0.12 Aa15.39 ± 0.22 Ba15.03 ± 0.15 Da
Adaxial stomata aperture (mm)4.98 ± 0.05 Ba3.24 ± 0.12 Cb5.36 ± 0.10 Aa3.51 ± 0.08 Cb3.92 ± 0.08 Cb5.29 ± 0.10 Ba5.48 ± 0.18 Ab5.91 ± 0.07 Aa
Abaxial stomata aperture (mm)3.79 ± 0.14 Ba2.99 ± 0.04 Cb3.23 ± 0.05 Ca2.94 ± 0.04 Cb5.93 ± 0.19 Ab6.43 ± 0.05 Aa2.37 ± 0.05 Db3.85 ± 0.06 Ca
Table 4. Brazilian accession of sugarcane harvest in 2021 and 2022.
AccessionsCultivated Area (%) 12021 Production (%)2021 (Million USD) 22022 (Million USD) 2
RB73-2727No longer cultivation in Brazil------
RB73-9735No longer cultivation in Brazil------
RB75-11No longer cultivation in Brazil------
RB83-5054Cultivation in Brazil is currently inadvisable 3------
RB83-5089Variety rarely cultivated in Brazil 4------
RB85-5113 Currently used as mother parent 5------
SP80-0185 ♀,6No longer cultivation in Brazil------
SP80-1816 ♀,7−1.10%−1.71%$956.39$1171.22
SP80-3280 ♀,6−1.00%−1.80%$1006.72$1232.86
SP81-3250 ♂,5−9.80%−13.50%$7550.44$9246.48
SP83-2847−3.10%−4.50%$2516.81$3082.16
SP84-1431No longer cultivation in Brazil−−−−−−
SP84-5560No longer cultivation in Brazil−−−−−−
RB92579+5.8%+3.0+$1677.87+$2054.77
RB867515+27.0%+26.4%+$14,765.30+$18,082.01
RB855536−1.3%−2.3%$1286.37$1575.33
RB72454−1.6%−1.4%$783.01$958.89
1 = Varieties significantly cultivated in Brazil in the last 40 years with a minimum cultivated area of 5% in at least 1 year. 2 = In accordance with respective exchange rate (Brazilian Real to USD) on 29 September 2022. 3 = In accordance with Matsuoka et al. [59]. 4 = In accordance with Cursi et al. [61]. 5 = In accordance with de Paula et al. [58]. 6 = RIDESA-BRASIL [70]. 7 = In accordance with Barreto et al. [62]. ♀ = Currently used as mother parent in crop breeding. ♂ = Currently used as father parent in crop breeding. Table adapted to data available in Matsuoka et al. [59], de Paula et al. [58], and Cursi et al. [61].
Publisher’s Note: MDPI stays neutral with regard to jurisdictional claims in published maps and institutional affiliations.

