Article

Effect of Temperature on Photosynthesis and Fruit Quality of ‘Mihong’ Peaches under High CO2 Concentrations

1
Fruit Research Division, National Institute of Horticultural & Herbal Science, Wanju 55365, Korea
2
Department of Digital Agriculture, Rural Development Administration, Jeonju 54875, Korea
3
Department of Horticulture, Jeonbuk National University, Jeonju 54896, Korea
*
Author to whom correspondence should be addressed.
Horticulturae 2022, 8(11), 1047; https://doi.org/10.3390/horticulturae8111047
Submission received: 16 September 2022 / Revised: 20 October 2022 / Accepted: 1 November 2022 / Published: 7 November 2022
(This article belongs to the Section Biotic and Abiotic Stress)

Abstract

:
We investigated the effects of elevated temperatures on the photosynthetic characteristics and fruit quality of the ‘Mihong’ peach (Prunus persica) under high carbon dioxide concentrations based on climate change scenario RCP 8.5. We simulated three different temperature conditions (control; the average temperature in normal years in Jeonju city, C+3.4 °C, C+5.7 °C) and 700 μmol·mol−1 CO2 (expected in the mid-21st century). The average photosynthetic rates were 10.64, 10.21, and 8.18 μmol∙m−2∙s−1 at C+3.4 °C, control, and C+5.7 °C, respectively. The chlorophyll content in the control and C+3.4 °C increased compared to that at the early stage of growth, but that of C+5.7 °C decreased rapidly. The fruit weight was the highest for C+3.4 °C (158.2 g), followed by C+5.7 °C (129.5 g) and the control (127.3 g). The shoot length increased at C+3.4 °C and C+5.7 °C when compared to the control, and there was no significant difference in the other growth characteristics. The carbohydrate content was the highest at C+3.4 °C, and the nitrogen content increased as the temperature increased. Moreover, the C/N ratio decreased as the temperature increased but there was no significant difference. The rate of floral bud differentiation decreased as temperature increased, and that of C+5.7 °C was the lowest due to the low C/N ratio, vegetative growth dominance, and early defoliation. Furthermore, the floral bud density was low in the C+5.7 °C treatment. These findings indicate that a temperature increase of 5.7 °C under 700 μmol·mol−1 CO2 conditions will negatively affect the physiological response and fruit quality of the early-maturing peach variety ‘Mihong,’ and yield is expected to decrease in the following year.

1. Introduction

According to Climate Change Scenario RCP 8.5 (Representative Concentration Pathway), the CO2 concentration is expected to rise to 700 µmol·mol−1 in the mid-21st century (2041–2070). In addition, the average temperature on the Korean Peninsula is expected to rise by 3.4 °C in the mid-21st century and 5.7 °C in the late-21st century, accelerating global warming [1]. The concentration of CO2 in the global atmosphere continues to increase, and the current level has reached 419 ppm (https://climate.nasa.gov/vital-signs/carbon-dioxide, accessed on 17 October 2022). The increased atmospheric CO2 traps heat on the earth’s surface and raises temperature, which leads to climate change [2]. The global average temperature data indicated that 2016–2020 were the warmest 5 years in most regions [3,4]. Climate change affects various aspects of fruit trees, including phenological changes [5], physiological responses [6], plant anatomical structure, fruit quality [7], and yield [8].
Temperature is an important abiotic factor that greatly influences plant’s physiological response. The optimum temperature for photosynthesis depends on the crop and is generally between 14 and 32 °C [9]. However, at temperatures above optimum, photosystem II is generally damaged [10], and the respiration rate increases, resulting in a decrease in the net photosynthetic rate [11]. In addition, warming-induced soil moisture losses can cause water stress, ultimately leading to suppressed nutrient uptake and reduced photosynthesis [12]. Plant growth stages differ in their susceptibility to temperature stress: the reproductive organ development and other stages (including flowering, pollination, and fertilization) are more susceptible to temperature anomalies, leading to poor fruit set [13].
CO2 is an input for photosynthesis; therefore, its increased concentration acts as a fertilizer causing increased photosynthesis [14]. In most C3 plants, a CO2 increase directly increases net photosynthesis by increasing the carboxylation rate of Rubisco as the CO2 concentration of mesophyll cells increases and by inhibiting photorespiration [15], and photosynthesis increases to the CO2 saturation point [16]. Although elevated CO2 leads to increased photosynthesis, a combination of elevated CO2 and high temperature as well as increased respiration rate can reduce the positive impact of CO2 enrichment by affecting plant carbon balance, growth, development, biomass accumulation, yield, and quality [17,18]. In addition, long-term treatment with high CO2 concentrations may negatively affect plant growth and development [19].
Several studies have shown temperature-dependent photosynthesis and productivity changes in various crops over long periods [20,21]. However, studies on the combined effects of temperature and CO2 have mainly focused on forest crops [22,23], food crops [24], and vegetables [25], with less attention to fruit trees [26,27,28]. In addition, there are few studies on photosynthesis and fruit quality changes due to elevated temperature under high CO2 conditions, particularly in fruit crops. Therefore, this study was conducted to analyze the photosynthetic changes in the early-maturing peach cultivar ‘Mihong’ subjected to elevated temperatures and 700 µmol·mol−1 CO2, the expected CO2 concentration in the mid-21st century, and to investigate the effects on growth and fruit quality.

2. Materials and Methods

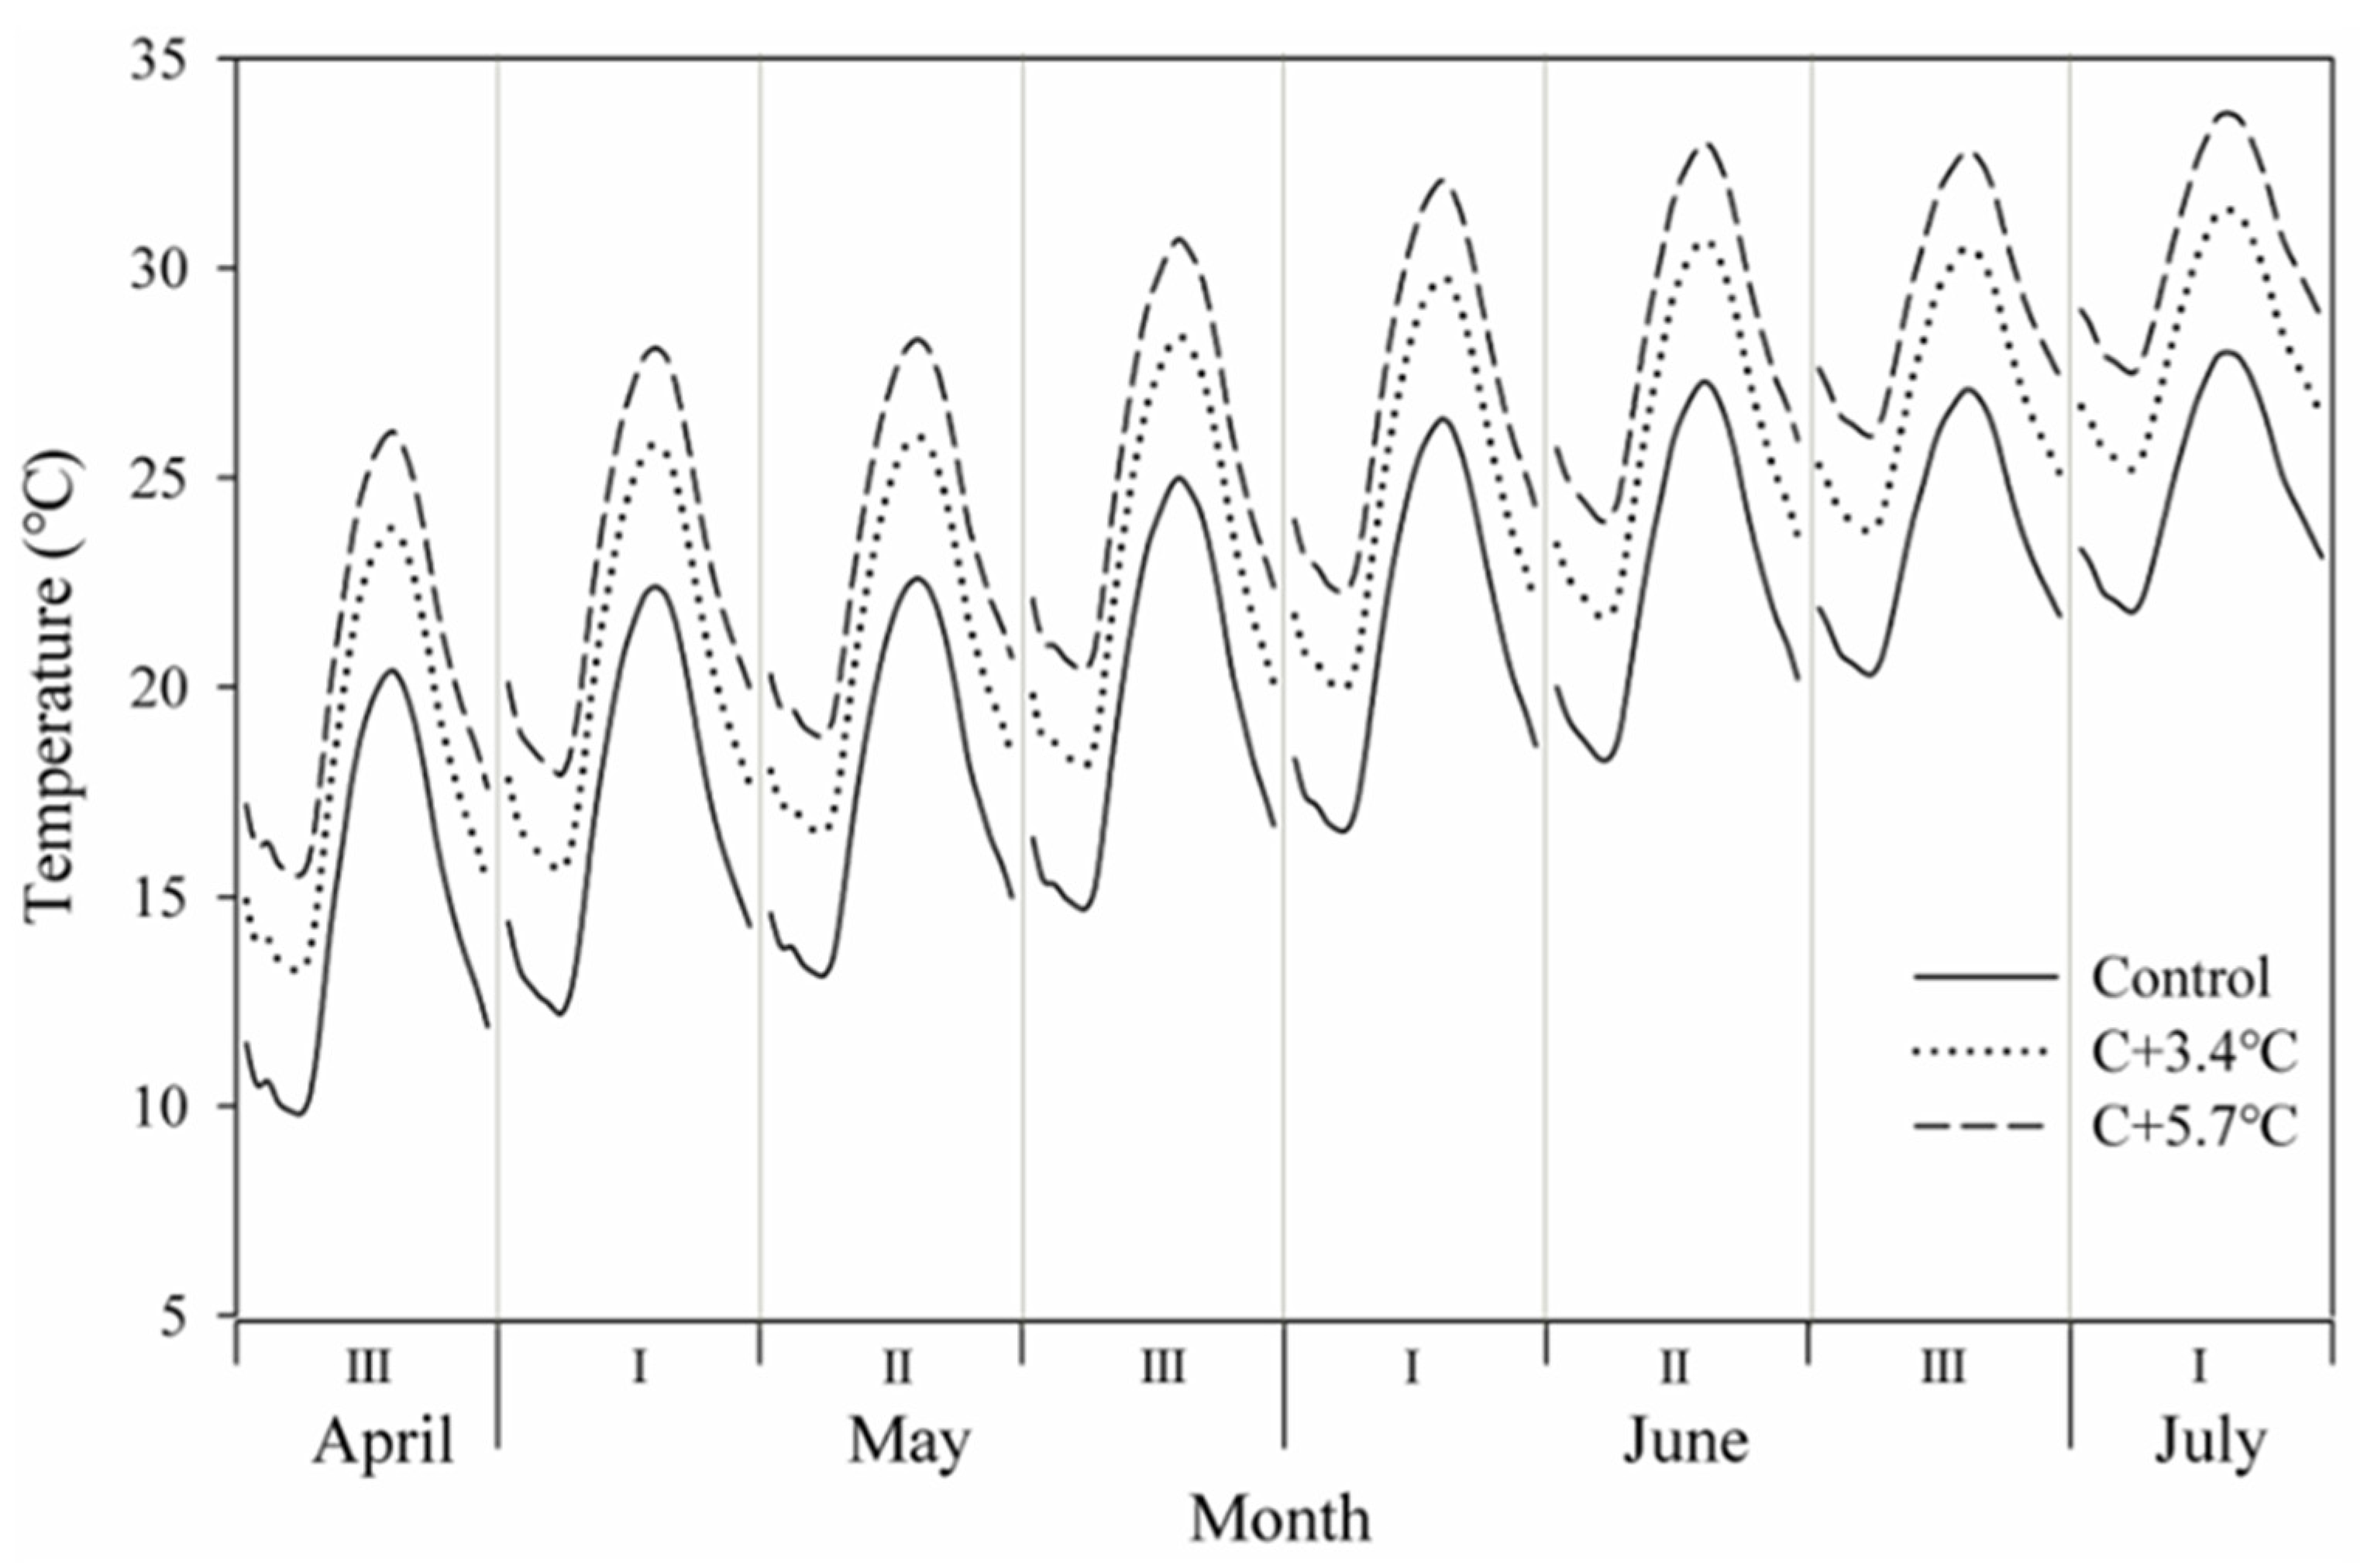
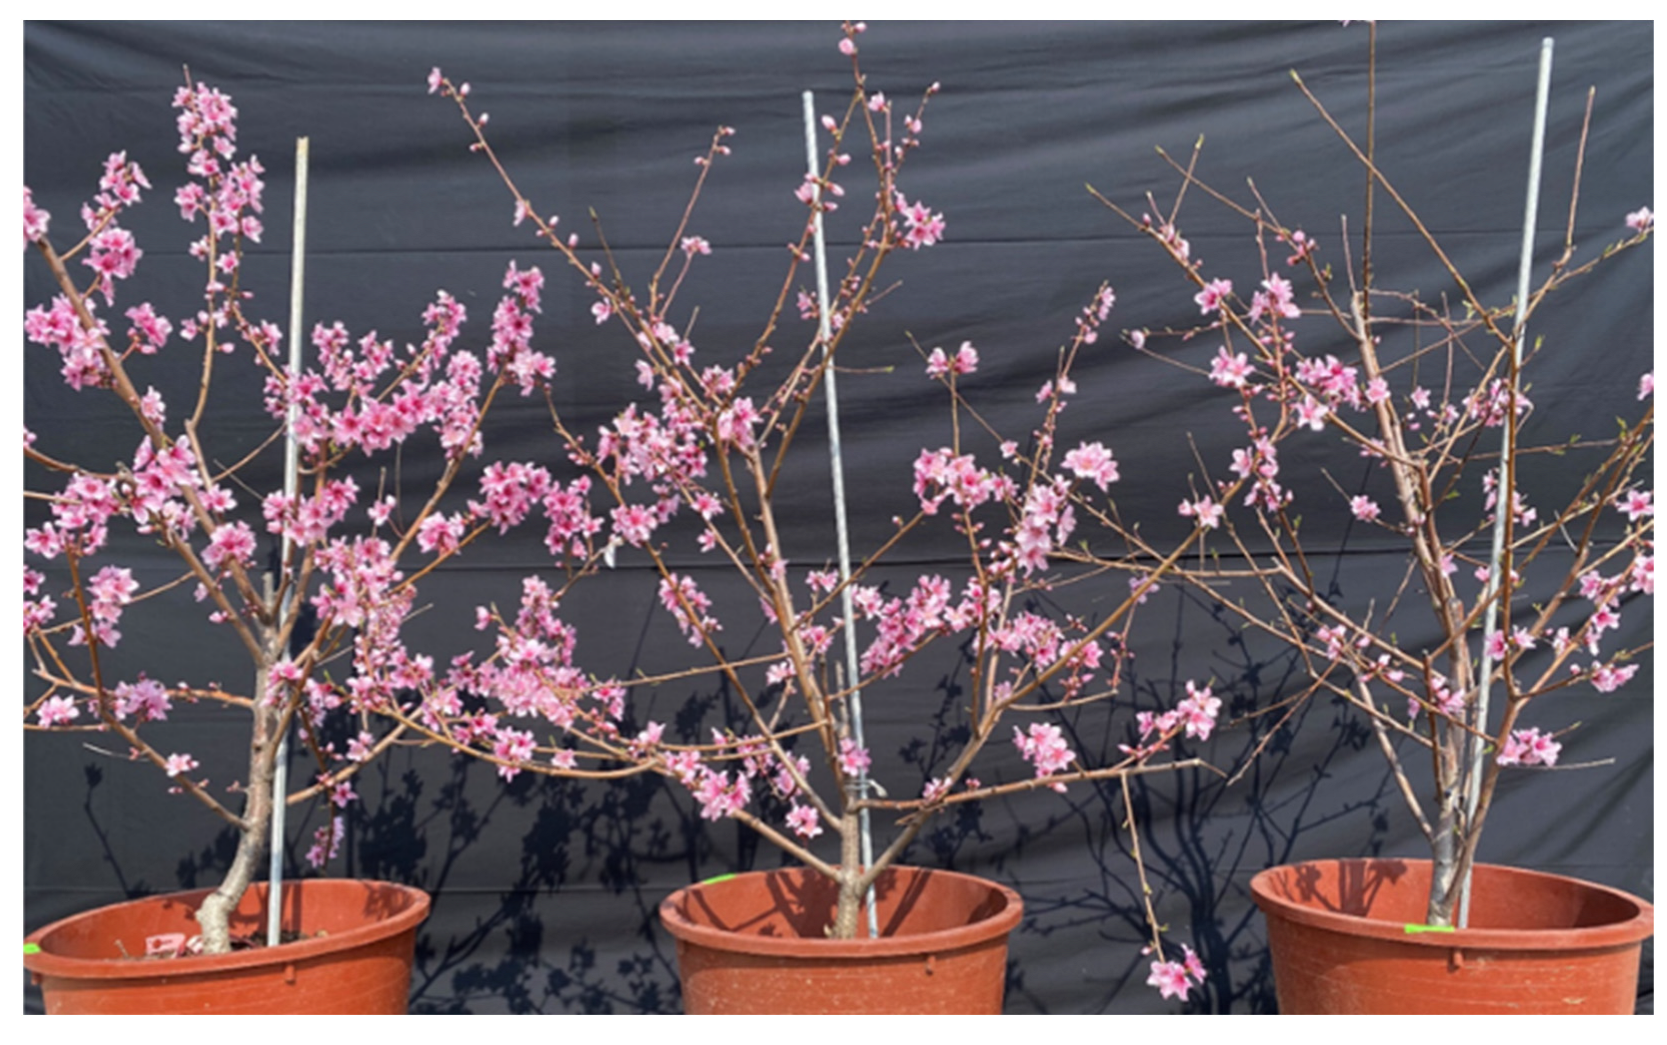
2.1. Plant Materials and Treatments

The plant material was 3-year-old ‘Mihong’ [Prunus persica (L.) Batsch], an early ripening peach variety, planted in 80-L pots at six pots per treatment. The experiment was conducted from 25 April to 5 July 2019, in a small glass greenhouse (W4.5 × D4.4 × H3 − 5 m) using natural light with a temperature and CO2 control system at the National Institute of Horticultural and Herbal Science, Wanju, Republic of Korea. The CO2 concentration in the control and all treatments was maintained at 700 µmol·mol−1 (mid-21st century levels) for 24 h during the experimental period using liquefied CO2 and a CO2 exposure equipment (Products assembled by DooYoung Ensys, Goyang-si, Seoul, Korea). The temperature of Jeonju from 1981 to 2010 was used as the control to simulate 24-h temperature fluctuations of the current situation. The average hourly temperature across 10 days was calculated based on the recorded temperatures in Jeonju and was used to implement a diurnal fluctuation. This diurnal fluctuation was then changed once every 10 days (Figure 1). The elevated temperature treatments were seen as an increase in the temperature of the control by 3.4 °C (mid-21st century) and 5.7 °C (late-21st century). To manage soil moisture, tensiometers (SR12; Irrometer Company Inc., Riverside, CA, USA) were installed into two pots in each treatment area, and when the average water potential reached −20 kPa, the pots were irrigated for 20 min to maintain proper soil water potential.

2.2. Gas Exchange Measurements

A fully expanded leave was selected from a shoot of average length in five pots of each treatment, tagged, and five leaves were used for measurements of photosynthetic parameters. The photosynthetic rate was measured using a portable photosynthesis system (Li-6400; LI-COR Biosciences, Lincoln, NE, USA) in the morning. Photosynthesis was measured at 1200 μmol∙m−2∙s−1 every 10 days from 20 May (10 days after foliation, DAF) to 27 June (48 DAF) to analyze changes in photosynthetic rate and stomatal conductivity. The temperature of the leaf chamber was set to the highest on the day of measurement for each treatment, and the relative humidity was 60–70%, the CO2 concentration was 700 µmol·mol−1, and the flow rate was 500 µmol·s−1.
For the light-curve, the photosynthetic rate was determined on May 20 (10 DAF) and 27 June (48 DAF) using light intensity (0, 50, 100, 200, 400, 800, 1200, and 1600 μmol∙m−2∙s−1) at 25 °C, 700 µmol·mol−1 CO2, and a flow rate of 500 µmol·s−1. The maximum photosynthetic rate, dark respiration rate, apparent quantum yield, and light compensation and light saturation points were calculated using the measured values of the photosynthetic rate and exponential model equations.

2.3. Chlorophyll and Starch Contents

Chlorophyll and starch contents were analyzed thrice at monthly intervals using randomly selected leaves of average size of three replications. Ten leaf discs with a radius of 0.5 cm per replication were collected, and 30 mL of MeOH was added for 24-h extraction. The absorbance of the extract was measured at 651 and 664 nm using a spectrophotometer (UV-2501PC; Shimadzu, Kyoto, Japan), and the total chlorophyll content was calculated as follows: total chlorophyll content (μg·cm2) = (25.5 × OD651 + 4 × OD664) × 0.3821656 [29]. The starch content was analyzed using 0.1 g of powder from the leaves used for chlorophyll analysis and a total starch assay kit (Megazyme, Wicklow, Ireland), according to the manufacturer’s instructions.

2.4. Fruit Quality and Tree Growth

To investigate mature fruit quality, the optimal physiological harvest date was determined when the coloration was more than 50% of the fruit skin and the firmness was less than 20 N. In this case, 30 fruits were harvested on 28 June (control), 24 (C+3.4 °C), and 19 (C+5.7 °C). Fruit weight, length, and width were measured. Fruit color was measured using a CR-300 Chroma Meter (Konica Minolta, Tokyo, Japan) at both centers in the vertical direction of the fruit suture. After peeling the fruit skin off the area where fruit color was measured in a circular shape with a diameter of 1 cm, firmness was measured using a texture analyzer (TAPlus; Lloyd Instruments, Bognor Regis, UK) equipped with an 8-mm probe. The fruit juice obtained by squeezing the firmness-measured flesh was used to determine the soluble solid and acid contents. The soluble solid content was measured using a digital refractometer (PAL-1; ATAGO, Tokyo, Japan). To measure the acid content, a solution obtained by adding 20 mL of distilled water to 5 mL of fruit juice was titrated against 0.1 N NaOH using an automatic titrator (TitroLine® 5000; SI Analytics GmbH, Mainz, Germany), and the amount of NaOH required until pH reached 8.2 was converted into malic acid.
The increase in the cross-sectional area of the trunk was calculated by measuring the diameter 10 cm above the base of the tree (six replications) in April (before starting temperature treatment) and July (after finishing the treatment). The leaf area, number of shoots, and shoot length were measured on July 1. The leaf area was measured using a leaf area meter (Li-3000C; LI-COR) by collecting 30 leaves of average size from 3 pots per treatment and then calculating the average value of one leaf. The number of shoots was calculated by counting the total number of shoots in six pots and calculating the average value. Shoot length was measured for 30 shoots selected as the average length. On 7 April 2020, the number of total floral and leaf buds in three pots was determined, and the floral bud differentiation rate was calculated by calculating the ratio of floral buds to the total number of buds.

2.5. Total Carbohydrate and Total Nitrogen

The total carbohydrate content was analyzed using powder from dried shoots of three replications collected in December 2019. Briefly, 0.5 g of powder was placed in test tubes, and then 20 mL of 0.7 N HCl was added for extraction at 100 °C for 3 h in a water bath. After extraction, the reaction was halted by adding a 2.5 mL dinitrosalicylic acid reagent. The carbohydrate content was determined at 550 nm using a spectrophotometer (Multiskan GO; Thermo Fisher Scientific, Waltham, MA, USA). Total nitrogen was analyzed using a CN element analyzer (Primacs SNC-100; Skalar Analytical B.V., Breda, The Netherlands).

2.6. Statistical Analysis

An analysis of both variance (ANOVA) and two-way ANOVA were performed in R version 4.0 (R Foundation for Statistical Computing, Vienna, Austria), and Duncan’s multiple range test was applied at p ≤ 0.05 for comparisons among treatments.

3. Results

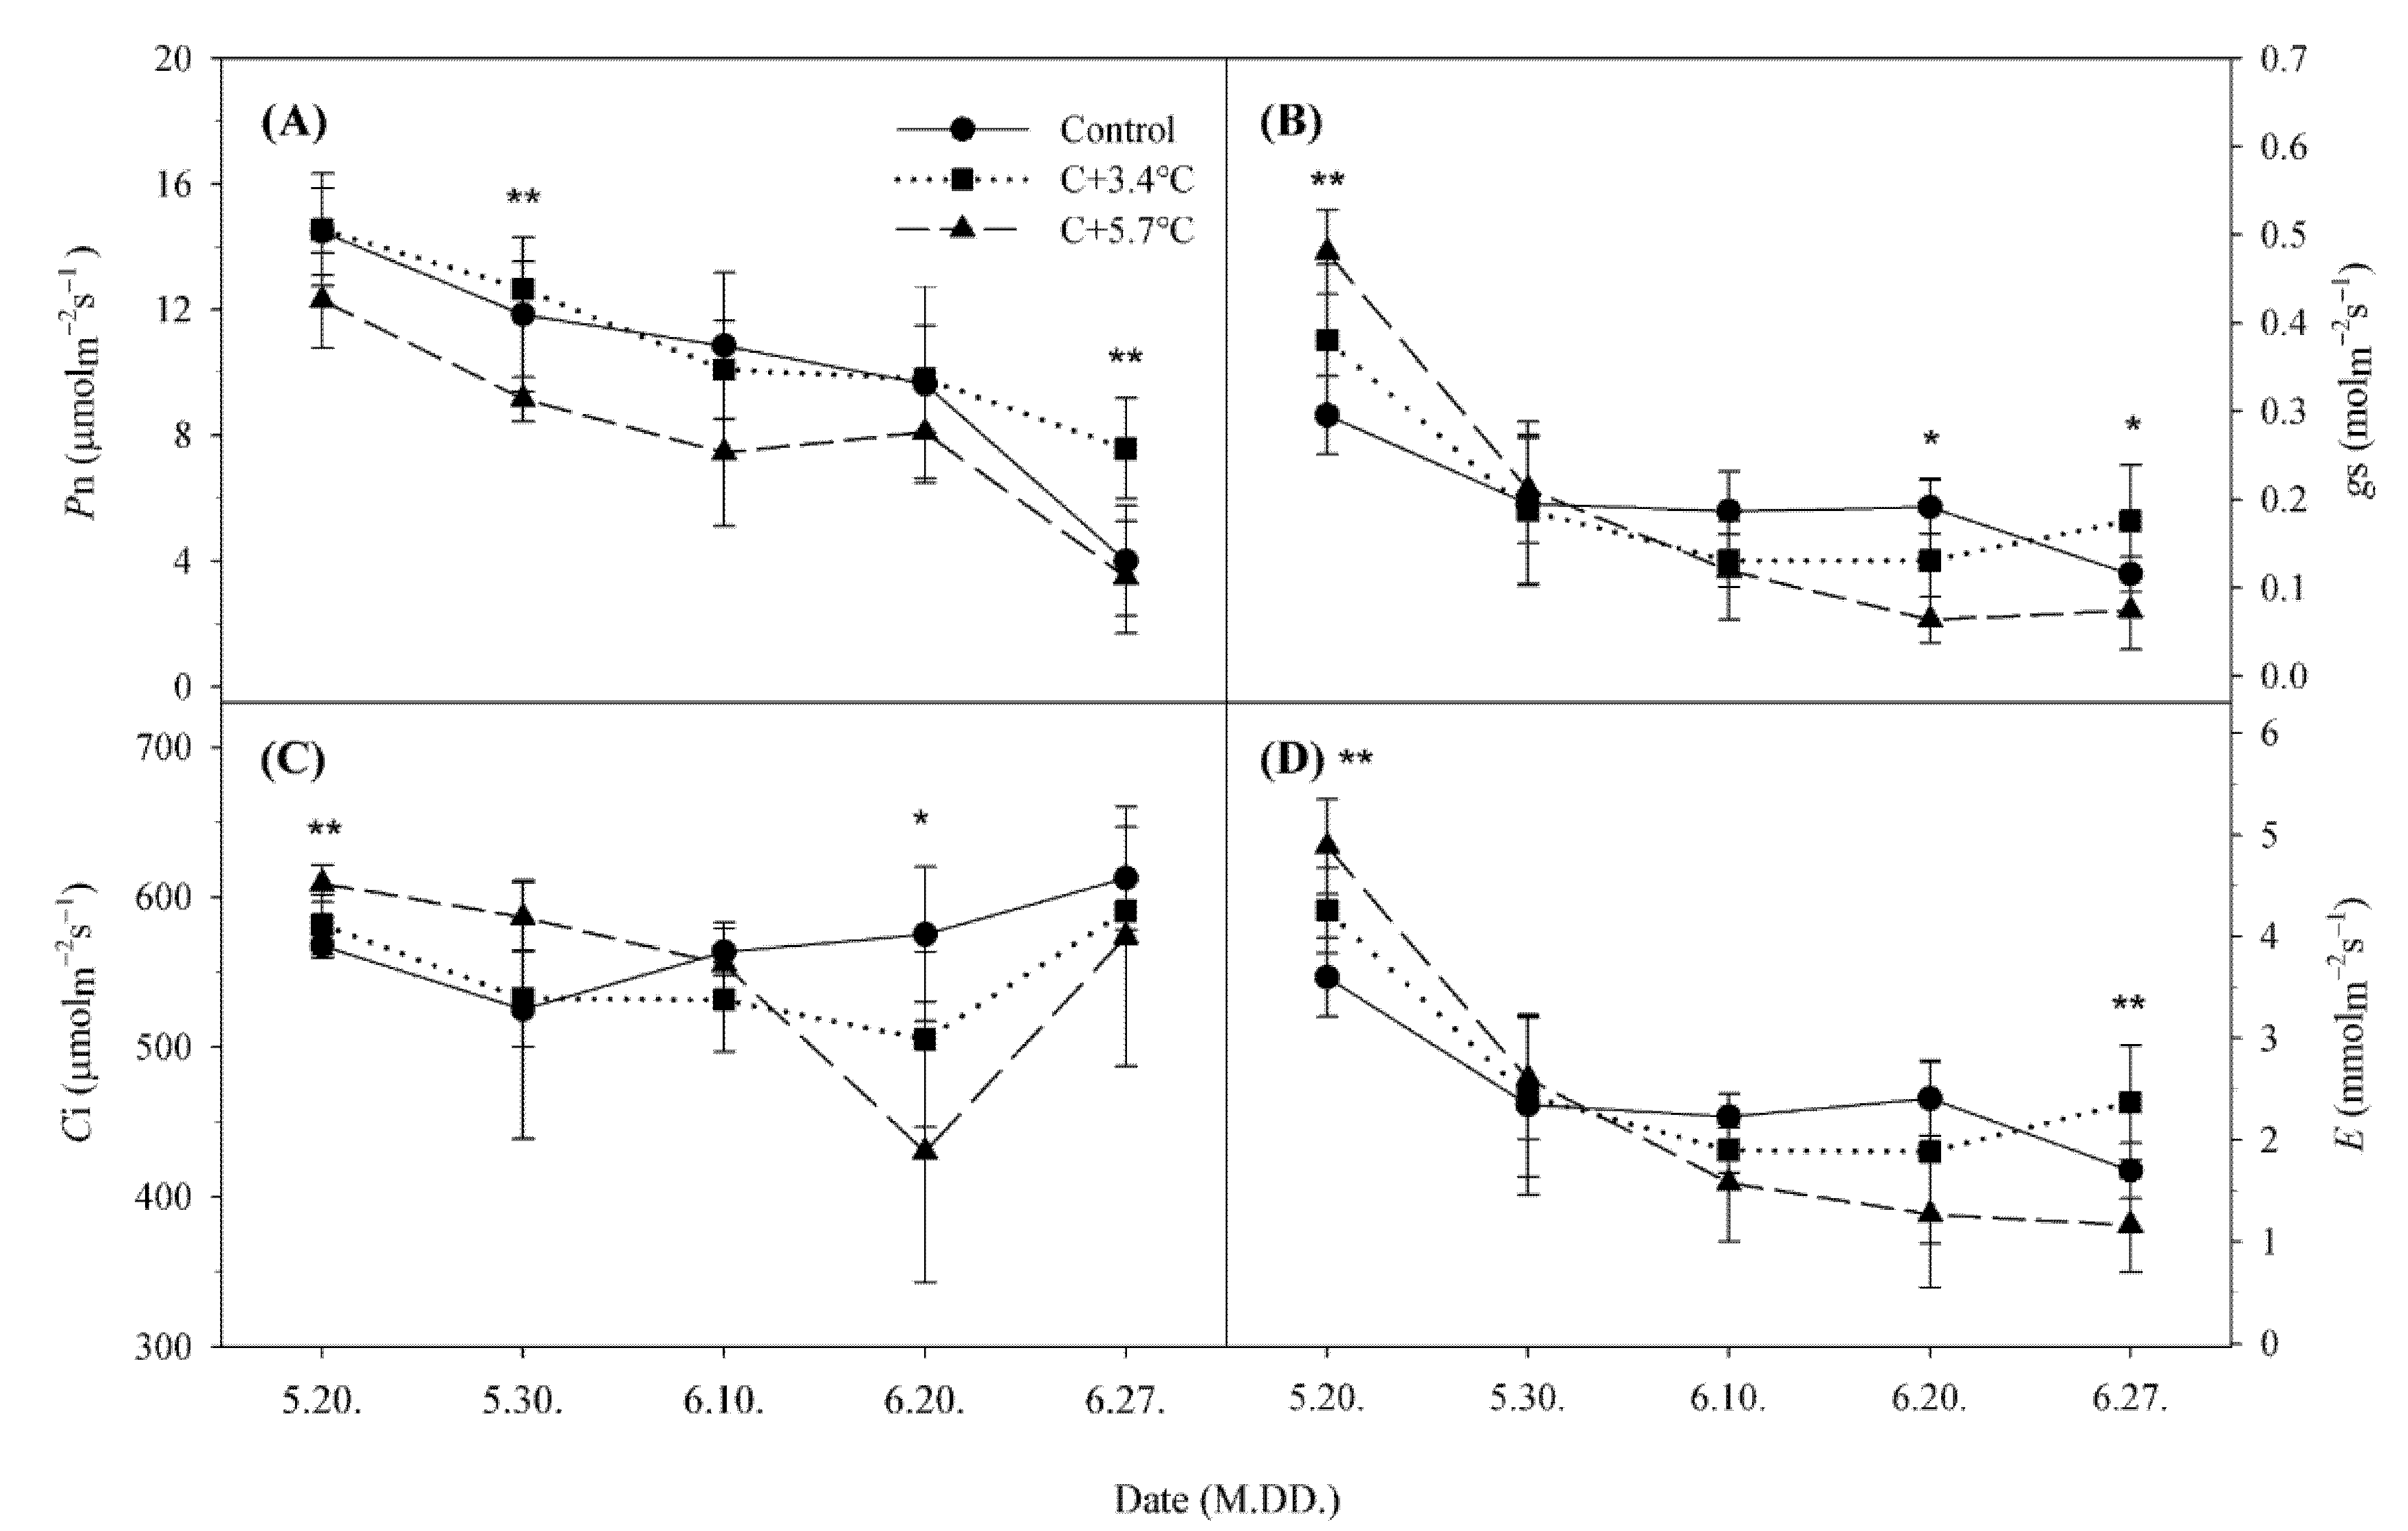
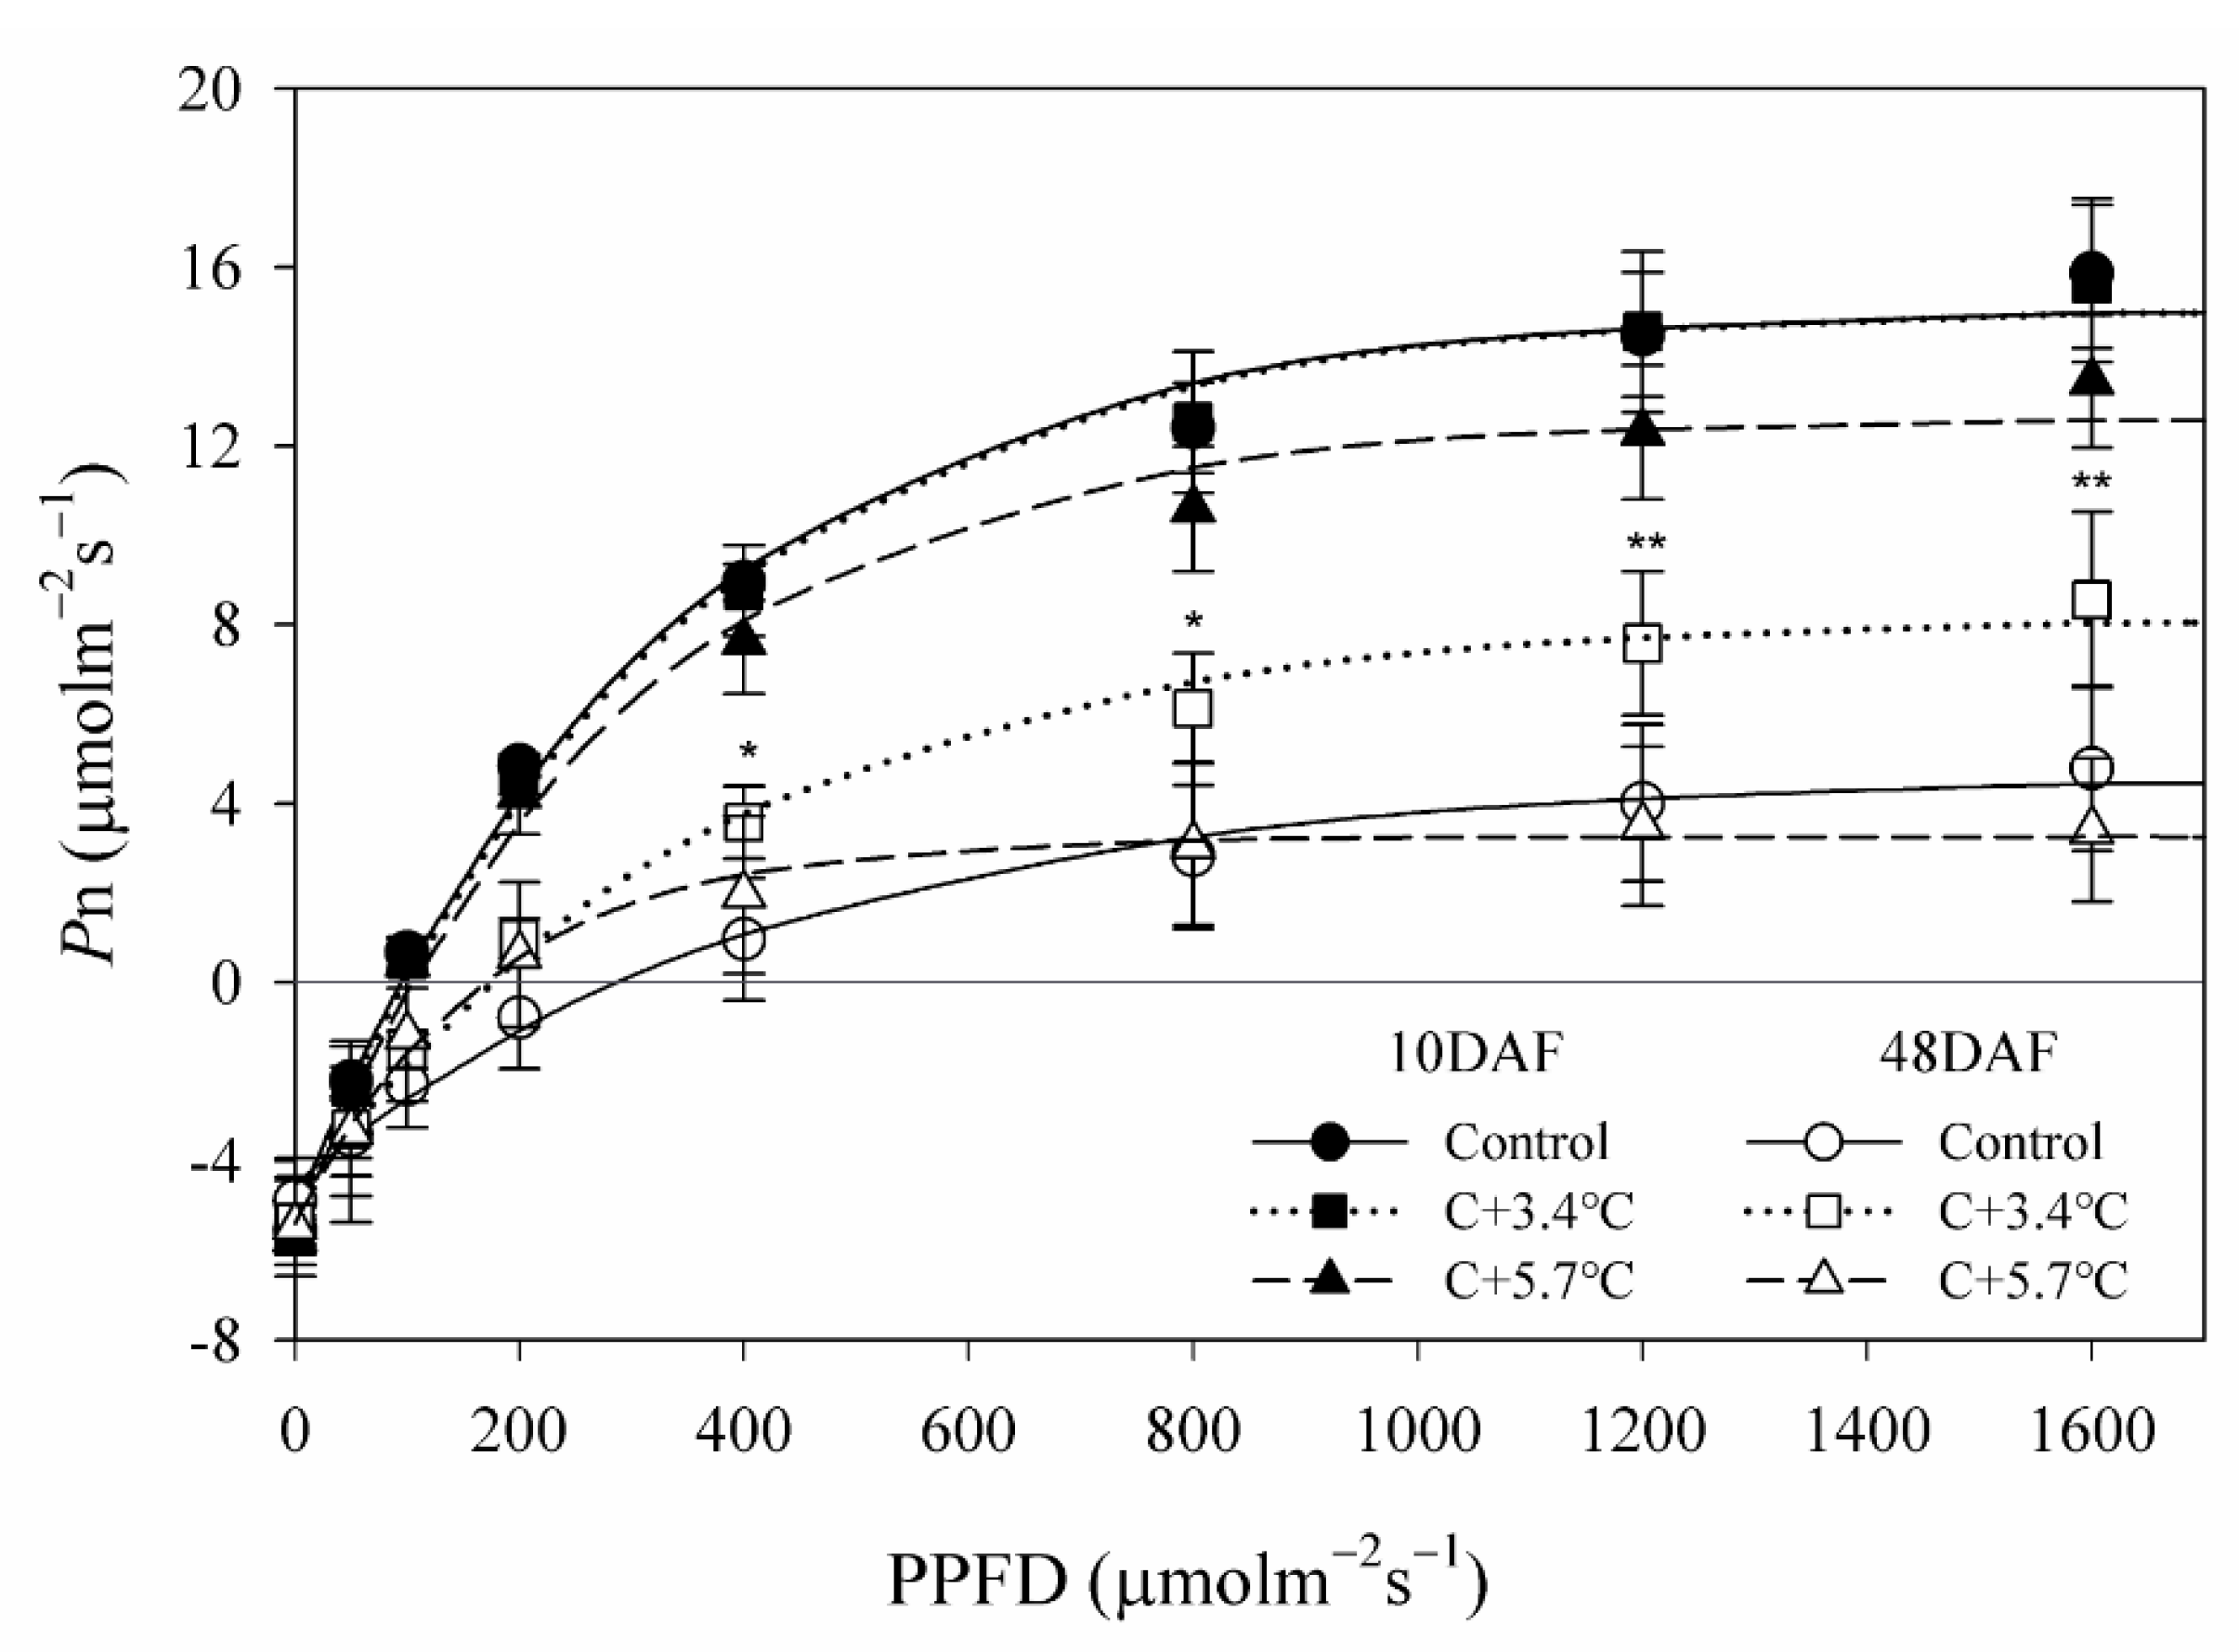
3.1. Photosynthetic Characteristics

To investigate the changes in photosynthetic characteristics as growth progressed, the photosynthesis rate, stomatal conductance, intracellular CO2 concentration, and transpiration rate were measured at 1200 μmol∙m−2∙s−1 at 10-day intervals from 20 May (10 DAF). In all treatments, the photosynthetic rate decreased toward the later stages of growth. Overall, the photosynthetic rate of the C+5.7 °C treatment was lower than those of the control and C+3.4 °C treatment. The average photosynthetic rate was the highest in the C+3.4 °C treatment (10.64 μmol∙m−2∙s−1), followed by the control (10.21 μmol∙m−2∙s−1) and C+5.7 °C treatment (8.18 μmol∙m−2∙s−1) (Figure 2A). The stomatal conductance of all treatments decreased toward the later growth stage, particularly that of the C+5.7 °C treatment, which decreased sharply in the later growth stage rather than in the early stage (Figure 2B). The intracellular CO2 concentration of the control gradually increased after 30 May; however, those of the C+3.4 °C and C+5.7 °C treatments tended to decrease until 20 June, particularly that of the C+5.7 °C treatment, which was very low compared with those of the other treatments on 20 June, the harvest period (Figure 2C). The transpiration rate of all treatments decreased toward the later stages of growth with a similar trend to that of stomatal conductance (Figure 2D).
The light-curve was plotted using the photosynthetic rate measured on 20 May (10 DAF) and 27 June (48 DAF), and photosynthetic characteristics were calculated using the light-curve (Figure 3, Table 1). The maximum photosynthetic rate of all treatments decreased after harvest (48 DAF), particularly that of the C+5.7 °C treatment, which decreased by 74% and was the lowest at 3.25 μmol∙m−2∙s−1. The dark respiration rate showed no significant difference, but it tended to increase as temperature increased. The apparent quantum yield of all treatments decreased after harvest (48 DAF), whereas the light compensation points of all treatments increased after harvest (48 DAF). The light saturation points of all treatments were similar at 980–1100 μmol∙m−2∙s−1 on 20 May (10 DAF); however, on 27 June (48 DAF), those of the control and C+3.4 °C treatment increased, whereas that of the C+5.7 °C treatment decreased by 29% to 700 μmol∙m−2∙s−1 (Table 1).

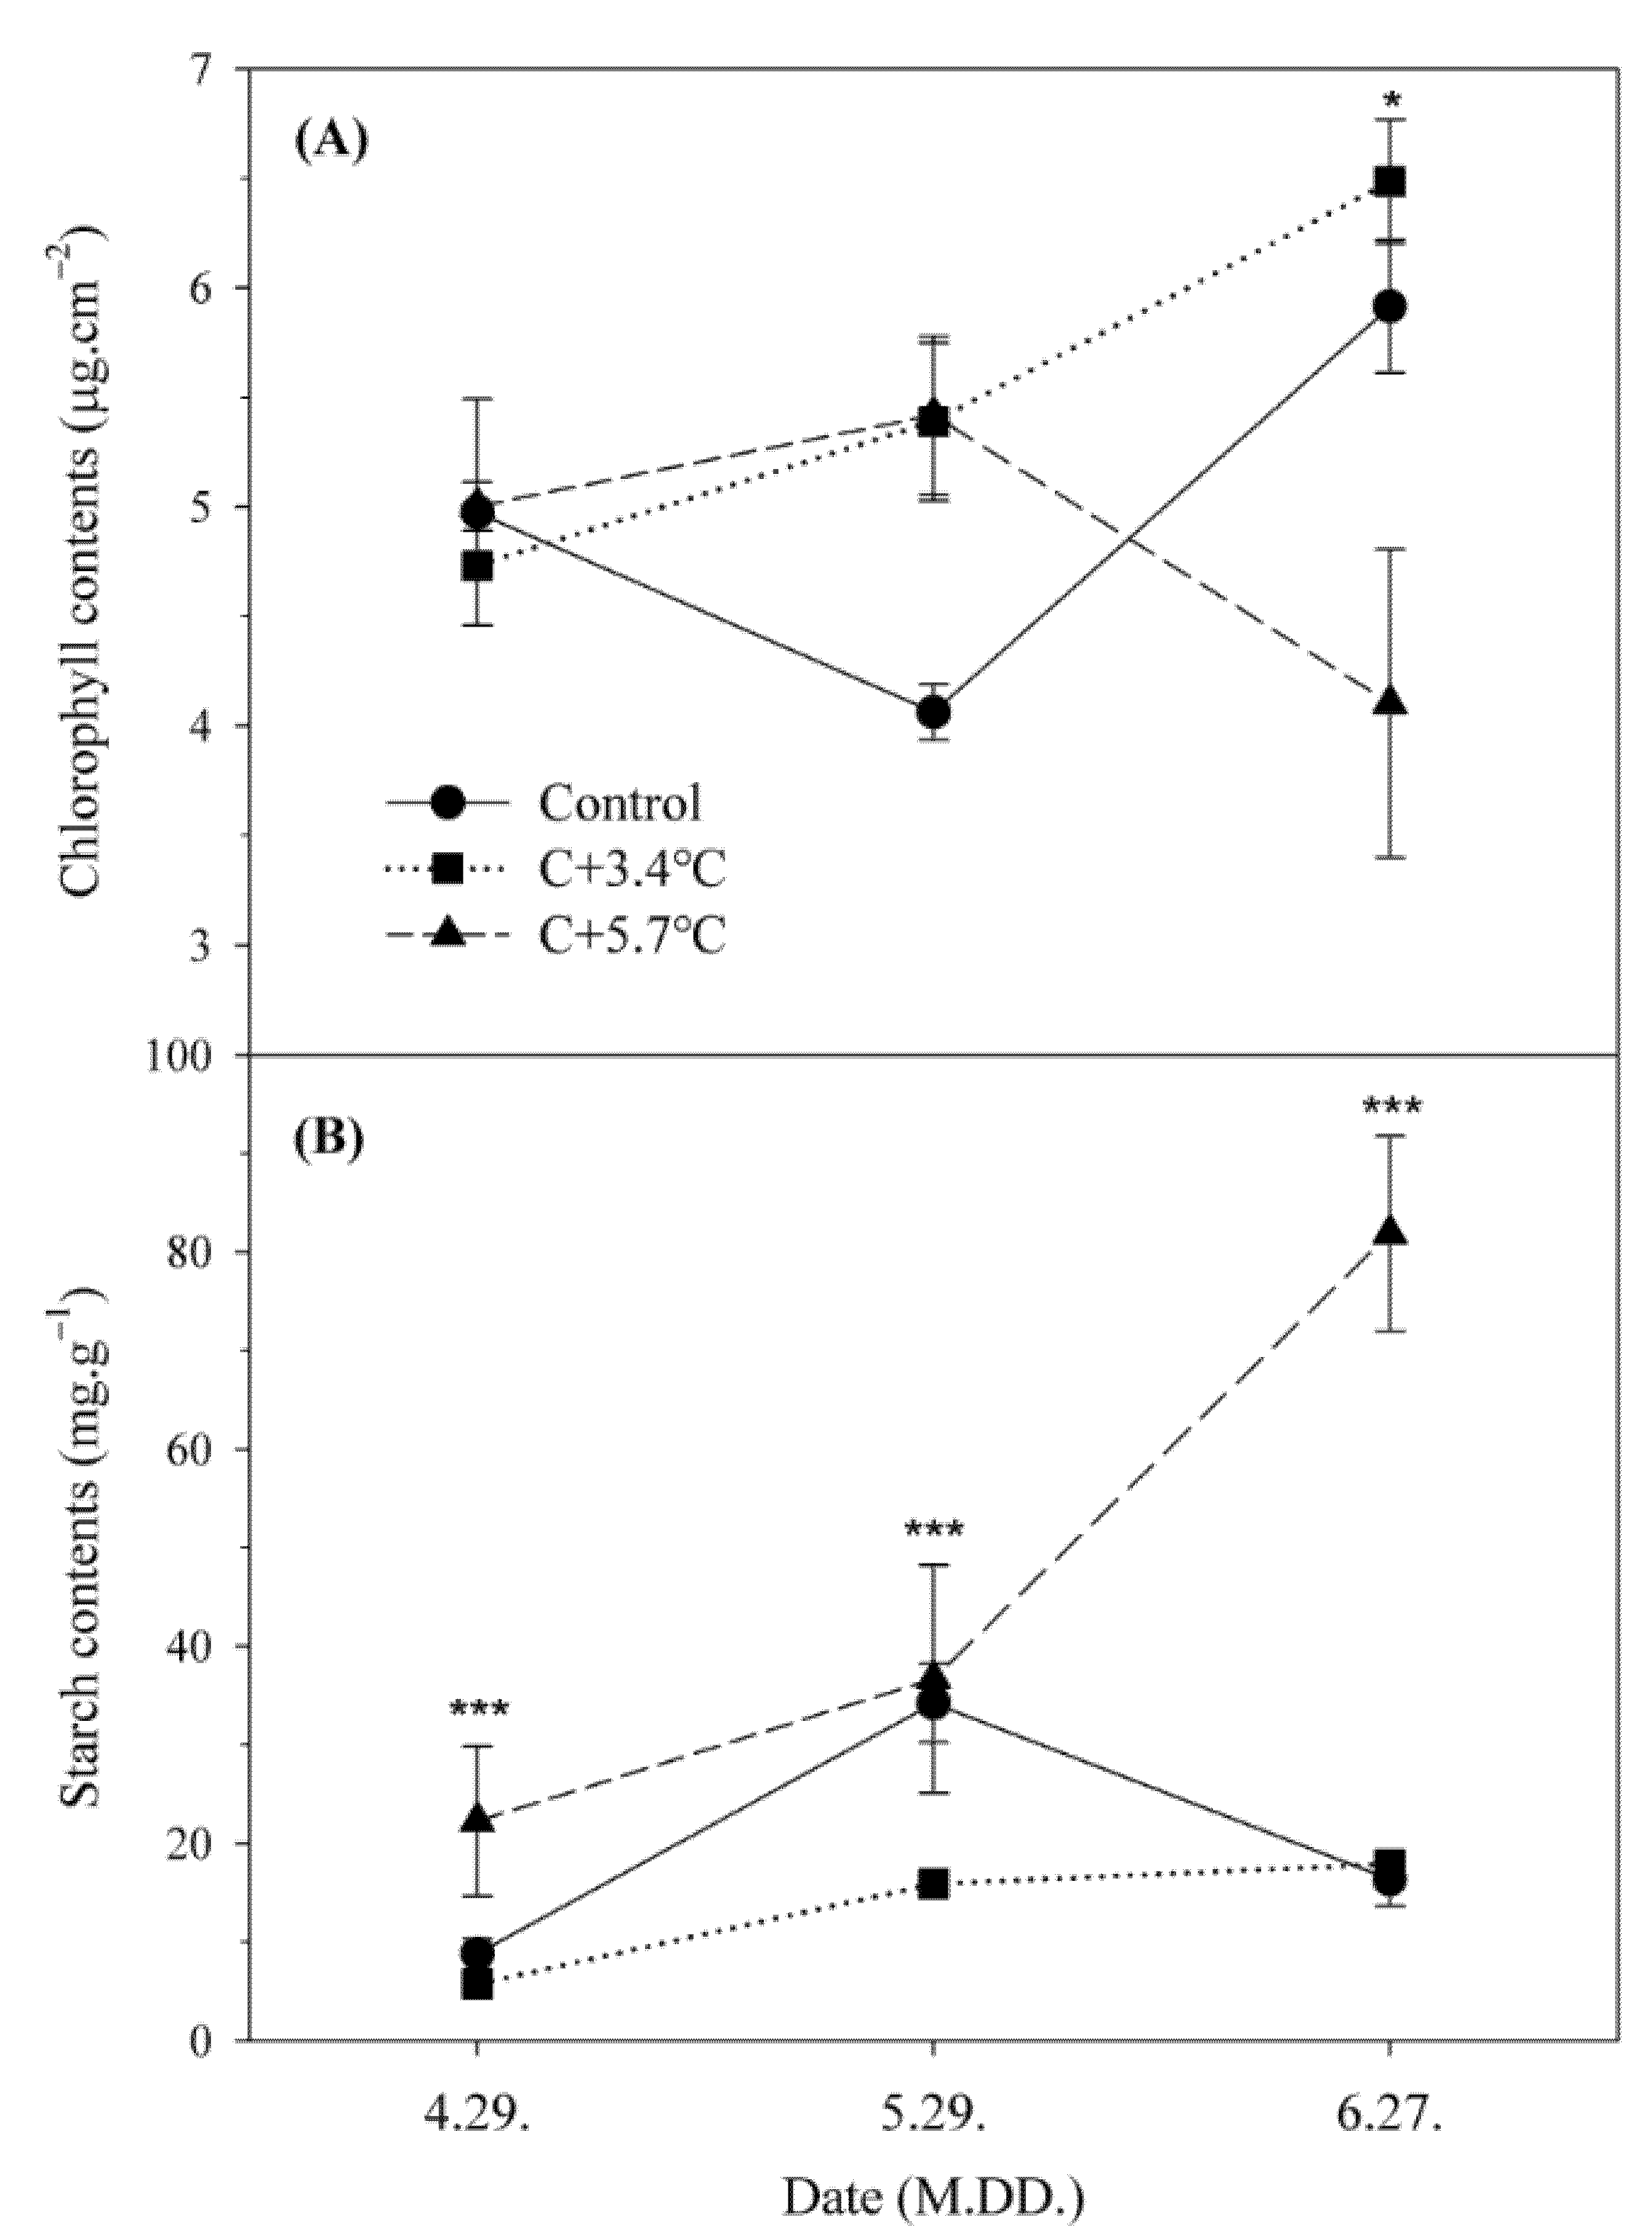
3.2. Chlorophyll and Starch Contents

The content of chlorophyll, a photosynthetic apparatus, in the control and C+3.4 °C treatment increased on 27 June, after harvest, compared with that on 29 April. However, the chlorophyll content in the C+5.7 °C treatment increased on 29 May and then decreased sharply on 27 June (Figure 4). In addition, leaf chlorosis and foliation started earlier in the C+5.7 °C treatment than in the other treatments. The content of starch, a photosynthate, increased as growth progressed in all treatments, particularly that of the C+5.7 °C treatment, which increased sharply on 27 June (Figure 4).

3.3. Fruit Quality and Tree Growth

The harvest dates for the C+5.7 °C and C+3.4 °C treatments and the control were 19, 24, and 28 June, respectively, which became earlier as the temperature increased. The fruit weight in the C+3.4 °C treatment was 158.2 g, the heaviest, and those of the C+5.7 °C treatment and control were 129.5 and 127.3 g, respectively. Similar to the fruit weight trend, fruit length and width were largest at 63.2 and 69.6 mm, respectively, in the C+3.4 °C treatment. The firmness was higher in the elevated temperature treatments than control. As the temperature increased, the soluble solid content decreased, and acid content increased. Hunter L* and b* values decreased in the elevated temperature treatments compared with those in the control, whereas the a* value increased in the elevated temperature treatments relative to that in the control (Table 2).
There was no significant difference in the increase in trunk cross-sectional and leaf areas. However, the leaf area of the C+3.4 °C treatment was widest at 29.9 cm2. The number of shoots decreased in the elevated temperature treatments relative to that in the control, whereas shoot length increased in the elevated temperature treatments (Table 3).

3.4. Floral Bud Differentiation, Total Carbohydrate, and Total Nitrogen

In contrast, there was no significant difference in the number of floral buds, but that of the C+5.7 °C treatment was the lowest at 187 ea. Furthermore, the number of leaf buds was higher in the elevated temperature treatments than in the control. In addition, the total bud number was the highest in the control at 620 ea and lowest in the C+5.7 °C treatment at 440 ea. Therefore, the floral bud differentiation rate decreased with increasing temperature to 70.2% in the control, 53.2% in the C+3.4 °C treatment, and 41.3% in the C+5.7 °C treatment (Table 4). Moreover, although the shoot length of the C+5.7 °C treatment was greater, the floral bud differentiation rate was low, and these results show that the flower density of the C+5.7 °C treatment was relatively lower than that of the control (Figure 5).
The total carbohydrate and nitrogen contents of first-year shoots were analyzed, and the C/N ratio was calculated. Total carbohydrate content was the highest in the C+3.4 °C treatment, followed by the C+5.7 °C treatment and control. Furthermore, the nitrogen content increased as the temperature increased, and that of the C+5.7 °C treatment was the highest at 0.65%. There was no significant difference in the C/N ratio, but it decreased as the temperature increased, and the C/N ratio of the C+5.7 °C treatment was the lowest at 44.9% (Table 5).

4. Discussion

4.1. Changes in Photosynthetic Characteristics According to Temperature under High CO2 Concentration

As a result of measuring the photosynthetic rate at 10-day intervals under 700 μmol·mol−1 CO2 conditions, the average photosynthetic rate was the highest and lowest in the C+3.4 °C and C+5.7 °C treatments, respectively (Figure 2). In stone fruits, the photosynthetic rate increases with temperature up to 30 °C, above which the respiration rate increases and net photosynthetic rate decreases [30]. Therefore, the net photosynthetic rate at C+3.4 °C was increased because the temperature was increased within the range to promote photosynthesis. Moreover, in peach, increases in CO2 concentration of up to 700 μmol·mol−1 increase the photosynthetic rate as intracellular CO2 concentration (Ci) increases [31]. In addition, the photosynthetic performance was higher at ambient temperature+4 °C under 700 μmol·mol−1 CO2 concentration compared to the current situation [26,32]. Therefore, under the high CO2 concentration of 700 μmol·mol−1, temperature elevation by 3.4°C, which is a mild temperature increase, increases the net photosynthetic rate of the peach variety ‘Mihong,’ whereas temperature elevation above 5.7 °C decreases the net photosynthetic rate along with an increase in the respiration rate.
In addition, the light saturation points of the control and C+3.4 °C treatment increased, whereas that of the C+5.7 °C treatment decreased to 700 μmol∙m−2∙s−1 (Table 1). The light saturation point increases as the temperature increases but decreases at 25–30 °C or higher [33]. Therefore, the light saturation point of the C+5.7 °C treatment was reduced by increasing temperature, suggesting that the photosynthetic rate no longer increased when the light was above the saturation point during summer. In addition, these results indicate that the photosynthetic efficiency of the C+5.7 °C treatment is lower than those of the other treatments.
The chlorophyll content of the C+5.7 °C treatment decreased after harvest and was 70% lower than that of the control (Figure 4A), with leaf chlorosis and foliation starting earlier than those in the other treatments. Chlorophyll can be used to indirectly estimate photosynthetic efficiency, and an increase in chlorophyll content increases the photosynthetic rate [34]. However, in apples, the photosynthetic rate is reduced by leaf senescence as the growing season progresses [35], and harvest accelerates leaf senescence while breaking down chlorophyll [36]. In addition, senescence starts early in plants grown under long-term high temperatures and high CO2 conditions [37]. Therefore, these results confirm that the chlorophyll content of the C+5.7 °C treatment decreased, and early senescence was accelerated due to long-term exposure to high temperature and CO2 concentrations and early harvest.
The starch content of the C+5.7 °C treatment increased rapidly on June 27 (48 DAF) after harvest (Figure 4B). The translocation and partitioning of photosynthate are affected by sink strength. For example, in Rosaceae fruit crops, such as peaches and apples, photosynthate is stored in the leaves as starch, converted to sorbitol, and transferred to the fruit [38]. In addition, removing fruit, the sink organ, reduces photosynthesis [36], and assimilate accumulation in leaves increases [39]. These results suggest that, despite the low photosynthetic rate of the C+5.7 °C treatment, since the fruit was removed, translocation to the sink was not required; therefore, photosynthate was not converted to sorbitol but was accumulated as starch. Excessive accumulation of assimilates, such as starch, in leaves physically restricts the light reaching the thylakoids, inhibiting the light-dependent photosynthetic step. It can also destroy the photosynthetic apparatus [40], and the accumulation of nonstructural carbohydrates reduces chlorophyll content [41]. Accordingly, the reduction in chlorophyll content in the C+5.7 °C treatment is thought to be exacerbated by large amounts of accumulated starch particles. Therefore, the findings confirmed that harvest was accelerated by high temperatures in the C+5.7 °C treatment, resulting in negative feedback, including decreased photosynthate translocation due to removal of fruit and inhibition of photosynthesis and destruction of photosynthetic apparatus because of starch accumulation in the leaf.

4.2. Changes in Fruit Quality According to Temperature under High CO2 Concentration

The harvest date was earlier as the temperature increased, shortening the fruit growth period. Furthermore, the fruit weight of the C+5.7 °C treatment was similar to that of the control, but that of the C+3.4 °C treatment increased by 24% of the control (Table 2). In peaches, the temperature of the fruit growing season affects the harvest date and fruit growth, size, and quality at harvest [42]. In fruit crops, such as peaches [43] and grapes [44], harvest is advanced due to the increased temperature during the growing season. Additionally, the spring temperature within 30 days after flowering can be used to predict the harvest date of peaches, and high temperatures increase the rates of fruit growth but shorten the growing days [45]. Our results show that temperature elevation by 3.4 °C increases fruit weight by increasing fruit growth and photosynthetic rates, and that temperature elevation by 5.7 °C shortens the fruit growth period with decreasing photosynthetic rates. Fruit growth is also affected by CO2 concentration and is promoted as CO2 concentration increases up to the CO2 saturation point. Under ambient CO2 concentration conditions (400 μmol·mol−1), temperature elevation by 3.4 °C increased the fruit weight of ‘Mihong’ peaches by 10% compared with that of the control, whereas temperature elevation by 5.7 °C decreased fruit weight by 11% [43]. However, decreased fruit weight due to high temperature was ameliorated under high CO2 conditions in pears [26] and grapes [46]. Our results also show that the fruit weight of the C+5.7 °C treatment recovered to control levels due to high CO2 concentrations (700 μmol·mol−1). Therefore, these results suggest that the negative effect of fruit weight reduction due to the 5.7 °C temperature increase was mitigated by the high CO2 concentration.
The soluble solid content decreased, and acid content increased as temperature increased (Table 2). Soluble solids and acid contents are affected by growth temperature and CO2 concentration [47]. Under high CO2 conditions, the soluble solid content of tomatoes increased [48], that of strawberries increased, and their acid content decreased [49]. However, the soluble solid content of strawberries and tomatoes decreased as temperature increased [50,51], and there was a strong negative correlation between temperature and soluble solid content [52]. Our results also showed that the soluble solid content decreased with increasing temperature in a trend similar to that of previous studies. The color of the fruit skin is also affected by the external environment, including light and temperature [53], and in several crops, the anthocyanin content of the fruit skin decreases as temperature increases [54,55]. However, in the present study, the a* value, which indicates red color, was the highest in the C+3.4 °C treatment, whereas the L* and b* values were the lowest (Table 2). As apples reach maturity, ethylene concentration and pigmentation increase; ethylene content and anthocyanin accumulation are highly correlated [56]. Therefore, it is supposed that in the current study, maturity was quickly reached as temperature increased, and red coloration was promoted due to increasing ethylene.
Taken together, under high CO2 conditions (700 μmol·mol−1), temperature elevation by 3.4 °C improves fruit quality, including fruit weight, size, acid content, and skin color. In contrast, temperature elevation by 5.7 °C or more decreases fruit quality, including fruit weight and soluble solid content. In addition, temperature elevation by 5.7 °C accelerated harvest and shortened the fruit growth period, but fruit weight was maintained at control levels due to high CO2 concentrations (700 μmol·mol−1).

4.3. Changes in Floral Bud Differentiation According to Temperature under High CO2 Concentration

The floral bud differentiation of fruit trees depends on environmental conditions, such as weather conditions and cultivation methods, and its level affects the yield of the following year [57]. As the temperature increased, the number of floral and total buds decreased, and floral bud differentiation in the C+5.7 °C treatment was the lowest (Table 4). The floral bud differentiation of peaches begins in early summer, and after dormancy, the formation of flower organs is completed in winter [58]. However, floral bud differentiation may start earlier in warm regions but may be inhibited by high temperatures [59]. Therefore, our results show that although the initiation of floral bud differentiation was accelerated by the 5.7 °C temperature increase, flower development was abnormal due to the high temperature.
Floral bud differentiation is affected by nutrient accumulation, and flower differentiation and development are reduced by high N concentrations, i.e., a low C/N ratio [60]. In the present study, the C/N ratio decreased as temperature increased, being the lowest in the C+5.7 °C treatment (Table 5). This decrease in the C/N ratio was due to the high N content in the C+5.7 °C treatment, and N absorption increased seemingly as a result of increased irrigation due to high temperature [61]. Moreover, floral bud differentiation and vegetative growth compete, and when vegetative growth is vigorous, floral bud differentiation is reduced [62]. In the present study, the shoot length of the elevated temperature treatments increased relative to that of the control, and vegetative growth appeared to be dominant (Table 3). Vigorous shoot growth can reduce light penetration, and it is hypothesized that floral bud differentiation is suppressed due to light blocking [63]. In addition, low chlorophyll content and early defoliation were confirmed in the C+5.7 °C treatment at the late growth stage (Figure 4). Floral bud differentiation is reduced following the timing and intensity of early defoliation in various crops [64,65]. Therefore, it is presumed that the C+5.7 °C treatment reduced the floral bud differentiation rate due to the low C/N ratio, vegetative growth dominance, and early defoliation. However, a detailed analysis of growth, including node length and vegetative growth, should be performed in future research.

5. Conclusions

Temperature elevation by 3.4 °C relative to the control (current situation) under high CO2 concentrations (700 μmol·mol−1) increased the net photosynthetic rate and chlorophyll, thereby improving fruit quality by increasing fruit weight and size and enhancing pigmentation of the early-maturing ‘Mihong’ peach variety. In addition, the appropriate C/N ratio due to the high carbohydrate content had a positive effect on floral bud differentiation rate. However, temperature elevation by 5.7 °C decreased the net photosynthetic rate due to an increased respiration rate, rapidly decreased chlorophyll content, and increased starch accumulation in the leaf. In addition, the floral bud differentiation rate was decreased because of the low C/N ratio, vegetative growth dominance, and early defoliation. Fruit quality also deteriorated due to decreased fruit weight and soluble solid content. However, fruit size at the control level was maintained due to the high CO2 concentration (700 μmol·mol−1). Consequently, following the climate change scenario RCP 8.5 under 700 μmol·mol−1 CO2 concentration conditions in the mid-21st century, a temperature increase of 5.7 °C will decrease the physiological response, fruit quality, and floral bud differentiation of the early-maturing peach cultivar ‘Mihong,’ and also reduce its yield in the following year.

Author Contributions

Conceptualization, S.K.L. and J.H.H.; methodology, J.G.C.; validation, S.K.L., J.H.H. and D.G.C.; formal analysis, S.R. and K.-S.L.; investigation, S.K.L.; resources, J.H.J.; data curation, S.K.L.; writing—original draft preparation, S.K.L.; writing—review and editing, J.H.H. and D.G.C.; visualization, S.K.L.; supervision, S.K.L.; project administration, S.K.L.; funding acquisition, S.K.L. All authors have read and agreed to the published version of the manuscript.

Funding

This research was funded by NIHHS, RDA, Korea, grant number PJ01358601.

Data Availability Statement

Not applicable.

Acknowledgments

The authors thank Ji Hae Jun at the National Institute of Horticultural and Herbal Science, Rural Development Administration for critical reading of the manuscript.

Conflicts of Interest

The authors declare no conflict of interest.

References

  1. Korea Meteorological Administration. Climate Change Report; Korea Meteorological Administration: Seoul, Korea, 2012; p. 21. [Google Scholar]
  2. Bhargava, S.; Mitra, S. Elevated Atmospheric CO2 and the Future of Crop Plants. Plant Breed. 2021, 140, 1–11. [Google Scholar] [CrossRef]
  3. Korea Meteorological Administration. 2020 Analysis Report of Climate Change; Korea Meteorological Administration: Seoul, Korea, 2021; p. 13. [Google Scholar]
  4. World Meteorological Organization. State of the Global Climate 2020; World Meteorological Organization: Geneva, Switzerland, 2020; pp. 2–3. [Google Scholar]
  5. Kunz, A.; Blanke, M. “60 Years on”—Effects of Climatic Change on Tree Phenology—A Case Study Using Pome Fruit. Horticulturae 2022, 8, 110. [Google Scholar] [CrossRef]
  6. Arrizabalaga-Arriazu, M.; Morales, F.; Irigoyen, J.J.; Hilbert, G.; Pascual, I. Growth Performance and Carbon Partitioning of Grapevine Tempranillo Clones Under Simulated Climate Change Scenarios: Elevated CO2 and Temperature. J. Plant Physiol. 2020, 252, 153226. [Google Scholar] [CrossRef] [PubMed]
  7. Sugiura, T.; Ogawa, H.; Fukuda, N.; Moriguchi, T. Changes in the Taste and Textural Attributes of Apples in Response to Climate Change. Sci. Rep. 2013, 3, 2418. [Google Scholar] [CrossRef] [Green Version]
  8. Medda, S.; Fadda, A.; Mulas, M. Influence of Climate Change on Metabolism and Biological Characteristics in Perennial Woody Fruit Crops in the Mediterranean Environment. Horticulturae 2022, 8, 273. [Google Scholar] [CrossRef]
  9. Rehmani, M.I.A.; Ding, C.; Li, G.; Ata-Ul-Karim, S.T.; Hadifa, A.; Bashir, M.A.; Hashem, M.; Alamri, S.; Al-Zubair, F.; Ding, Y. Vulnerability of Rice Production to Temperature Extremes During Rice Reproductive Stage in Yangtze River Valley, China. J. King Saud Univ. Sci. 2021, 33, 101599. [Google Scholar] [CrossRef]
  10. Wu, B.H.; Huang, H.Q.; Fan, P.G.; Li, S.H.; Liu, G.J. Photosynthetic Responses to Sink-Source Manipulation in Five Peach Cultivars Varying in Maturity Date. J. Am. Soc. Hortic. Sci. 2008, 133, 278–283. [Google Scholar] [CrossRef] [Green Version]
  11. Tombesi, S.; Cincera, I.; Frioni, T.; Ughini, V.; Gatti, M.; Palliotti, A.; Poni, S. Relationship Among Night Temperature, Carbohydrate Translocation and Inhibition of Grapevine Leaf Photosynthesis. Environ. Exp. Bot. 2019, 157, 293–298. [Google Scholar] [CrossRef]
  12. Kreuzwieser, J.; Gessler, A. Global Climate Change and Tree Nutrition: Influence of Water Availability. Tree Physiol. 2010, 30, 1221–1234. [Google Scholar] [CrossRef]
  13. Kozai, N.; Beppu, K.; Mochioka, R.; Boonprakob, U.; Subhadrabandhu, S.; Kataoka, I. Adverse Effects of High Temperature on the Development of Reproductive Organs in ‘Hakuho’ Peach Trees. J. Hortic. Sci. Biotechnol. 2004, 79, 533–537. [Google Scholar] [CrossRef]
  14. Florides, G.A.; Christodoulides, P. Global Warming and Carbon Dioxide Through Sciences. Environ. Int. 2009, 35, 390–401. [Google Scholar] [CrossRef] [PubMed]
  15. Sekhar, K.M.; Sreeharsha, R.V.; Reddy, A.R. Differential Responses in Photosynthesis, Growth and Biomass Yields in Two Mulberry Genotypes Grown Under Elevated CO2 Atmosphere. J. Photochem. Photobiol. B 2015, 151, 172–179. [Google Scholar] [CrossRef] [PubMed]
  16. Kyei-Boahen, S.; Astatkie, T.; Lada, R.; Gordon, R.; Caldwell, C. Gas Exchange of Carrot Leaves in Response to Elevated CO2 Concentration. Photosynthetica 2003, 41, 597–603. [Google Scholar] [CrossRef]
  17. Pereyda-González, J.M.; De-la-Peña, C.; Tezara, W.; Zamora-Bustillos, R.; Andueza-Noh, R.H.; Noh-Kú, J.G.; Carrera-Marín, M.; Garruña, R. High Temperature and Elevated CO2 Modify Phenology and Growth in Pepper Plants. Agronomy 2022, 12, 1836. [Google Scholar] [CrossRef]
  18. Xu, Z.; Jiang, Y.; Zhou, G. Response and Adaptation of Photosynthesis, Respiration, and Antioxidant Systems to Elevated CO2 with Environmental Stress in Plants. Front. Plant Sci. 2015, 6, 701. [Google Scholar] [CrossRef] [Green Version]
  19. Tissue, D.T.; Griffin, K.L.; Turnbull, M.H.; Whitehead, D. Canopy Position and Needle Age Affect Photosynthetic Response in Field-Grown Pinus radiata After Five Years of Exposure to Elevated Carbon Dioxide Partial Pressure. Tree Physiol. 2001, 21, 915–923. [Google Scholar] [CrossRef] [Green Version]
  20. Luo, Q. Temperature Thresholds and Crop Production: A Review. Clim. Chang. 2011, 109, 583–598. [Google Scholar] [CrossRef]
  21. Moore, C.E.; Meacham-Hensold, K.; Lemonnier, P.; Slattery, R.A.; Benjamin, C.; Bernacchi, C.J.; Lawson, T.; Cavanagh, A.P. The Effect of Increasing Temperature on Crop Photosynthesis: From Enzymes to Ecosystems. J. Exp. Bot. 2021, 72, 2822–2844. [Google Scholar] [CrossRef]
  22. Dusenge, M.E.; Duarte, A.G.; Way, D.A. Plant Carbon Metabolism and Climate Change: Elevated CO2 and Temperature Impacts on Photosynthesis, Photorespiration and Respiration. New Phytol. 2019, 221, 32–49. [Google Scholar] [CrossRef] [Green Version]
  23. Smith, R.A.; Lewis, J.D.; Ghannoum, O.; Tissue, D.T. Leaf Structural Responses to Pre-industrial, Current and Elevated Atmospheric [CO2] and Temperature Affect Leaf Function in Eucalyptus sideroxylon. Funct. Plant Biol. 2012, 39, 285–296. [Google Scholar] [CrossRef]
  24. Hatfield, J.L.; Boote, K.J.; Kimball, B.A.; Ziska, L.H.; Izaurralde, R.C.; Ort, D.; Thomson, A.M.; Wolfe, D. Climate Impacts on Agriculture: Implications for Crop Production. Agron. J. 2011, 103, 351–370. [Google Scholar] [CrossRef] [Green Version]
  25. Bisbis, M.B.; Gruda, N.; Blanke, M. Potential Impacts of Climate Change on Vegetable Production and Product Quality—A Review. J. Clean. Prod. 2018, 170, 1602–1620. [Google Scholar] [CrossRef]
  26. Han, J.H.; Cho, J.G.; Son, I.C.; Kim, S.H.; Lee, I.B.; Choi, I.M.; Kim, D. Effects of Elevated Carbon Dioxide and Temperature on Photosynthesis and Fruit Characteristics of ‘Niitaka’ Pear (Pyrus pyrifolia Nakai). Hortic. Environ. Biotechnol. 2012, 53, 357–361. [Google Scholar] [CrossRef]
  27. Ro, H.M.; Kim, P.G.; Lee, I.B.; Yiem, M.S.; Woo, S.Y. Photosynthetic Characteristics and Growth Responses of Dwarf Apple (Malus Domestica Borkh. Cv. Fuji) Saplings after 3 Years of Exposure to Elevated Atmospheric Carbon Dioxide Concentration and Temperature. Trees 2001, 15, 195–203. [Google Scholar] [CrossRef]
  28. Salazar-Parra, C.; Aranjuelo, I.; Pascual, I.; Erice, G.; Sanz-Sáez, Á.; Aguirreolea, J.; Sánchez-Díaz, M.; Irigoyen, J.J.; Araus, J.L.; Morales, F. Carbon Balance, Partitioning and Photosynthetic Acclimation in Fruit-Bearing Grapevine (Vitis vinifera L. Cv. Tempranillo) Grown under Simulated Climate Change (Elevated CO2, Elevated Temperature and Moderate Drought) Scenarios in Temperature Gradient Greenhouses. J. Plant Physiol. 2015, 174, 97–109. [Google Scholar] [CrossRef] [Green Version]
  29. Lima, A.; Pereira, J.A.; Baraldi, I.; Malheiro, R. Cooking Impact in Color, Pigments and Volatile Composition of Grapevine Leaves (Vitis Vinifera L. Var. Malvasia Fina and Touriga Franca. Food Chem. 2017, 221, 1197–1205. [Google Scholar] [CrossRef] [Green Version]
  30. Crews, C.E.; Williams, S.L.; Vines, H.M. Characteristics of Photosynthesis in Peach Leaves. Planta 1975, 126, 97–104. [Google Scholar] [CrossRef]
  31. Lee, S.K.; Cho, J.G.; Jeong, J.H.; Ryu, S.; Han, J.H.; Do, G.R. Effect of the Elevated Carbon Dioxide on the Growth and Physiological Responses of Peach ‘Mihong’. J. Bio Environ. Con. 2021, 30, 312–319. [Google Scholar] [CrossRef]
  32. Martínez-Lüscher, J.; Morales, F.; Sánchez-Díaz, M.; Delrot, S.; Aguirreolea, J.; Gomès, E.; Pascual, I. Climate Change Conditions (Elevated CO2 and Temperature) and UV-B Radiation Affect Grapevine (Vitis Vinifera Cv. Tempranillo) Leaf Carbon Assimilation, Altering Fruit Ripening Rates. Plant Sci. 2015, 236, 168–176. [Google Scholar] [CrossRef]
  33. Greer, D.H.; Weedon, M.M. Modelling Photosynthetic Responses to Temperature of Grapevine (Vitis Vinifera Cv. Semillon) Leaves on Vines Grown in a Hot Climate. Plant Cell Environ. 2012, 35, 1050–1064. [Google Scholar] [CrossRef]
  34. Buttery, B.R.; Buzzell, R.I. The Relationship Between Chlorophyll Content and Rate of Photosynthesis in Soybeans. Can. J. Plant Sci. 1977, 57, 1–5. [Google Scholar] [CrossRef]
  35. Fujii, J.A.; Kennedy, R.A. Seasonal Changes in the Photosynthetic Rate in Apple Trees: A Comparison between Fruiting and Nonfruiting Trees. Plant Physiol. 1985, 78, 519–524. [Google Scholar] [CrossRef] [PubMed]
  36. Tartachnyk, I.I.; Blanke, M.M. Effect of Delayed Fruit Harvest on Photosynthesis, Transpiration and Nutrient Remobilization of Apple Leaves. New Phytol. 2004, 164, 441–450. [Google Scholar] [CrossRef]
  37. Zani, D.; Crowther, T.W.; Mo, L.; Renner, S.S.; Zohner, C.M. Increased Growing-Season Productivity Drives Earlier Autumn Leaf Senescence in Temperate Trees. Science 2020, 370, 1066–1071. [Google Scholar] [CrossRef] [PubMed]
  38. Morandi, B.; Corelli Grappadelli, L.; Rieger, M.; Lo Bianco, R. Carbohydrate Availability Affects Growth and Metabolism in Peach Fruit. Physiol. Plant. 2008, 133, 229–241. [Google Scholar] [CrossRef]
  39. Quilot, B.; Génard, M.; Kervella, J. Leaf Light-Saturated Photosynthesis for Wild and Cultivated Peach Genotypes and Their Hybrids: A Simple Mathematical Modelling Analysis. J. Hortic. Sci. Biotechnol. 2004, 79, 546–553. [Google Scholar] [CrossRef]
  40. Paul, M.J.; Pellny, T.K. Carbon Metabolite Feedback Regulation of Leaf Photosynthesis and Development. J. Exp. Bot. 2003, 54, 539–547. [Google Scholar] [CrossRef] [PubMed] [Green Version]
  41. Wünsche, J.N.; Greer, D.H.; Laing, W.A.; Palmer, J.W. Physiological and Biochemical Leaf and Tree Responses to Crop Load in Apple. Tree Physiol. 2005, 25, 1253–1263. [Google Scholar] [CrossRef]
  42. Minas, I.S.; Tanou, G.; Molassiotis, A. Environmental and Orchard Bases of Peach Fruit Quality. Sci. Hortic. 2018, 235, 307–322. [Google Scholar] [CrossRef]
  43. Lee, S.K.; Cho, J.G.; Jeong, J.H.; Ryu, S.; Han, J.H.; Do, G.R. Effect of the Elevated Temperature on the Growth and Physiological Responses of Peach ‘Mihong’ (Prunus persica). Prot. Hortic. Plant Fact. 2020, 29, 373–380. [Google Scholar] [CrossRef]
  44. Martínez-Lüscher, J.; Kizildeniz, T.; Vučetić, V.; Dai, Z.; Luedeling, E.; van Leeuwen, C.V.; Gomès, E.; Pascual, I.; Irigoyen, J.J.; Morales, F.; et al. Sensitivity of Grapevine Phenology to Water Availability, Temperature and CO2 Concentration. Front. Environ. Sci. 2016, 4, 48. [Google Scholar] [CrossRef] [Green Version]
  45. Lopez, G.; Dejong, T.M. Spring Temperatures Have a Major Effect on Early Stages of Peach Fruit Growth. J. Hortic. Sci. Biotechnol. 2007, 82, 507–512. [Google Scholar] [CrossRef]
  46. Kizildeniz, T.; Mekni, I.; Santesteban, H.; Pascual, I.; Morales, F.; Irigoyen, J.J. Effects of Climate Change Including Elevated CO2 Concentration, Temperature and Water Deficit on Growth, Water Status, and Yield Quality of Grapevine (Vitis vinifera L.) Cultivars. Agric. Water Manag. 2015, 159, 155–164. [Google Scholar] [CrossRef] [Green Version]
  47. Christopoulos, M.; Ouzounidou, G. Climate Change Effects on the Perceived and Nutritional Quality of Fruit and Vegetables. J. Innov. Econo. Mang. 2021, 34, 79–99. [Google Scholar] [CrossRef]
  48. Wei, Z.; Du, T.; Li, X.; Fang, L.; Liu, F. Interactive Effects of Elevated CO2 and N Fertilization on Yield and Quality of Tomato Grown Under Reduced Irrigation Regimes. Front. Plant Sci. 2018, 9, 328. [Google Scholar] [CrossRef] [Green Version]
  49. Wang, S.Y.; Bunce, J.A. Elevated Carbon Dioxide Affects Fruit Flavor in Field-Grown Strawberries (Fragaria × ananassa Duch). J. Sci. Food Agric. 2004, 84, 1464–1468. [Google Scholar] [CrossRef]
  50. Wang, S.Y.; Camp, M.J. Temperatures After Bloom Affect Plant Growth and Fruit Quality of Strawberry. Sci. Hortic. 2000, 85, 183–199. [Google Scholar] [CrossRef]
  51. Pimenta, T.M.; Souza, G.A.; Brito, F.A.L.; Teixeira, L.S.; Arruda, R.S.; Henschel, J.M.; Zsögön, A.; Ribeiro, D.M. The Impact of Elevated CO2 Concentration on Fruit Size, Quality, and Mineral Nutrient Composition in Tomato Varies with Temperature Regimen During Growing Season. Plant Growth Regul. 2022. [Google Scholar] [CrossRef]
  52. Menzel, C.M. Effect of Temperature on Soluble Solids Content in Strawberry in Queensland, Australia. Horticulturae 2022, 8, 367. [Google Scholar] [CrossRef]
  53. Lin-Wang, K.L.; Micheletti, D.; Palmer, J.; Volz, R.; Lozano, L.; Espley, R.; Hellens, R.P.; Chagnè, D.; Rowan, D.D.; Troggio, M.; et al. High Temperature Reduces Apple Fruit Colour via Modulation of the Anthocyanin Regulatory Complex. Plant Cell Environ. 2011, 34, 1176–1190. [Google Scholar] [CrossRef]
  54. Koshita, Y.; Yamane, T.; Yakushiji, H.; Azuma, A.; Mitani, N. Regulation of Skin Color in ‘Aki Queen’ Grapes: Interactive Effects of Temperature, Girdling, and Leaf Shading Treatments on Coloration and Total Soluble Solids. Sci. Hortic. 2011, 129, 98–101. [Google Scholar] [CrossRef]
  55. Ryu, S.; Han, J.H.; Cho, J.G.; Jeong, J.H.; Lee, S.K.; Lee, H.J. High Temperature at Veraison Inhibits Anthocyanin Biosynthesis in Berry Skins During Ripening in ‘Kyoho’ Grapevines. Plant Physiol. Biochem. 2020, 157, 219–228. [Google Scholar] [CrossRef] [PubMed]
  56. Whale, S.K.; Singh, Z. Endogenous Ethylene and Color Development in the Skin of ‘Pink Lady’ Apple. J. Am. Soc. Hortic. Sci. 2007, 132, 20–28. [Google Scholar] [CrossRef] [Green Version]
  57. Ruiz, D.; Egea, J. Analysis of the Variability and Correlations of Floral Biology Factors Affecting Fruit Set in Apricot in a Mediterranean Climate. Sci. Hortic. 2008, 115, 154–163. [Google Scholar] [CrossRef]
  58. Yamane, H.; Ooka, T.; Jotatsu, H.; Sasaki, R.; Tao, R. Expression Analysis of PpDAM5 and PpDAM6 During Flower Bud Development in Peach (Prunus persica). Sci. Hortic. 2011, 129, 844–848. [Google Scholar] [CrossRef]
  59. Beppu, K.; Kataoka, I. Studies on Pistil Doubling and Fruit Set of Sweet Cherry in Warm Climate. J. Jpn. Soc. Hortic. Sci. 2011, 80, 1–13. [Google Scholar] [CrossRef] [Green Version]
  60. Zhang, M.; Ma, F.; Shu, H.; Han, M. Branch Bending Affected Floral Bud Development and Nutrient Accumulation in Shoot Terminals of ‘Fuji’ and ‘Gala’ Apples. Acta Physiol. Plant 2017, 39, 156. [Google Scholar] [CrossRef]
  61. Kirnak, H.; Demirtas, M.N. Effects of Different Irrigation Regimes and Mulches on Yield and Macronutrition Levels of Drip-Irrigated Cucumber Under Open Field Conditions. J. Plant Nutr. 2006, 29, 1675–1690. [Google Scholar] [CrossRef]
  62. Li, B.; Zie, Z.; Zhang, A.; Xu, W.; Zhang, C.; Liu, Q.; Liu, C.; Wang, S. Tree Growth Characteristics and Flower Bud Differentiation of Sweet Cherry (Prunus avium L.) Under Different Climate Conditions in China. Hortic. Sci. 2010, 37, 6–13. [Google Scholar] [CrossRef] [Green Version]
  63. Peavey, M.; Goodwin, I.; McClymont, L. The Effects of Canopy Height and Bud Light Exposure on the Early Stages of Flower Development in Prunus persica (L.) Batsch. Plants 2020, 9, 1073. [Google Scholar] [CrossRef]
  64. Cruz-Castillo, J.G.; Woolley, D.J.; Famiani, F. Effects of Defoliation on Fruit Growth, Carbohydrate Reserves and Subsequent Flowering of ‘Hayward’ Kiwifruit Vines. Sci. Hortic. 2010, 125, 579–583. [Google Scholar] [CrossRef]
  65. Williamson, J.G.; Miller, E.P. Early and Mid-fall Defoliation Reduces Flower Bud Number and Yield of Southern Highbush Blueberry. Horttechnology 2002, 12, 214–216. [Google Scholar] [CrossRef]
Figure 1. Application of diurnal temperature fluctuation during the experimental period. The solid line, dotted line and dashed line represent control, C+3.4 °C and C+5.7 °C respectively. I, the first 10 days of a month; II, the middle 10 days of a month; III, the last 10 or 11 days of a month.
Horticulturae 08 01047 g001
Figure 2. Changes in net photosynthetic rate (A), stomatal conductance (B), intercellular CO2 concentration (C), transpiration rate (D) at 1200 μmol∙m−2∙s−1 under different temperatures and a carbon dioxide concentration of 700 μmol·mol−1 during the 2019 growing season. The solid circle, square and triangle represent control, C+3.4 °C and C+5.7 °C respectively. Vertical bars represent the standard error of means from five replications. The asterisks * and ** indicate significant difference at p ≤ 0.05 and p ≤ 0.01, respectively.
Horticulturae 08 01047 g002
Figure 3. Light-curve of peach trees grown under different temperatures and a carbon dioxide concentration of 700 μmol·mol−1 on 20 May (10 DAF) and 27 June (48 DAF). The solid circle, square and triangle represent control, C+3.4 °C and C+5.7 °C respectively. Vertical bars represent the standard error of means from five replications. The asterisks * and ** indicate significant differences at p ≤ 0.05 and p ≤ 0.01, respectively.
Horticulturae 08 01047 g003
Figure 4. Changes in chlorophyll (A) and starch contents (B) in the leaves of peach trees grown under different temperatures and a carbon dioxide concentration of 700 μmol·mol−1 during the 2019 growing season. The solid circle, square and triangle represent control, C+3.4 °C and C+5.7 °C respectively. Vertical bars represent the standard error of means from three replications. The asterisks * and *** indicate significant differences at p ≤ 0.05 and p ≤ 0.001, respectively.
Horticulturae 08 01047 g004
Figure 5. Flowering of peach trees grown under different temperatures and a carbon dioxide concentration of 700 μmol·mol−1 on 10 April 2020. Left, Control; Middle, C+3.4 °C; Right, C+5.7 °C.
Horticulturae 08 01047 g005
Table 1. Changes in the photosynthetic parameters of ‘Mihong’ peaches affected by elevated temperature under a carbon dioxide concentration of 700 μmol·mol−1.
DateTreatmentMaximum Photosynthetic
Rate
(μmol∙m−2∙s−1)
Dark
Respiration
(μmol∙m−2∙s−1)
Apparent
Quantum Yield
(mol∙mol−1)
Light Compensation Point
(μmol∙m−2∙s−1)
Light Saturation Point
(μmol∙m−2∙s−1)
Control15.15 a z5.11 a0.063 a94 a1062 a
20 May
(10 DAF y)
C+3.4 °C15.12 a5.24 a0.062 a97 a1076 a
C+5.7 °C12.69 ab5.29 a0.062 a103 a984 a
27 June
(48 DAF)
Control4.76 b4.55 a0.022 c316 a1639 a
C+3.4 °C8.24 a4.99 a0.036 b175 a1274 a
C+5.7 °C3.25 b5.22 a0.050 a190 a700 b
SignificanceTemperature (A)***NS***NS***
Date (B)***NS******NS
A × BNSNS***NS***
Z Mean separation within a column in each date by Duncan’s multiple range test at p ≤ 0.05. NS and *** indicate non-significant and significant at p ≤ 0.001, respectively, following a two-way ANOVA with temperature and harvest date as factors of variability. y Mean days after foliation.
Table 2. Harvest dates and the fruit quality of ‘Mihong’ peaches affected by elevated temperature under a carbon dioxide concentration of 700 μmol·mol−1.
TreatmentHarvest
Date
Fruit
Weight
(g)
Fruit
Length
(mm)
Fruit
Width
(mm)
Firmness
(N)
Soluble
Solids Content
(Bx)
Acid
Content
(%)
L*a*b*
Control6.28.127.3 b z60.5 b61.4 b2.92 b14.12 a0.168 b66.9 a17.2 b23.2 a
C+3.4 °C6.24.158.2 a63.2 a69.6 a3.99 b13.26 b0.206 a62.1 b24.5 a20.2 b
C+5.7 °C6.19.129.5 b59.8 b62.2 b5.60 a13.19 b0.202 a63.5 b23.9 a20.7 b
Z Mean separation within a column by Duncan’s multiple range test at p ≤ 0.05, following a one-way ANOVA.
Table 3. Growth characteristics of ‘Mihong’ peaches as affected by elevated temperatures under a carbon dioxide concentration of 700 μmol·mol−1.
TreatmentTCA Increase
(cm2)
Leaf Area
(cm2/ea)
Number of Shoots
Per Tree
Shoot Length
(cm)
Control0.77 a z26.8 a74.2 a7.1 b
C+3.4 °C0.60 a29.9 a60.5 ab15.7 a
C+5.7 °C1.06 a26.2 a52.5 b16.1 a
Z Mean separation within a column by Duncan’s multiple range test at p ≤ 0.05, following a one-way ANOVA.
Table 4. The number of flowers and leaf buds of ‘Mihong’ peaches affected by elevated temperatures under a carbon dioxide concentration of 700 μmol·mol−1.
TreatmentFloral Buds
(ea)
Leaf Buds
(ea)
Total Buds
(ea)
Floral/Total Bud
(%)
Control435 a z185 b620 a70.2 a
C+3.4 °C321 a249 ab570 a53.2 ab
C+5.7 °C187 a254 a440 a41.3 b
Z Mean separation within a column by Duncan’s multiple range test at p ≤ 0.05, following a one-way ANOVA.
Table 5. Carbon and nitrogen concentrations and C/N ratios of 1-year-old ‘Mihong’ peach shoots affected by elevated temperatures and a carbon dioxide concentration of 700 μmol·mol−1.
TreatmentT-C (%)T-N (%)C/N
Control28.52 b z0.49 b60.4 a
C+3.4 °C30.98 a0.59 ab53.4 a
C+5.7 °C29.06 ab0.65 a44.9 a
Z Mean separation within a column by Duncan’s multiple range test at p ≤ 0.05, following a one-way ANOVA.
Publisher’s Note: MDPI stays neutral with regard to jurisdictional claims in published maps and institutional affiliations.

