
Mechanism by Which High Foliar Calcium Contents Inhibit Sugar Accumulation in Feizixiao Lychee Pulp


Abstract
:1. Introduction
2. Materials and Methods
2.1. Experimental Setup and Materials
2.2. Field Experimental Design and Sampling Methods
2.3. Measurement Methods of Observed Indicators
2.4. Statistical Analysis
3. Data Analysis and Results
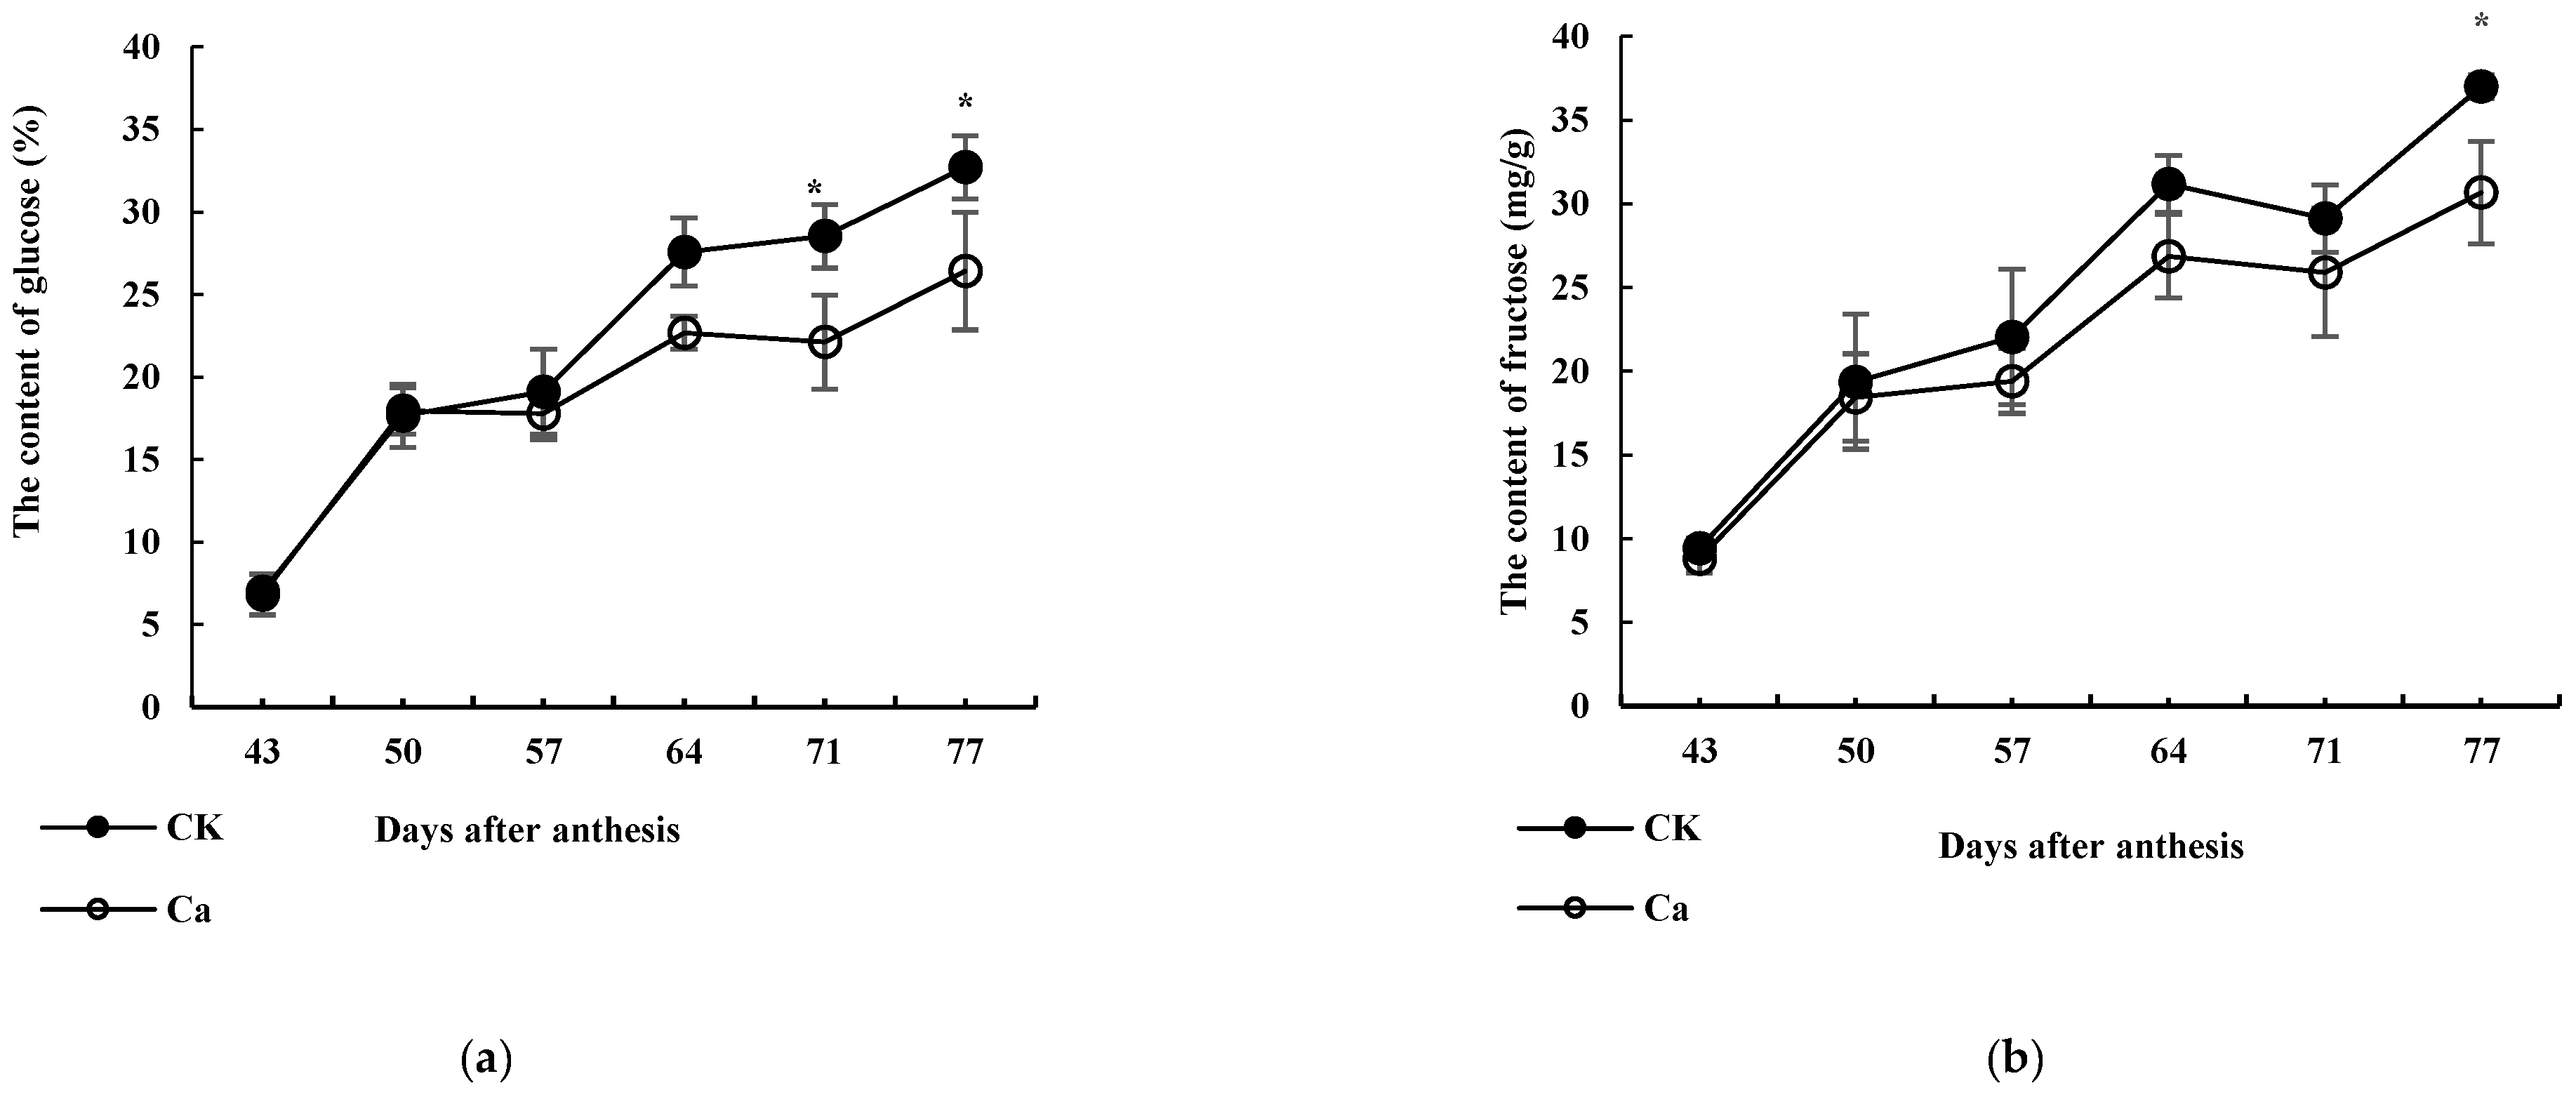
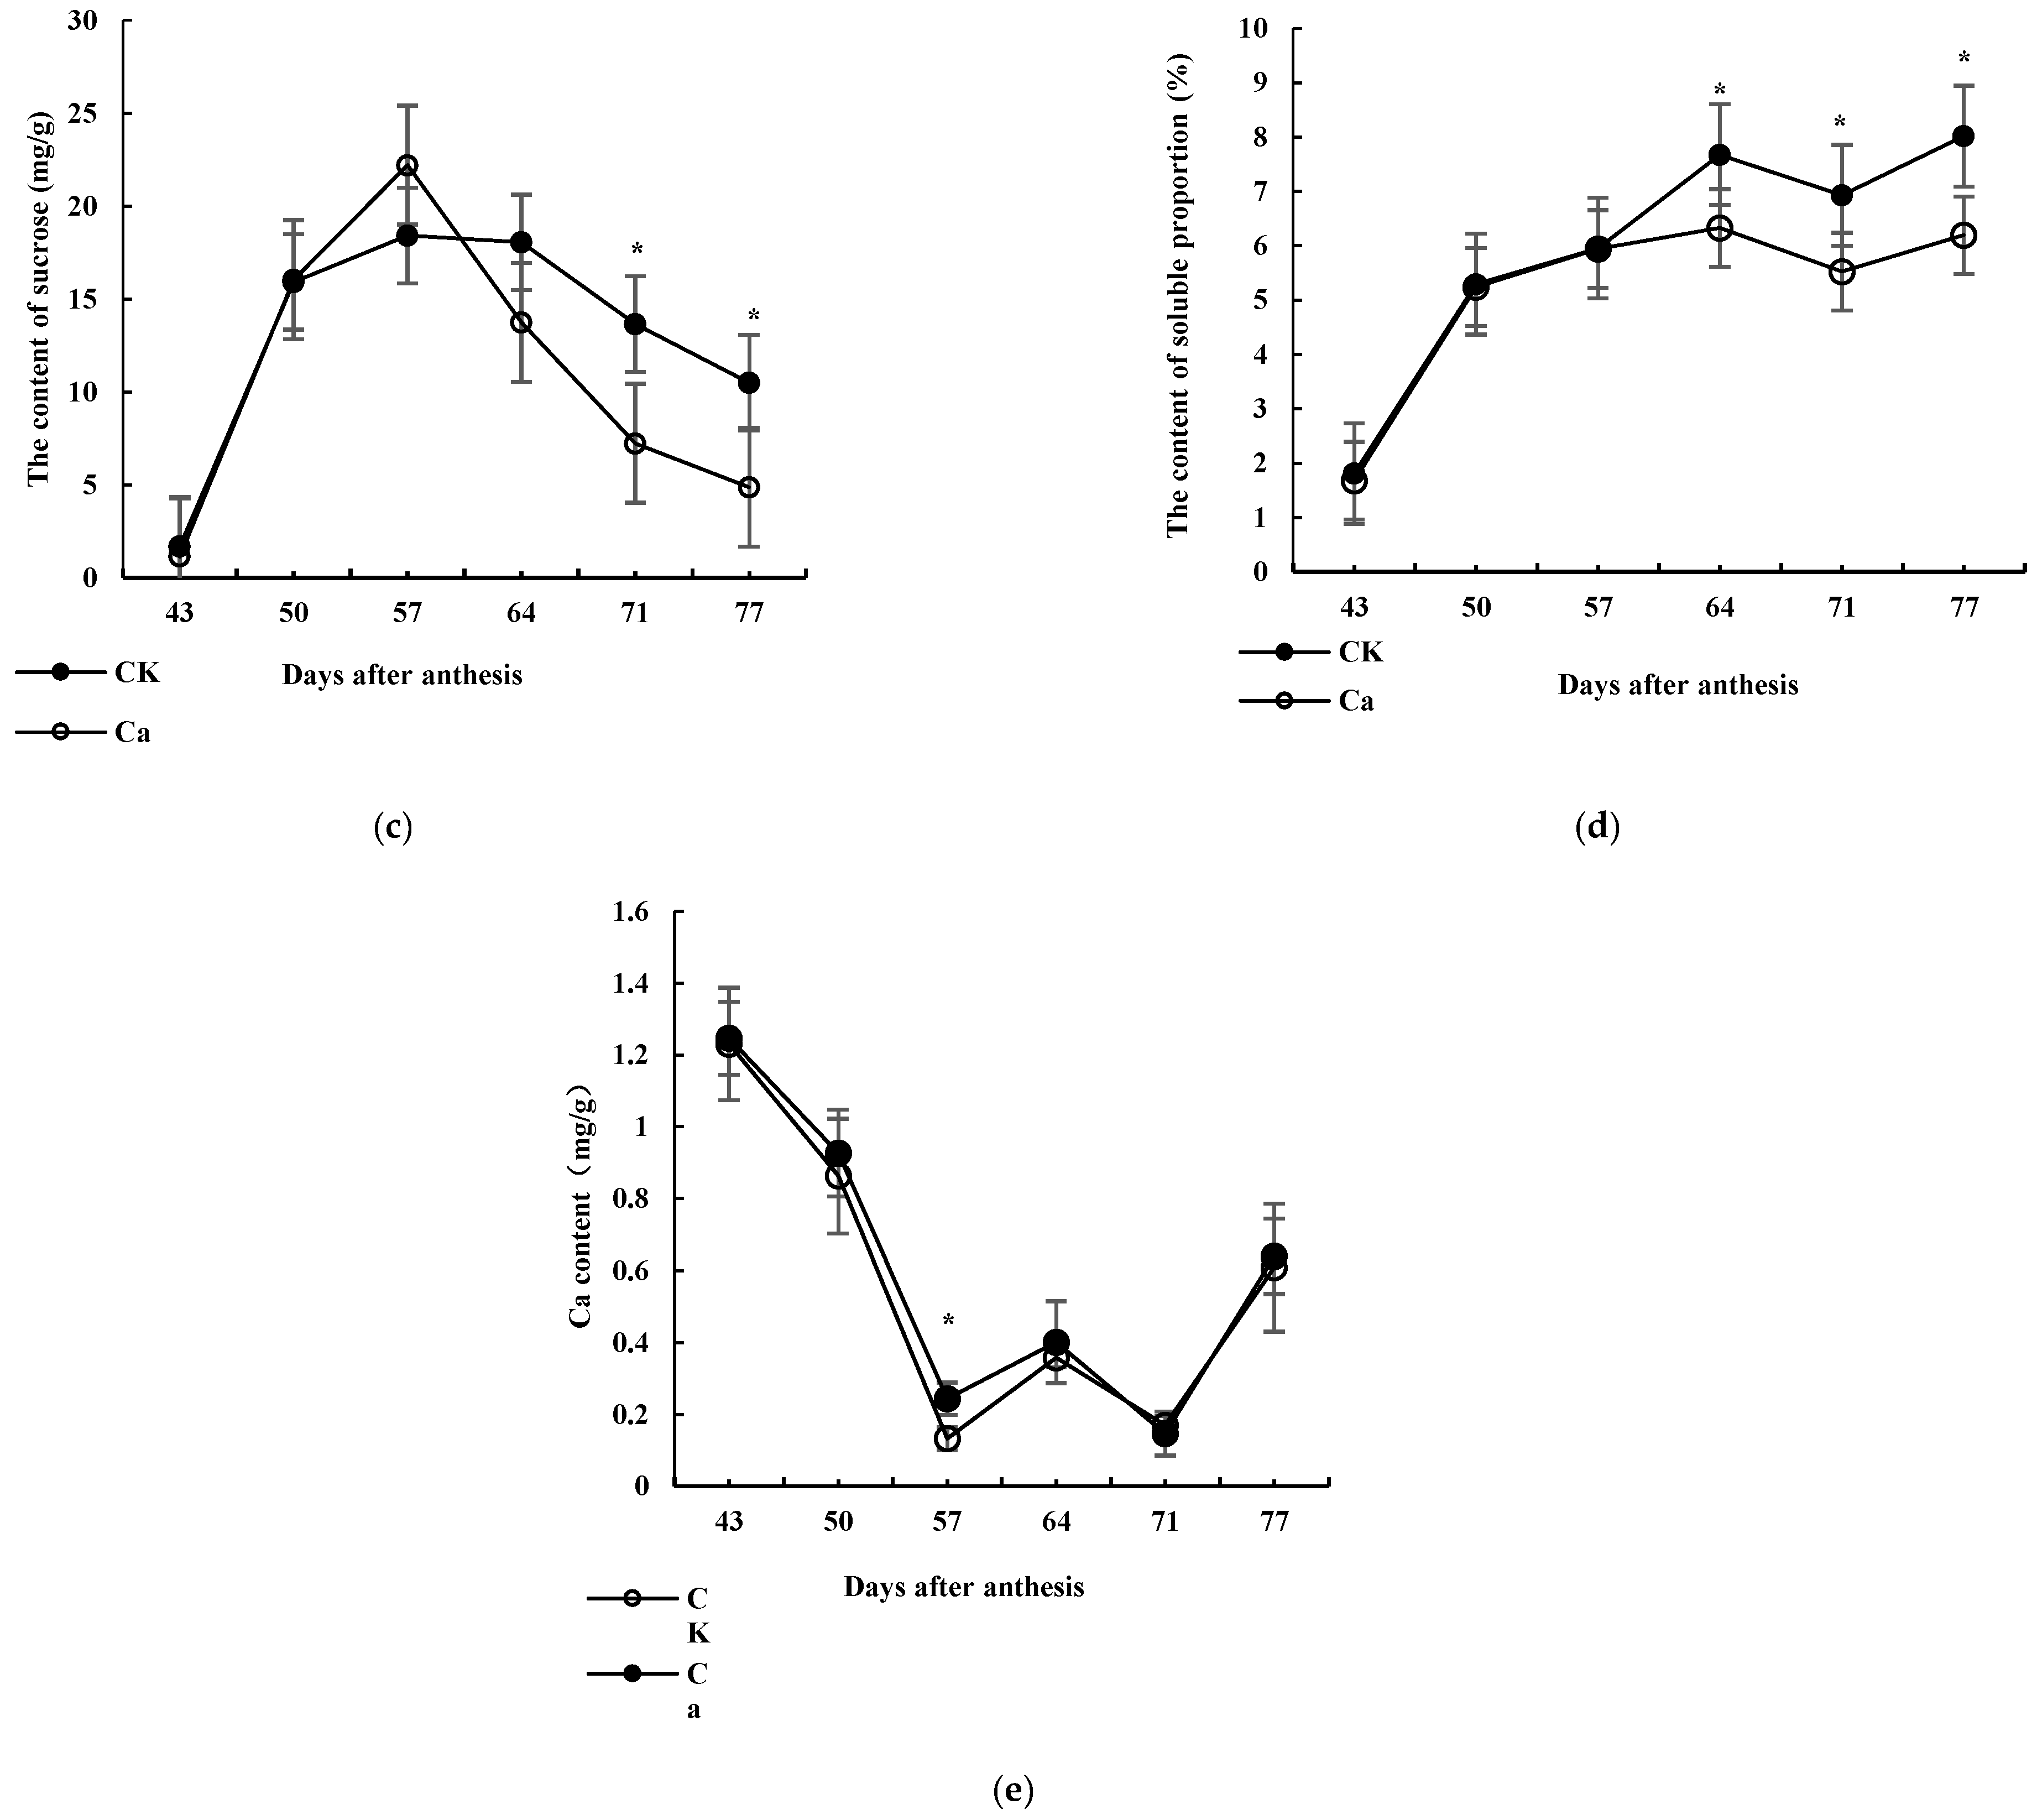
3.1. Effects of High-Ca Treatment on Sugar Content
3.2. Ca Content
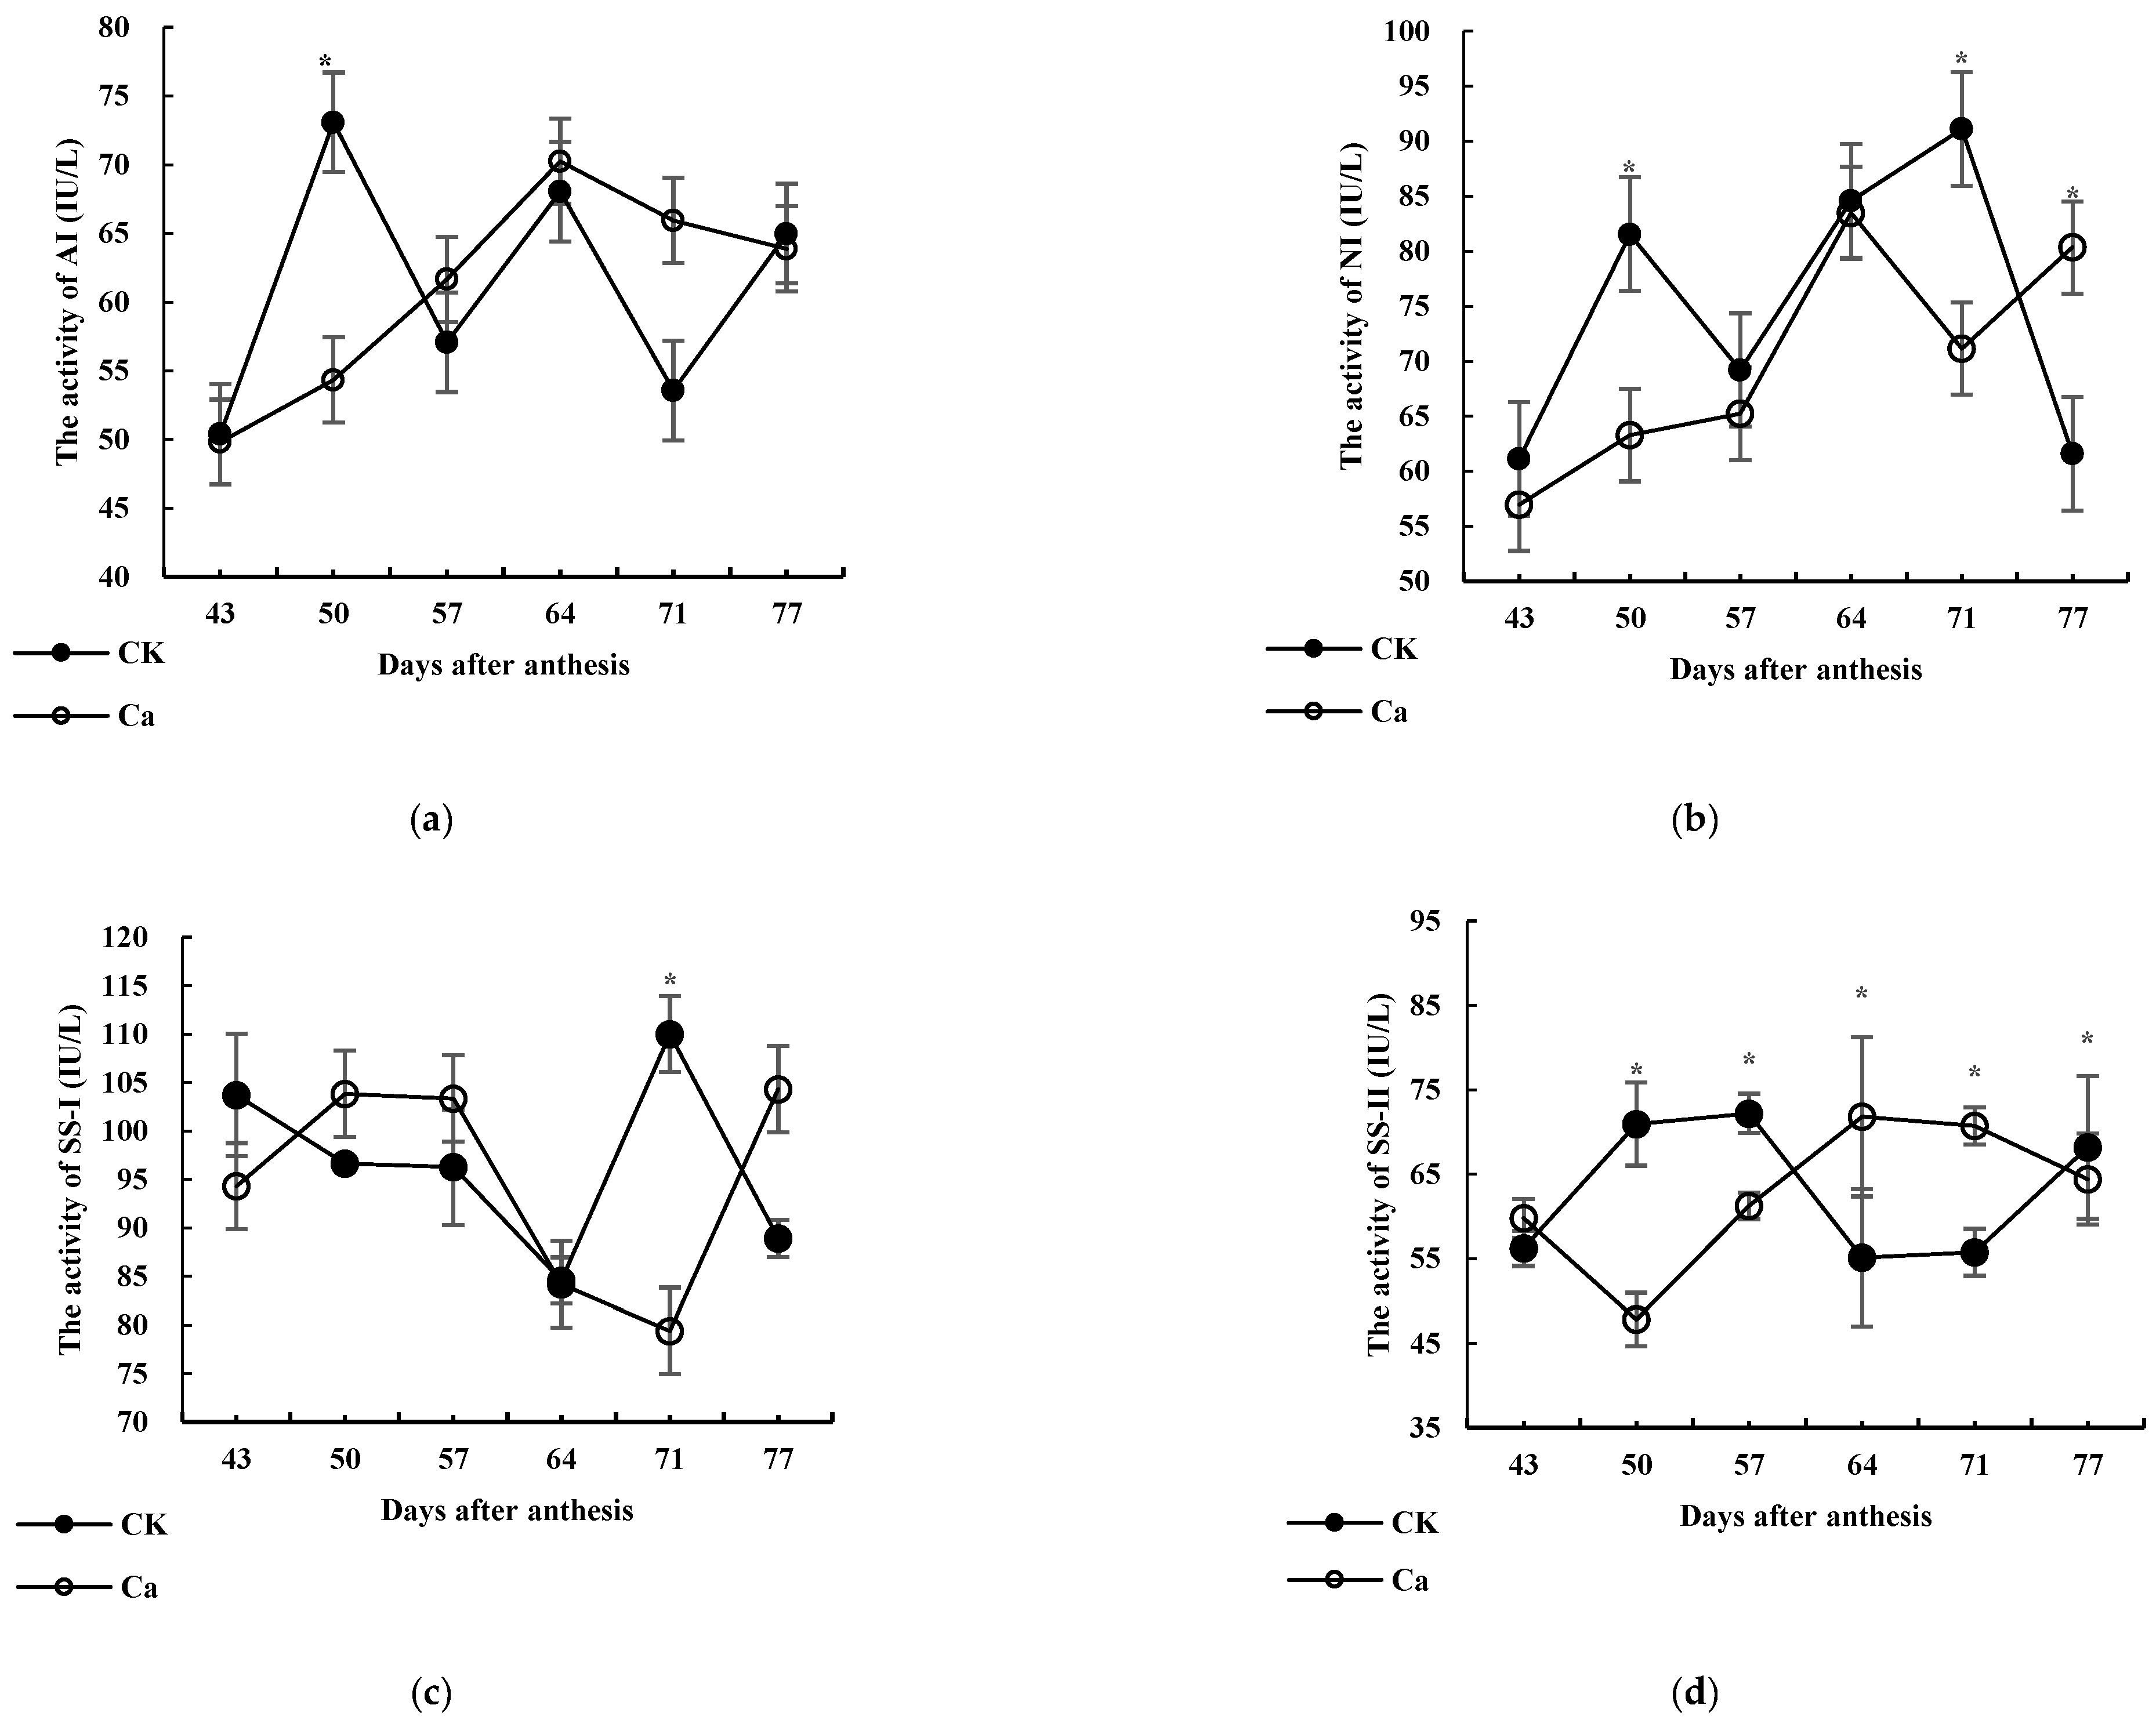
3.3. Effects of High-Ca Treatment on the Activities of Key Enzymes Involved in Glucose Metabolism
3.3.1. AI
3.3.2. NI
3.3.3. SS-I
3.3.4. SS-II
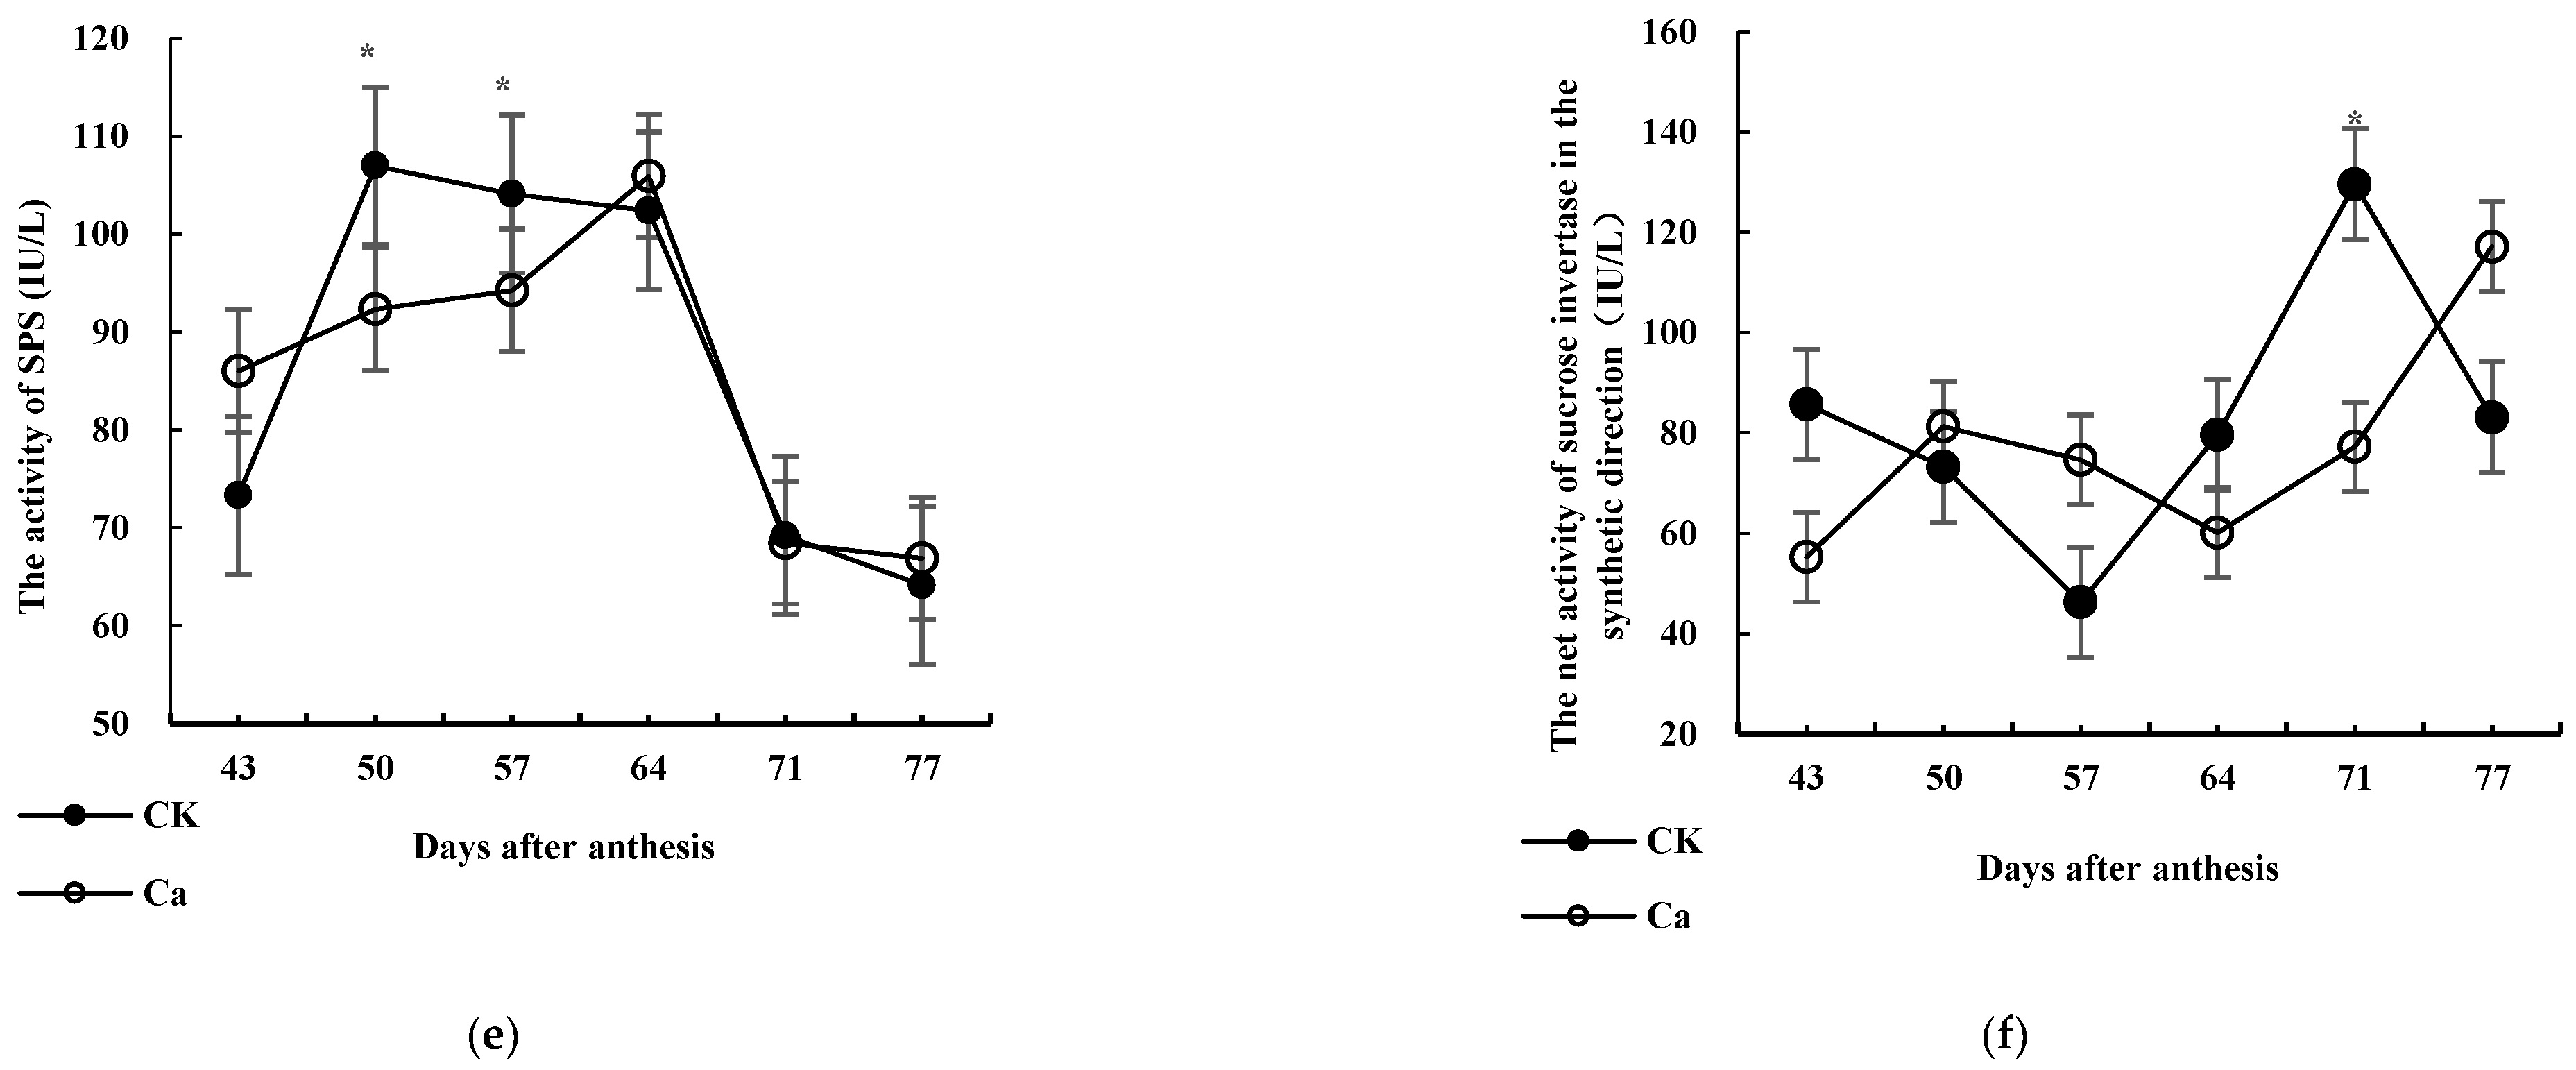
3.3.5. SPS
3.3.6. Synthesis Direction and Net Activity of the Sucrose Invertase System
3.4. Transcriptome Analysis of Fruit Pulp
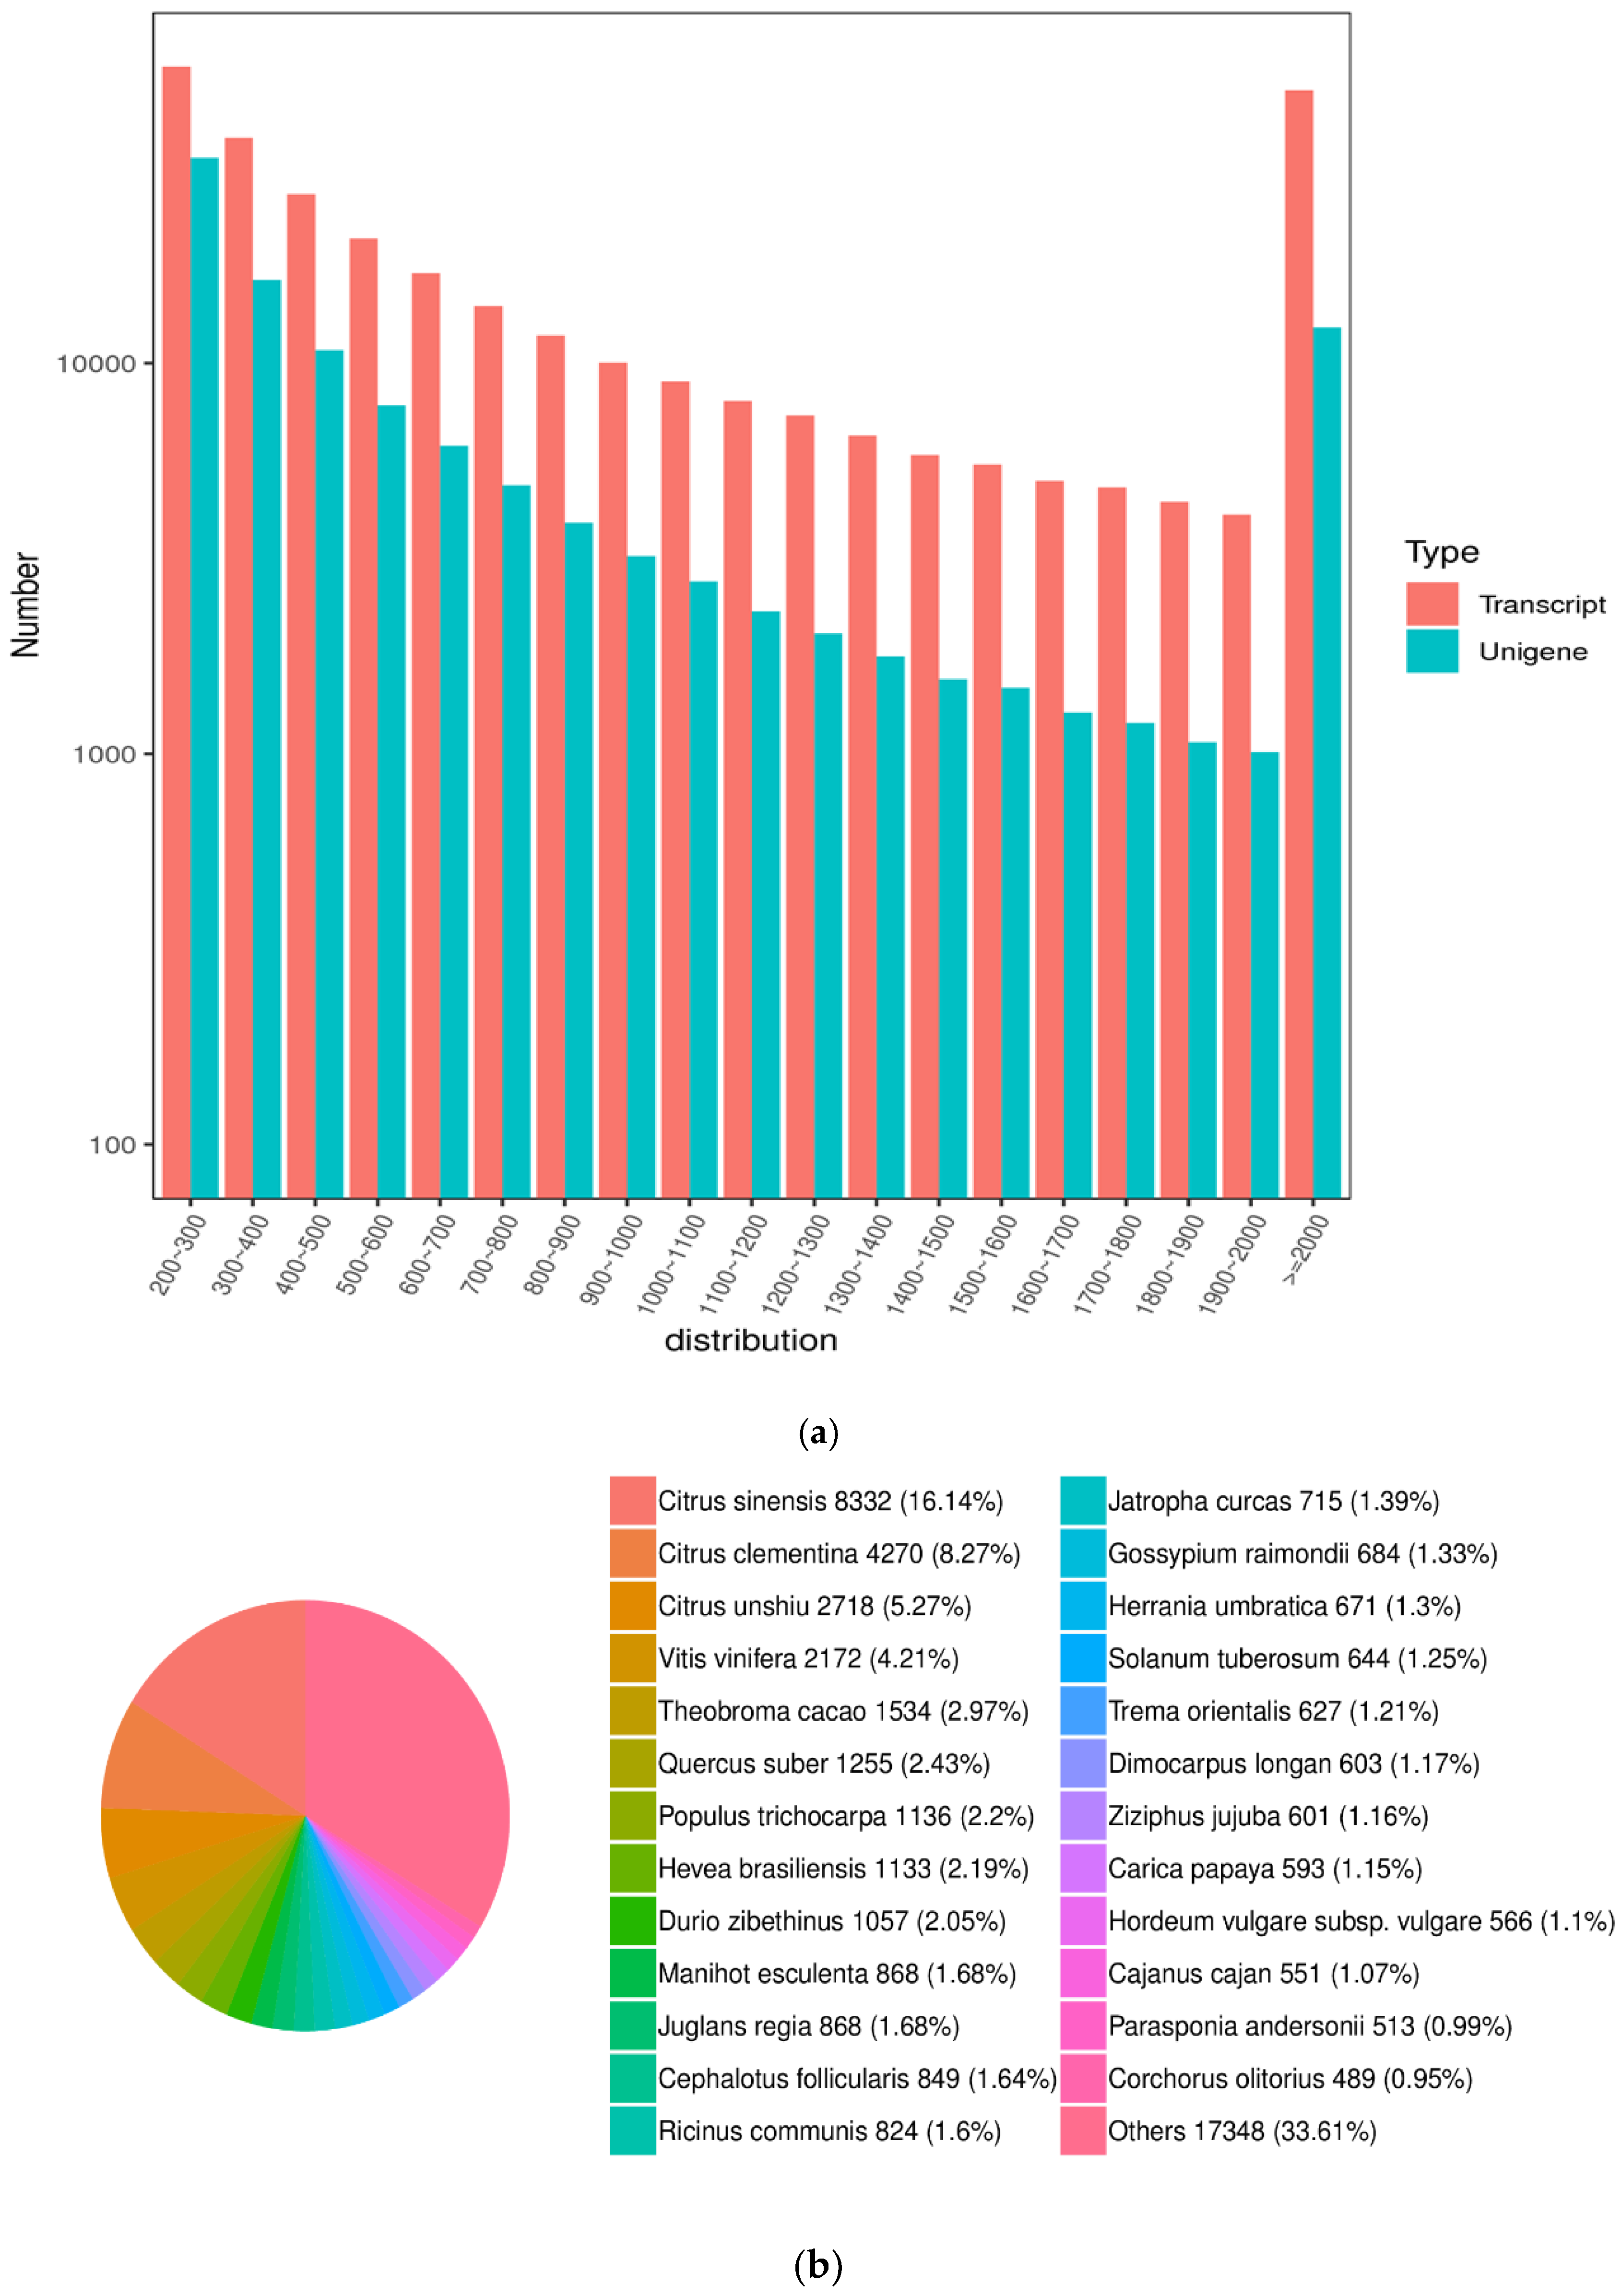
3.4.1. Assembly and Analysis of Transcriptome Sequencing Data
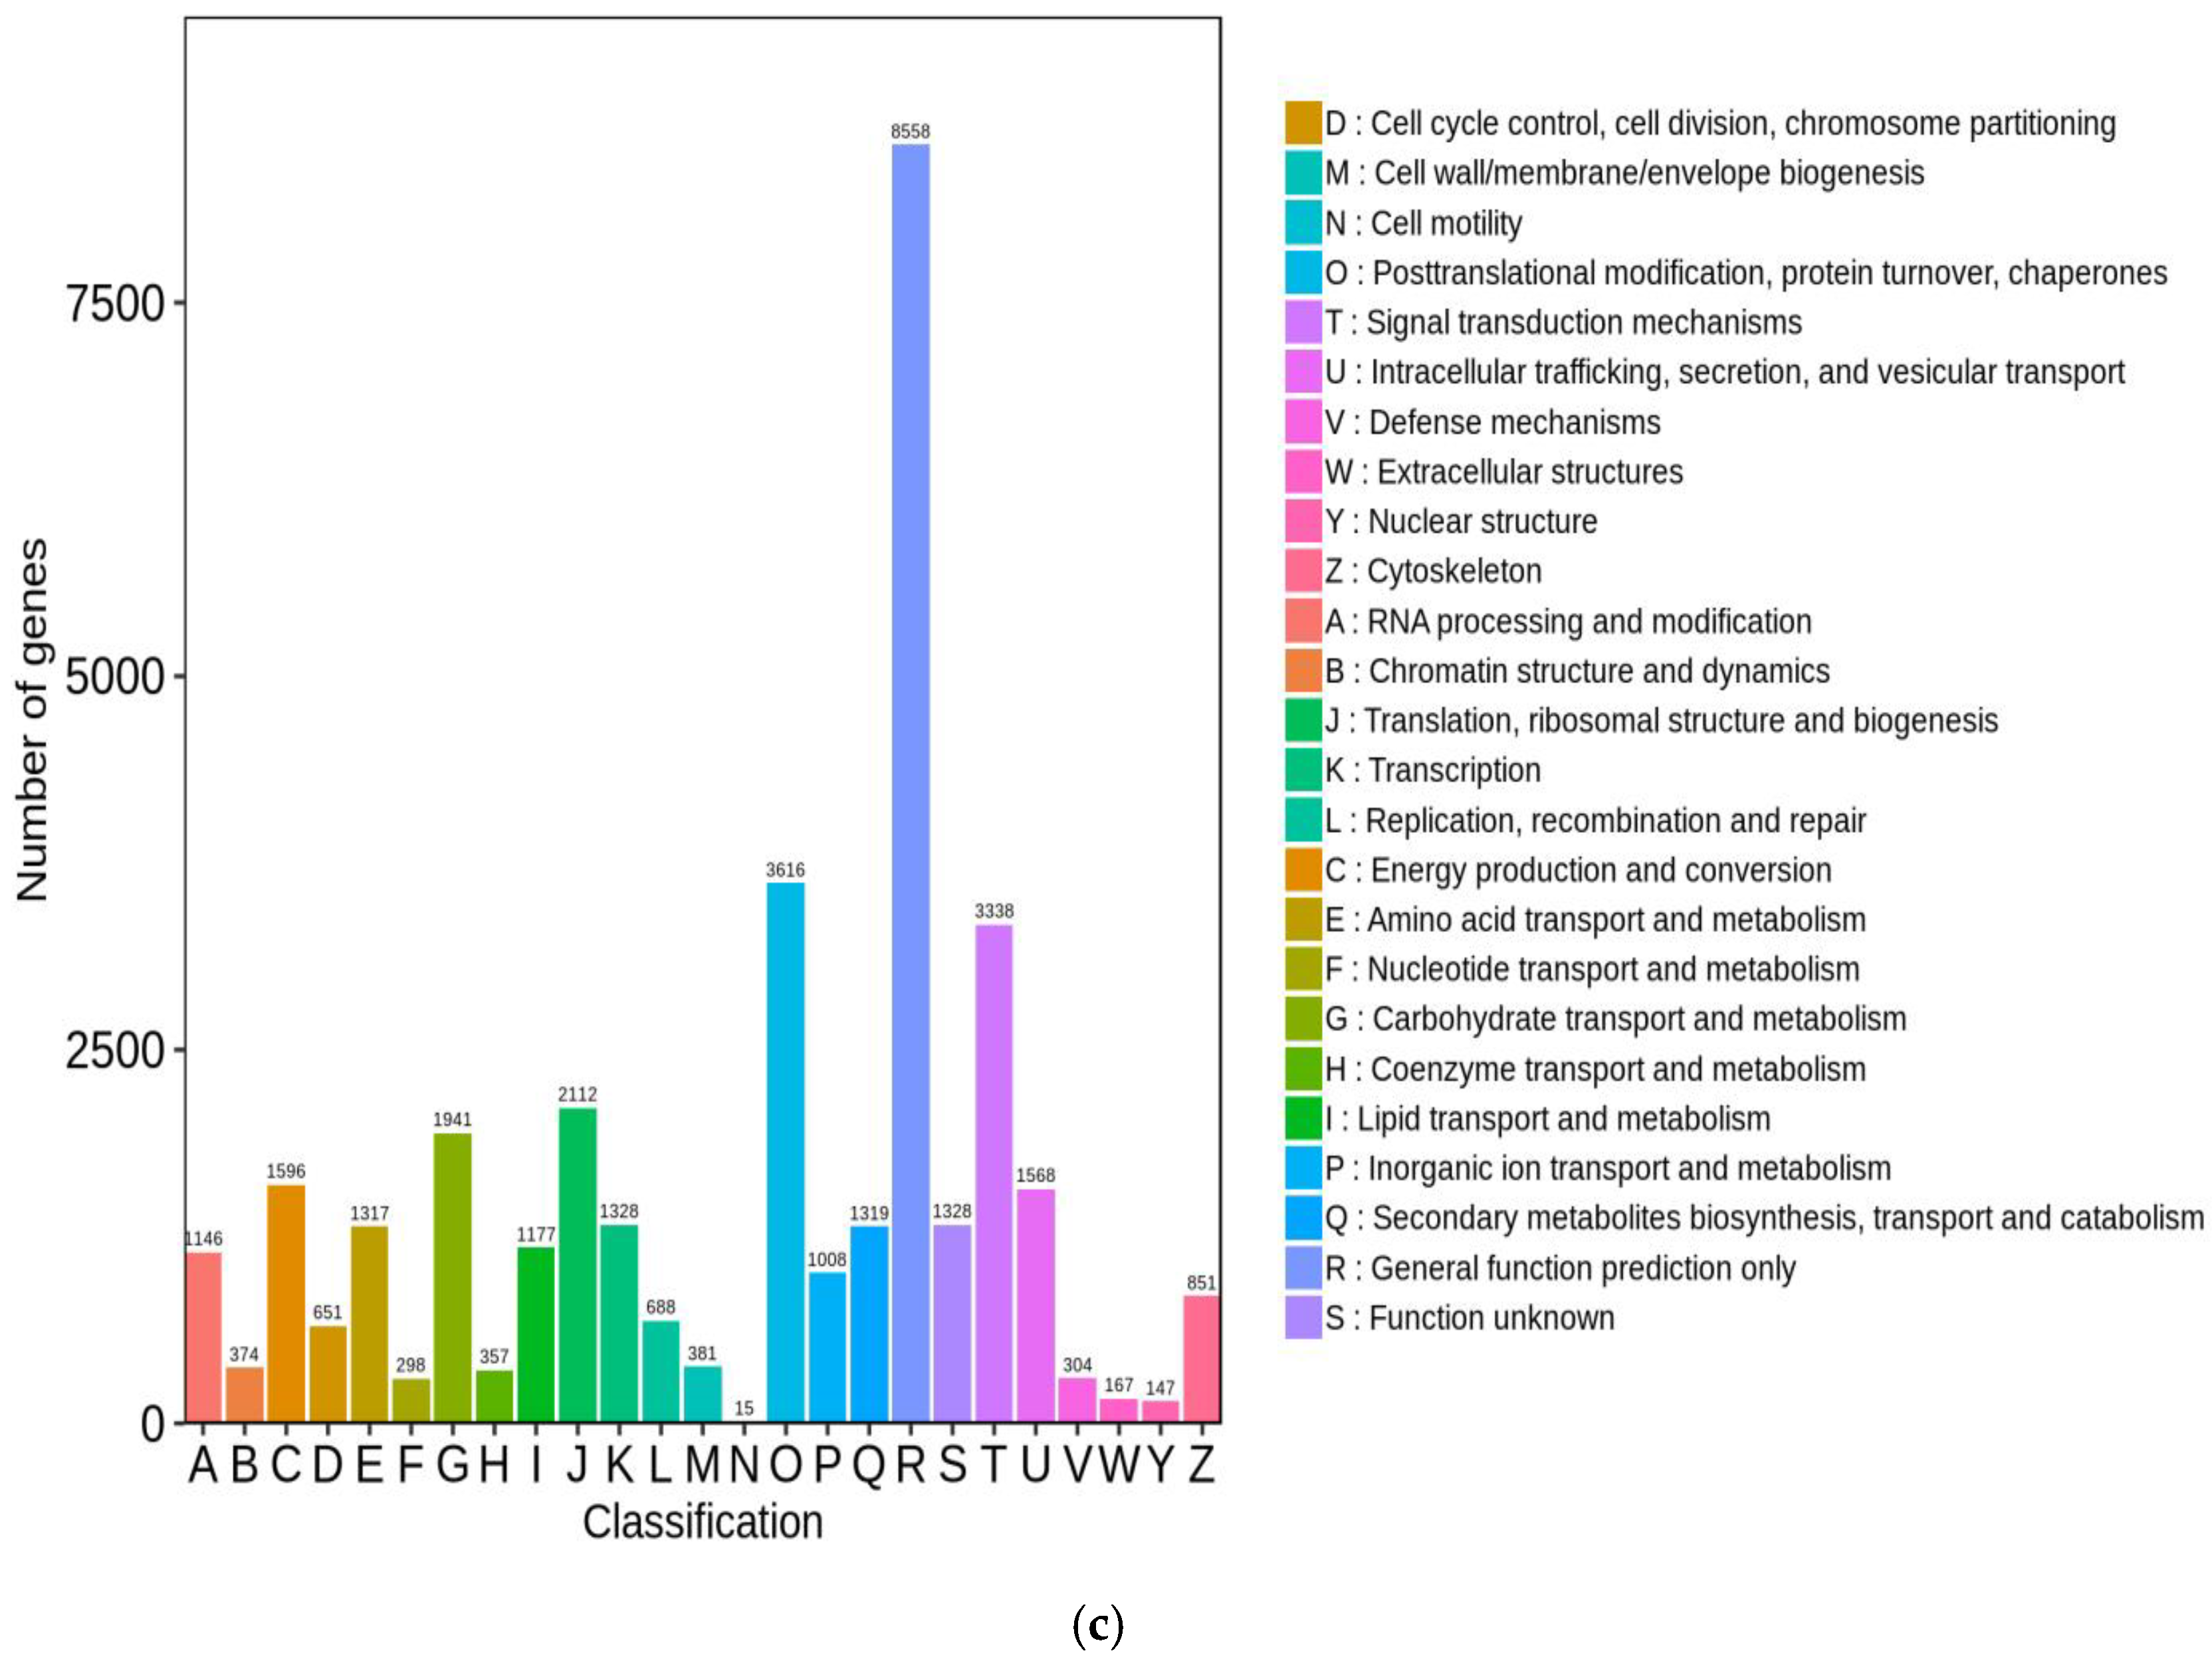
3.4.2. Functional Annotation and Analysis of Unigenes
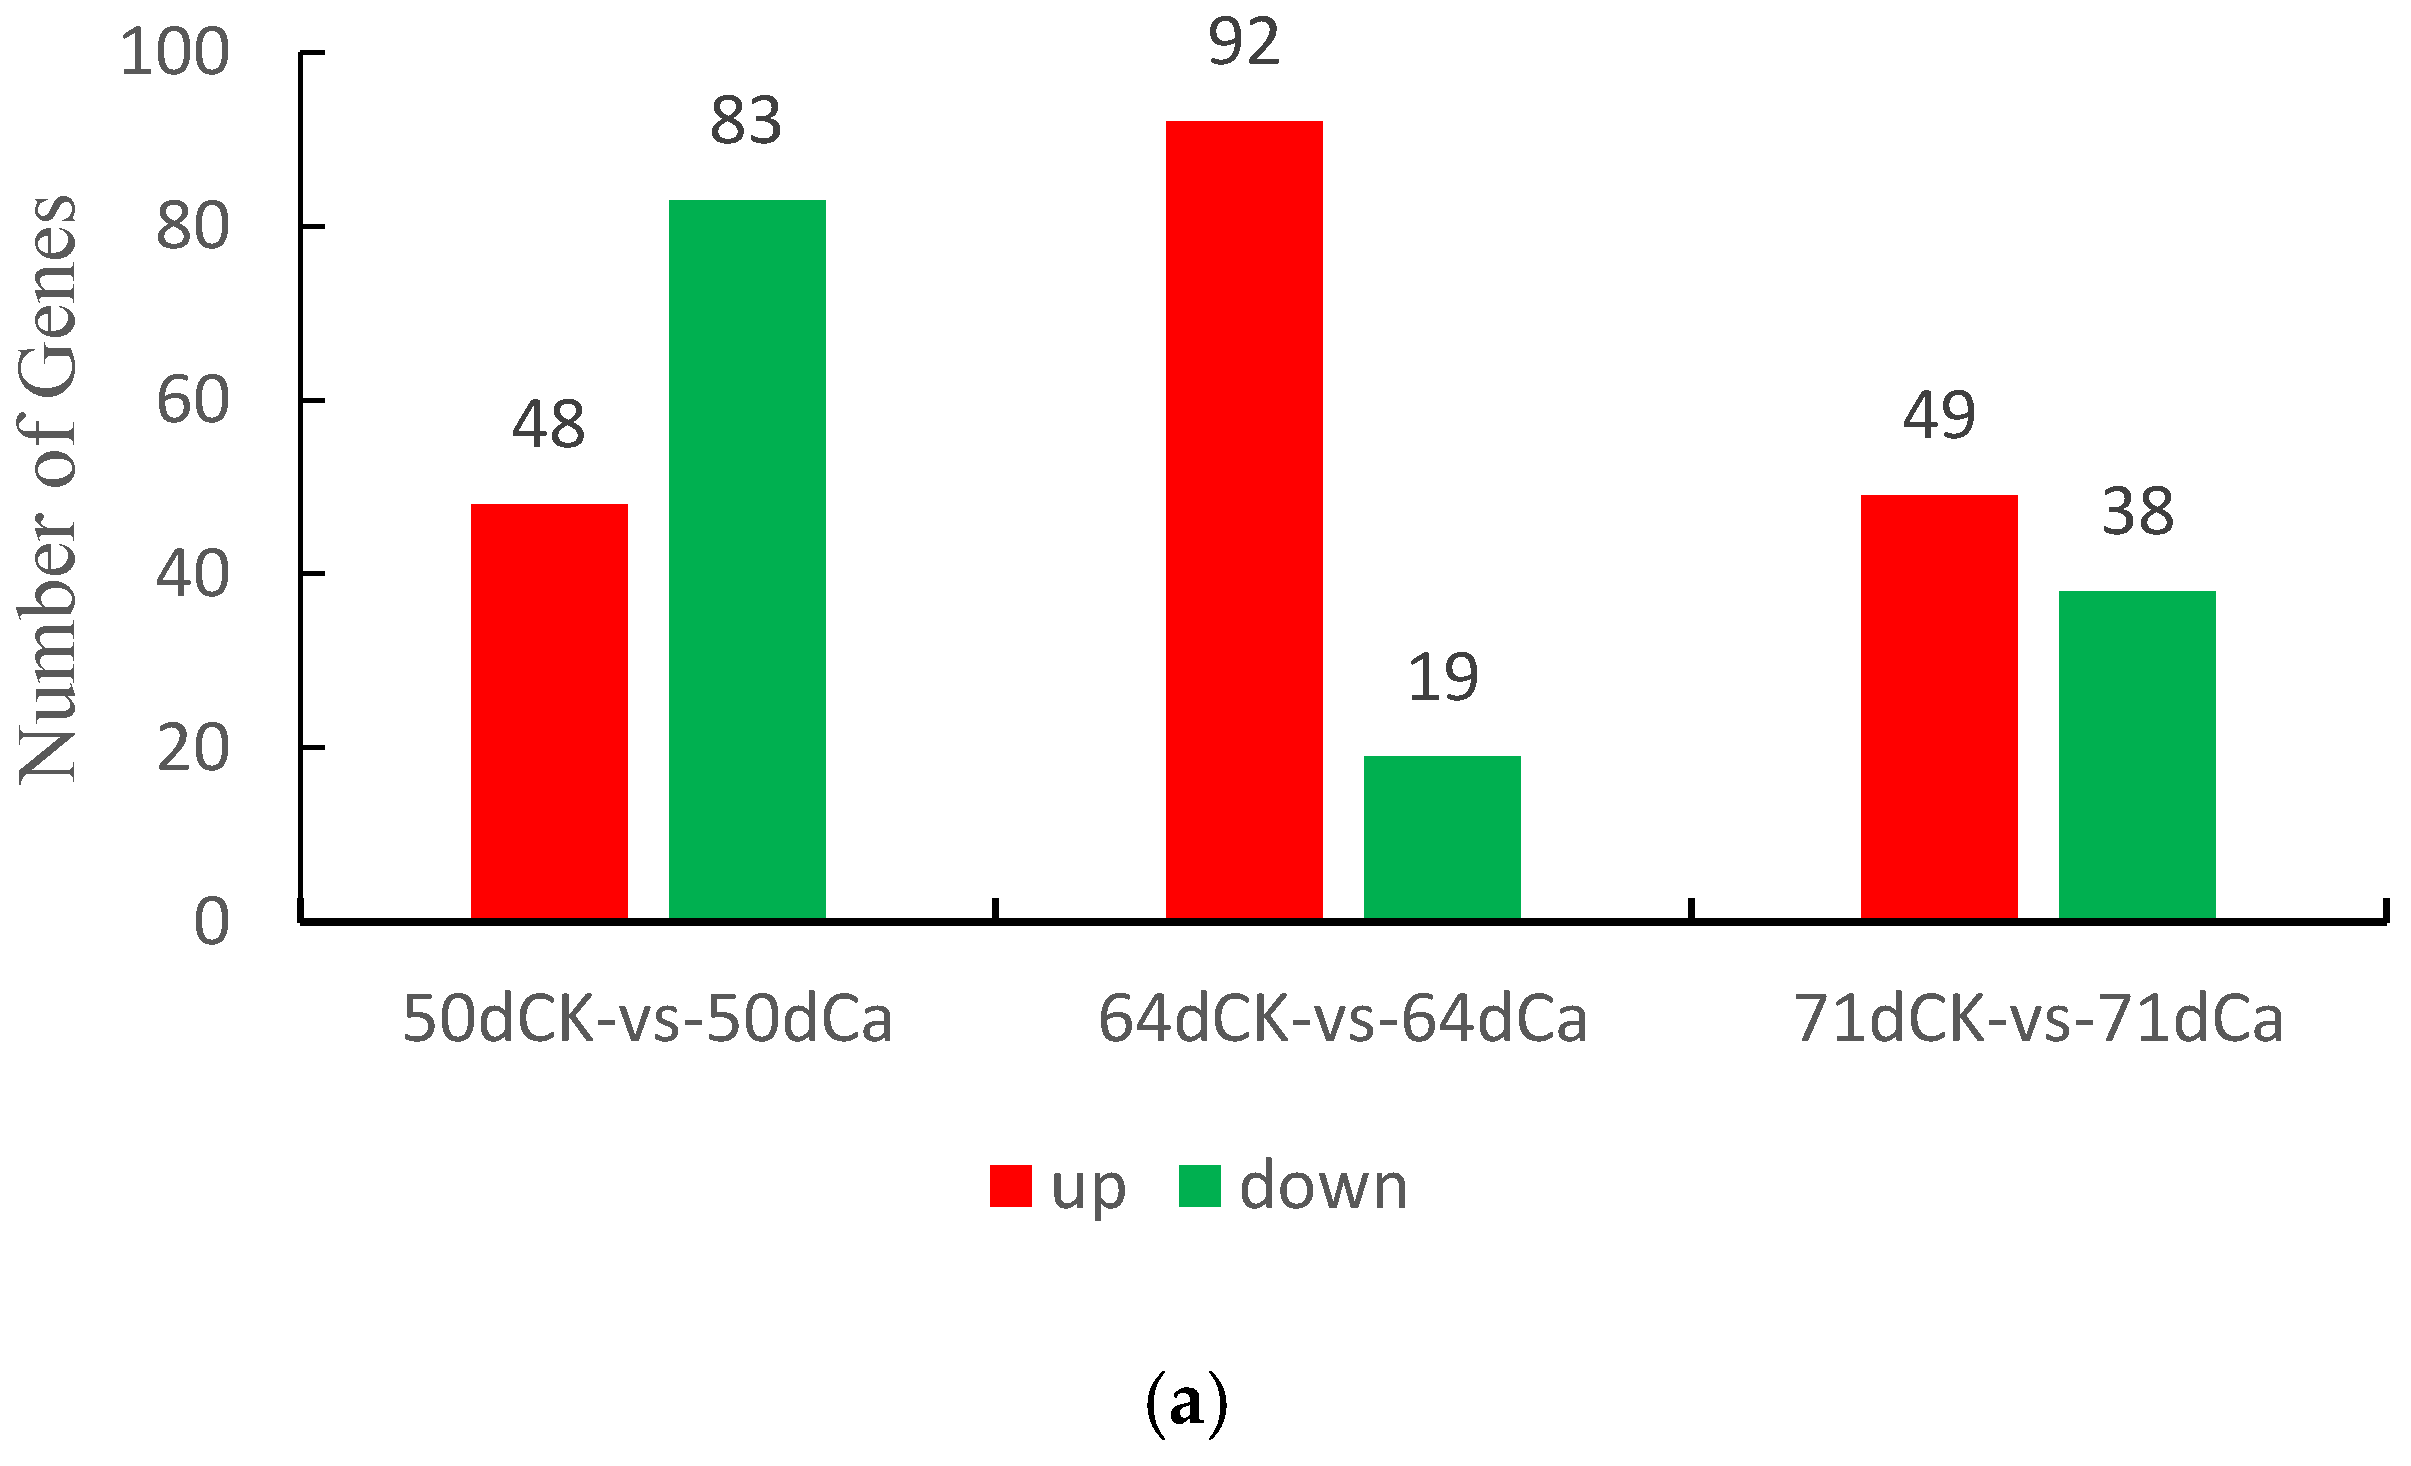
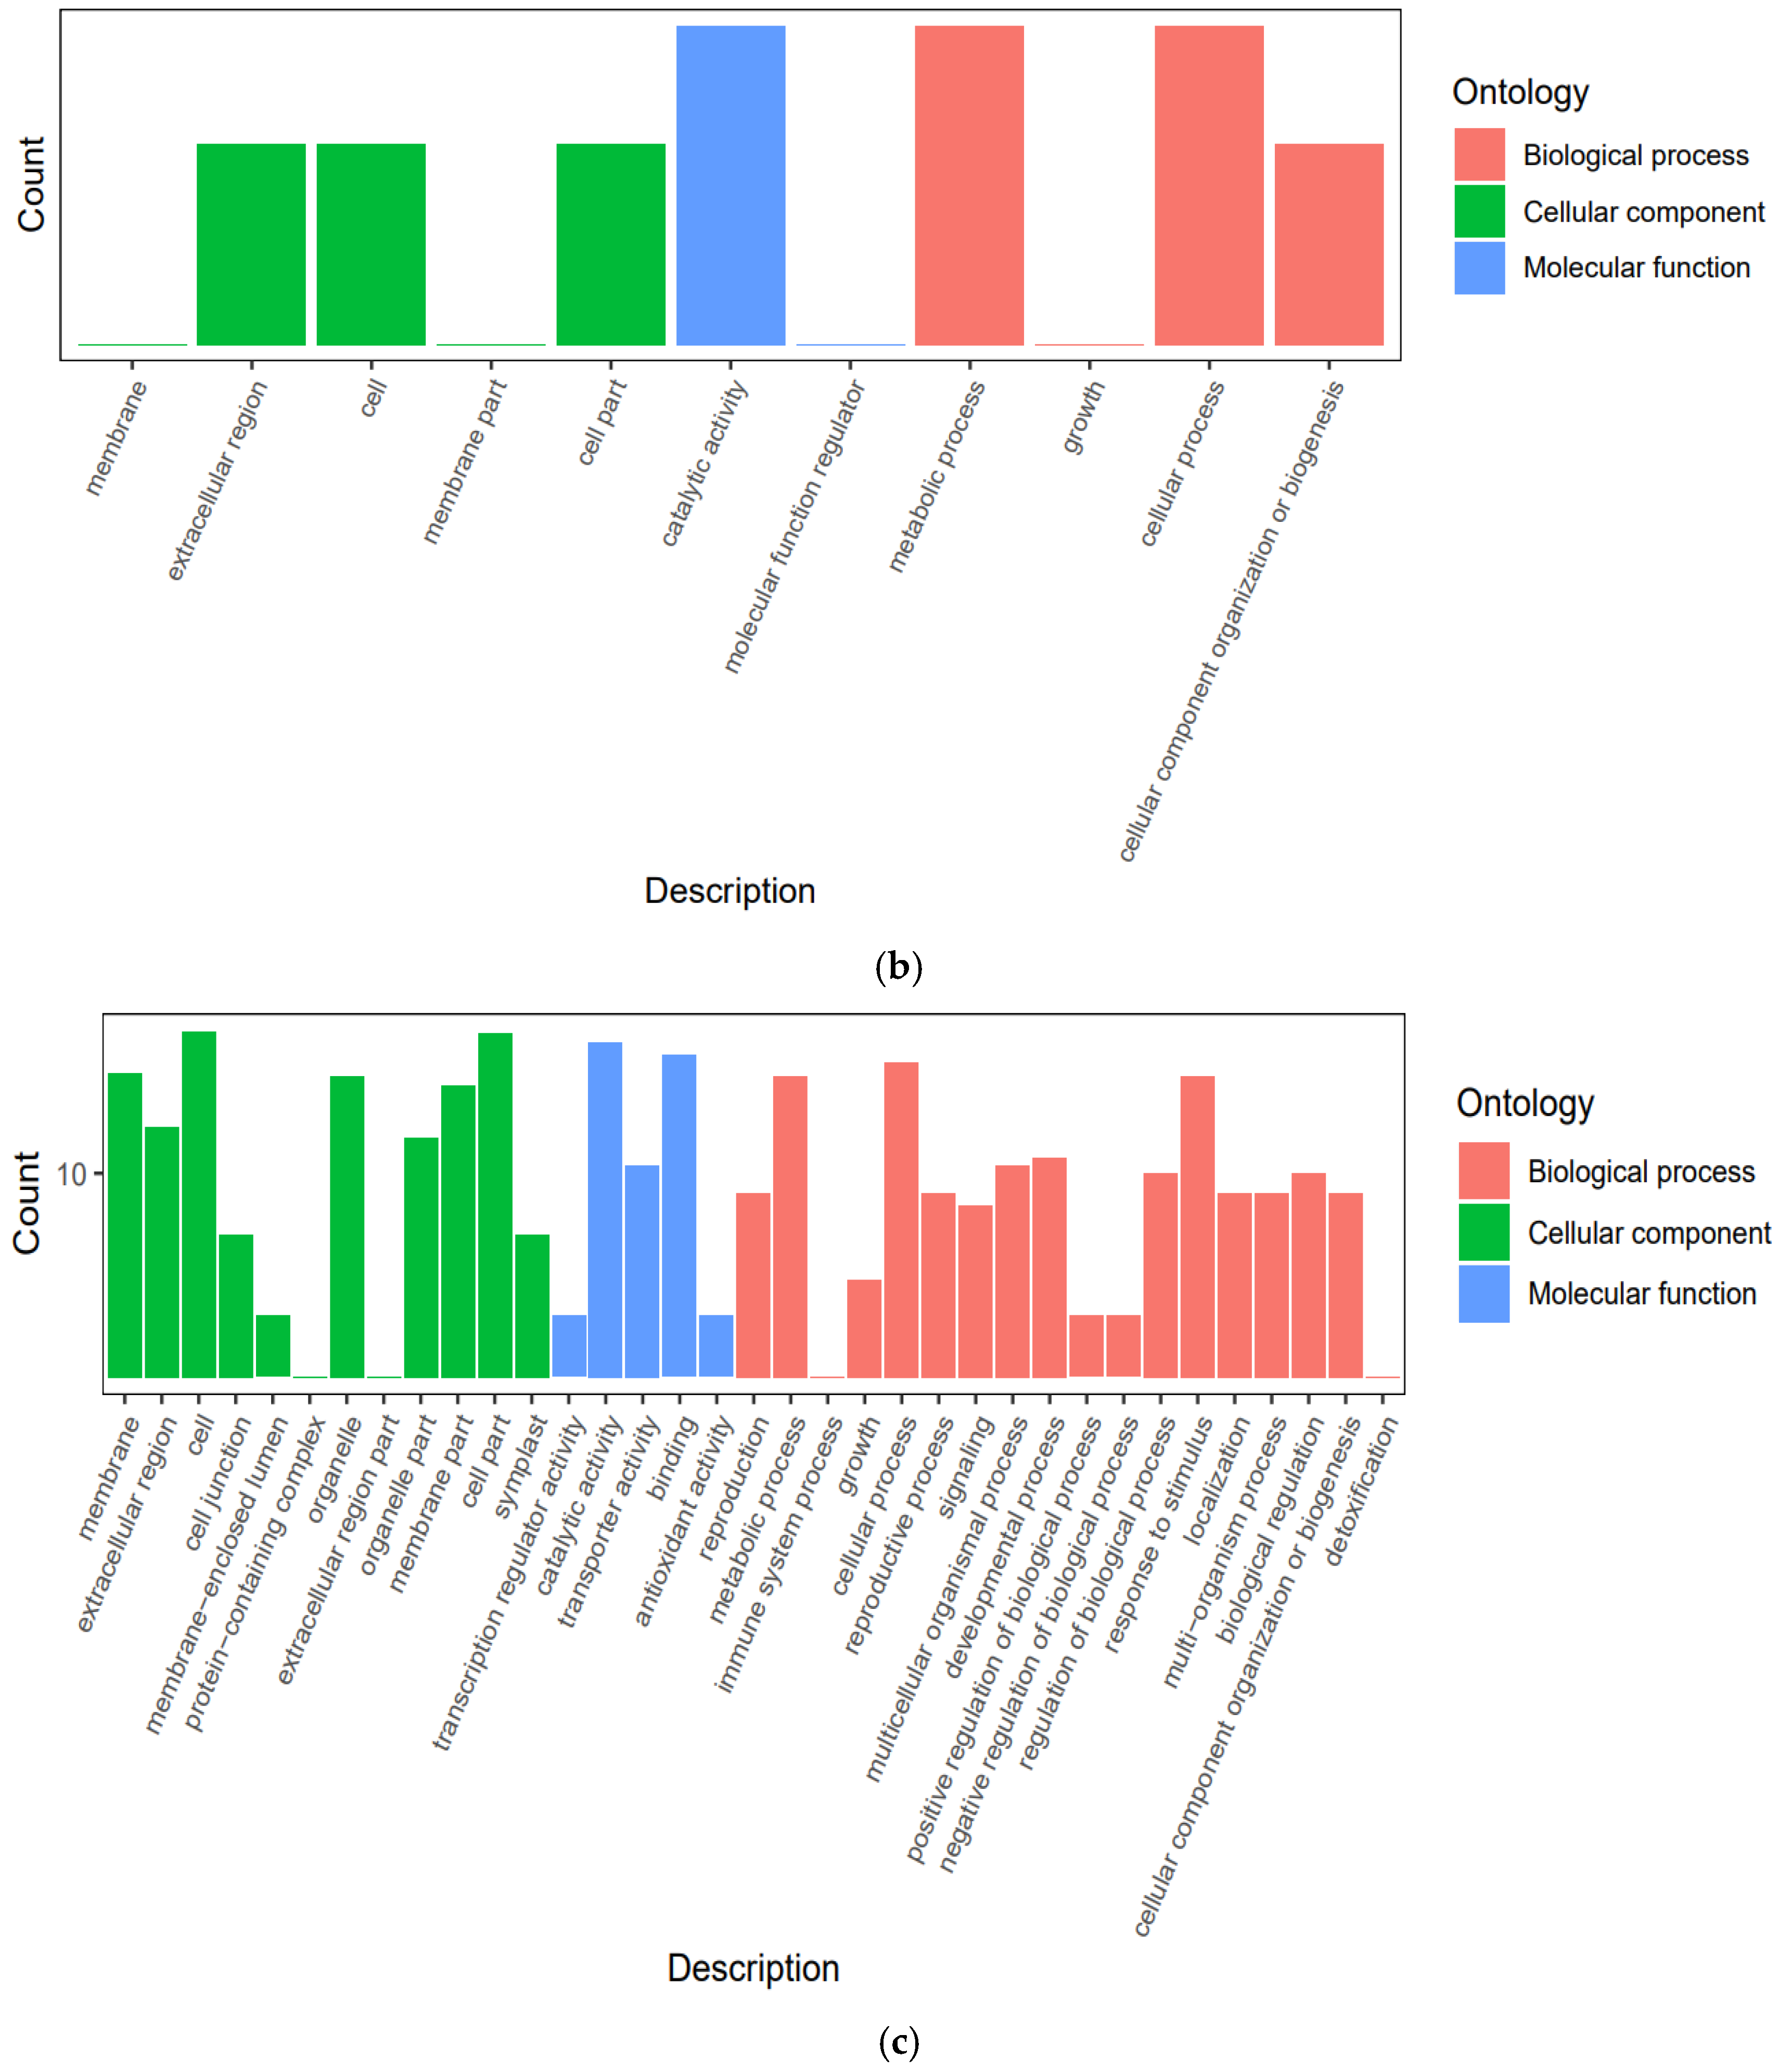
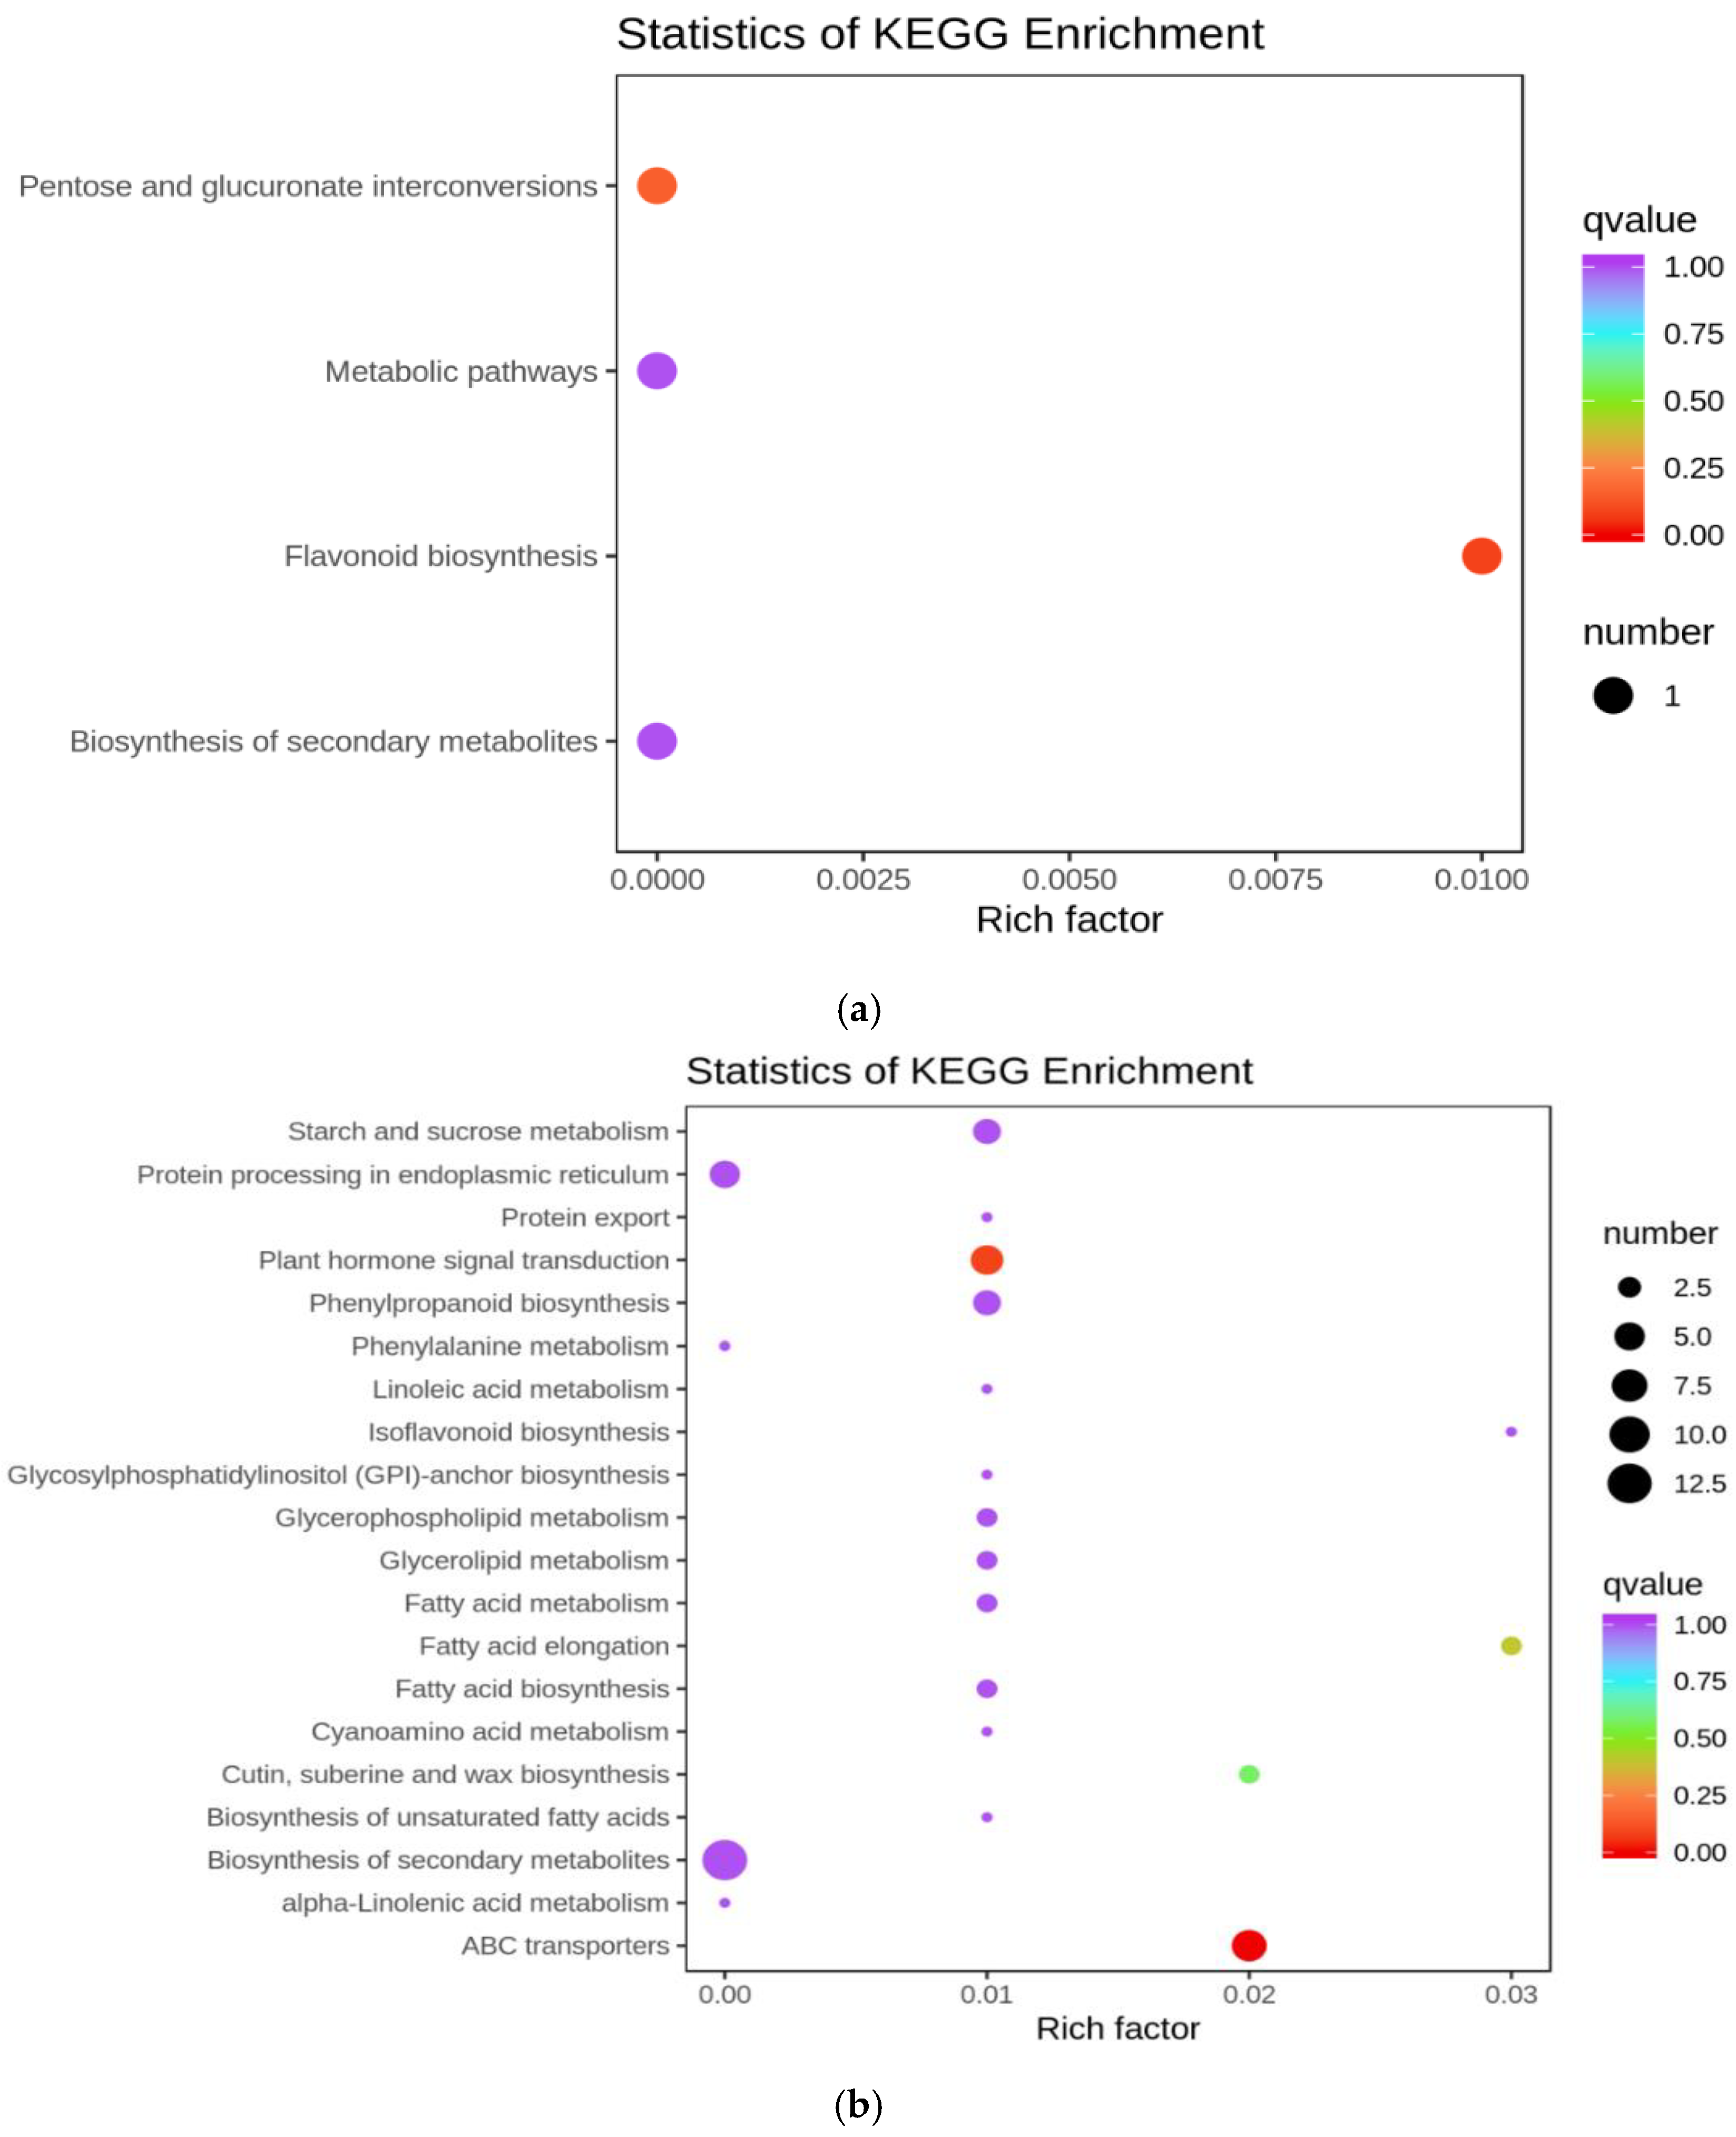
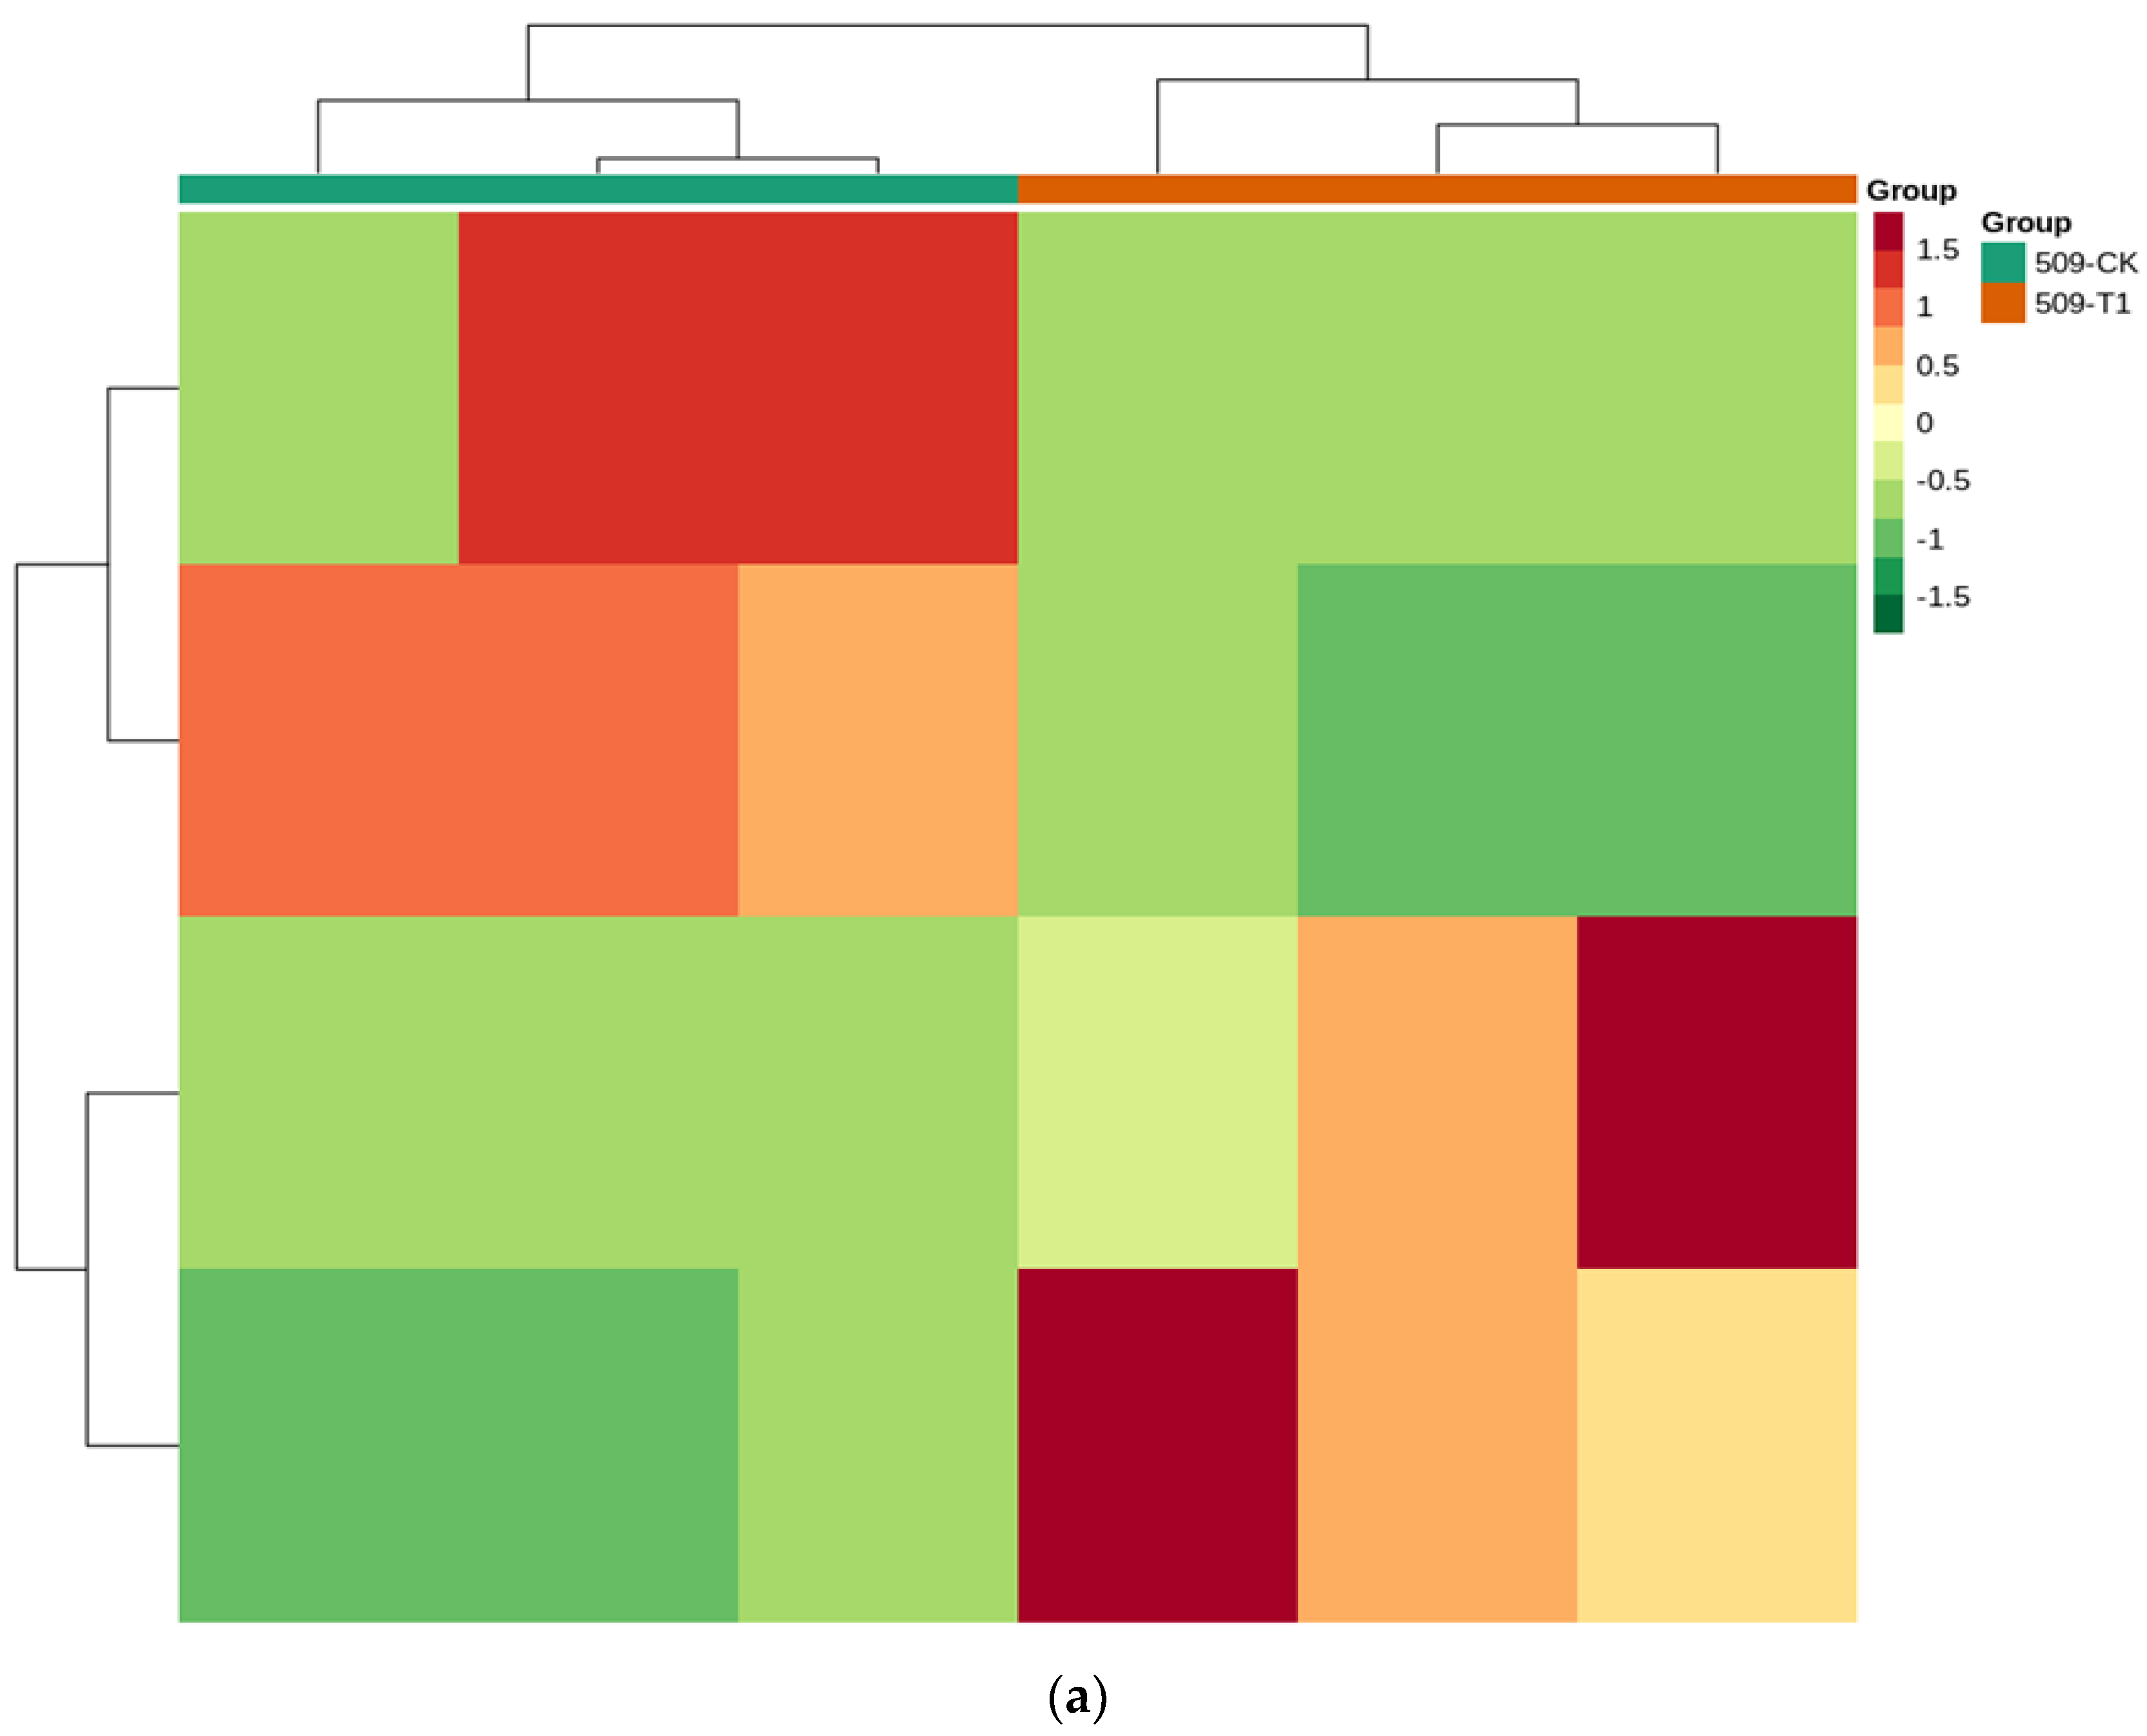
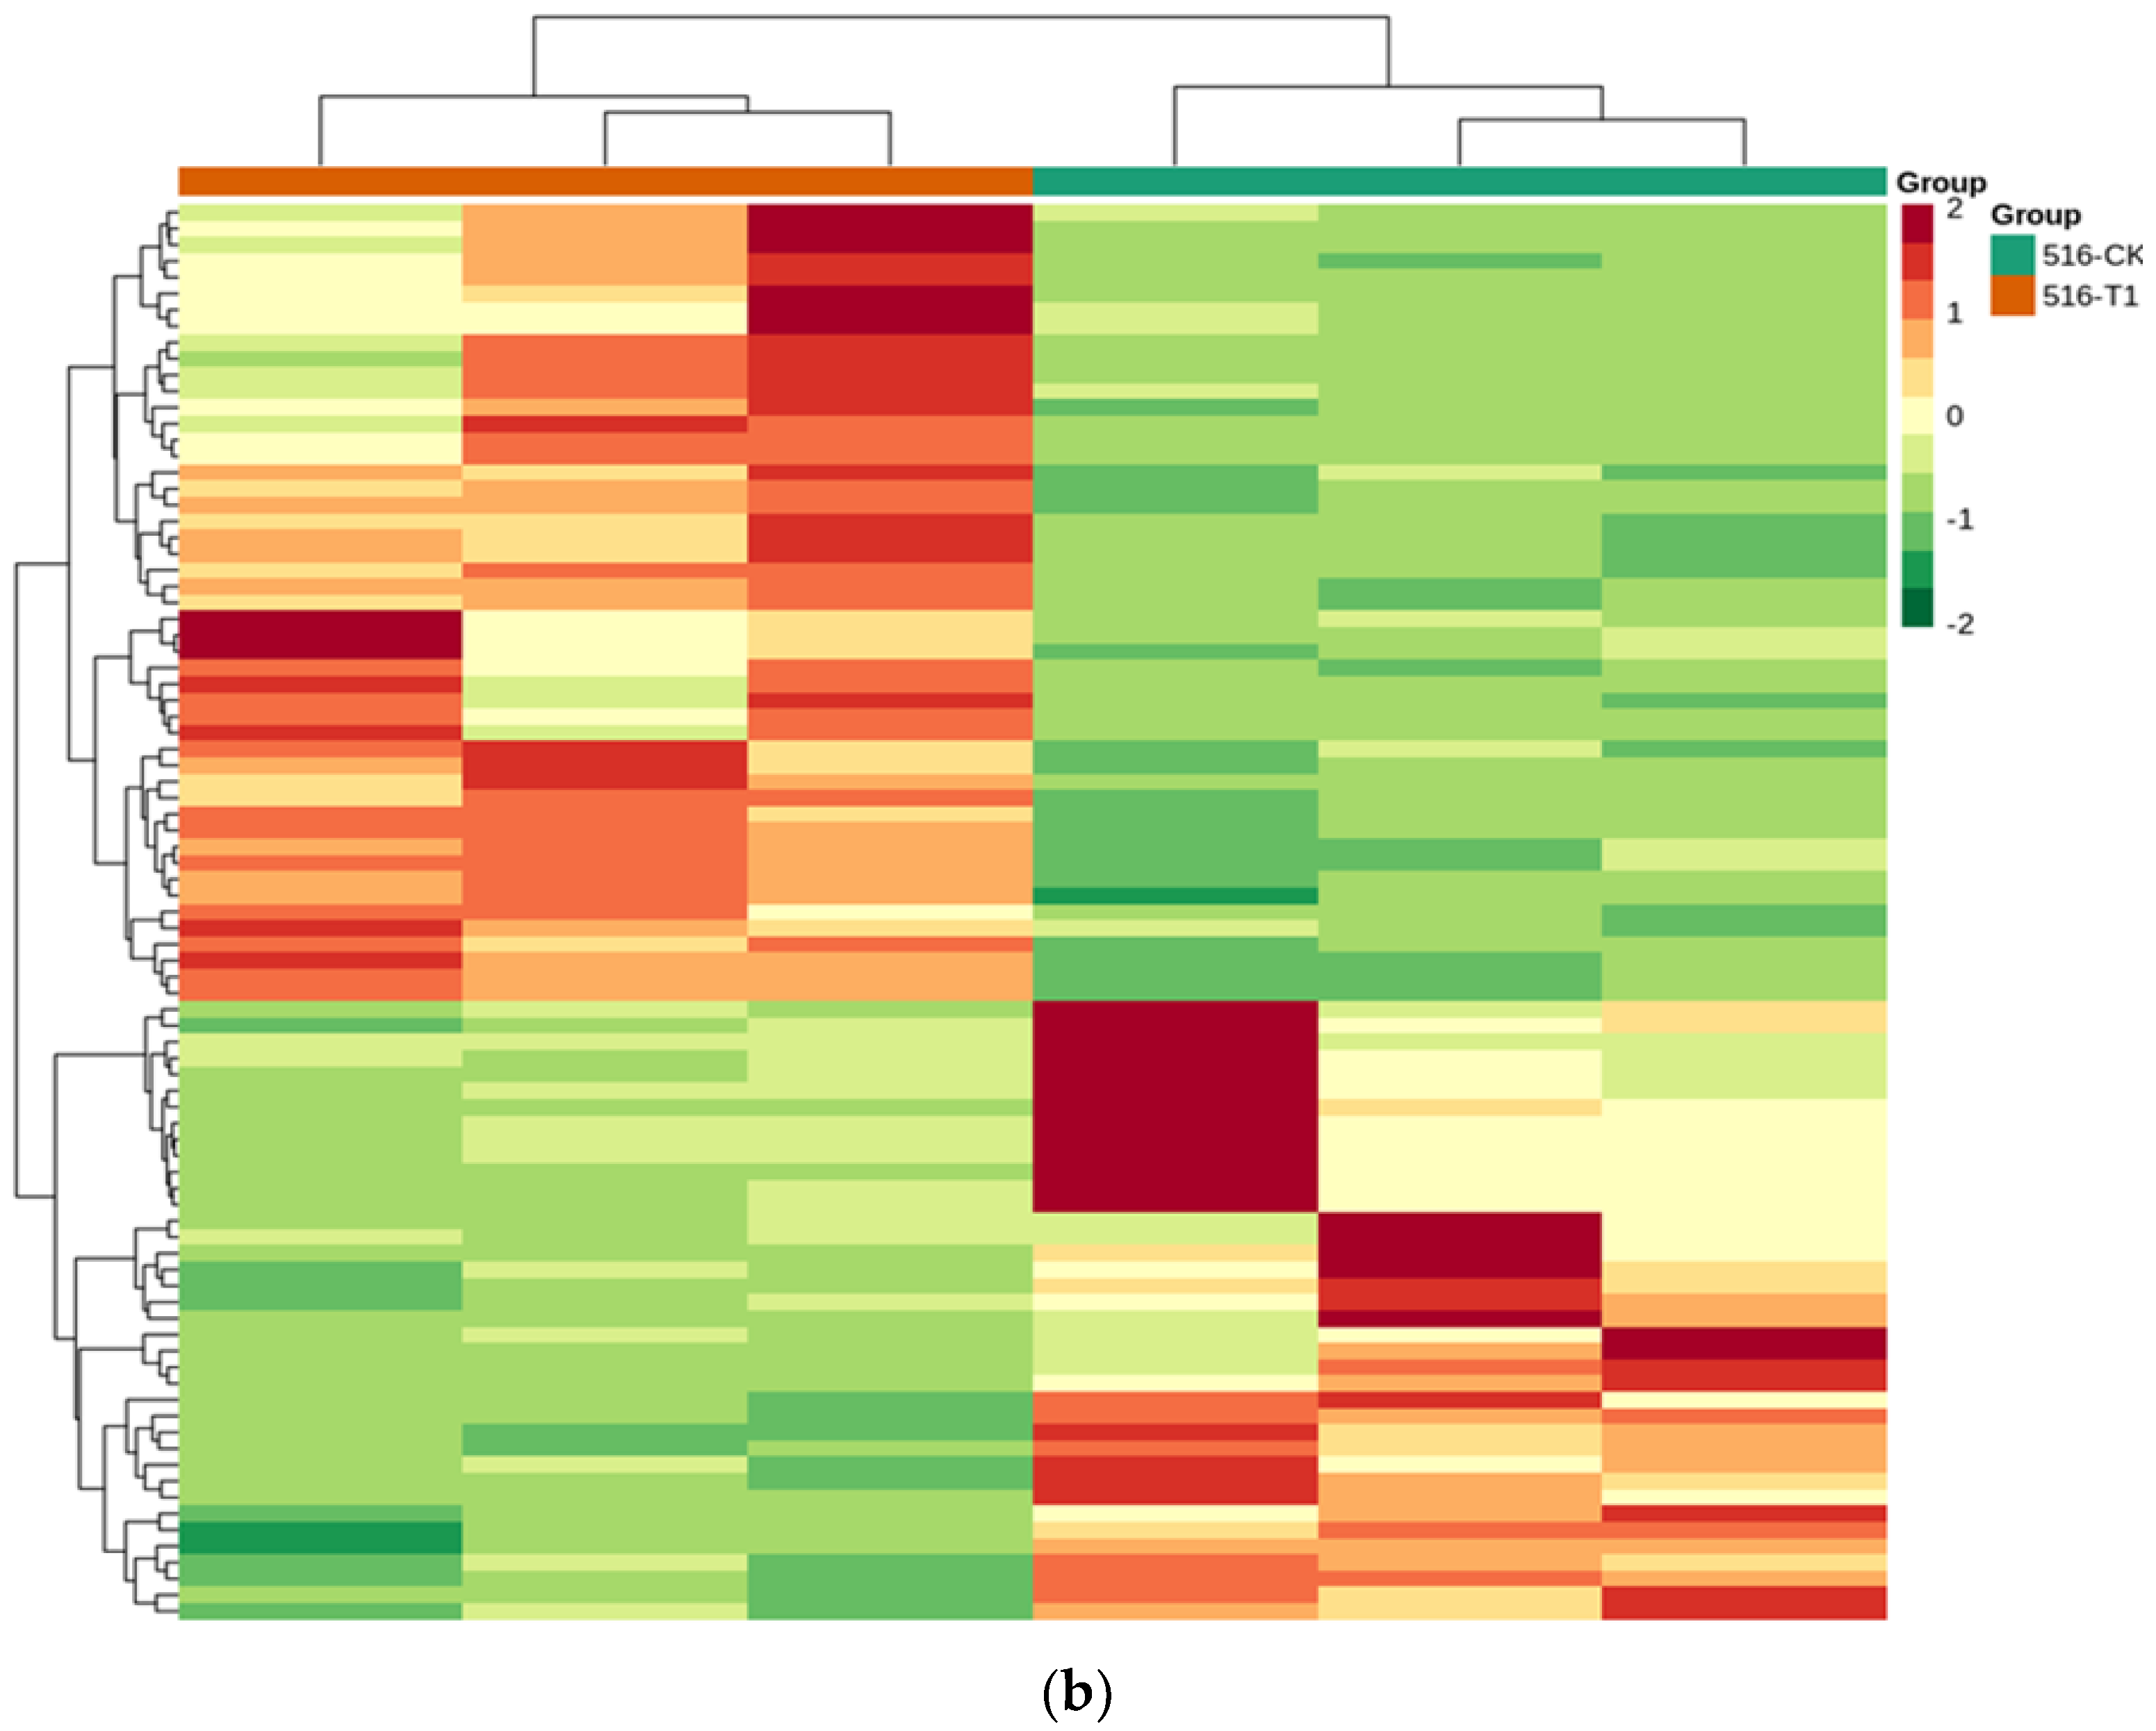
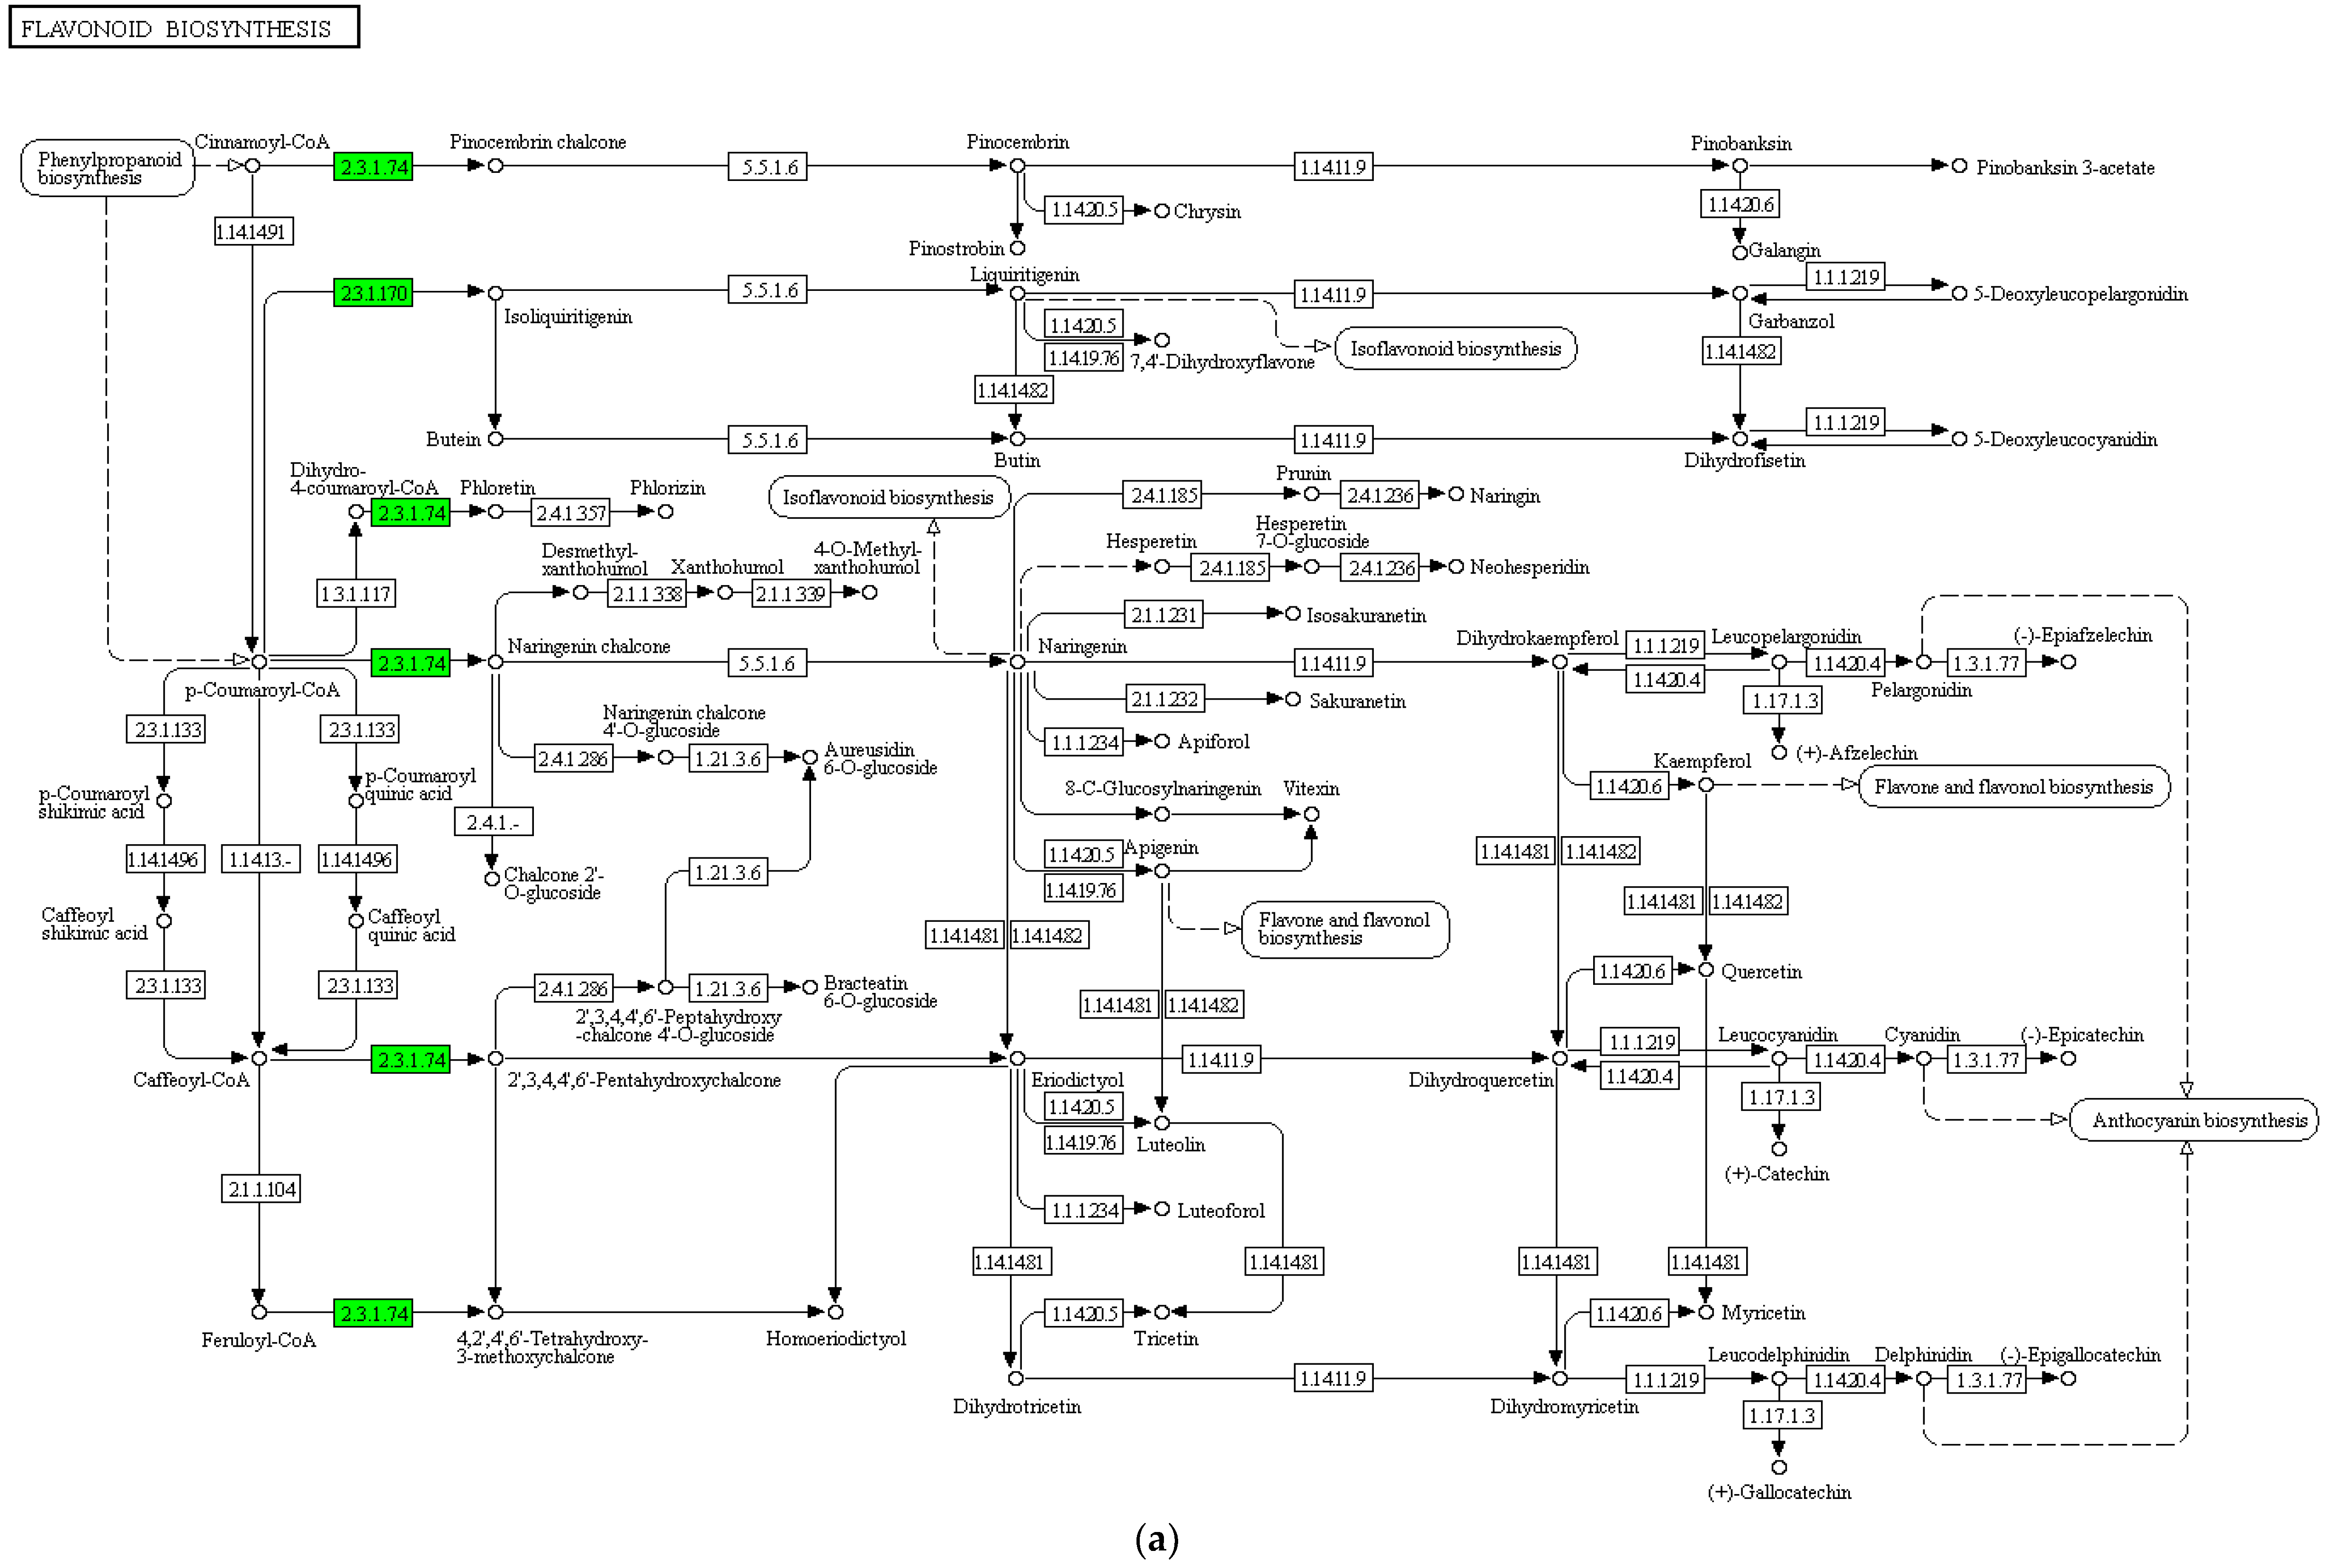
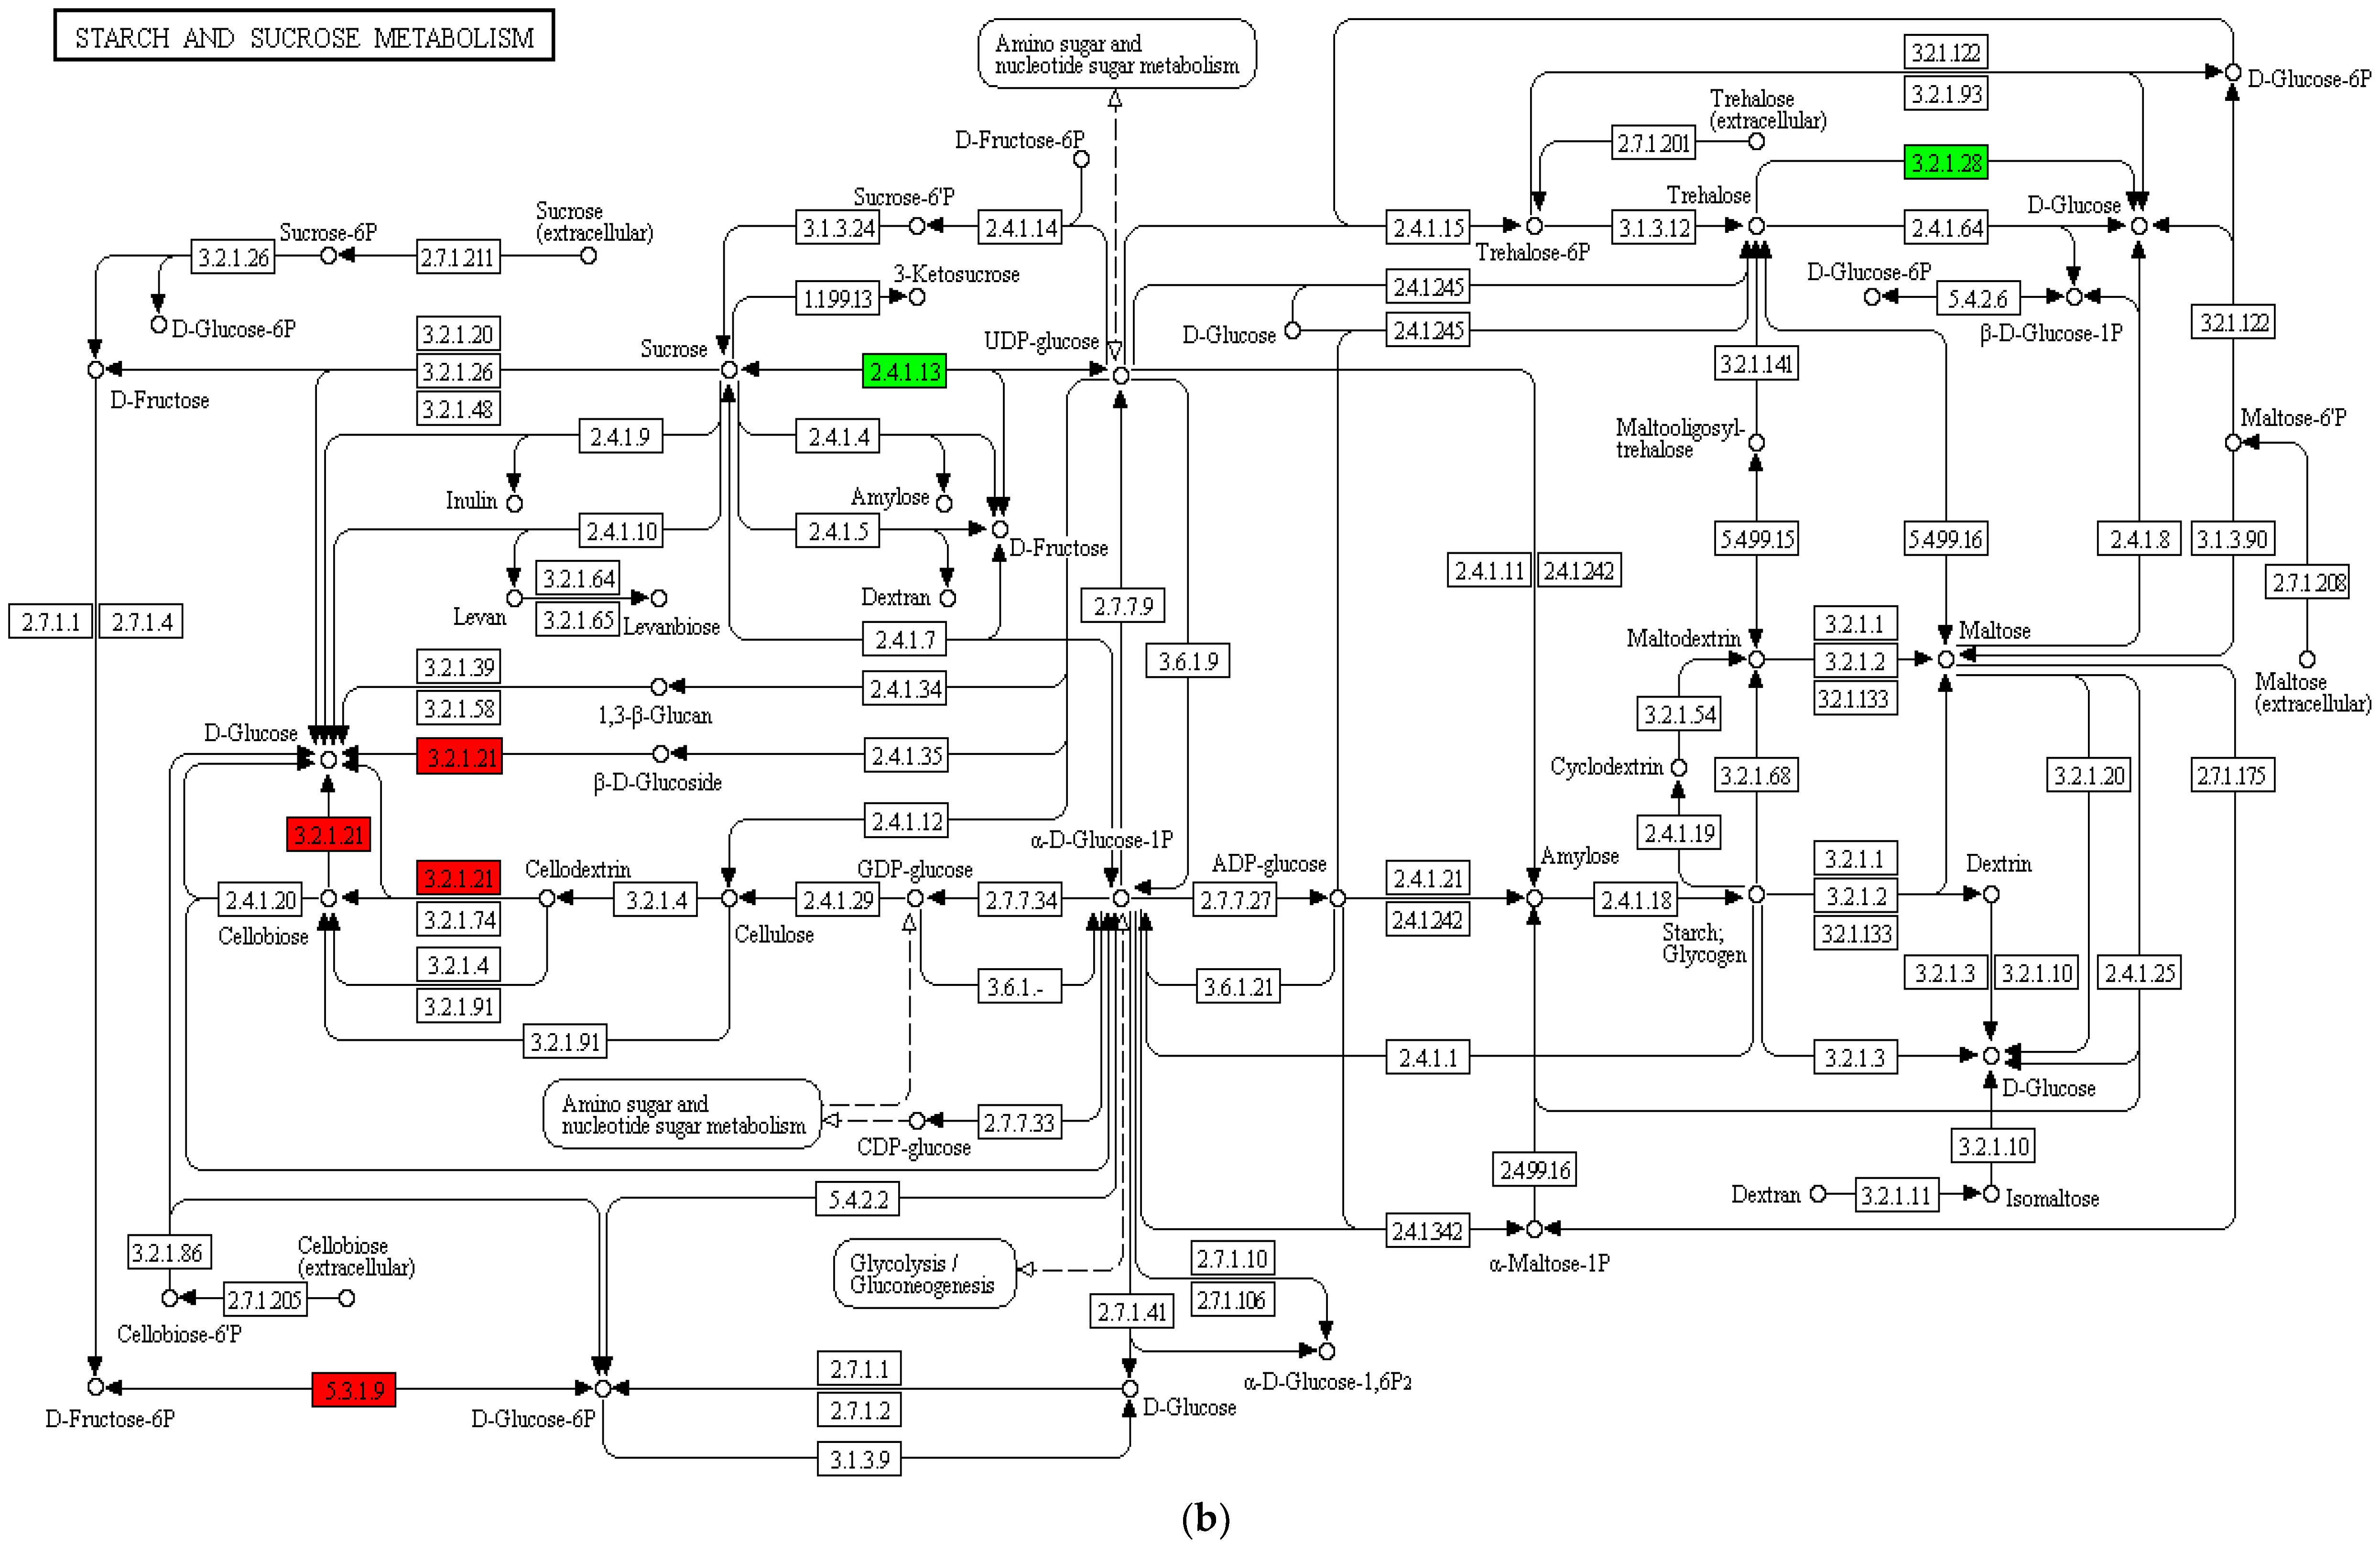
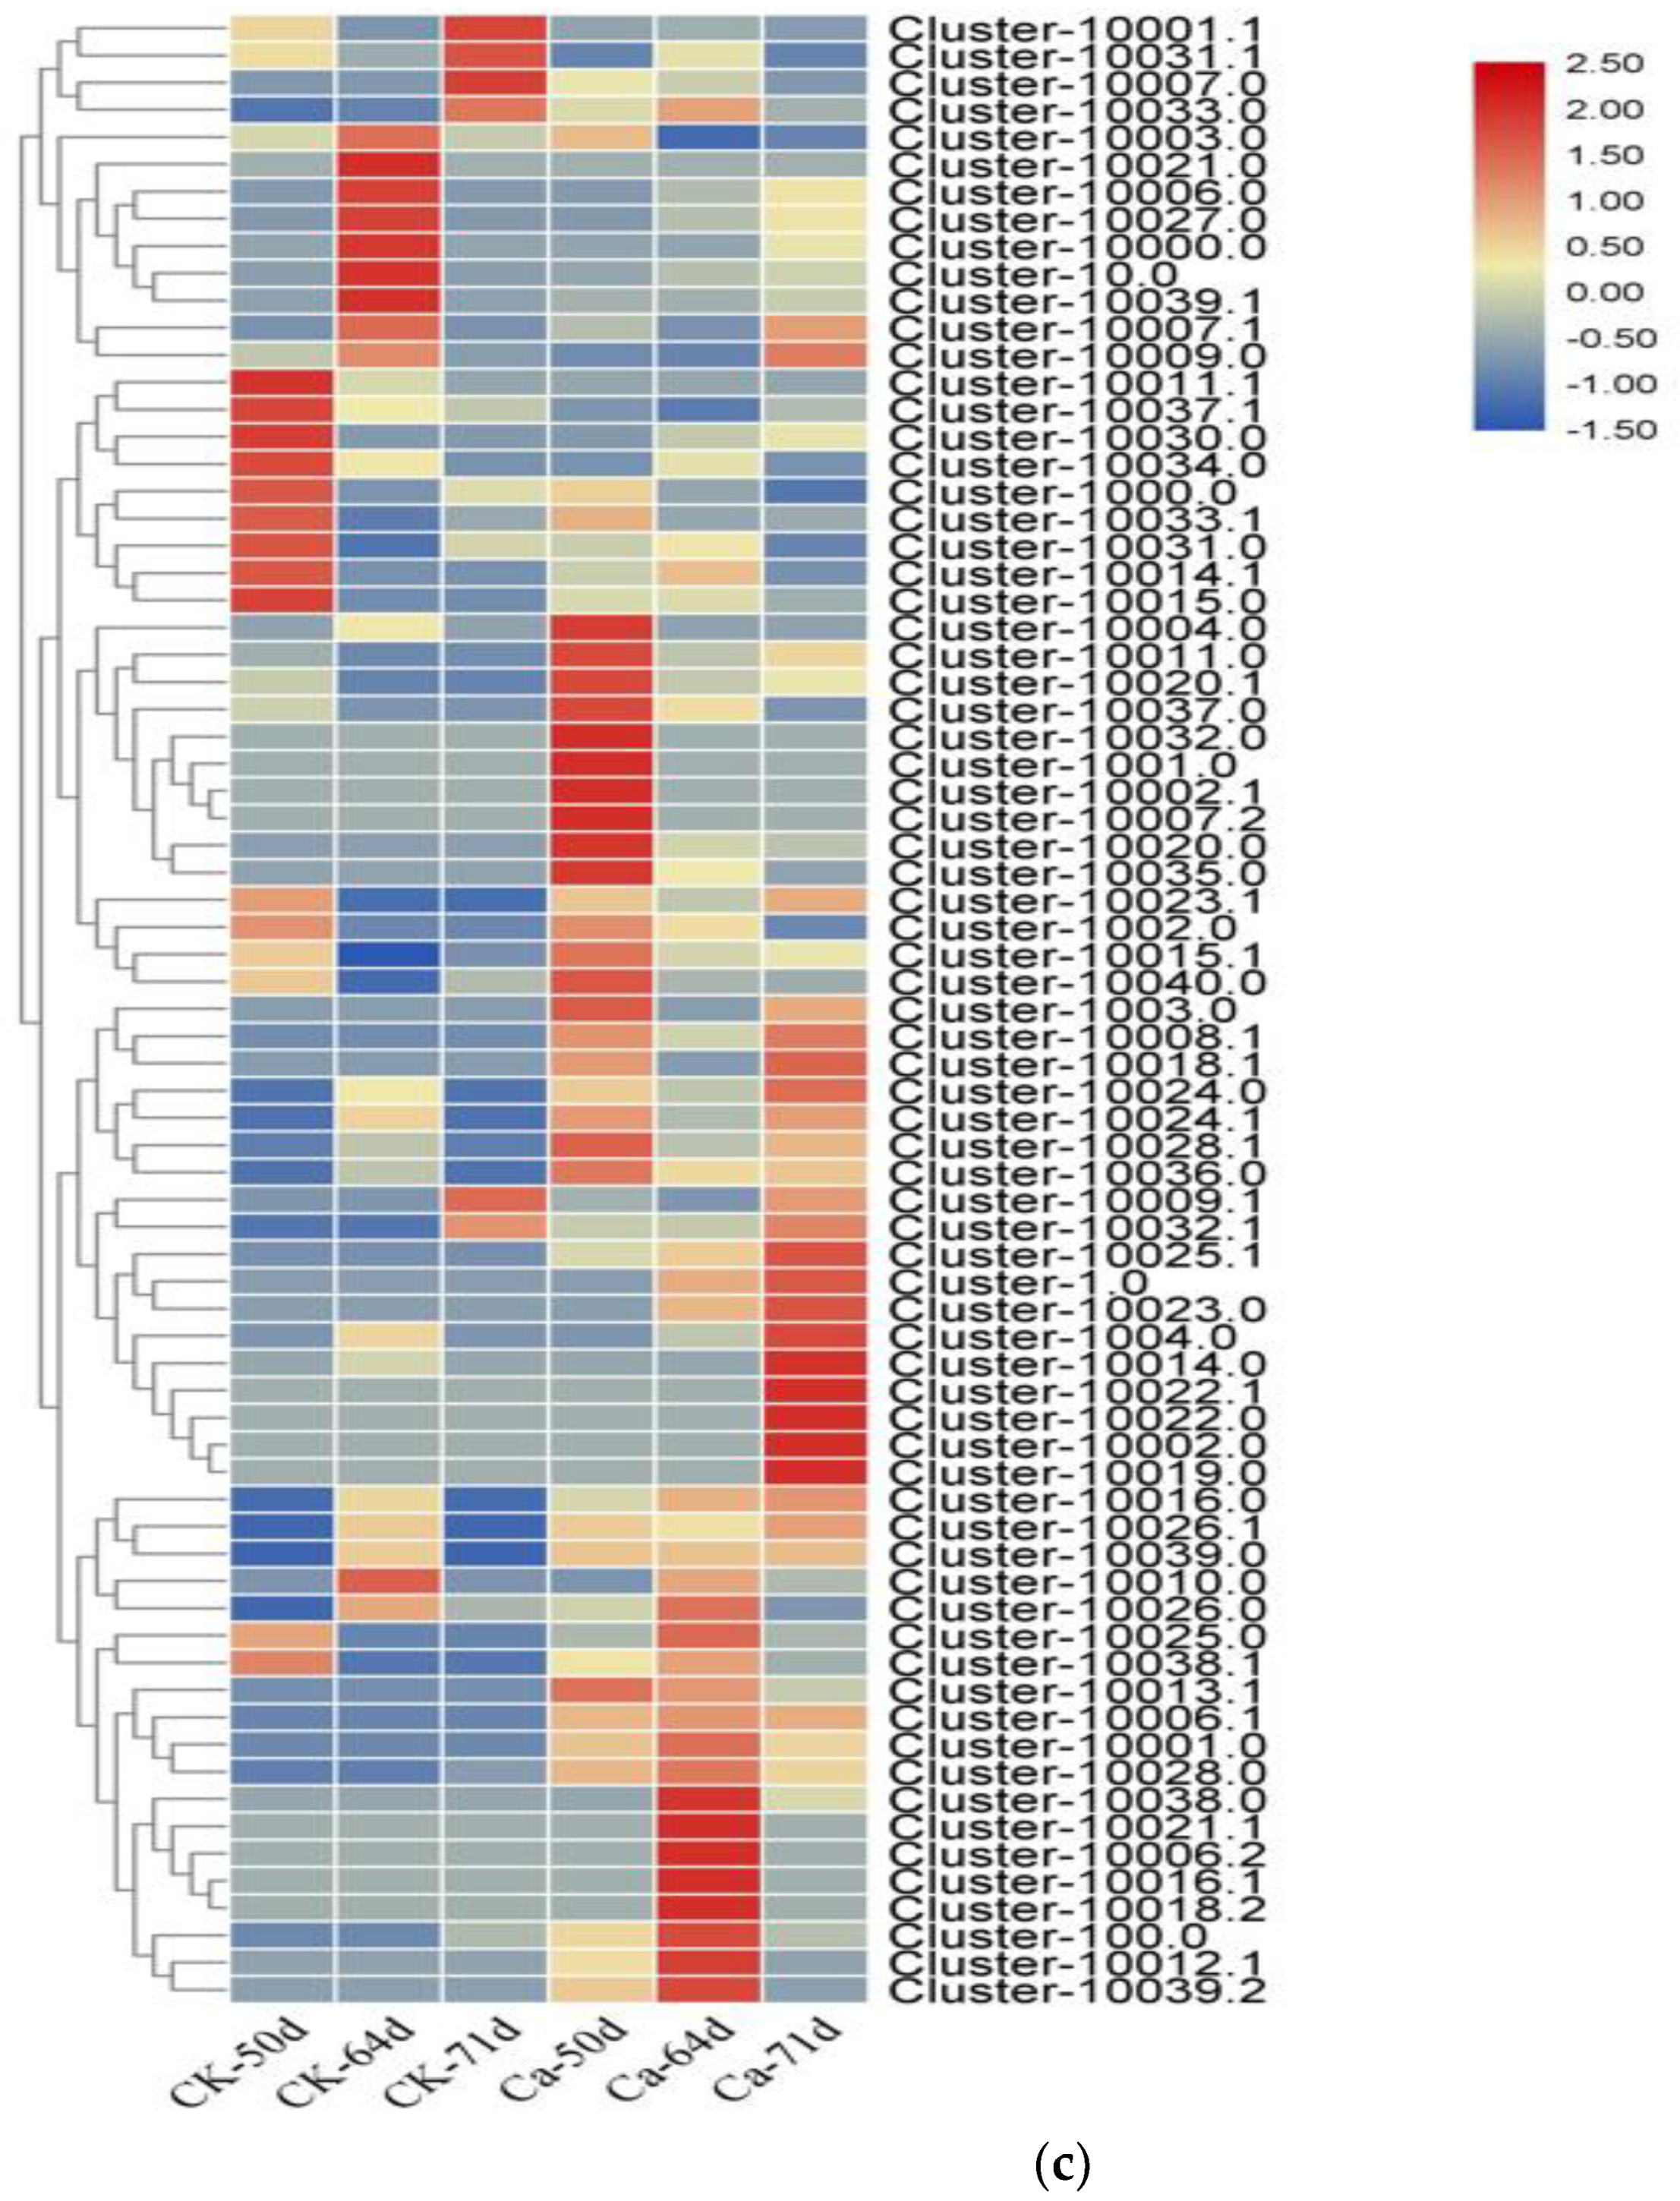
3.4.3. Functional Annotation and Enrichment Analysis of Differentially Expressed Genes
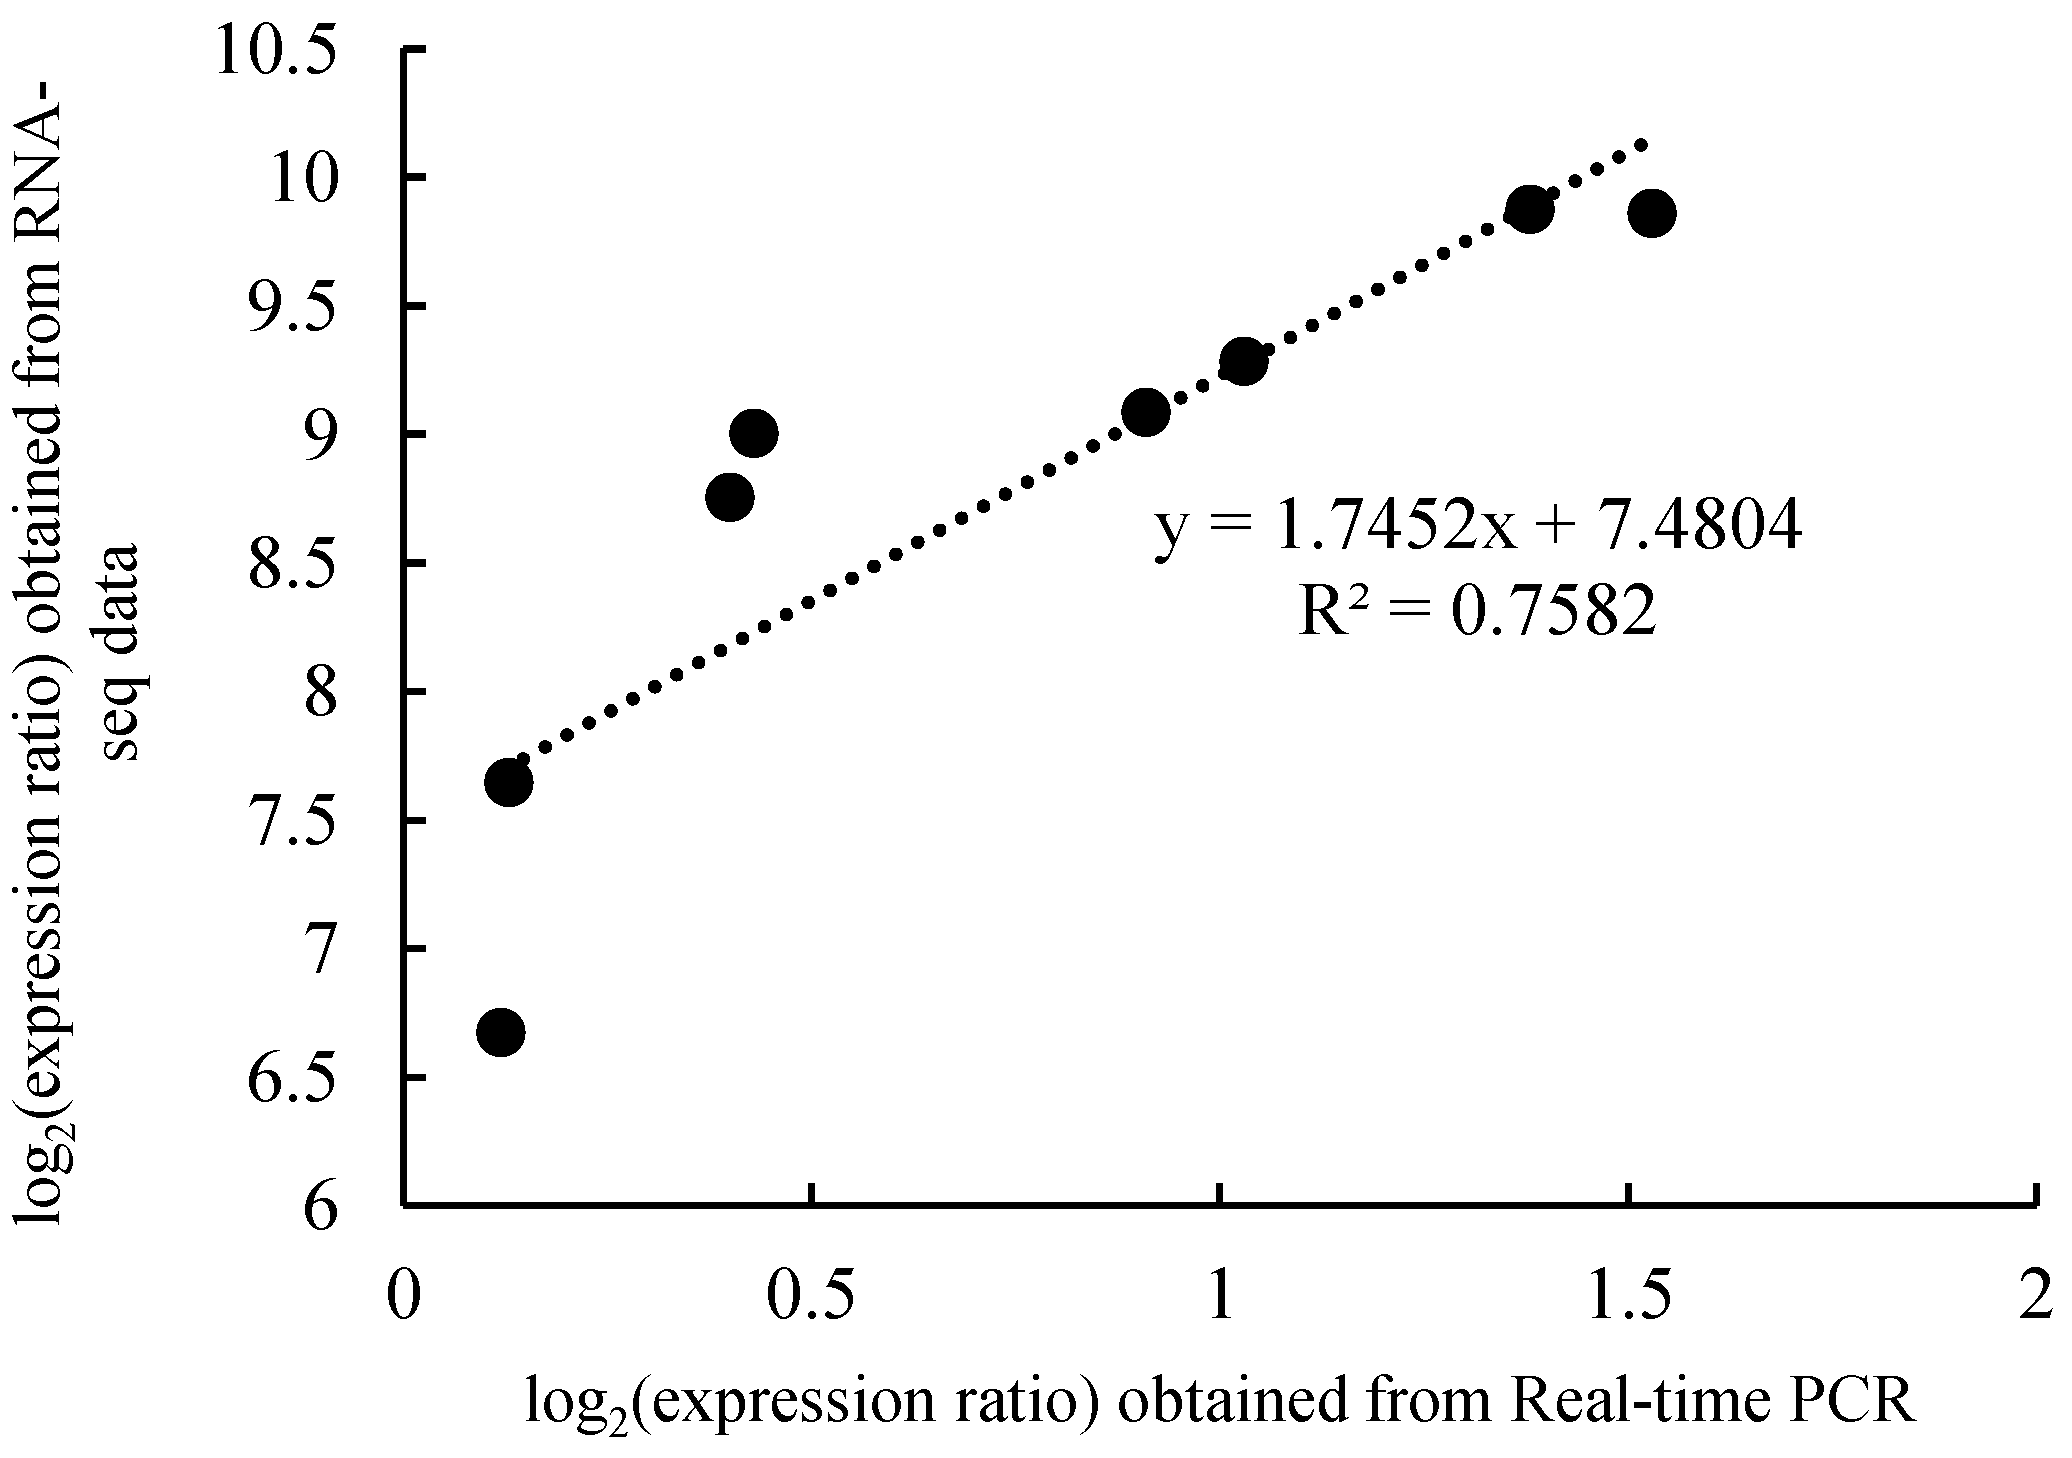
3.5. qRT–PCR Validation Analysis
4. Discussion and Analysis
5. Conclusions
Author Contributions
Funding
Data Availability Statement
Conflicts of Interest
References
- Liao, H.-Z.; Lin, X.-K.; Du, J.-J.; Peng, J.-J.; Zhou, K.-B. Transcriptomic analysis reveals key genes regulating organic acid synthesis and accumulation in the pulp of Litchi chinensis Sonn. cv. Feizixiao. Sci. Hortic. 2022, 303, 111220. [Google Scholar]
- Khadivi-Khub, A. Physiological and genetic factors influencing fruit cracking. Acta Physiol. Plant. 2014, 37, 1718. [Google Scholar] [CrossRef]
- Martínez Bolaños, M.; Martínez Bolaños, L.; Guzmán Deheza, A.; Gómez Jaimes, R.; Reyes Reyes, A.L. Calcio y ácido giberélico en el bretado de frutos de litchi (Litchi chinensis Soon.) cultivar Mauritius. Rev. Mex. Cienc. Agrícolas 2017, 8, 837–848. [Google Scholar] [CrossRef] [Green Version]
- Zhang, C.; Cui, L.; Zhang, P.; Dong, T.; Fang, J. Transcriptome and metabolite profiling reveal that spraying calcium fertilizer reduces grape berry cracking by modulating the flavonoid biosynthetic metabolic pathway. Food Chem. Mol. Sci. 2021, 2, 100025. [Google Scholar] [CrossRef] [PubMed]
- Wang, P.; Huang, Y.; Wang, X.; Wang, J.; Liu, F. Effects of calcium on gluconic acid accumulation in ‘Shine Muscat’ grape. IOP Conf. Ser. Earth Environ. Sci. 2021, 792, 012039. [Google Scholar] [CrossRef]
- Davarpanah, S.; Tehranifar, A.; Abadía, J.; Val, J.; Davarynejad, G.; Aran, M.; Khorassani, R. Foliar calcium fertilization reduces fruit cracking in pomegranate (Punica granatum cv. Ardestani). Sci. Hortic. 2018, 230, 86–91. [Google Scholar] [CrossRef]
- Wang, D.-R.; Yang, K.; Wang, X.; You, C.-X. A C2H2-type zinc finger transcription factor, MdZAT17, acts as a positive regulator in response to salt stress. J. Plant Physiol. 2022, 275, 153737. [Google Scholar] [CrossRef]
- Loekito, S.; Afandi Afandi, A.; Nishimura, N.; Koyama, H.; Senge, M. The Effects of Calcium Fertilizer Sprays during Fruit Development Stage on Pineapple Fruit Quality under Humid Tropical Climate. Int. J. Agron. 2022, 2022, 3207161. [Google Scholar] [CrossRef]
- Wang, R.; Qi, Y.; Wu, J.; Shukla, M.K.; Sun, Q. Influence of the application of irrigated water-soluble calcium fertilizer on wine grape properties. PLoS ONE 2019, 14, e0222104. [Google Scholar] [CrossRef]
- Wang, M.; Teng, Y. Genome-wide identification and analysis of MICU genes in land plants and their potential role in calcium stress. Gene 2018, 670, 174–181. [Google Scholar] [CrossRef]
- Aslam, R.; Williams, L.E.; Bhatti, M.F.; Virk, N. Genome-wide analysis of wheat calcium ATPases and potential role of selected ACAs and ECAs in calcium stress. BMC Plant Biol. 2017, 17, 174. [Google Scholar] [CrossRef] [PubMed]
- Wang, Z.; Tian, S.; Wang, J.; Shuai, H.; Zhang, Y.; Wang, Y.; Jin, B.; Zhao, X. Effects of pH and calcium salt stress on the seed germination performance of three herbage species. Authorea 2022. [Google Scholar]
- Su, Y.; Zhou, X.; Gao, D.; Zhou, K. Studies on the content change characteristics of K, Ca and Mg in pericarp of Litchi chinensis Sonn. cv. ’Feizixiao’ and their relation to the pericarp’s coloring. J. Yunnan Agric. Univ. 2016, 31, 274–280. [Google Scholar]
- Tian, S.; Zhou, X.; Gong, H.; Ma, X.; Zhang, F. Orthogonal test design for optimization of the extraction of polysaccharide from Paeonia sinjiangensis K.Y. Pan. Pharmacogn. Mag. 2011, 7, 4–8. [Google Scholar] [CrossRef] [Green Version]
- Wang, H.; Huang, H.; Huang, X.; Hu, Z. Sugar and acid compositions in the arils of Litchi chinensis Sonn.: Cultivar differences and evidence for the absence of succinic acid. J. Hortic. Sci. Biotechnol. 2006, 81, 57–62. [Google Scholar] [CrossRef]
- Nielsen, T.H.; Skjærbæ, H.C.; Karlsen, P. Carbohydrate metabolism during fruit development in sweet pepper (Capsicum annuum) plants. Physiol. Plant. 1991, 82, 311–319. [Google Scholar] [CrossRef]
- Li, B.; Dewey, C.N. RSEM: Accurate transcript quantification from RNA-Seq data with or without a reference genome. BMC Bioinform. 2011, 12, 323. [Google Scholar] [CrossRef] [Green Version]
- Love, M.I.; Huber, W.; Anders, S. Moderated estimation of fold change and dispersion for RNA-seq data with DESeq2. Genome Biol. 2014, 15, 550. [Google Scholar] [CrossRef] [PubMed] [Green Version]
- Chen, C.; Chen, H.; Zhang, Y.; Thomas, H.R.; Frank, M.H.; He, Y.; Xia, R. TBtools: An Integrative Toolkit Developed for Interactive Analyses of Big Biological Data. Mol. Plant 2020, 13, 1194–1202. [Google Scholar] [CrossRef]
- Borsani, J.; Budde, C.O.; Porrini, L.; Lauxmann, M.A.; Lombardo, V.A.; Murray, R.; Andreo, C.S.; Drincovich, M.F.; Lara, M.V. Carbon metabolism of peach fruit after harvest: Changes in enzymes involved in organic acid and sugar level modifications. J. Exp. Bot. 2009, 60, 1823–1837. [Google Scholar] [CrossRef] [Green Version]
- Chan, H.T.; Kwok, S.C.M.; Lee, C.W.Q. Sugar composition and invertase activity in lychee. J. Food Sci. 1975, 40, 772–774. [Google Scholar] [CrossRef]
- Kambiranda, D.; Vasanthaiah, H.; Basha, S.M. Relationship between acid invertase activity and sugar content in grape species. J. Food Biochem. 2011, 35, 1646–1652. [Google Scholar] [CrossRef]
- Chen, L.; Hangxian, X.; Xueliang, C.; Yuxue, Z.; Jinbo, Y.; Jinping, S.; Lei, Z. Genome-wide identification and expression pattern of alkaline/neutral invertase gene family in Dendrobium catenatum. Biotechnol. Biotechnol. Equip. 2021, 35, 527–537. [Google Scholar]
- Abdullah, M.; Cao, Y.; Cheng, X.; Meng, D.; Chen, Y.; Shakoor, A.; Gao, J.; Cai, Y. The Sucrose synthase gene family in Chinese Pear (Pyrus bretschneideri Rehd.): Structure, Expression, Evolution. Molecules 2018, 23, 1144. [Google Scholar] [CrossRef]
- Yang, Z.; Wang, T.; Wang, H.; Huang, X.; Qin, Y.; Hu, G. Patterns of enzyme activities and gene expressions in sucrose metabolism in relation to sugar accumulation and composition in the aril of Litchi chinensis Sonn. J. Plant Physiol. 2013, 170, 731–740. [Google Scholar] [CrossRef] [PubMed]
- Huicong, W.; Huibai, H.; Xuming, H. Sugar accumulation and related enzyme activities in the litchi fruit of ‘Nuomici’ and ‘Feizixiao’. Acta Hortic. Sin. 2003, 30, 1. [Google Scholar]
- Gao, F.; Zhang, H.; Zhang, W.; Wang, N.; Zhang, S.; Chu, C.; Liu, C. Engineering of the cytosolic form of phosphoglucose isomerase into chloroplasts improves plant photosynthesis and biomass. New Phytol. 2021, 231, 315–325. [Google Scholar] [CrossRef]
- Srivastava, N.; Rathour, R.; Jha, S.; Pandey, K.; Srivastava, M.; Thakur, V.K.; Sengar, R.S.; Gupta, V.K.; Mazumder, P.B.; Khan, A.F.; et al. Microbial Beta Glucosidase Enzymes: Recent Advances in Biomass Conversation for Biofuels Application. Biomolecules 2019, 9, 220. [Google Scholar] [CrossRef] [Green Version]
- Schmölzer, K.; Gutmann, A.; Diricks, M.; Desmet, T.; Nidetzky, B. Sucrose synthase: A unique glycosyltransferase for biocatalytic glycosylation process development. Biotechnol Adv. 2016, 34, 88–111. [Google Scholar] [CrossRef]
- He, X.; Wei, Y.; Kou, J.; Xu, F.; Chen, Z.; Shao, X. PpVIN2, an acid invertase gene family member, is sensitive to chilling temperature and affects sucrose metabolism in postharvest peach fruit. Plant Growth Regul. 2018, 86, 169–180. [Google Scholar] [CrossRef]
- Russell, C.; Morris, D. Invertase activity, soluble carbohydrates and inflorescence development in the tomato (Lycopersicon esculentum Mill.). Ann. Bot. 1982, 49, 89–98. [Google Scholar] [CrossRef]
- Wang, Z.; Yuan, M.; Li, S.; Gao, D.; Zhou, K. Applications of magnesium affect pericarp colour in the Feizixiao lychee. J. Hortic. Sci. Biotechnol. 2017, 92, 559–567. [Google Scholar] [CrossRef]


| Sample | Raw Reads | Clean Reads | Clean Bases (Gb) | Error Rate (%) | Q30 (%) | GC Content (%) |
|---|---|---|---|---|---|---|
| 35d-CK | 48,281,265 | 47,115,740.7 | 7.0 | 0.02 | 92.5 | 44.9 |
| 64d-CK | 48,142,673 | 47,328,952 | 7.0 | 0.02 | 91.4 | 44.9 |
| 64d-Ca | 49,977,736 | 49,345,295.3 | 7.4 | 0.02 | 92.3 | 44.8 |
| 71d-CK | 47,102,587 | 46,452,051.3 | 6.9 | 0.02 | 91.6 | 44.9 |
| 71d-Ca | 47,311,827 | 46,672,307.3 | 7.0 | 0.02 | 91.8 | 44.8 |
| Type | Number | Mean Length | N50 | N90 | Total Bases |
|---|---|---|---|---|---|
| Transcript | 306,396 | 1119 | 1913 | 456 | 342,893,342 |
| Unigene | 115,413 | 894 | 1581 | 335 | 103,163,097 |
| Database | Number of Genes | Percentage (%) |
|---|---|---|
| KEGG | 41,174 | 35.6 |
| NR | 51,132 | 44.3 |
| SwissProt | 36,242 | 31.4 |
| TrEMBL | 51,397 | 44.5 |
| KOG | 32,067 | 27.7 |
| GO | 43,328 | 37.5 |
| Pfam | 34,652 | 30.0 |
| Annotated in at least one database | 55,352 | 47.9 |
Publisher’s Note: MDPI stays neutral with regard to jurisdictional claims in published maps and institutional affiliations. |
© 2022 by the authors. Licensee MDPI, Basel, Switzerland. This article is an open access article distributed under the terms and conditions of the Creative Commons Attribution (CC BY) license (https://creativecommons.org/licenses/by/4.0/).
Share and Cite
Shui, X.; Wang, W.; Ma, W.; Yang, C.; Zhou, K. Mechanism by Which High Foliar Calcium Contents Inhibit Sugar Accumulation in Feizixiao Lychee Pulp. Horticulturae 2022, 8, 1044. https://doi.org/10.3390/horticulturae8111044
Shui X, Wang W, Ma W, Yang C, Zhou K. Mechanism by Which High Foliar Calcium Contents Inhibit Sugar Accumulation in Feizixiao Lychee Pulp. Horticulturae. 2022; 8(11):1044. https://doi.org/10.3390/horticulturae8111044
Chicago/Turabian StyleShui, Xian, Wenjing Wang, Wuqiang Ma, Chengkun Yang, and Kaibing Zhou. 2022. "Mechanism by Which High Foliar Calcium Contents Inhibit Sugar Accumulation in Feizixiao Lychee Pulp" Horticulturae 8, no. 11: 1044. https://doi.org/10.3390/horticulturae8111044