1. Introduction
Rapid urbanization and increased per capita incomes have significantly transformed the agriculture sector and food supply chains [
1]. This is primarily due to changes in food consumption patterns which have shifted the consumption of simple food grains to high-value processed cereals, dairy products, vegetables, and fruits. These changes have forced developing countries to re-organize their production and marketing arrangements while linking smallholder producers with Modern Supply Chains (MSC) [
2]. MSC have the potential to link producers with processors for further value addition or link them with export markets to help boost export earnings [
3,
4]. Hence, MSC in agro-based industries engage with stakeholders and entities such as production, processing, marketing and distribution. These MSC have also been conceptualized under agriculture production networks such as the global value chain. However, there are several implications for linking smallholders with these MSC networks in the domestic and international markets. Given these, little is known about the potential impact of MSC on various stakeholders, who would gain and who lose in this kind of integration and how does MSC participation affect growers’ relative efficiency. According to the supply chain, efficiency focuses on the internal processes within the supply chain. It relates to effectively using available resources (e.g., financial, human, physical, etc.) to lower the costs associated with the supply chain. Technology can often play a pivotal role in optimizing supply chains. In other words, supply chain efficiency is a measure of integration in the value chain to reduce the operational and packaging costs and time wastage.
Mandarin is the most commonly grown citrus fruit in Pakistan, accounting for about 90% of the total citrus production [
5]. Pakistan is the 13th largest producer of mandarin [
6] and the sixth largest exporter of mandarins worldwide [
7]. The country annually produces around 2.36 million tons of mandarins from 206.6 thousand hectares. Presently, the country exports 10% of its total production. Likewise, major export markets for mandarin include Gulf countries, South and Central Asia and the European Union [
8]. Thus, increasing the export volume through improved supply chains mechanism holds profound potential for adding to the export bill, farmers’ income, and rural development in the country. For that purpose, benefiting from the improved flow of fresh agri-food products from developing countries to developed countries could help integrate smallholder participation into MSC. Yet, smallholders in developing countries face many challenges in their access to high-value markets [
3,
4,
9]. A considerable amount of literature studied the determinants of farmers’ participation in MSC, giving mixed results. The seminal work of various studies by [
10,
11,
12,
13,
14] reported that fierce competition excludes smallholders from sufficient economic gains from niche markets arising along with different MSC to meet the increasingly growing global food demand. Conversely, some proponents of MSC such as [
2,
15,
16,
17] contended the successful cases for smallholder inclusion in the MSC with the help of innovative institutional roles such as contract farming. Recent studies explored that in developing countries, MSC are driven by high-value export chains and supermarkets. Yet, no research explored the welfare impact of MSC on smallholders in developing countries. Although MSC are believed to positively impact smallholders’ income and social status, there remain major gaps in how different sales channels affect smallholder farmers in developing countries. Likewise, there is a need to establish evidence of how MSC improve technology and rural-urban linkages and positively contribute to smallholders’ welfare in a developing country context.
Myriad snags deter the smallholder’s inclusion and formation of inclusive supply chains where economic benefits drive the demand and supply chains, i.e., climatic conditions, farm management issues, harvest and handling issues, the role of intermediaries, quarantine-related issues, insect and pest management, unskilled labor, sanitary and phytosanitary requirements in the high-end markets, market information, energy shortfalls and security issues in the country [
18]. However, recent evidence from developing countries showed that the MSC contributes to improving efficiency and production as well as mitigating production and market issues [
2,
15,
16,
19,
20,
21,
22]. Therefore, to expand the market choices for the farmers and to capture more profits by value addition, the government of Pakistan is supporting the participation of private sector operators that positively influence the growth in the development of agri-food industries by linking small farmers with the MSC [
23]. Likewise, several studies largely focused on the determinants of participation and overlooked the consequent effect of participation on smallholder efficiency and welfare. In the case of Pakistan, citrus supply chains are constrained by several factors, inter alia, post-harvest losses are foremost that impede the development of citrus supply chains. Given this, studying the role of MSC among mandarin farmers represents a unique case where quantity supplied and perishability poses a major constraint to smallholder mandarin farmers in Punjab, Pakistan.
To this end, this study attempts to fill the existing research gap by analyzing the determinants that affect the small farmers’ participation and efficiency of MSC in the agri-food supply chains. Supply chain efficiency refers to a reduction in transaction costs—including transportation, handling and procurement—by eliminating complicated networks of producers, resources, retailers and warehouses, which ultimately lowers the associated costs and increases the profits. Therefore, the estimation focuses on the uptake of mandarin supply chains among small farmers. We divided various market-related stakeholders—mandarin buyers—into five different groups, and then further aggregation was made into two distinct groups, i.e., TSC and MSC. This paper’s specific objectives are: (1) to map the farmers’ participation in different supply chains, (2) to calculate the farmer’s profitability across supply chains, and (3) to determine the factors affecting farmers’ efficiency and inclusiveness in mandarin supply chains. The rest of the paper is organized as follows:
Section 2 outlines the theoretical framework of this study. In
Section 3, we describe the study area, the data and variables definition, the analytical framework of the study, and the empirical methods used in this study.
Section 4 describes the study’s results, followed by conclusions and policy implications.
2. Theoretical Framework of Farmers’ Participation in Supply Chains
The basic economic concept of the market structure represents the interaction of supply and demand agents anonymously, resulting in market equilibrium. For agricultural processors and exporters, derived demand is the main factor in buying decisions. Under the profit maximization principle, buyers set input price equal to the marginal product value, whereas sellers set product price to marginal cost. In an agricultural setting, the standard theory may not apply. Specialized product suppliers may be too thinly spread out to realize economies of scale for the buyers. Tight quality requirements, particularly for export products, may be ineffectively standardized; there may be asymmetric information and access to production technology for export quality and quantity targets which might be a disadvantage for smallholder farmers [
24].
The upfront vertical integration of smallholders into MSC could tackle these problems with land consolidation under the buyer’s ownership. However, this is not a solution. First, in Pakistan, land reforms restrict the agricultural farm size to a certain level. The land tenants transfer the land rights, disallowing the accumulation of land to larger farmers. Second, vertical integration may not address procurement issues [
25]. In this situation, the MSC offers acceptance for both buyers and suppliers of agricultural products. Farmers seek benefits because they get paid without delay and are provided with technical assistance and advice in their time of need. In some cases, MSC have contractual arrangements with the farmers, offering to buy the expected output using specified input and technology and sell products back to them. Third, some risks are associated with the MSC; some MSC prefer contracts with a farmers’ group rather than individual farmers. It was also seen that MSC operates only in good security areas, and infrastructure facilities are better, avoiding remote areas. Evidence from the Madagascar vegetable supply chain indicates that when quality and quantity standards were imposed at the farm level, inspectors and technicians that provided training and closely monitored MSC could work well.
In developing countries, the size of the farm is a particular policy instrument because smallholder farmers are less likely to be included in MSC. There is no consensus on the direction and effect of farm size on farmers’ participation in the supply chains; [
26] concluded in a multi-country case study that if the public and private sectors can provide all the necessary facilities to the smallholders—including research, extension, land tenure security, finance, and market infrastructure—a vibrant smallholder sector will eventually emerge to dominate the agribusiness industry, and therefore, can promote inclusive rural development.
To date, several determinants of farmers’ participation and farm efficiency have been explored that vary from farmer to farmer, such as farm (resource-endowments), farmer (demographic), geographic, and institutional factors. Endowments are the farmer’s household condition regarding resources such as farm size, other income sources, orchard size, wealth, etc. Locality and the distance from farm to market are the main geographic characteristics, representing physical accessibility and transportation cost. Demographic characteristics involved human and social capital variables: education, age, experience, family size, and gender. The rationale for promoting the farmers’ participation in the MSC rests on the argument that smallholders’ inclusiveness in these high-value MSC can improve their income and help alleviate rural poverty. Therefore, from a policy perspective, it is imperative to explore the economic implications of the farmers’ choice of supply chain participation in developing countries. Given these, it might help draw useful interventions to promote inclusive and integrated MSC where rural communities are equal recipients of welfare gains and economic stimuli. On the other hand, it could help transform existing sales channels into more efficient inclusiveness and economic efficiency where the improved scale would ultimately leap export earnings for the country.
This study evaluates the economic effects of supply chain participation to place this analysis of farmers’ dynamics. The paper builds on the premise that production scale is the principal differentiator of a farmer’s choice of supply chain participation—farmers with abundant resources are more likely to engage with MSC. In contrast, small and poor farmers continue to sell their produce in traditional or informal channels. Second, farmers linked with the MSC earn better profits than those linked with informal channels or TSC. Prior literature showed that a smallholder’s inclusiveness in the supply chain is affected by several characteristics classified as farm, farmer, geographic and institutional factors [
9,
27].
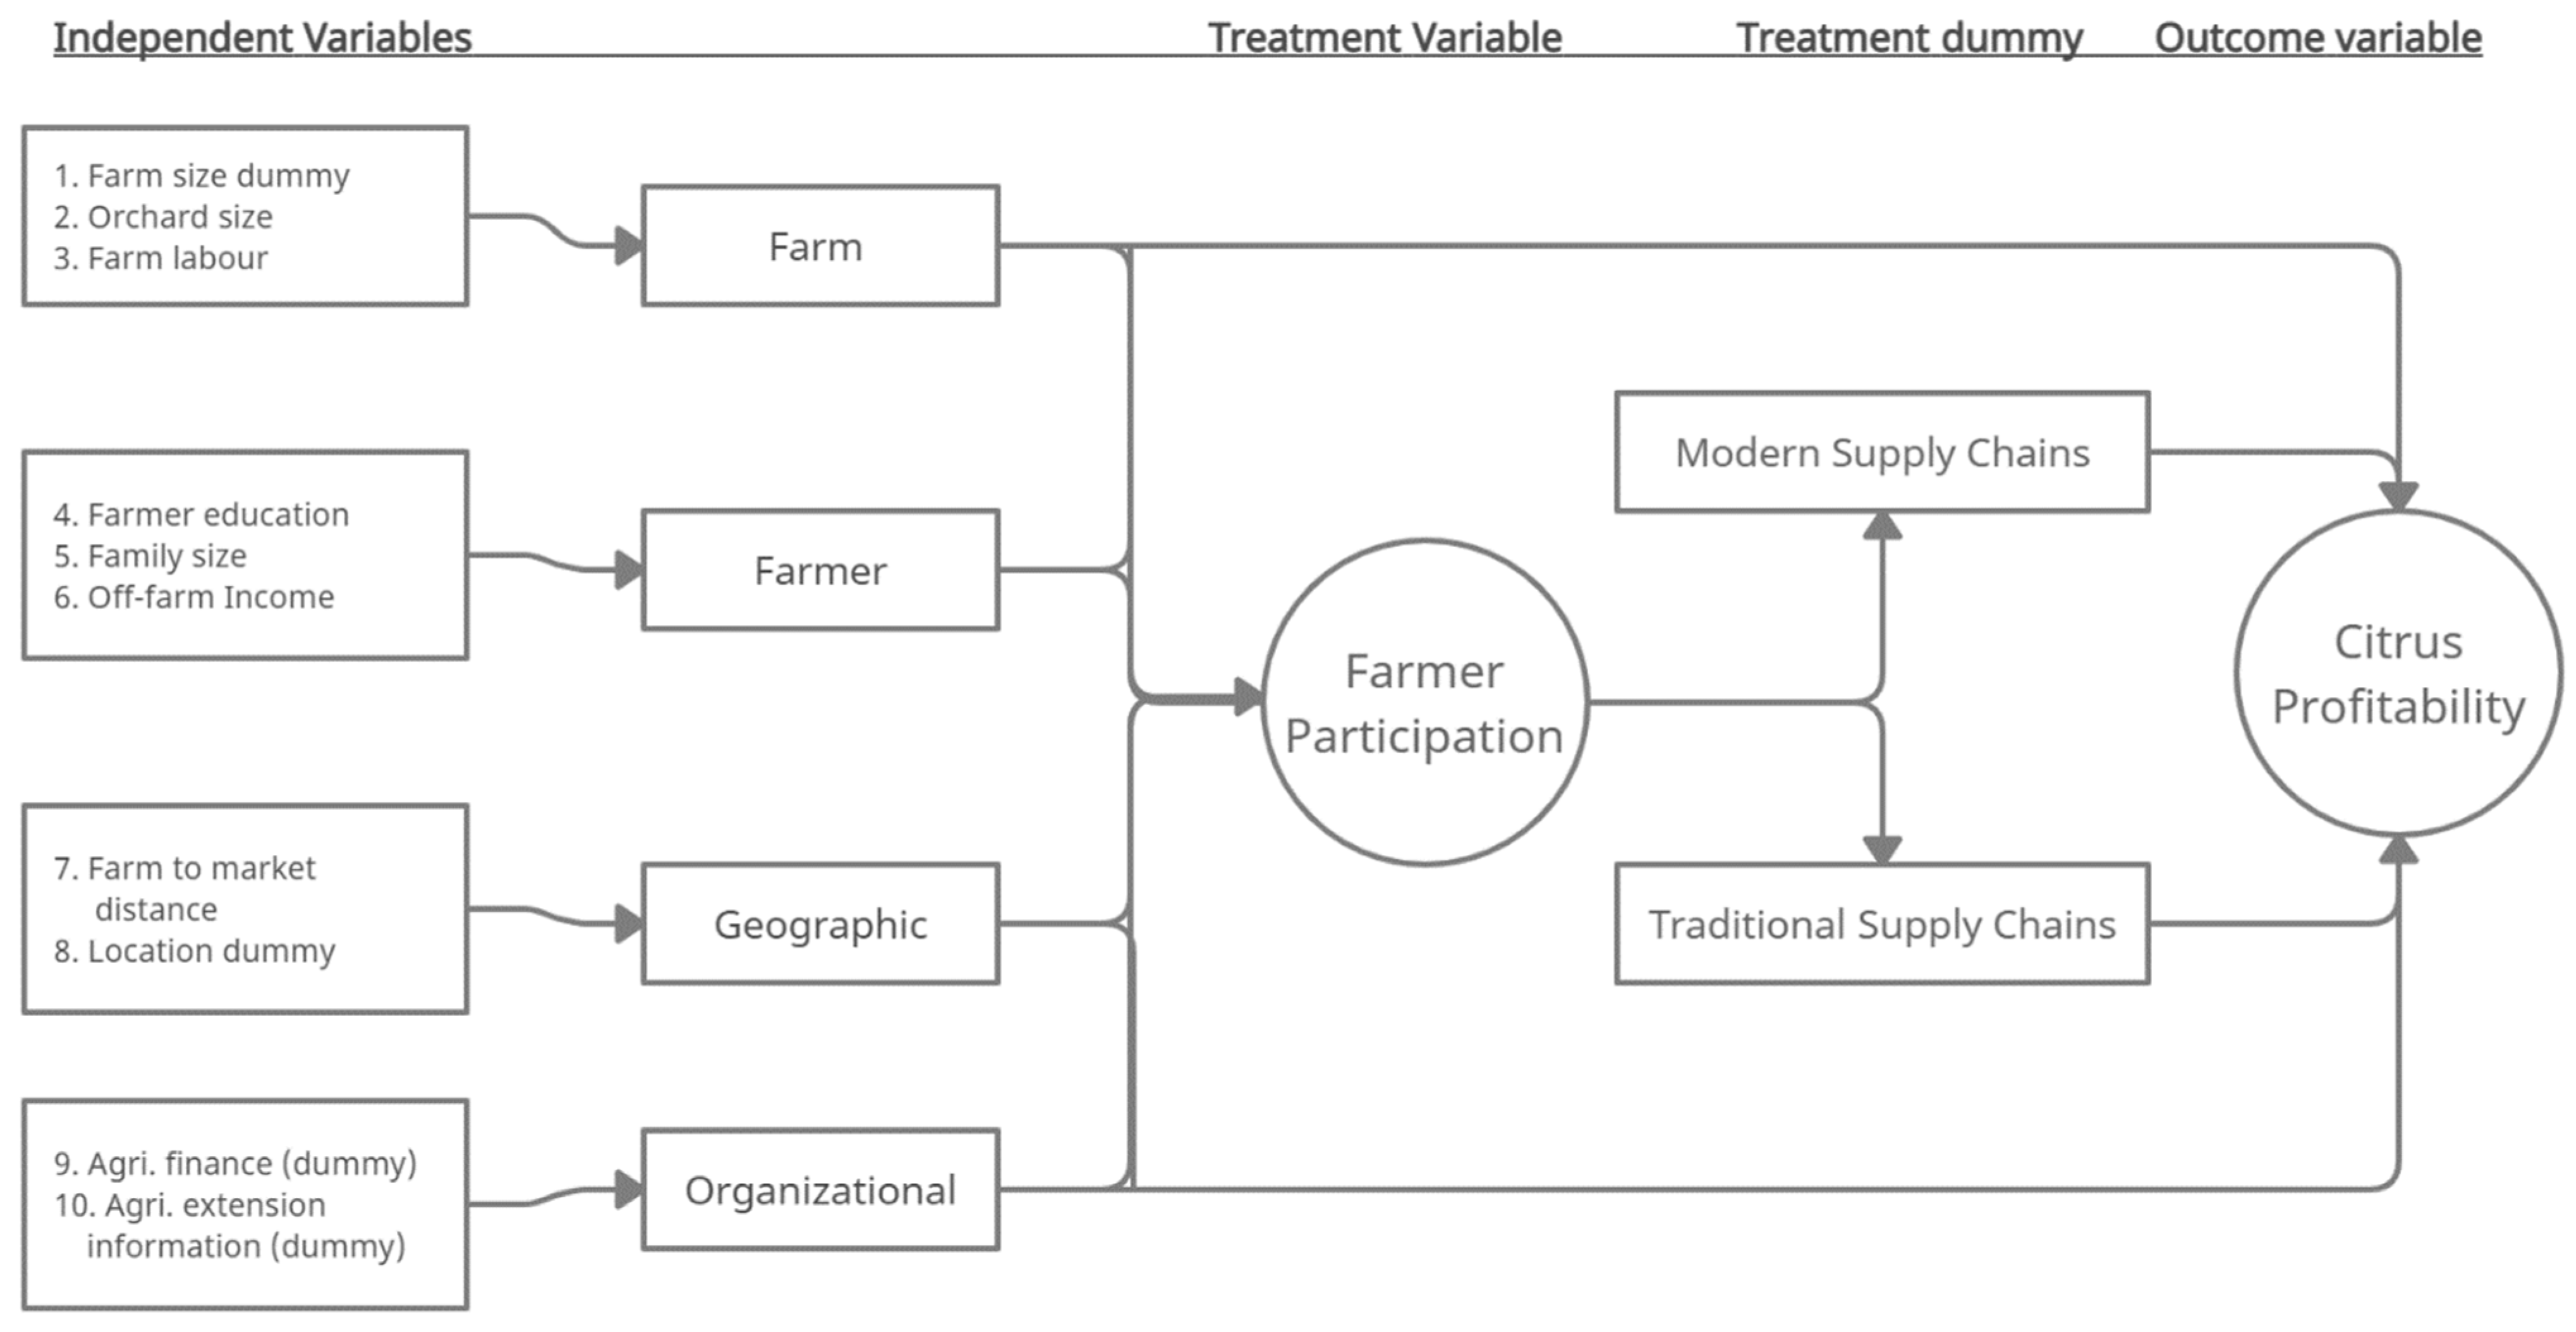
Figure 1 presents a conceptual framework for carefully identifying the farmer’s inclusiveness in the agri-food supply chain affecting farm profitability. Farmers’ participation (inclusiveness) is used as the treatment variable that affects the farm profitability and a list of other factors related to the farm, farmer, geography and institutions. It allows a more holistic analysis of farmers and their selected supply chains to better understand the underlying factors and identify the potential to change the behavior of farmers and the relevant stakeholders to better match the requirements for successfully participating in competitive agri-food supply chains in Punjab, Pakistan.
4. Results and Discussions
4.1. Descriptive Statistics
Table 1 illustrates the descriptive statistics and the distribution of respondents by farm size and the average mandarin and mandarin orchard size by these farm size categories. Many farms (38%) are categorized as medium farmers with an average of 7.17 ha of agricultural land, out of which 4.85 ha is dedicated to the mandarin orchard, and only 0.82 ha is under other citrus fruits. On the other hand, 30% of farmers have agricultural land greater than 10 ha, averaging 13.45 ha. The average mandarin orchard is 10.05 ha, with 8.32 ha dedicated to mandarin growing and 1.73 ha allocated to other citrus fruits. In the study sample, 32% of respondents are small farmers having agricultural land less than 5 ha, 38% are medium with 5 to 10 ha of agricultural land, and 30% are large farmers with greater than 10 ha of agricultural land. It is evident from
Table 1 that mandarin orchard size is positively correlated with agricultural land size. The share of other citrus fruit varieties is negligible compared with the mandarin: that is the main reason for choosing the mandarin variety in the mandarin family for this study. It was also discussed earlier in
Section 1 that in Pakistan, more than 90% of the production is devoted to mandarin in the total cultivated mandarin orchards [
8]. Thus, studying mandarin in the given case, therefore, can help formulate coherent insights for policy and practice.
4.2. Likelihood to Participate in Various Supply Chains
The mandarin farmers have many choices for selling their products through different supply chains. We categorized all of the stakeholders involved into five main channels starting from (1) direct sales (some farmers sell their produce directly to the consumers, retailers, or village vendors), (2) local middlemen/’beopari’, (3) fruits and vegetable market, (4) contractors and the (5) processors. These five main channels were further aggregated into two broad categories: TSC and MSC. The supply chain that leads to exports is termed MSC [
3,
4,
9], and the other local supply chains which cannot push the product to the export level are referred to as TSC [
9]. It is evident from
Table 2 that a very small proportion of the farmers are associated with channel 1 (retailers, village vendors, consumers), and mostly the small and medium farmers in the villages were engaged with channel 1. It is also found that no mandarin grower has an orchard greater than 10 ha engaged with channel 1. Most farmers (more than 50%) sell their mandarin produce to channel 4 (contractors); hence most of the mandarin fruit passes through this chain. These results are in line with [
43] and [
44], who also noted that contractors play a leading role in procuring mandarin, and this is the largest (used) marketing channel in the case of mandarin and mandarin fruit in Pakistan. This is because, in Pakistan, many farmers sell the produce to pre-mature contractors that have established links with the big city markets and exporters, and in some cases, they have their own processing units nearby.
Further results found that channel 3 (fruit and vegetable markets), and channel 2 (local middlemen called “beopari” in the local language) represent about 20% (by each chain) of the total mandarin produce marketed through these marketing channels. The last category is the processors with which only 4.33% of farmers are directly associated. This may be due to the absence of a mandarin processing industry in that rural area; therefore, farmers have no option to choose the other available marketing chain. This indicates that the absence of advanced processing units might be one factor that induces smallholder reliance on contractors and middlemen in Punjab, Pakistan. Hence, establishing modern processing units can play a greater role in helping transform mandarin value chains in Pakistan and fostering smallholder farm income and better export earnings from processed foods for the country.
4.3. Mandrin Farmers’ Participation in TSC versus MSC
The study aggregated the different supply chains (five marketing channels) into TSC and MSC for a clear understanding. The first three supply chains in
Table 2—direct selling, vendors and local middleman—are categorized as the TSC, whereas the last two categories (i.e., processors and contractors) are listed as the MSC. This categorization was conducted by considering the potential for value-addition in mandarin and linking it with exports. As in the first three chains (1, 2 and 3), there are fewer exports and value addition. On the other hand, the last two supply chains (4 and 5) in
Table 3 are categorized as the MSC because of the value-addition and export perspective. Hence,
Table 3 compares the percentage and frequency distribution of mandarin farmers associated with the modern and traditional supply chains. Results showed that most farmers (58.67%) in each farm size category are associated with the MSC, and about 41.33% of farmers are associated with the TSC. It indicates that both—orchard and farm size—are associated with MSC. There might be several reasons why significant numbers of mandarin farmers still engage in TSCs. Amongst others, smallholders’ access and linkages to TSCs might be the major constraint limiting their access to MSC. By looking at the orchard size, findings indicate that more (68%) farmers are selling to MSC. It implies that mandarin quantity is highly associated with MSC, where large-scale producers seek price incentives by selling to MSC. However, a significant portion of small farmers (61%) sell to MSC. It implies that there can be greater integration of smallholder farmers into MSC if targeted incentives effectively address the snags confronting farmers’ broader access to MSC in Pakistan. Thus, the scalable integration of small farmers into MSC can be achieved irrespective of size and scale. This transformation could boost income and employment in the local areas and lead to a leap in the social status of the rural communities.
4.4. Farmer’s Participation in TSCs and MSC
The agri-food supply chains in Pakistan are very diverse, starting with mandarin farmers. Like other fruits, the mandarin fruit supply chain is primarily controlled by the private sector. However, the government is facilitative by providing basic infrastructure and a regulatory environment for easy business transactions and ensuring competitive markets [
43]. It is generally observed that marketing intermediaries exploit agri-food producers by charging a high marketing margin on their investments and offering lower prices to farmers [
45]. Mandarin supply chains start with the grower who produces fruits and later involve different stakeholders with the dominant position held by the pre-harvest contractor.
During the survey, it was found that 41.3% of the farmers were associated with the traditional supply chains having a benefit-cost ratio value of 1.60. The end-user of the mandarin in the traditional supply chain is the local consumer of fresh mandarin fruit. Traditional supply chains included the farmer’s association with the local retailers or consumers, middlemen or local beopari, and fruit and vegetable markets. Hence, by associating with TSC, farmers used classical channels, which usually exploit them and offer lower prices for their produce.
In our case, it was seen that some farmers directly sell mandarin fruits to the processing industry and nearby orange factories, and most of the farmers are associated with contractors who have links with the exporters, traders, or processors. The survey results show that about 58% of farmers were associated with the modern supply chains of mandarin, having a good benefit-cost ratio of about 1.99. So, farmers’ inclusion in the modern supply chain compared with the traditional supply chain is beneficial both to increase their income with higher profits and for developing the mandarin industry exports and other value-added products. Passing from the other supply chain actors, the end-user of this supply chain is either the local or foreign consumers of the fresh fruit and value-added product made from the mandarin. It indicates that the broader integration of mandarin farmers into MSC holds sufficient potential for developing the mandarin industry, where farmers might seek huge with higher profit margins.
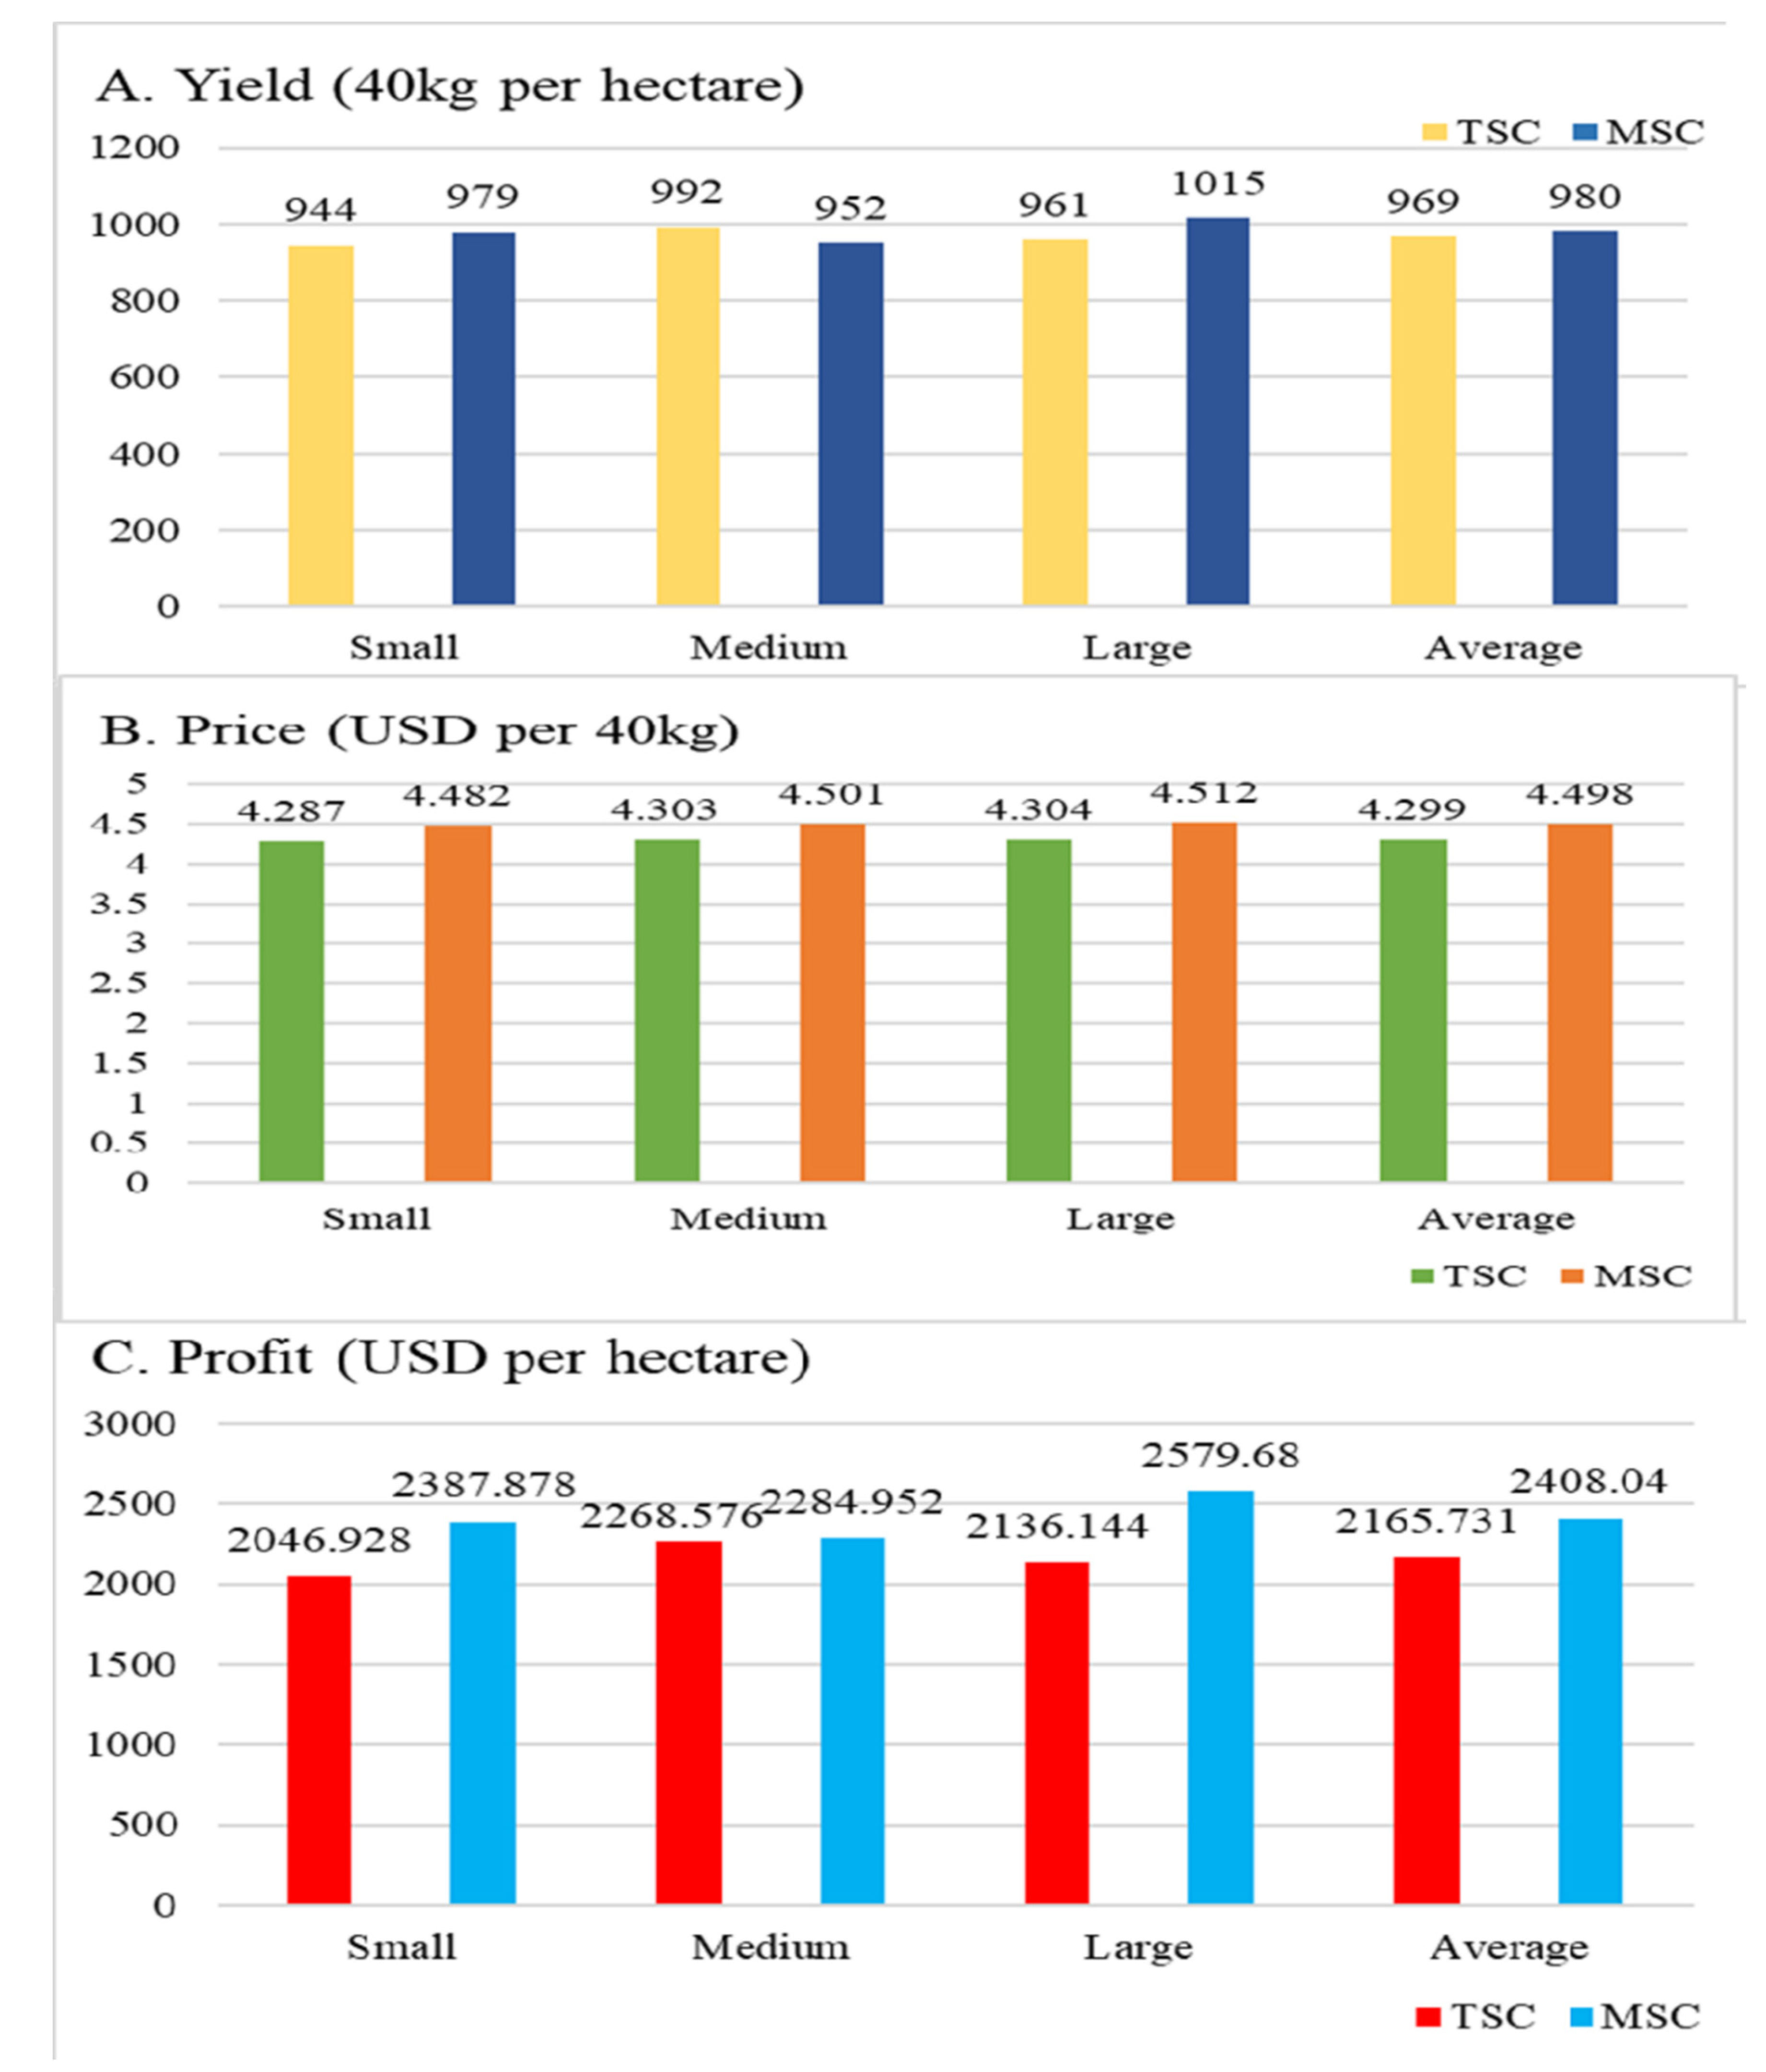
4.5. Farmers’ Profitability across Different Supply Chains
In a production frontier representing a supply chain, crop output and profit are the key indicators of supply chain efficiency. Put simply, the output indicates partial productivity and profit represents marketing efficicncy [
19].
Figure 3 compares the indicators related to MSC versus TSCs participation with varying degrees of farm size. Further, the profit and margins were computed by the difference between per unit mandarin production and per unit cost of production.
The results show that the farmers associated with MSC produced 36,554 kg per ha of mandarin, whereas it shows 36,144 kg per ha for TCS. It is also evident from
Figure 3 that the difference in mandarin yield across different farm size categories is higher in the case of large farmers in MSC and medium farmers exhibit higher yield in the case of TSCs. On a broader perspective, this change in average yield across farm size described the production scale, i.e., large farmers with more resource endowments tend to obtain more yields. These results align with prior literature [
46]. However, some other supply chain studies suggested that output is an indicator of production scale; perhaps a variance across management practices tends to produce this difference [
16].
The difference in mandarin prices across the farm size and various chains is represented in
Figure 3. Across the farm categories and TSCs and MSC, the farmer receives 4.299 USD, and 4.308 USD per kg, respectively. However, large farmers in MSC received higher prices within the categories than medium and small farmers. A possible justification is the larger size of marketed output attracted processors during the auction process because, in Pakistan, every farm’s product is placed differently to display to the buyers during the auction process. Hence, processors and exporters prefer buying a bigger volume from a single seller to avoid paying more market fees in case of buying small quantities from many farmers. Interestingly, it implies that farm size positively relates to prices and complements the theory of lesser market intermediaries with lesser marketing margins [
47,
48,
49]. Overall, the results exhibit a little variation in the margin earned from mandarin—ranging from 4.287 to 4.321 USD per 40 kg—which, therefore, is an indicator of the competitiveness of the mandarin market. Hence, these findings comply with the microeconomic theory of pure competition [
50], implying that large farmers have more resource endowments, allowing easy resource mobility, perfect information and broader market integration. Thus, MSC participants have a greater propensity to receive higher prices where a larger number of buyers and sellers ensure fair price treatment. The final portion of
Figure 3 shows the margins across supply chains computed during the survey. It reinforces that both processors and contractors gain more profit margins (MSC participants), and thereby large farmers in MSC also receive higher profit margins. In TSCs, both large and medium received higher profit margins as they were directly sold to retailers or assemblers. Moreover, it highlights that as the output size increases, farmers gain more profit margins in TSCs.
4.6. Mandarin Farmers’ Efficiency and Inclusiveness across Supply Chains
We used the endogenous treatment effect model to examine the determinants of supply chain participation and mandarin profit. In
Table 4, the second column is the selection equation, and the third column is the outcome equation which shows the estimate of farmers’ participation equation and the profit equation. The coefficient of participation in the MSC in the outcome equation is significant and positive. This means the farmers who participate in the MSC earn more profit than those who participate in the TSC. These results are consistent with our previous results (see
Figure 3), where farmers who participated in the processor and contractor category earned more profit than the other three traditional categories. Since mandarin is a highly perishable commodity, one of the possible reasons behind higher profit is that MSC has advanced logistics, transport and storage facilities, which reduces the perishability-related problems. Hence, in terms of large commodity buying power, MSC are more competitive than TSCs and thus offer better prices to farmers.
Among the other explanatory variables, small and large farms, and market distance are negatively related to supply chain participation and mandarin profit. Likewise, farmers’ education, training participation, mandarin area, farm logistics, new entry farmers (those farmers who just entered the mandarin business during the last three years), farming as the main occupation, and credit access were found to have a statistically significant impact on the participation in the MSC and produce more profit.
The study noted that the level of education positively influenced participation in the MSC, which means higher education levels help farmers to adjust to the new market requirements and make farmers more likely to adopt MSC. These findings are consistent with prior studies indicating that education plays a profound role in farmers’ participation in advanced technology and remote markets [
11,
51,
52]. It implies that educated farmers are more inclined toward MSC and prefer their market engagements with more advanced stakeholders. Regarding the coefficient of farm size dummies, both small and medium farm size has a significant negative impact on the section and outcome equation (except for medium farmers in the selection equation), which means that large farmers are more likely to participate in the MSC. This implies that the current state of infrastructure in the study areas prevents the smallholders’ modernization and MSC participation. These findings lend support [
16] complementing that smallholder farmers in Pakistan are resource-poor and largely rely on village-level and local stakeholders for their input-output engagements. Hence, apart from the large participation of large farmers in the MSC, current trade policy and macroeconomic tools appear less useful in improving smallholders’ wider commercialization and MSC participation.
The mandarin area has a significant positive effect in both equations, meaning that, with the increased mandarin area, the probability of participation in the MSC is higher. As discussed earlier, this represents farmers’ resource endowments; resource-rich farmers are more likely to participate in MSC and earn more profit, while resource-poor farmers are less likely to participate in the MSC and earn less profit. These findings are similar to prior studies suggesting that large farmers are freer to choose between market and input-output decisions [
16,
51]. Hence, improving smallholder farmers’ resource endowments might work as a useful gauge to improve their MSC participation.
Regarding the negative connection between farmers’ age and MSC participation, our findings suggest that older farmers are less likely to participate in MSC. A possible justification is younger farmers are more oriented toward technology and innovation and tend to focus on the commercialization of agriculture. This implies that younger farmers are more motivated to develop and build their mandarin businesses than older ones. These findings are in line with [
53] advocating that older farmers are less engaged in modern technology and advanced supply chains. The coefficient of the main occupation (farming) is also positive and significant, meaning farmers who have farming as their main occupation are more likely to participate in the MSC and earn more profit than the others. As information plays an important role in today’s world, it helps farmers explore new markets with better prices and other services. The study results also showed that the farmers who took agriculture advice are more likely to participate in MSC and have more profit. This implies that agriculture advisory participation help improves smallholder integration into MSC by improving input use efficiency. These findings are consistent with prior studies on smallholders’ market participation [
51,
52]. Hence, improving the provision of agriculture advisory might help realize the broader participation of smallholders in MSC and far-off markets. Agriculture credit access is a positive and significant connection between MSC participation and mandarin farmers’ profit. It reveals that the farmers who have taken agricultural credit are more likely to participate in the MSC and have more profits. Agriculture-related information and agricultural credit are important tools for farmers to better utilize their traditional practices, earn more profit, and explore new markets [
53,
54].
The results reveal that the value of lambda in the treatment effect model indicates the existence of a correlation between the error term in the selection equation; the outcome equation was found to be statistically significant. This indicates the existence of selection bias, which is why the study used the treatment effect model to estimate the profitability in which both selection and outcome equations were estimated simultaneously, as suggested by [
51,
55].
4.7. Supply Chain Participation, Mandarin Yield and Profit
As discussed previously, farmers’ participation in MSC compared with the TSC increases the productivity of mandarin producers. It is, therefore, necessary to empirically assess the impact of farmers’ participation on the productivity indicators such as yield and profit. For this purpose, as described in the methodology study, we used the propensity score matching technique in the presence of several independent variables. Results in
Table 5 showed a significant difference in the profit and yield in both matching algorithms (nearest neighbor and kernel-based) using the Average Treatment Effect. Farmers who participate in the MSC have more yield and more profit. These results support the arguments of Schipman and Qaim [
56], who concluded similar results in sweet pepper supply chains, where the participation of farmers in the MSC leads to higher income; [
16] also found that participation in the more developed and modern milk supply chain leads to high farm efficiency in terms of a better price, yield, and profit. Slamet [
51] found that small-scale farmer participation in the MSC generated higher per capita household income than the traditional channels in the horticultural supply chain. The results of this study are also consistent with similar literature on emerging MSC in developing countries [
55,
57,
58,
59]. Hence, farmers’ participation in MCSs increases their income through two means: (1) it improves per acre mandarin yield through improved input use, and (2) MSC offers better prices of mandarin—resulting in higher income and profit.
5. Conclusions, Implications and Way Forward
In developing countries, supply chain processes are inherently complex, where most small farmers face numerous dependencies for information, credit and marketing. Further, small farmers face several inbound and outbound network constraints, restraining their access and linkages with modern supply chains. These leave them connected with traditional supply chains where market margins are higher and farmers receive lower income. Recent debates suggest that a transformed value chain can work as a remedy to improve small farmers’ income in developing countries. To this end, this study compares the farmers’ efficiency and inclusiveness in modern and traditional supply chains across the farm size categories, i.e., small, medium, and large. The study is quite novel and provides various cues for practice and practice.
The findings of the study have several-fold implications. First, they indicate that the expansion of modern markets in the developing world and changes in the marketing system creates both opportunities and challenges for farmers to participate in modern supply chains. The modern supply chain can potentially increase income and profitability for small farmers. However, there are many challenges, particularly for small farmers, to become part of these modern supply chains. One of the biggest challenges for small farmers is the lack of resources, such as the small size of the orchards and access to credit and extension services. Based on these findings, modern supply chains could be inclusive to small farmers if they act more collectively. Hence, fostering incentives for collective action might be a plausible tool to enhance small farmers’ integration into the modern supply chain. Second, the findings highlight that information is integral in integrating small farmers into modern supply chains and improving their farm income. Put simply, providing up-to-date information through an already established public sector farm advisory service might be a phenomenal tool to break the information asymmetry and make it a public good. Third, the study results also showed that the farmers who took agriculture advice and received agriculture credit are more likely to participate in MSC and have more profit. For that purpose, aligning agriculture-related information and agricultural credit could be an important tool for farmers to better utilize their modern practices, earn more profit, and explore new markets. Lastly, the findings of this study complement the applicability of the theory of lesser market intermediary with lesser marketing margins and suggest that orchard size is a limiting factor when integrating small farmers into the modern supply chain. Further, from a key stakeholder perspective, the processing and export industries can play a vital role in organizing small farmers in a sizeable cluster(s) where they could achieve the desired economy of scale and, therefore, improve their participation and profitability.
The study shows scope for future research. First, this study includes mandarin farmers engaged in TSCs and MSC in Punjab, Pakistan, which provides a sound basis for investigations. However, further studies can compare small farmers’ inclusiveness based on various agricultural incentives, i.e., agriculture subsidies, farm-based training, and export promotion privileges. Second, the role of the farmers’ entrepreneurial skills is missing in this work. Future studies can, therefore, study entrepreneurial skills while assessing participation in MSC.


