
Quality Assessment of Dried White Mulberry (Morus alba L.) Using Machine Vision


Abstract
:1. Introduction
2. Materials and Methods
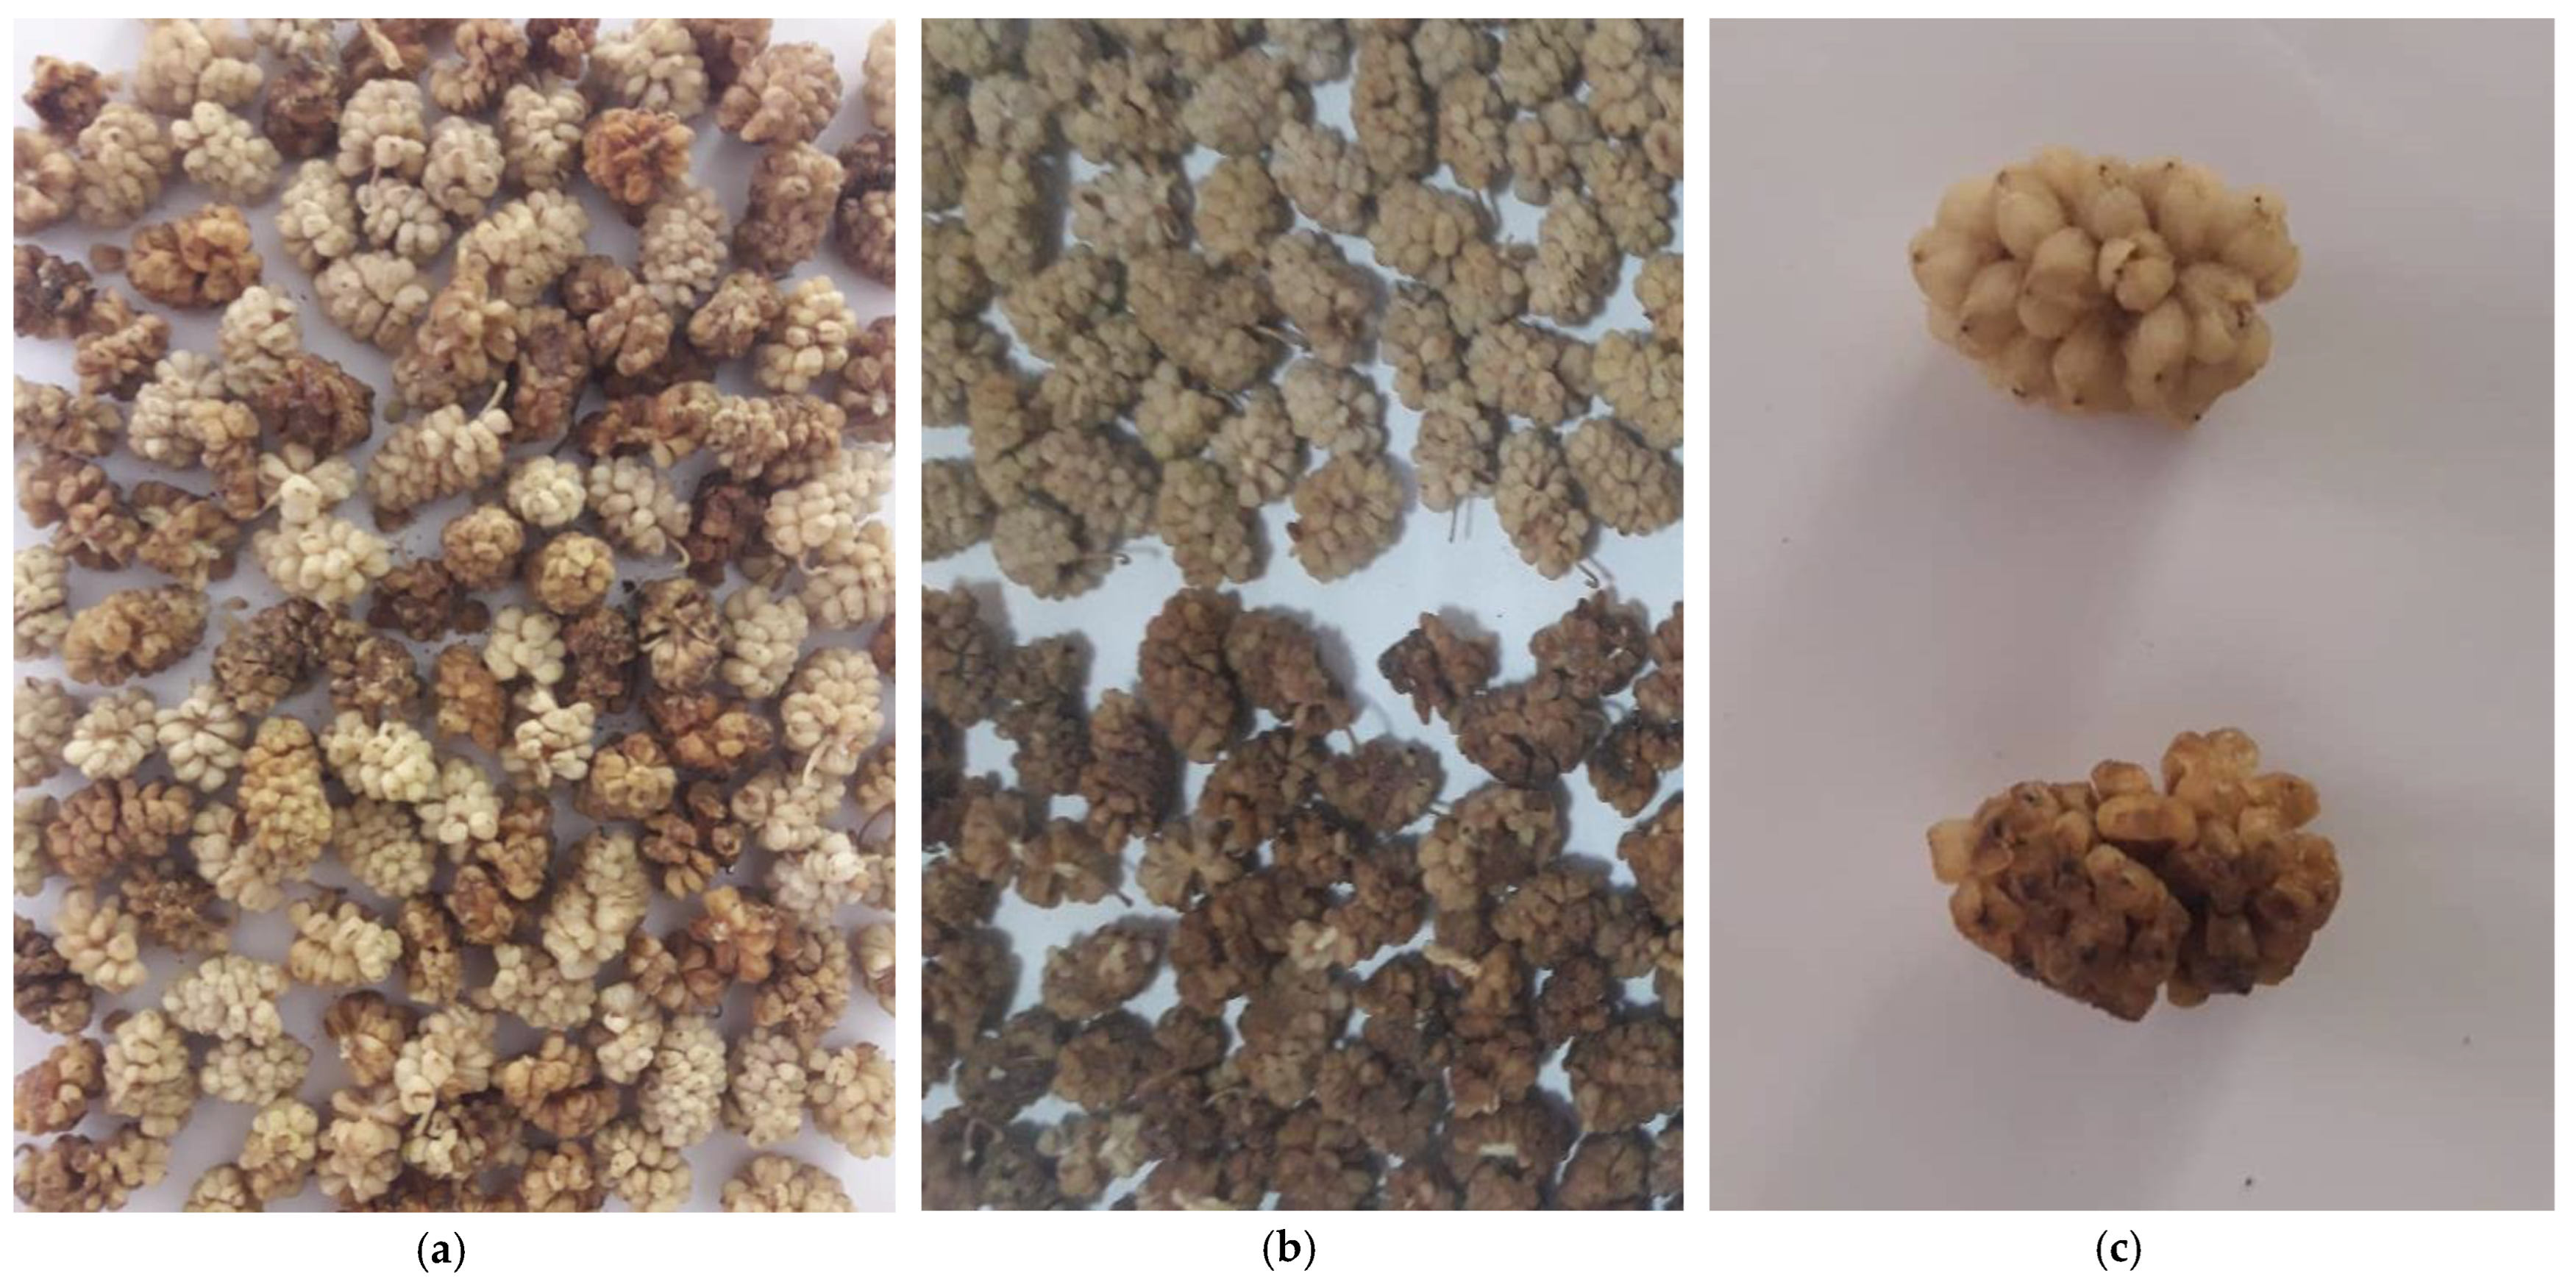
2.1. Samples
2.2. Image Acquisition
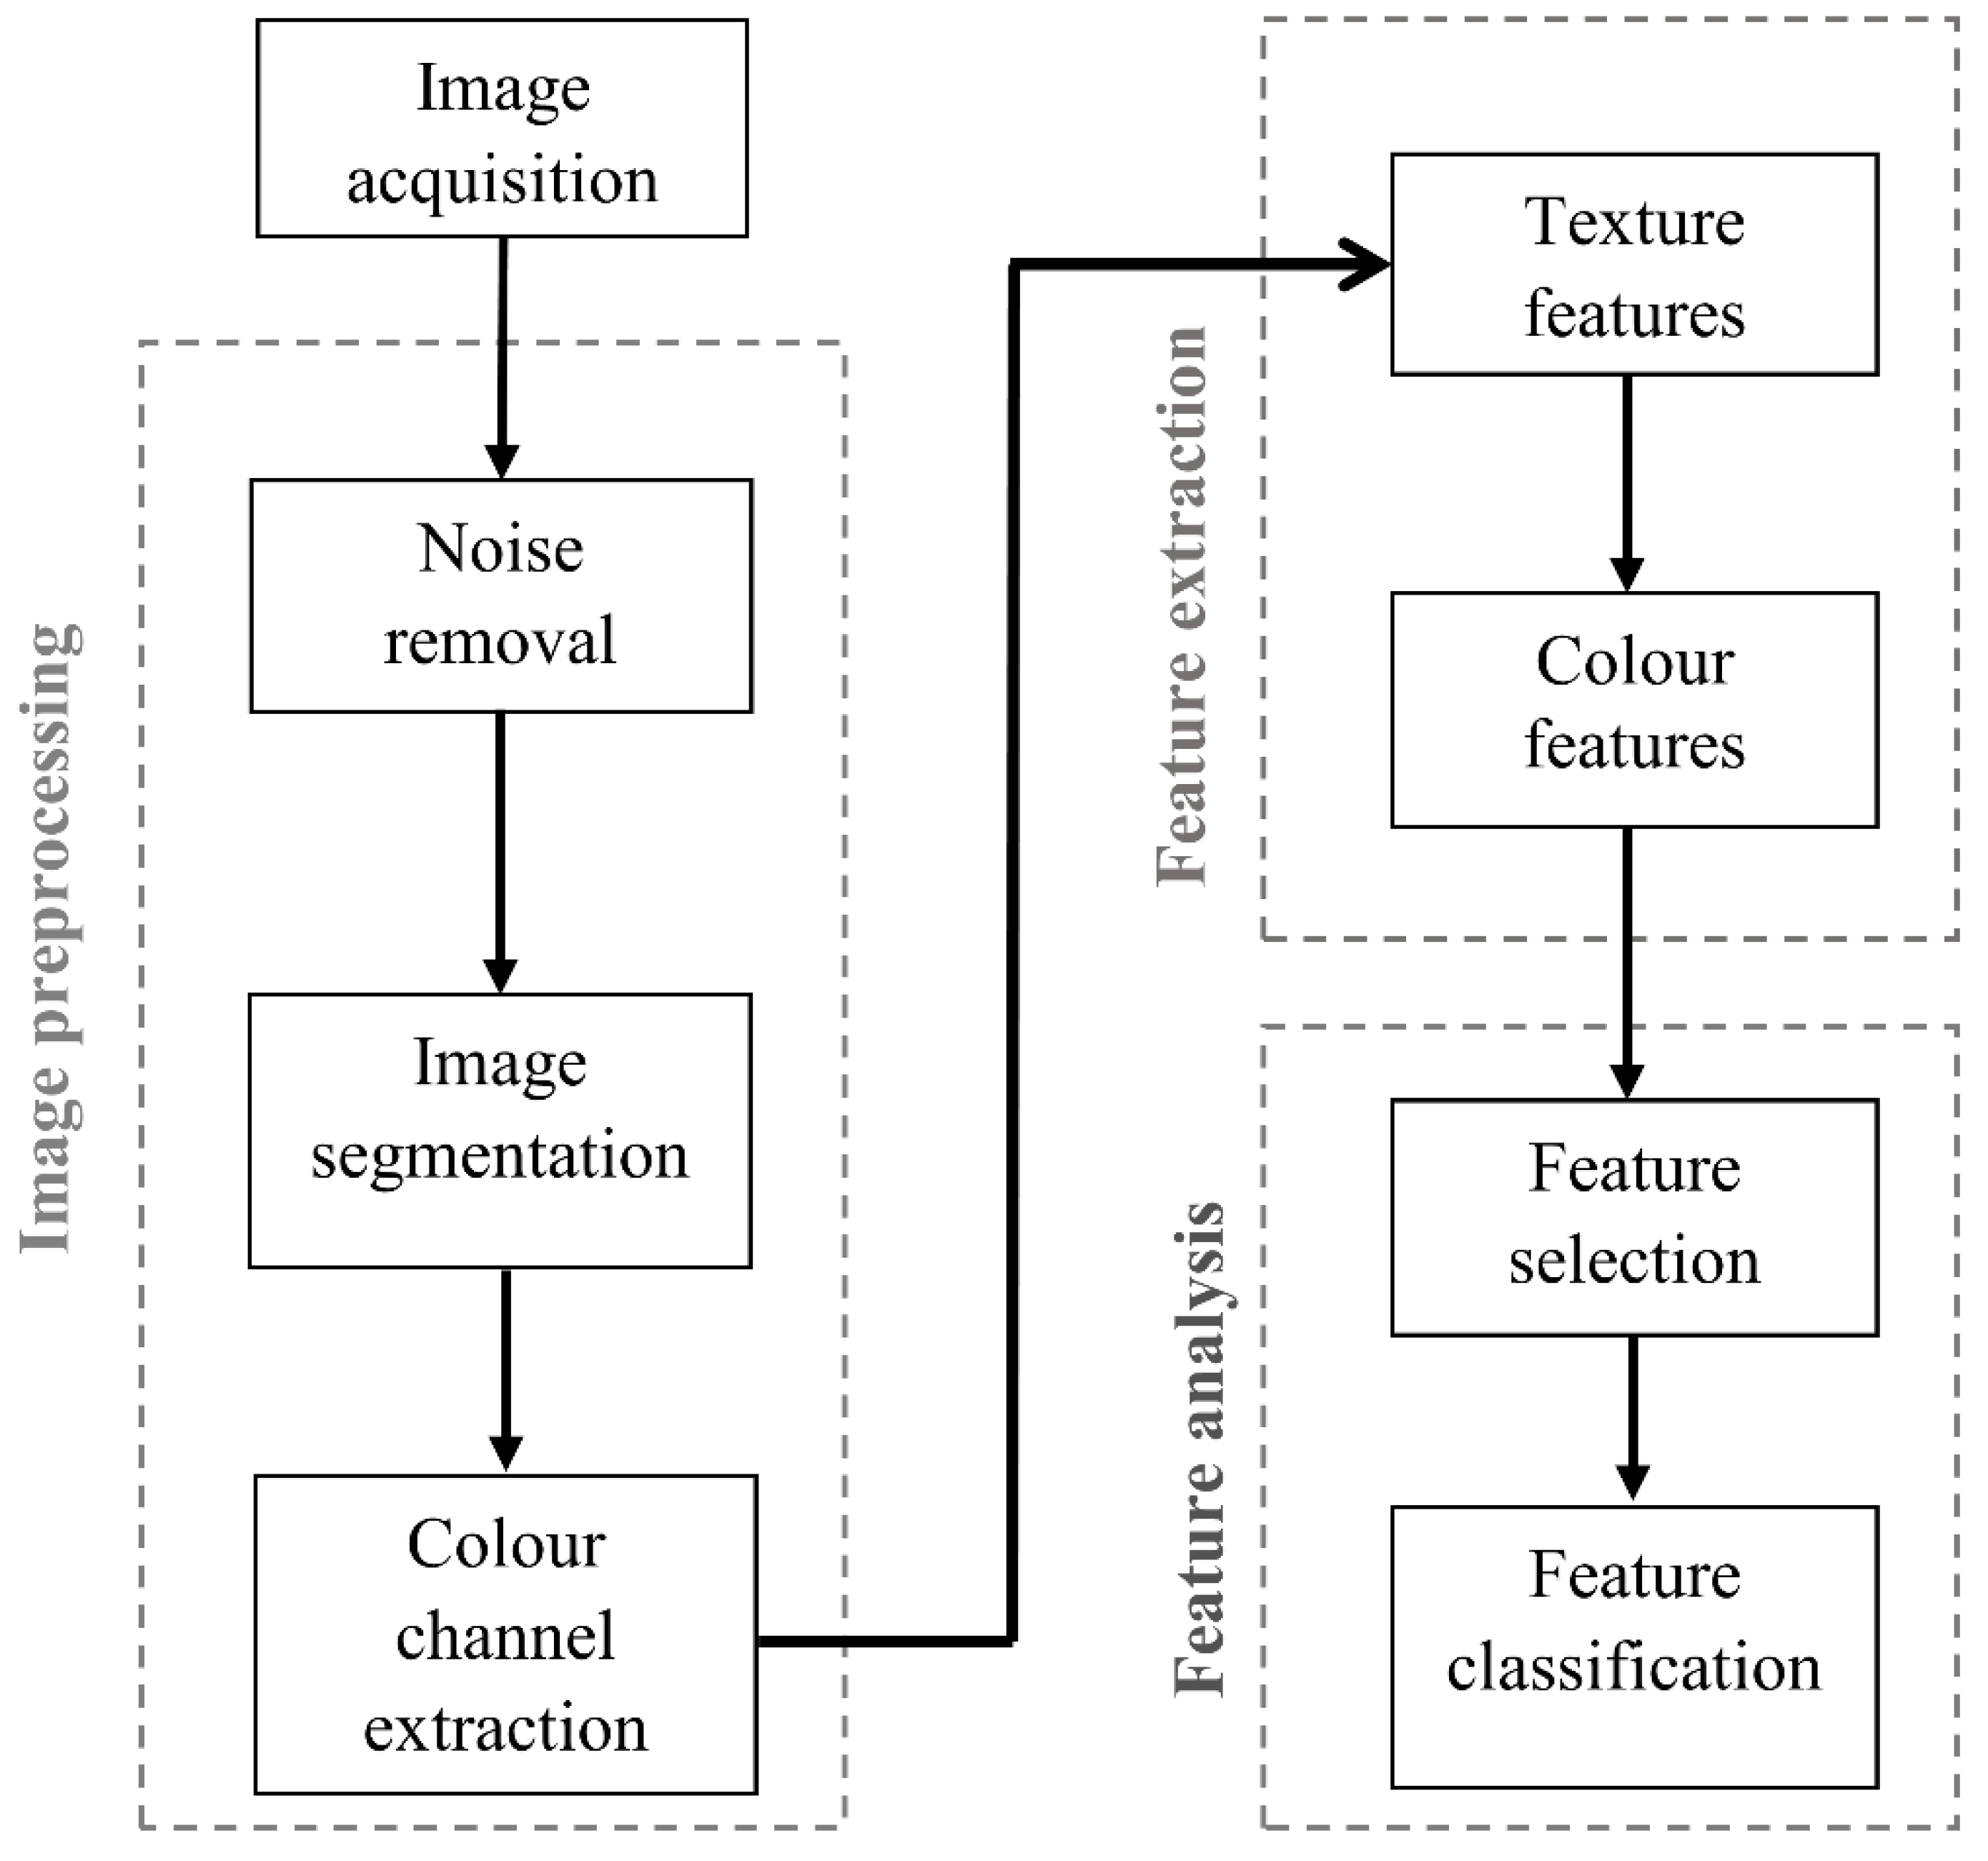
2.3. Image Processing
2.3.1. Image Preprocessing
2.3.2. Feature Extraction
2.3.3. Feature Analysis
2.3.3.1. Feature Selection
2.3.3.2. Feature Classification
3. Results
3.1. Feature Set Optimization
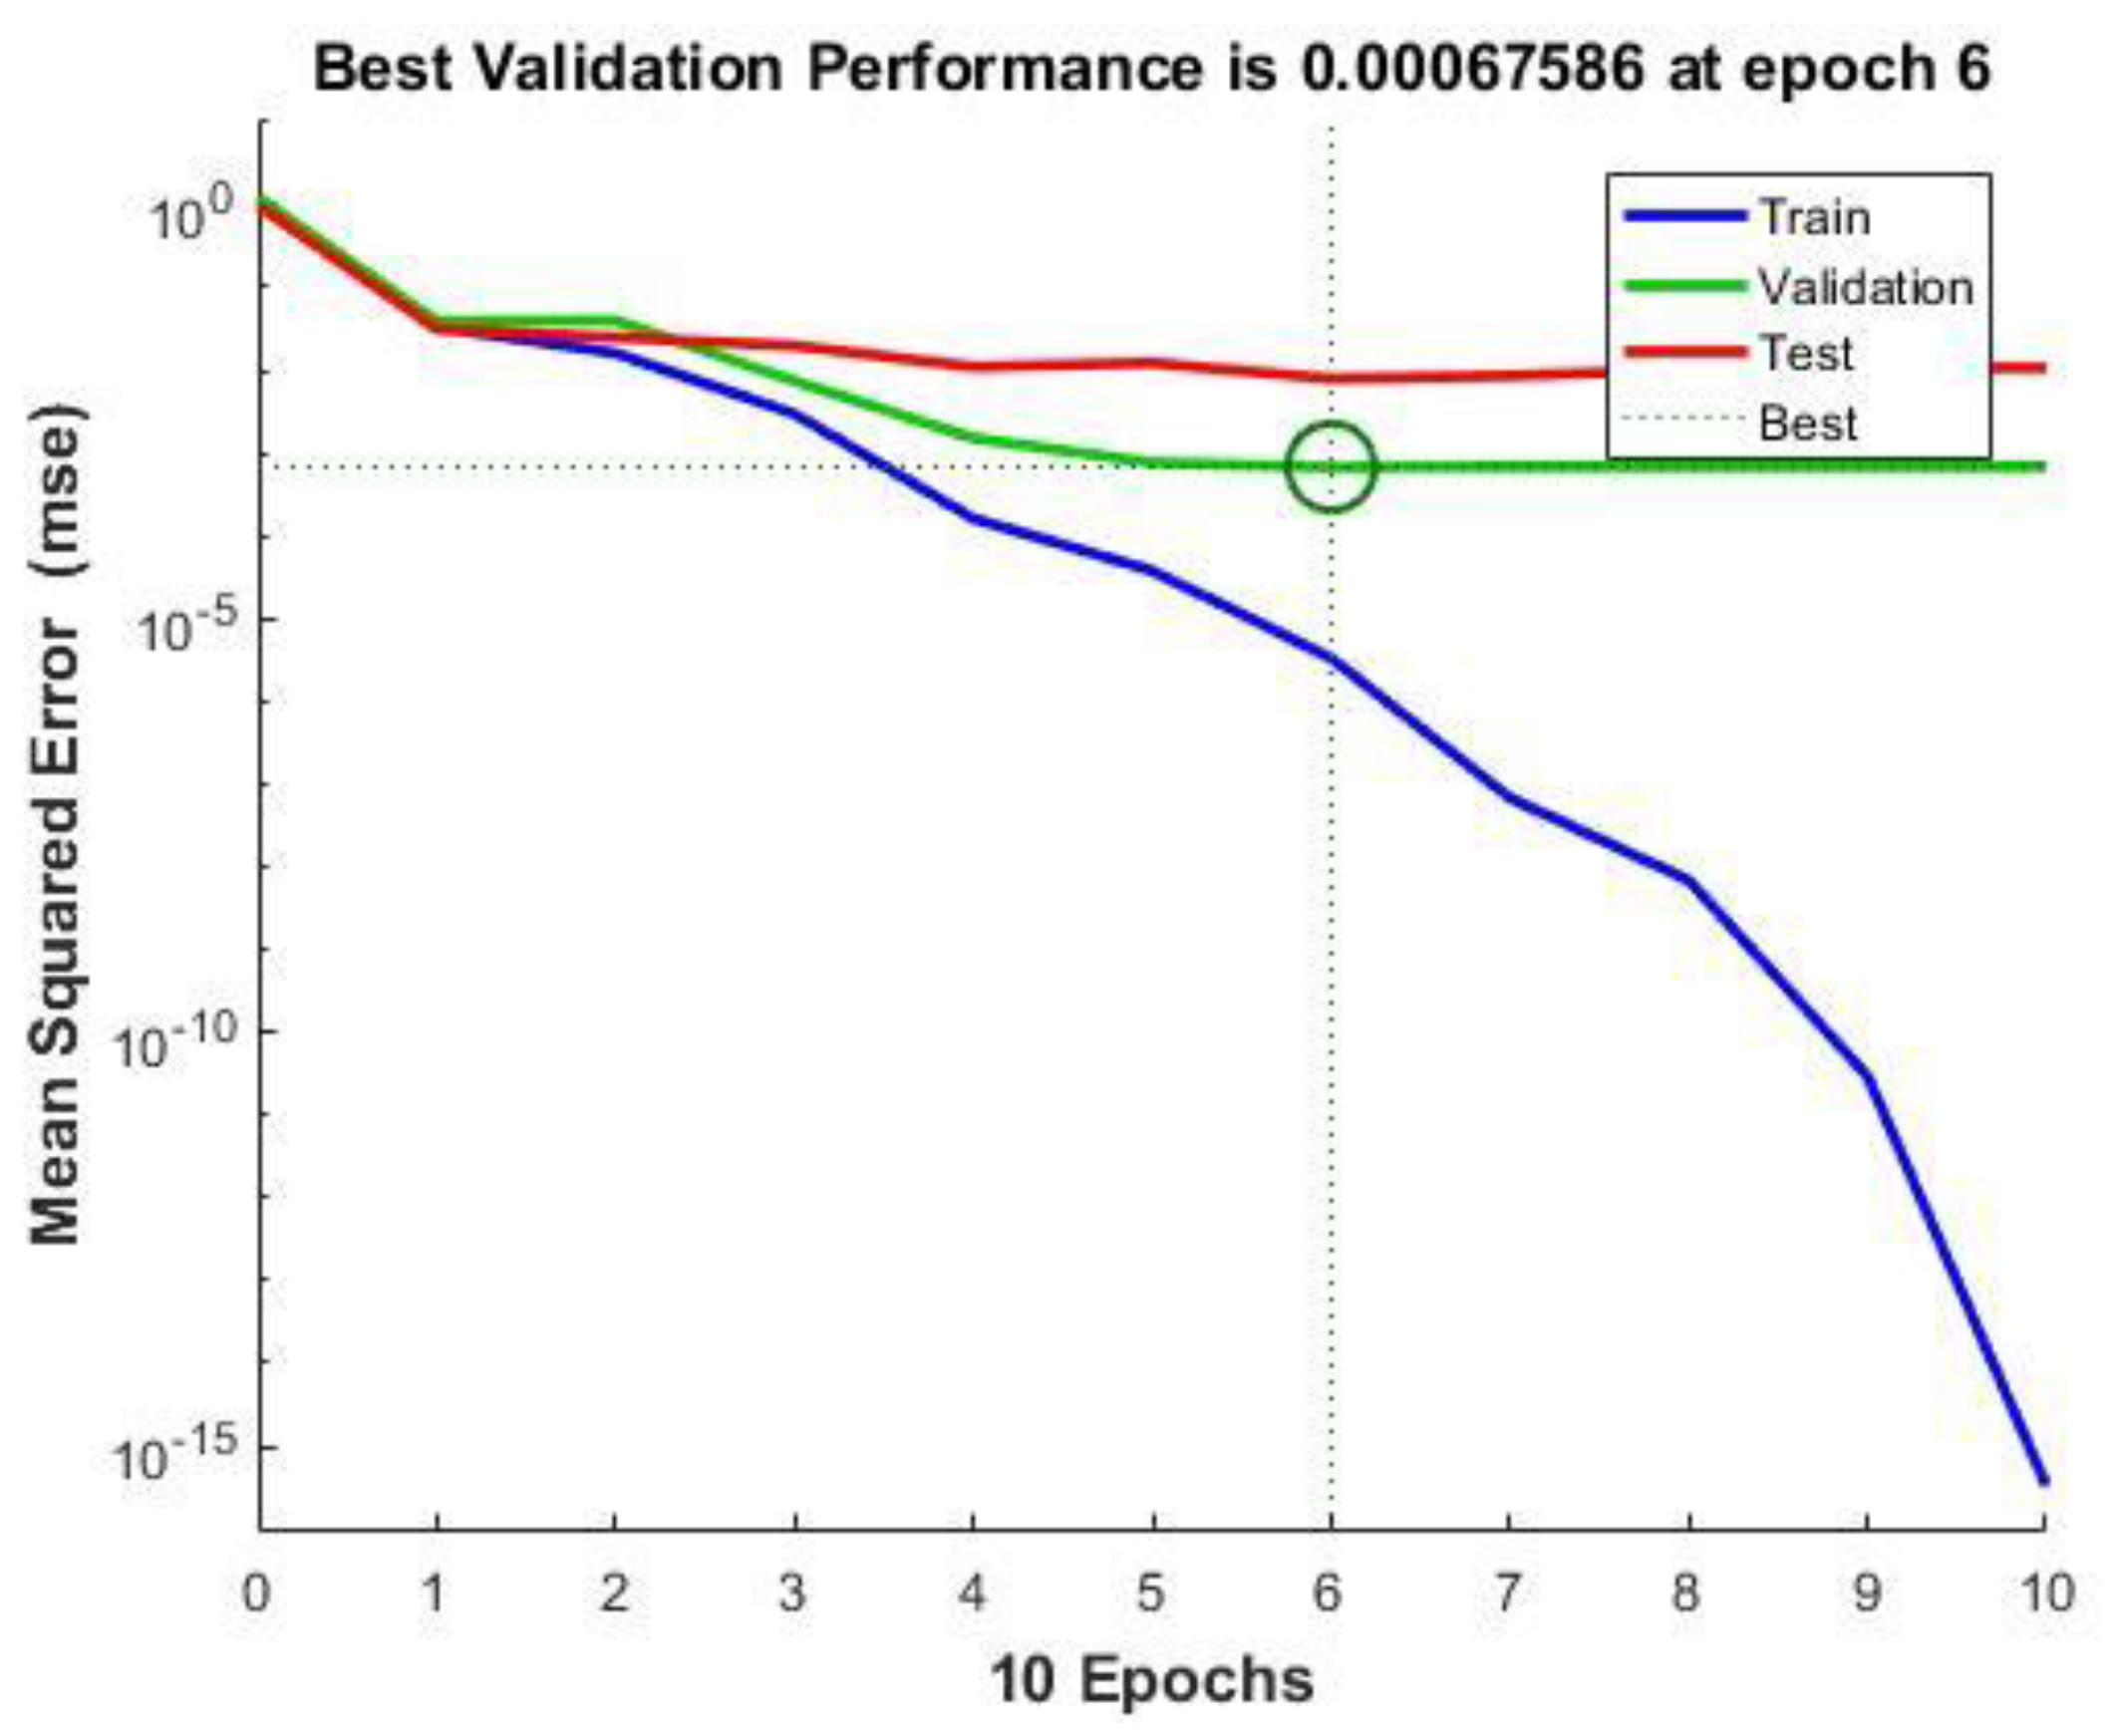
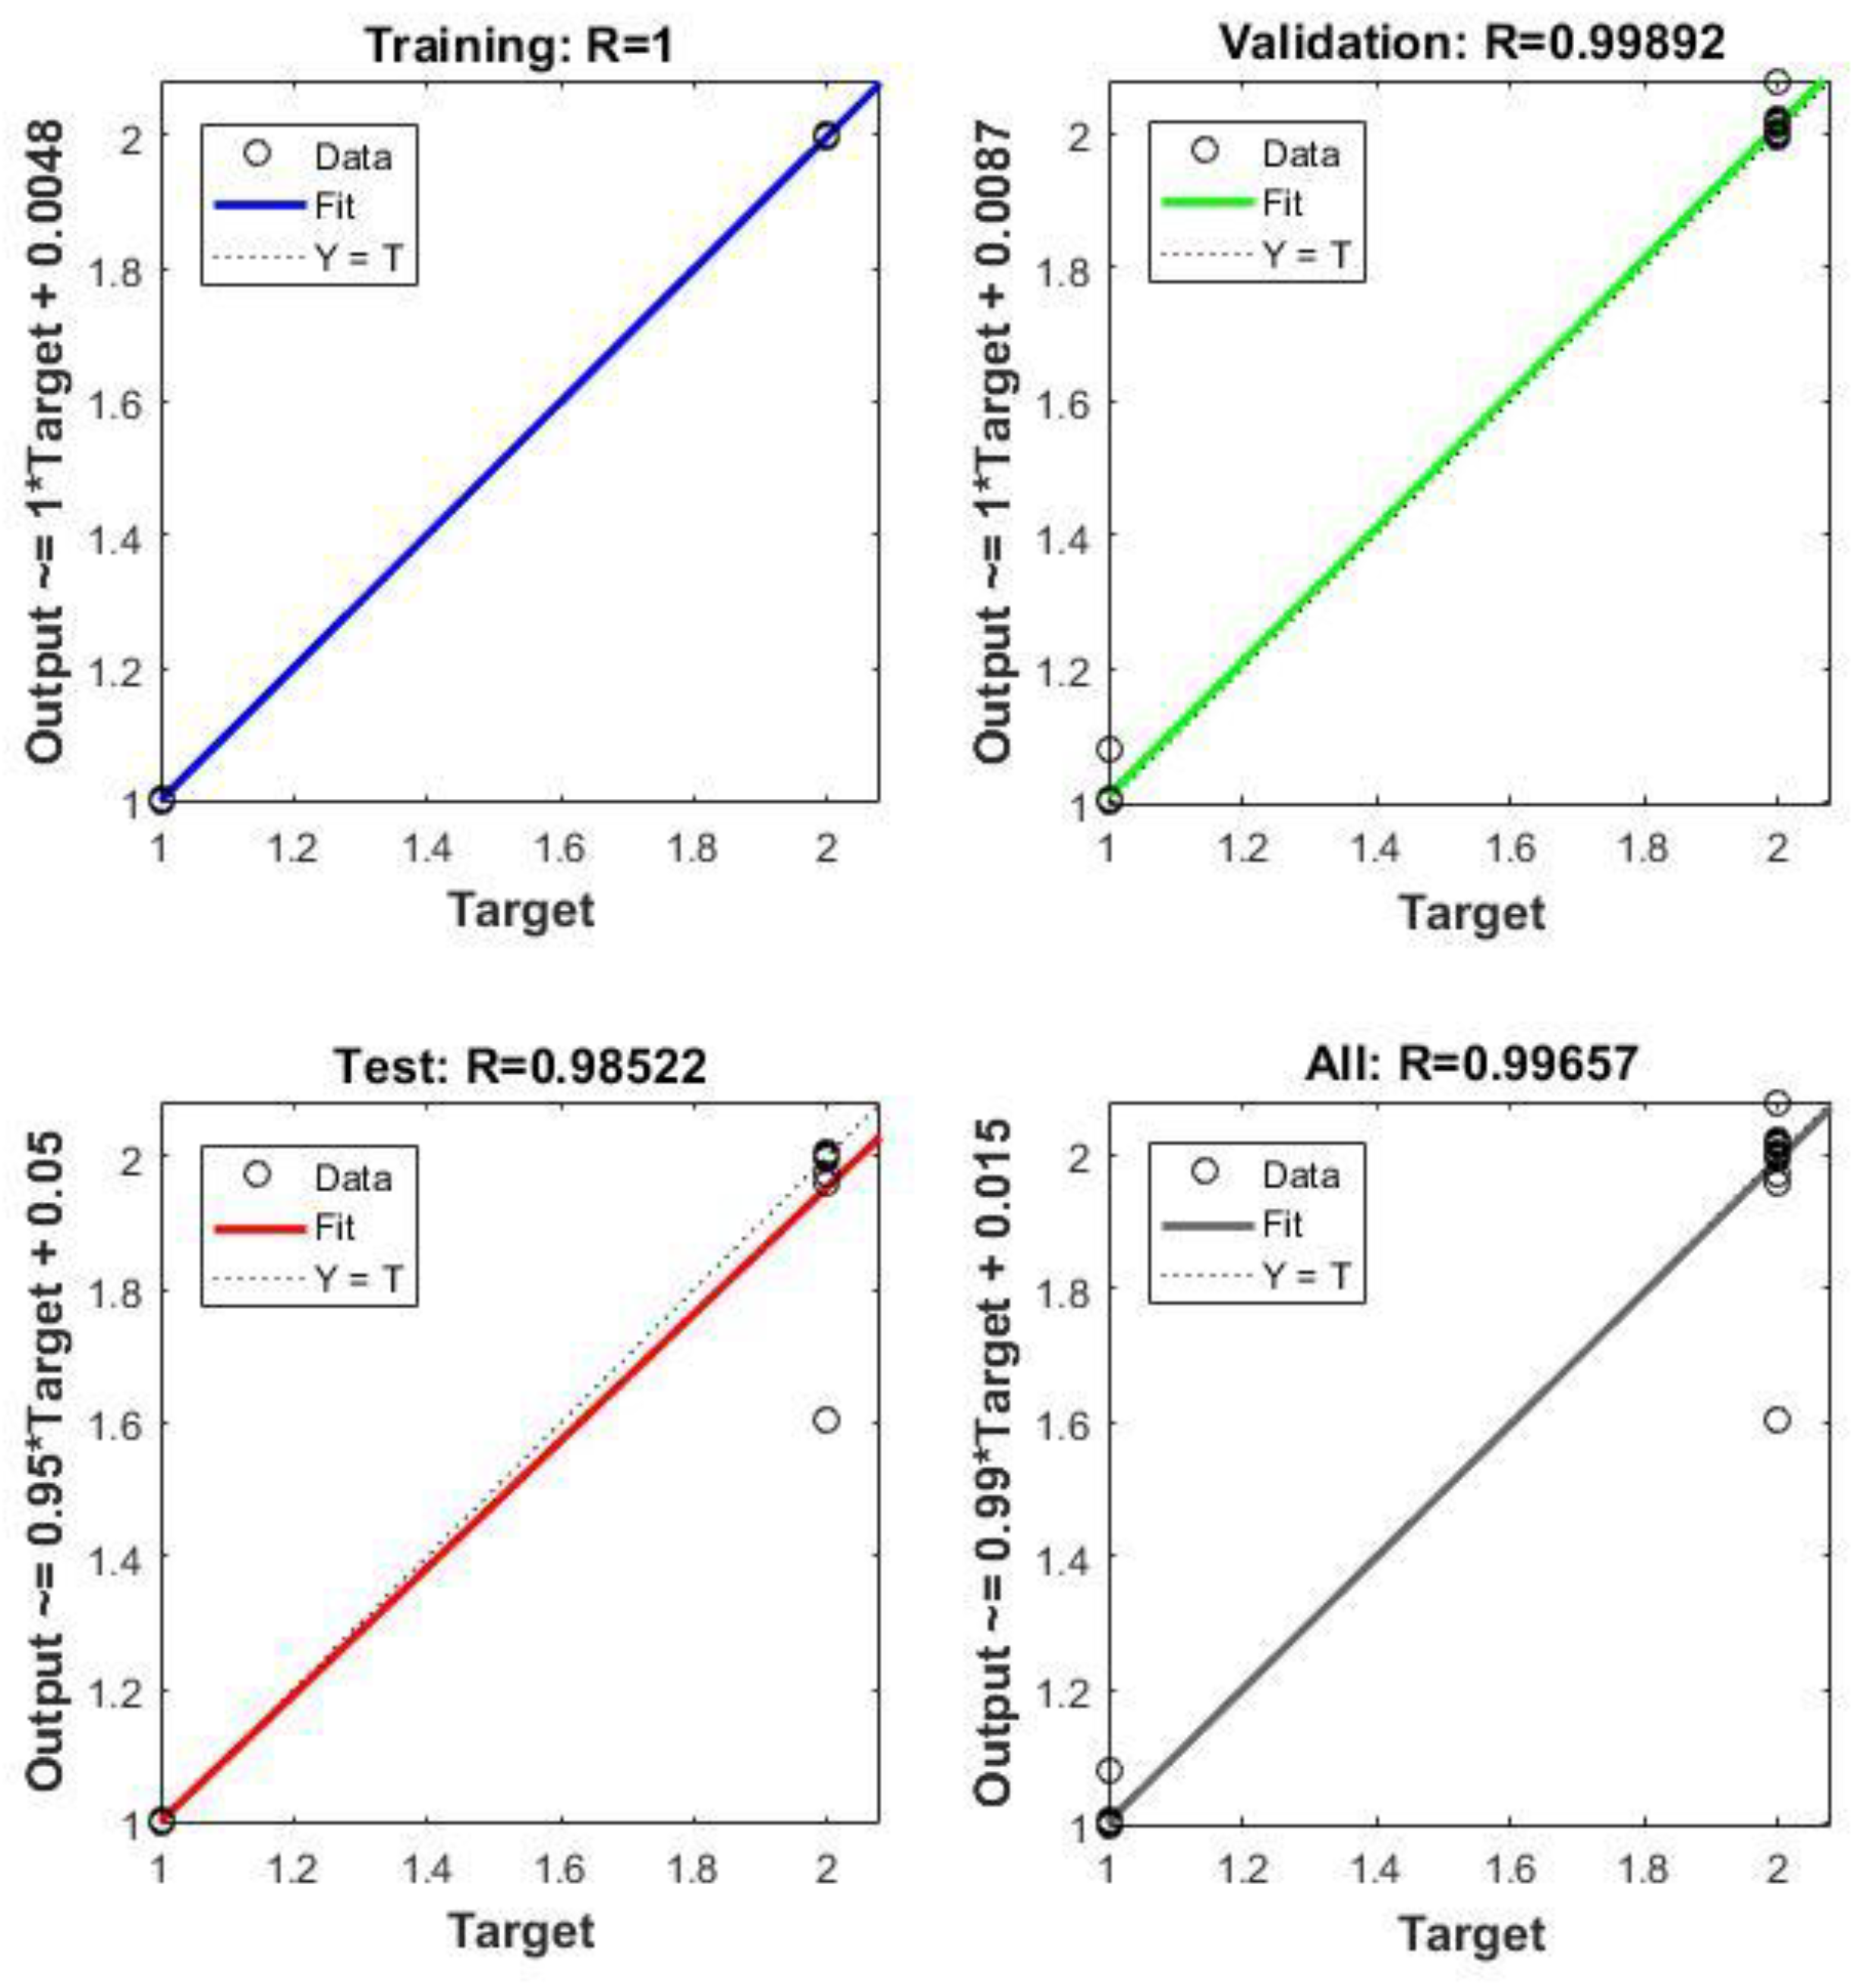
3.2. Feature Classification
4. Discussion
5. Conclusions
Author Contributions
Funding
Data Availability Statement
Conflicts of Interest
References
- Tridge. Available online: https://www.tridge.com/trades/081020-raspberry-blackberry-mulberry-and-loganberry-fresh/import (accessed on 20 September 2022).
- Singhal, B.K.; Khan, M.A.; Dhar, A.; Baqual, F.M.; Bindroo, B.B. Approaches to industrial exploitation of mulberry (Mulberry sp.) fruits. J. Fruit Ornam. Plant Res. 2010, 18, 83–99. [Google Scholar]
- Malgorzata, L. Energy and nutritional properties of the white mulberry (Morus alba L.). J. Agric. Sci. Technol. 2015, A5, 709–716. [Google Scholar]
- Elhamirad, A.H. Optimization of juice clarification of two native white mulberry (Morus alba) varieties. Iran. J. Innov. Food Sci. Technol. 2013, 5, 91–103. [Google Scholar]
- Yuan, Q.; Zhao, L. The Mulberry (Morus alba L.) Fruit-A Review of Characteristic Components and Health Benefits. J. Agric. Food Chem. 2017, 65, 10383–10394. [Google Scholar] [CrossRef] [PubMed]
- Kheiralipour, K. Sustainable Production: Definitions, Aspects, and Elements, 1st ed.; Nova Science Publisher: Hauppauge, NY, USA, 2022. [Google Scholar]
- Erkinbaev, C.; Nadimi, M.; Paliwal, J. A unified heuristic approach to simultaneously detect fusarium and ergot damage in wheat. Meas. Food 2022, 7, 100043. [Google Scholar] [CrossRef]
- Karunakaran, C.; Visen, N.S.; Paliwal, J.; Zhang, G.; Jayas, D.S.; White, N.D.G. Machine Vision Systems for Agricultural Products. In Introduction to Advanced Food Process Engineering; Sahu, J.K., Boca Raton, F.L., Eds.; Taylor & Francis Group: Oxfordshire, England, 2014. [Google Scholar]
- Kumar Mahanti, N.; Pandiselvam, R.; Kothakota, A.; Ishwarya, P.S.; Kumar Chakraborty, S.; Kumar, M.; Cozzolino, D. Emerging non-destructive imaging techniques for fruit damage detection: Image processing and analysis. Trends Food Sci. Technol. 2022, 120, 418–438. [Google Scholar] [CrossRef]
- Li, X.; Guillermic, R.M.; Nadimi, M.; Paliwal, J.; Koksel, F. Physical and microstructural quality of extruded snacks made from blends of barley and green lentil flours. Cereal Chem. 2022, 99, 1112–1123. [Google Scholar] [CrossRef]
- Nadimi, M.; Sun, D.W.; Paliwal, J. Recent applications of novel laser techniques for enhancing agricultural production. Laser Phys. 2021, 31, 053001. [Google Scholar] [CrossRef]
- Pathmanaban, P.; Gnanavel, B.K. Sundaram Anandan, S.Recent application of imaging techniques for fruit quality assessment. Trends Food Sci. Technol. 2019, 94, 32–42. [Google Scholar] [CrossRef]
- Rafiq, A.; Makroo, H.A.; Hazarika, M.K. Artificial Neural Network-Based Image Analysis for Evaluation of Quality Attributes of Agricultural Produce. J. Food Process. Preserv. 2016, 40, 1010–1019. [Google Scholar] [CrossRef]
- Sivakumar, C.; Chaudhry, M.M.A.; Nadimi, M.; Paliwal, J.; Courcelles, J. Characterization of roller and Ferkar-milled pulse flours using laser diffraction and scanning electron microscopy. Powder Technol. 2022, 409, 117803. [Google Scholar] [CrossRef]
- Mohammadi, V.; Kheiralipour, K.; Ghasemi Varnamkhasti, M. Detecting maturity of persimmon fruit based on image processing technique. Sci. Hortic. 2015, 184, 123–128. [Google Scholar] [CrossRef]
- Kheiralipour, K.; Nadimi, M.; Paliwal, J. Development of an Intelligent Imaging System for Ripeness Determination of Wild Pistachios. Sensors 2022, 22, 7134. [Google Scholar] [CrossRef] [PubMed]
- Nadimi, M.; Loewen, G.; Paliwal, J. Assessment of mechanical damage to flaxseeds using radiographic imaging and tomography. Smart Agric. Technol. 2022, 2, 100057. [Google Scholar] [CrossRef]
- Nadimi, M.; Sun, D.W.; Paliwal, J. Effect of laser biostimulation on germination of wheat. Appl. Eng. Agric. 2022, 38, 77–84. [Google Scholar] [CrossRef]
- Nadimi, M.; Divyanth, L.G.; Paliwal, J. Automated detection of mechanical damage in flaxseeds using radiographic imaging and machine learning. Foods Bioprocess Technol. 2022; In Press. [Google Scholar]
- Kheiralipour, K.; Ahmadi, H.; Rajabipour, A.; Rafiee Javan-Nikkhah MJayas, D.S.; Siliveu, K. Detection of fungal infection in pistachio kernel by long-wave near-infrared hyperspectral imaging technique. Qual. Assur. Saf. Crops Foods 2015, 8, 129–135. [Google Scholar] [CrossRef]
- Kheiralipour, K.; Ahmadi, H.; Rajabipour, A.; Rafiee, S.; Javan-Nikkhah, M.; Jayas, D.S.; Siliveu, K.; Malihipour, A. Processing the hyperspectral images for detecting infection of pistachio kernel by R5 and KK11 isolates of Aspergillus flavus fungus. Iran. J. Biosyst. Eng. 2021, 52, 13–25. [Google Scholar]
- Nadimi, M.; Brown, J.M.; Morrison, J.; Paliwal, J. Examination of wheat kernels for the presence of Fusarium damage and mycotoxins using near-infrared hyperspectral imaging. Meas. Food 2021, 4, 100011. [Google Scholar] [CrossRef]
- Nadimi, M.; Loewen, G.; Bhowmik, P.; Paliwal, J. Effect of laser biostimulation on germination of sub-optimally stored flaxseeds (Linum usitatissimum). Sustainability 2022, 14, 12183. [Google Scholar] [CrossRef]
- Kheiralipour, K.; Pormah, A. Introducing new shape features for classification of cucumber fruit based on image processing technique and artificial neural networks. J. Food Process Eng. 2017, 40, e12558. [Google Scholar] [CrossRef]
- Jahanbakhshi, A.; Kheiralipour, K. Evaluation of image processing technique and discriminant analysis methods in postharvest processing of carrot fruit. Food Sci. Nutr. 2020, 8, 3346–3352. [Google Scholar] [CrossRef] [PubMed]
- Kheiralipour, K.; Kazemi, A. A new method to determine morphological properties of fruits and vegetables by image processing technique and nonlinear multivariate modeling. Int. J. Food Prop. 2020, 23, 368–374. [Google Scholar] [CrossRef] [Green Version]
- Vadivambal, R.; Jayas, D.S. Bio-Imaging: Principles, Techniques, and Applications, 1st ed.; CRC Press: Boca Raton, FL, USA, 2018. [Google Scholar]
- Kheiralipour, K.; Ahmadi, H.; Rajabipour, A.; Rafiee, S. Thermal Imaging, Principles, Methods and Applications, 1st ed.; Ilam University Publication: Ilam, Iran, 2018. [Google Scholar]
- Azarmdel, H.; Jahanbakhshi, A.; Mohtasebi, S.S.; Rosado Muñoz, A. Evaluation of image processing technique as an expert system in mulberry fruit grading based on ripeness level using artificial neural networks (ANNs) and support vector machine (SVM). Postharvest Biol. Technol. 2020, 166, 111201. [Google Scholar] [CrossRef]
- Khazaee, Y.; Kheiralipour, K.; Hosainpour, A.; Javadikia, H.; Paliwal, J. Development of a Novel Image Analysis and Classification Algorithms to Separate Tubers from Clods and Stones. Potato Res. 2022, 65, 1–22. [Google Scholar] [CrossRef]
- Salam, S.; Kheiralipour, K.; Jian, J. Detection of Unripe Kernels and Foreign Materials in Chickpea Mixtures Using Image Processing. Agriculture 2022, 12, 995. [Google Scholar] [CrossRef]
- Sabzi, S.; Nadimi, M.; Abbaspour-Gilandeh, Y.; Paliwal, J. Non-Destructive Estimation of Physicochemical Properties and Detection of Ripeness Level of Apples Using Machine Vision. Int. J. Fruit Sci. 2022, 22, 628–645. [Google Scholar] [CrossRef]
- Gonzalez, R.; Woods, R. Digital Image Processing, 3rd ed.; Prentice-Hall: Hoboken, NJ, USA, 2007. [Google Scholar]
- Azadnia, R.; Kheiralipour, K. Evaluation of hawthorns maturity level by developing an automated machine learning-based algorithm. Ecol. Inform. 2022, 71, 101804. [Google Scholar] [CrossRef]
- Azadnia, R.; Kheiralipour, K. Recognition of leaves of different medicinal plant species using a robust image processing algorithm and artificial neural networks classifier. J. Appl. Res. Med. Aromat. Plants 2021, 25, 100327. [Google Scholar] [CrossRef]
- García-Mateos, G.; Hernández-Hernández, J.L.; Escarabajal-Henarejos, D.; Jaén-Terrones, S.; Molina-Martínez, J.M. Study and comparison of color models for automatic image analysis in irrigation management applications. Agric. Water Manag. 2015, 151, 158–166. [Google Scholar] [CrossRef]
- Chaves-González, J.M.; Vega-Rodríguez, M.A.; Gómez-Pulido, J.A.; Sánchez-Pérez, J.M. Detecting skin in face recognition systems: A colour spaces study. Digit. Signal Process. 2010, 20, 806–823. [Google Scholar] [CrossRef]
- Jahanbakhshi, A.; Kheiralipour, K. Carrot sorting based on shape using image processing, artificial neural network, and support vector machine. J. Agric. Mach. 2019, 9, 295–307. [Google Scholar]
- Available online: https://www.mathworks.com/help/stats/sequential-feature-selection.html (accessed on 14 October 2022).
- Kheiralipour, K. Implementation and Construction of a System for Detecting Fungal Infection of Pistachio Kernel Based on Thermal Imaging (TI) and Image Processing Technology. Ph.D. Dissertation, University of Tehran, Karaj, Iran, 2012. [Google Scholar]
- Williams, H.A.M.; Jones, M.H.; Nejati, M.; Seabright, M.J.; Bell, J.; Penhall, N.D.; Barnett, J.J.; Duke, M.D.; Scarfe, A.J.; Ahn, H.S.; et al. Robotic kiwifruit harvesting using machine vision, convolutional neural networks, and robotic arms. Biosyst. Eng. 2019, 181, 140–156. [Google Scholar] [CrossRef]
- Kheiralipour, K.; Ahmadi, H.; Rajabipour, A.; Rafiee, S.; Javan-Nikkhah, M. Classifying healthy and fungal infected-pistachio kernel by thermal imaging technology. Int. J. Food Prop. 2015, 18, 93–99. [Google Scholar] [CrossRef]
- Kheiralipour, K.; Marzbani, F. Pomegranate quality sorting by image processing and artificial neural network. In Proceedings of the 10th Iranian National Congress on AGR Machi Eng (Biosystems) and Mechanizasion, Mashhad, Iran, 30–31 August 2016. (In Persian). [Google Scholar]
- Divyanth, L.G.; Guru, D.S.; Soni, P.; Machavaram, R.; Nadimi, M.; Paliwal, J. Image-to-image translation-based data augmentation for improving crop/weed classification models for precision agriculture applications. Algorithms, 2022; in press. [Google Scholar] [CrossRef]


| No | Feature | Channel | Mean | |
|---|---|---|---|---|
| Grade 1 | Grade 2 | |||
| 1 | Mean | Gray | 0.48 | 0.35 |
| 2 | Median | Gray | 0.48 | 0.34 |
| 3 | Mean | R | 0.52 | 0.38 |
| 4 | Coefficient of variation | R | 0.08 | 0.14 |
| 5 | Median | R | 0.52 | 0.38 |
| 6 | Mean | G | 0.47 | 0.33 |
| 7 | Median | G | 0.47 | 0.33 |
| 8 | Mean | B | 0.42 | 0.31 |
| 9 | Kurtosis | B | 3.68 | 5.58 |
| 10 | Mode | B | 0.417 | 0.30 |
| 11 | Mean | L* | 74.44 | 65.19 |
| 12 | Standard deviation | L* | 2.80 | 3.82 |
| 13 | Median | L* | 74.75 | 64.88 |
| 14 | Skewness | L* | 3.23 | 4.85 |
| 15 | Coefficient of variation | L* | 8.07 | 15.00 |
| 16 | Mode | I1 | 0.48 | 0.32 |
| 17 | Entropy | I3 | 1.30 | 0.19 |
| 18 | Median | H | 0.09 | 0.07 |
| 19 | Mean | V | 0.52 | 0.38 |
| 20 | Standard deviation | V | 0.04 | 0.05 |
| 21 | Coefficient of variation | V | 0.08 | 0.14 |
| 22 | Median | V | 0.52 | 0.38 |
| 23 | Mode | V | 0.53 | 0.37 |
| No. | Structure | Training Data | Validation Data | Testing Data | Total Data | ||||
|---|---|---|---|---|---|---|---|---|---|
| R * | CCR ** | R | CCR | R | CCR | R | CCR | ||
| 1 | 23-3-2 | 1.00 | 100.00 | 1.00 | 100.00 | 0.90 | 95.00 | 0.98 | 99.00 |
| 2 | 23-4-2 | 1.00 | 100.00 | 1.00 | 100.00 | 0.90 | 95.00 | 0.98 | 99.00 |
| 3 | 23-5-2 | 1.00 | 100.00 | 1.00 | 100.00 | 0.90 | 95.00 | 0.98 | 99.00 |
| 4 | 23-6-2 | 1.00 | 100.00 | 1.00 | 100.00 | 0.90 | 95.00 | 0.98 | 99.00 |
| 5 | 23-7-2 | 1.00 | 100.00 | 1.00 | 100.00 | 0.90 | 95.00 | 0.98 | 99.00 |
| 6 | 23-8-2 | 1.00 | 100.00 | 1.00 | 100.00 | 0.90 | 95.00 | 0.98 | 99.00 |
| 7 | 23-9-2 | 1.00 | 100.00 | 1.00 | 100.00 | 0.90 | 95.00 | 0.98 | 99.00 |
| 8 | 23-10-2 | 1.00 | 100.00 | 1.00 | 100.00 | 0.92 | 95.00 | 0.98 | 99.00 |
| 9 | 23-11-2 | 1.00 | 100.00 | 0.99 | 100.00 | 0.69 | 95.00 | 0.93 | 99.00 |
| 10 | 23-12-2 | 1.00 | 100.00 | 1.00 | 100.00 | 0.74 | 95.00 | 0.94 | 99.00 |
| 11 | 23-13-2 | 1.00 | 100.00 | 1.00 | 100.00 | 0.86 | 95.00 | 0.97 | 99.00 |
| 12 | 23-14-2 | 1.00 | 100.00 | 1.00 | 100.00 | 0.99 | 100.00 | 1.00 | 100 |
| 13 | 23-15-2 | 1.00 | 100.00 | 1.00 | 100.00 | 0.87 | 95.00 | 0.97 | 99.00 |
| 14 | 23-16-2 | 1.00 | 100.00 | 1.00 | 100.00 | 0.81 | 100.00 | 0.96 | 100.00 |
| 15 | 23-17-2 | 1.00 | 100.00 | 1.00 | 100.00 | 0.87 | 95.00 | 0.97 | 99.00 |
| 16 | 23-18-2 | 1.00 | 100.00 | 0.92 | 90.00 | 0.66 | 95.00 | 0.90 | 97.00 |
| 17 | 23-19-2 | 1.00 | 100.00 | 1.00 | 100.00 | 0.84 | 95.00 | 0.97 | 99.00 |
| 18 | 23-20-2 | 1.00 | 100.00 | 0.99 | 100.00 | 0.86 | 95.00 | 0.97 | 99.00 |
| Data Set | Actual | Predicted | CCR | |
|---|---|---|---|---|
| Grade 1 | Grade 2 | |||
| Training | Grade 1 | 30 | 0 | 100% |
| Grade 2 | 0 | 30 | ||
| Validation | Grade 1 | 10 | 0 | 100% |
| Grade 2 | 0 | 10 | ||
| Testing | Grade 1 | 10 | 0 | 100% |
| Grade 2 | 0 | 10 | ||
| Total | Grade 1 | 50 | 0 | 100% |
| Grade 2 | 0 | 50 | ||
| Data Set | Actual | Predicted | CCR | |
|---|---|---|---|---|
| Grade 1 | Grade 2 | |||
| Training | Grade 1 | 38 | 0 | 100% |
| Grade 2 | 0 | 37 | ||
| Testing | Grade 1 | 12 | 0 | 100% |
| Grade 2 | 0 | 13 | ||
| Total | Grade 1 | 50 | 0 | 100% |
| Grade 2 | 0 | 50 | ||
Publisher’s Note: MDPI stays neutral with regard to jurisdictional claims in published maps and institutional affiliations. |
© 2022 by the authors. Licensee MDPI, Basel, Switzerland. This article is an open access article distributed under the terms and conditions of the Creative Commons Attribution (CC BY) license (https://creativecommons.org/licenses/by/4.0/).
Share and Cite
Hosainpour, A.; Kheiralipour, K.; Nadimi, M.; Paliwal, J. Quality Assessment of Dried White Mulberry (Morus alba L.) Using Machine Vision. Horticulturae 2022, 8, 1011. https://doi.org/10.3390/horticulturae8111011
Hosainpour A, Kheiralipour K, Nadimi M, Paliwal J. Quality Assessment of Dried White Mulberry (Morus alba L.) Using Machine Vision. Horticulturae. 2022; 8(11):1011. https://doi.org/10.3390/horticulturae8111011
Chicago/Turabian StyleHosainpour, Adel, Kamran Kheiralipour, Mohammad Nadimi, and Jitendra Paliwal. 2022. "Quality Assessment of Dried White Mulberry (Morus alba L.) Using Machine Vision" Horticulturae 8, no. 11: 1011. https://doi.org/10.3390/horticulturae8111011