Communication

Global Methylation Analysis Using MSAP Reveals Differences in Chilling-Associated DNA Methylation Changes during Dormancy Release in Contrasting Sweet Cherry Varieties

by
Gabriela Narváez
1,†,
Claudia Muñoz-Espinoza
2,†,
Esteban Soto
2,
Karin Rothkegel
2,
Macarena Bastías
2,
José Gutiérrez
3,
Soraya Bravo
2,
Rodrigo Hasbún
1,
Claudio Meneses
4,5 and
Andrea Miyasaka Almeida
6,7,*
1
Laboratorio de Epigenética Vegetal, Departamento de Silvicultura, Facultad de Ciencias Forestales, Universidad de Concepción, Concepción 4030000, Chile
2
Centro de Biotecnología Vegetal, Facultad Ciencias de la Vida, Universidad Andrés Bello, República 330, Santiago 8370146, Chile
3
Departamento de Bioquímica y Biología Molecular, Facultad de Ciencias Biológicas, Universidad de Concepción, Concepción 4030000, Chile
4
Departamento de Fruticultura y Enología, Facultad de Agronomía e Ingeniería Forestal, Pontificia Universidad Católica de Chile, Santiago 7820436, Chile
5
Departamento de Genética Molecular y Microbiología, Facultad de Ciencias Biológicas, Pontificia Universidad Católica de Chile, Santiago 8331150, Chile
6
Centro de Genómica y Bioinformática, Facultad de Ciencias, Ingeniería y Tecnología, Universidad Mayor, Huechuraba 8580745, Santiago, Chile
7
Escuela de Agronomía, Facultad de Ciencias, Ingeniería y Tecnología, Universidad Mayor, Huechuraba 8580745, Santiago, Chile
*
Author to whom correspondence should be addressed.
These authors contributed equally to this work.
Horticulturae 2022, 8(10), 962; https://doi.org/10.3390/horticulturae8100962
Submission received: 31 August 2022 / Revised: 3 October 2022 / Accepted: 15 October 2022 / Published: 18 October 2022

Abstract

:
Dormancy is an adaptive strategy developed by temperate perennial crops to protect overwinter tissues from unfavorable environmental conditions. Sweet cherry (Prunus avium L.), a member of the Rosaceae family, requires chilling to overcome dormancy. The time of harvest is directly correlated with chilling requirements in sweet cherries. Consequently, early and late season varieties have low and high chilling requirements, respectively. There is evidence that the expression of dormancy-related genes is regulated by DNA methylation. In this work, methylation-sensitive amplified polymorphism (MSAP) was applied to study genome-wide DNA methylation changes associated with dormancy in two low-chill varieties, ‘Royal Dawn’ and ‘Glen Red’, and one high-chill variety, ‘Kordia’. Our primary results suggest that the occurrence of progressive DNA demethylation is associated with chilling accumulation during dormancy in the three varieties, independent of their chilling requirements. Genes were identified with different methylation status changes, detected by MSAP, related to cell wall remodeling and energy metabolism. Several MSAP profiles among the varieties were observed, suggesting that fine epigenetic control is required to coordinate hormonal and environmental signals that induce dormancy and its release.

1. Introduction

Temperate perennial trees must endure extremely unfavorable conditions during winter. Bud dormancy induction in autumn leads to temporary inhibition of apical growth and cellular division of meristems, and/or vascular cambium to protect cold-sensitive tissues such as shoots and flowers from unfavorable environmental conditions in winter [1]. Floral bud dormancy is divided into three phases: paradormancy, the phase in which bud development is inhibited by other organs such as leaves; endodormancy (ENDO), which is triggered by factors intrinsic to the bud; and ecodormancy (ECO), which is controlled by environmental factors [2]. The release of the endo-dormant state depends on the fulfillment of a cold requirement (temperatures 4 °C–7 °C) [3]. The chilling requirement (CR) is genetically determined to vary between species and varieties and corresponds to a major limitation in the adaptability of fruit trees to different geographic areas [3]. Once the trees fulfill their CR and enter ECO, they still need to fulfill a heat requirement (HR) to bloom. The bloom date of fruit trees is determined by the dynamic relationship between CR and HR fulfilment during dormancy. In sweet cherries, the flowering time is directly related to CR [4,5]. Early flowering varieties have low CR, while late flowering varieties have high CR.
In recent years, an increasing number of studies have shown that endodormancy release in Rosaceae fruit trees appears to be mediated by epigenetic mechanisms [6,7,8,9,10,11]. DNA methylation is an epigenetic event that consists of reversible covalent modification based on the addition of a methyl group to cytosine to form 5-methylcytosine, which modifies local chromatin compression. In plants, DNA methylation occurs in three different contexts: CpG, CHG, and CHH, where H can be cytosine, thymine, or adenine [12]. In addition, alterations in DNA methylation patterns may facilitate ecological adaptation and may constitute a means for organisms to cope with environmental stress [13,14].
The methylation-sensitive amplified polymorphism technique (MSAP) is an amplified fragment length polymorphism (AFLP)-derived technique adapted to study cytosine methylation using restriction enzyme isoschizomers HpaII and MspI that recognize the same sequence 5′-CCGG-3′, but differ in their sensitivity to the methylation state of cytosine [15]. Thus, changes in DNA methylation sites can be evaluated by comparing molecular patterns, which allows for the identification of differentially methylated regions as a basis for the development of putative epimarkers. In addition, it does not require prior knowledge of the genome sequence to detect changes in DNA methylation patterns. In plants, MSAP has been used to study cytosine methylation changes under abiotic stresses [16,17,18,19,20].
To improve our understanding of the mechanisms underlying epigenetic regulation of dormancy release, three sweet cherry varieties with different CR were analyzed using the MSAP approach. MSAP analysis was used to study changes in DNA methylation profiles and global DNA methylation changes in early and late sweet cherry varieties as dormancy release progressed. Our results indicate the occurrence of progressive DNA demethylation associated with chilling accumulation during dormancy in the three varieties, independent of their CR. Several MSAP profiles among the varieties were observed, suggesting that fine epigenetic control is required to coordinate hormonal and environmental signals that induce dormancy and its release. A group of differentially methylated MSAP bands was sequenced and identified.

2. Materials and Methods

2.1. Plant Material, Chilling Requirement (CR), and Growing Degree Hours (GDH) Estimation

Samples of ‘Royal Dawn’ and ‘Glen Red’ varieties were collected from the commercial orchard ‘Agrícola Garcés’ located at San Francisco de Mostazal, O’Higgins region of Chile (33.99°29′055″ S, 70.69°35′047″ W), while the ‘Kordia’ variety was collected in the experimental station of Pontificia Universidad Católica de Valparaíso, located at Quillota, Valparaíso region of Chile (32°53′44.41″ S, 71°12′25.05″ W). Cuttings of approximately 30 cm with four to six floral bud clusters were collected at the beginning of June 2015 (autumn in the Southern Hemisphere) and kept at 4 °C in a cold chamber. The chilling requirements were estimated for the three varieties based on the chilling hours model (CH: hours ≤ 7.2 °C) [21]. Therefore, every hour in the cold chamber was considered 1 CH. Floral buds with different cold accumulations were frozen in liquid nitrogen and stored at −80 °C, until DNA extraction. Each replicate consisted of a floral bud pool obtained from a single cut. Subsequently, three cuttings of each variety were randomly selected every two weeks and placed in water at 25 °C with a 16/8 h light/dark photoperiod for 14 days. The percentage (%) of bud break was estimated at the end of this period [9]. Dormancy release was considered when 50% or more buds began to show sepals in stage B of Baggiolini after 14 d under controlled conditions [3]. The heat requirement was calculated as the (GDH), as established by [22].

2.2. Genomic DNA Extraction

Total DNA was extracted using 0.1 g of floral buds using a DNeasy Plant mini kit (Qiagen, Hilden, Germany), according to the manufacturer’s instructions. DNA integrity was assessed by agarose electrophoresis (1.5% agarose in 1× Tris-acetate 40 mM, EDTA 1 mM, pH 8.0). DNA concentration was measured using a Nanoquant Infinite Pro M 200 spectrophotometer (Tecan, Zürich, Switzerland).

2.3. Methylation-Sensitive Amplified Polymorphism (MSAP) Assay

MSAP analysis was performed according to the protocols described by Reyna-López et al. (1997) and [23], with modifications. Digestions of 15 ng genomic DNA were carried out using two methylation-sensitive isoschizomers (HpaII or MspI) (New England Biolabs) as frequent cutters, each in combination with the same rare cutter EcoRI. Both isoschizomers recognized the same sequence (5′-CCGG) but differed in their sensitivity to DNA methylation [24]. DNA adapters were ligated to digested DNA using T4 ligase (New England Biolabs). The sequence of adapters, pre-amplification, and selective amplification primers are listed in Table S1. Fluorescently labeled EcoRI primers were used for selective amplification. In a preliminary analysis, selective PCR-amplified products were separated by electrophoresis in low-melting agarose gels (2%) with 1× TAE buffer (Tris-acetate 40 mM, EDTA 1 mM, pH 8.0) and GelRed® Nucleic Acid Gel Stain (Biotium, Fremont, CA, USA) and later analyzed by capillary electrophoresis in an ABI PRISM 3130xl Genetic Analyzer (Applied Biosystems, Foster City, CA, USA).
Seven selective pair primers were used for the MSAP assay, four of which were selected because of their high polymorphism. MSAP analyses were performed in triplicates. Band inconsistencies between replicates were discarded. Selectively amplified fragments were classified into four types, according to [25]: Type I represents the presence of bands in both enzyme lanes including EcoRI/HpaII and EcoRI/MspI, corresponding to unmethylated sequences. Type II bands were detected in EcoRI/HpaII and not in EcoRI/MspI lanes, according to the hemi-methylated target. Type III bands were detected in EcoRI/MspI and not in EcoRI/HpaII lanes, indicating methylation at internal cytosine. Type IV fragments, resulting from the lack of bands in both restriction enzyme lanes, were not considered informative because they might indicate hypermethylation and/or one mutation [15].
The percentage of polymorphic MSAP, fully methylated, and hemimethylated bands were estimated using the formulas described by [25]:
Total methylation (%) = [(II + III + IV)/(I + II + III + IV)] × 100
Fully methylated bands (%) = [(III + IV)/(I + II + III + IV)] × 100
Hemi-methylated bands (%) = [(II)/(I + II + III + IV)] × 100
Subsequently, MSAP electropherograms were visualized using the GeneMapper software (version 4.0; Applied Biosystems, Foster City, California, United States) and scored in a binary matrix based on the presence (1) or absence (0) of fragments generated for each enzyme combination (including EcoRI/HpaII and EcoRI/MspI). MSAP-selected fragments were analyzed ranging from 50 to 650 bp to avoid a possible risk of size co-migration [26]. HpaII and MspI binary matrices were then used to compute Shannon’s diversity index and perform an analysis of molecular variance (AMOVA) to determine the degree of differentiation within varieties using the statistical software R and ‘msap’ package (v. 1.1.8) [27].
Furthermore, principal coordinates analysis (PCoA) was performed in the two analyzed stages to determine and visualize the contribution to the molecular variability within regions of genetic (NML, non-methylated loci) and epigenetic variability (MSL, methylation-susceptible loci), from the comparison among low (‘Royal Dawn’ and ‘Glen Red’) and high chilling requirement varieties (‘Kordia’) using the statistical software R and the ‘msap’ package [27].

2.4. MSAP Bands Selection

Following the MSAP assay, 24 specific bands were selected for sequencing. The MSAP bands were excised from the gels, eluted in 30 µL of ultrapure water, and incubated at 94 °C for five min. The eluted bands were re-amplified using the same primer set and PCR thermal conditions as described for selective amplification. Subsequently, the PCR products were ligated to NGS adaptors.

2.5. Library Construction

For library construction, a maximum of 100 ng of each amplicon was used as input for the TruSeq Nano DNA Sample Prep Kit (Illumina, Inc., San Diego, CA, USA), according to the manufacturer’s instructions. To assess amplicon size and integrity, the final libraries were analyzed by capillary electrophoresis on a Fragment Analyzer Automated CE System (AATI, Agilent, Santa Clara, CA, USA), quantified using the Qubit 2.0 DNA BR Assay kit (Thermo Fisher, Waltham, MA, USA), and subsequently sequenced using the Sanger method (Macrogen Inc., Seoul, Korea).

2.6. Sequencing and Bioinformatics Analysis of MSAP Bands

MSAP band sequences were analyzed and a search for similarities with known genes and genome sequences was performed against the Prunus avium Whole Genome Assembly v1.0 and Annotation v1 (v1.0. a1) (https://www.rosaceae.org/; accessed 25 September 2021) [28] and Prunus persica Whole Genome Assembly v2.0 and Annotation v2.1 (v2.0. a1) [29]. Sequence homology searches were performed using the BLAST alignment tool. An expectation value cutoff of less than 1 × 10⁻⁷ was considered, and the results were analyzed using the genome browser tool. Gene annotations representing the top-scoring BLAST hits for each MSAP band were reported.

2.7. MethylC-Seq

Bisulfite treatment and data analysis of ‘Royal Dawn’ and ‘Kordia’ were previously published [10]. Briefly, bisulfite treatment was carried out for season 2015 from genomic DNA of floral buds with different CH accumulation from ‘Royal Dawn’ (0 CH, 173 CH, 348 CH, and 516 CH) and ‘Kordia’ (0 CH, 443 CH, 1295 CH, and 1637 CH). All libraries were obtained using the TruSeq DNA Methylation Kit (Illumina, San Diego, CA, USA), according to the manufacturer’s instructions. Libraries were validated using a Qubit Fluorometer and Fragment Analyzer (Advanced Analytical Technologies, Ankeny, IA, USA), followed by sequencing in HiSeq 2500, 2 × 125 bp paired-end mode (Illumina, San Diego, CA, USA). Raw data are available in the NCBI Sequence Read Archive (PRJNA610988 and PRJNA610989).
Filtered reads of bisulfite-treated libraries were mapped to the partial genome of each variety using Bismark [30] and the partial genome of P. avium [28], with no mismatches. The methylation states of CpG, CHG, and CHH were determined from the aligned reads using Bismark and Seqmonk software [30]. From cytosines covered by at least five reads, we used a sliding-window approach of 100 bp to analyze the methylation state. The methylation level was calculated as log2 enrichment (log2 ratio of the observed base density in the region divided by the overall base density in the sample). An ANOVA analysis (p-value < 0.01) was used to obtain significant differences among the two chilling conditions (0 CH/ENDO and 516 CH/ECO for ‘Royal Dawn’; 0 CH/ENDO and 1637 CH/ECO for ‘Kordia’). The p-value was adjusted using Benjamini and Hochberg’s correction (FDR < 0.01). Windows with differences of at least log2 fold-change > 1.5 in their methylation state between two of the four conditions were identified as differentially methylated.

3. Results

3.1. Chilling Requirement Determination

The low and high chilling requirements of sweet cherry varieties were analyzed in this study at the stages of endodormancy (ENDO) and ecodormancy (ECO). Dormancy stages were defined by estimating bud break under forcing conditions. The fulfillment of the chilling requirement (CR), the transition from ENDO to ECO, was determined when 50% or more of flower buds were in bud break (BBCH51 stage, [9]). We estimated that CR was completed at 516 CH for ‘Royal Dawn’ and 684 CH for ‘Glen Red’, while ‘Kordia’ needed a much higher chilling accumulation, fulfilling its CR at 1637 CH (Table 1). The MSAP analysis was performed at the ENDO stage (173 CH for ‘Royal Dawn’ and ‘Glen Red’, 443 CH for ‘Kordia’) when all the three varieties presented a 0% bud break (Table 1). We also analyzed the methylation profile by MSAP at the ECO stage (516 CH for ‘Royal Dawn’, 684 CH for ‘Glen Red’, and 1637 CH for ‘Kordia’) when all the three varieties presented more than 50% bud break (Table 1).

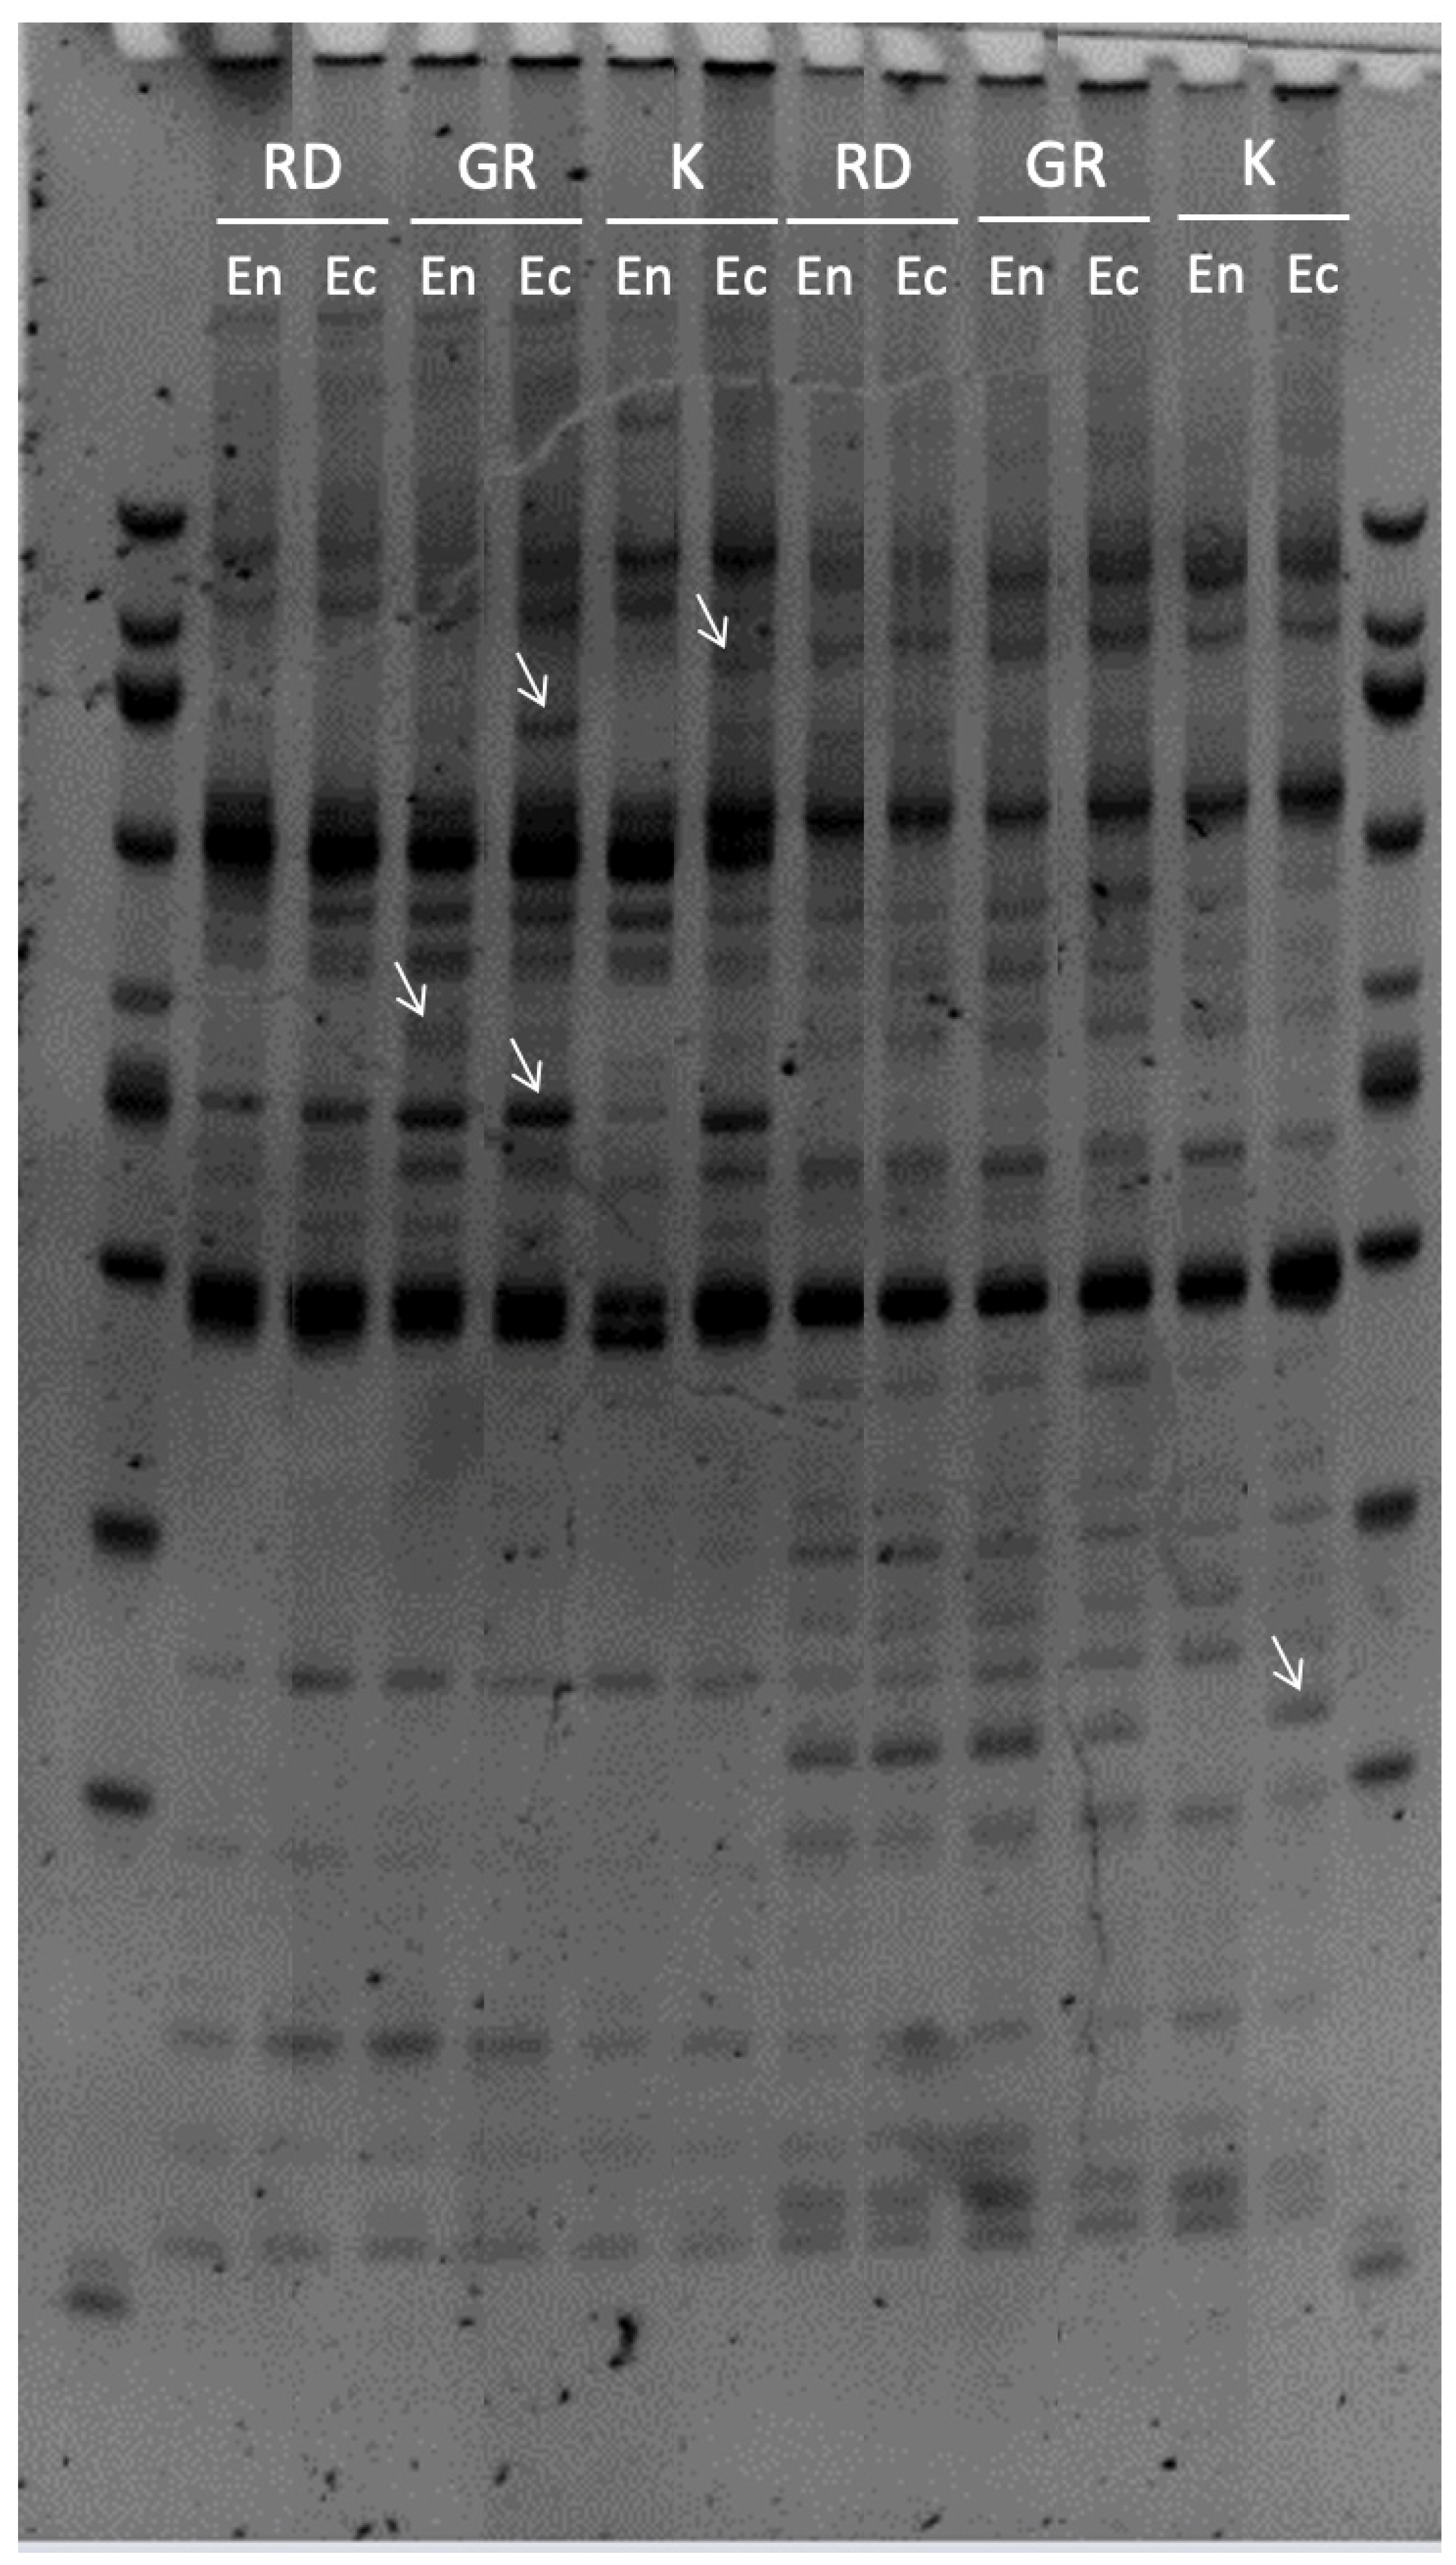
3.2. Methylation Profiling of Sweet Cherry Floral Buds at Different Dormancy Stages

The MSAP protocol has been previously applied to floral bud samples, in which 32 combinations of selective primers were tested. The result of the selective PCR was verified in agarose gels, from which three combinations that presented an abundant number of discrete bands below 500 bp were selected (Figure 1). MSAP profiling was performed using ACA–ACC and AGT–CTG primer combinations. The scoring of fragments ranging between 53 and 644 bp was performed by capillary electrophoresis and values 1 and 0 represented the presence or absence of the MSAP band, respectively. A total of 121 polymorphic bands were selected, corresponding to 58 and 63 bands obtained using the ACA–ACC and AGT–CGT primer sets, respectively. Monomorphic bands, such as bands present under all conditions, were not considered for further analysis.
Two types of bands were observed using MSAP. Methylation-insensitive fragments, including genetic bands, showed no differences in EcoRI/HpaII and EcoRI/MspI patterns. In contrast, methylation-sensitive fragments, including epigenetic bands, were amplified after digestion with either EcoRI/HpaII or EcoRI/MspI restriction enzymes. The most abundant band under all conditions and varieties was the methylation-insensitive fragment (type I bands) present in both EcoRI/HpaII and EcoRI/MspI (Table 2). No significant differences in the number of type I fragments were observed when comparing the dormancy stages analyzed in ‘Royal Dawn’ and ‘Kordia’. However, in ‘Glen Red’ a lower number in ENDO (55 bands) was observed compared with ECO (67 bands). Hemi-methylated fragments (type II bands) were present only in the EcoRI/HpaII lane and fully methylated fragments (type III bands) were present only in the EcoRI/MspI lane. Type II and type III bands were equal in ‘Royal Dawn’ and ‘Kordia’ while in ‘Glen Red’ they were present in a higher number (27 type II, 20 type III) in ENDO than in the ECO stage (19 type II, 13 type III) (Table 2). The fragments absent in both lanes (type IV) were equal among the dormancy stages in the three varieties. The total methylation percentage (band types II + III + IV) was found to be constant in ‘Royal Dawn’ (46.3%), while it was higher in ‘Glen Red’ and ‘Kordia’ in ENDO, 54.4 and 40.5%, respectively, than ECO, 44.6 and 37.1%, respectively. In ‘Glen Red’ this difference was primarily due to the higher percentage of hemi-methylated bands in ENDO (22.3%) than ECO (15.7%). While in ‘Kordia’, a higher percentage of fully methylated bands was observed in ENDO (23.9%) than ECO (20.6%) (Table 2).

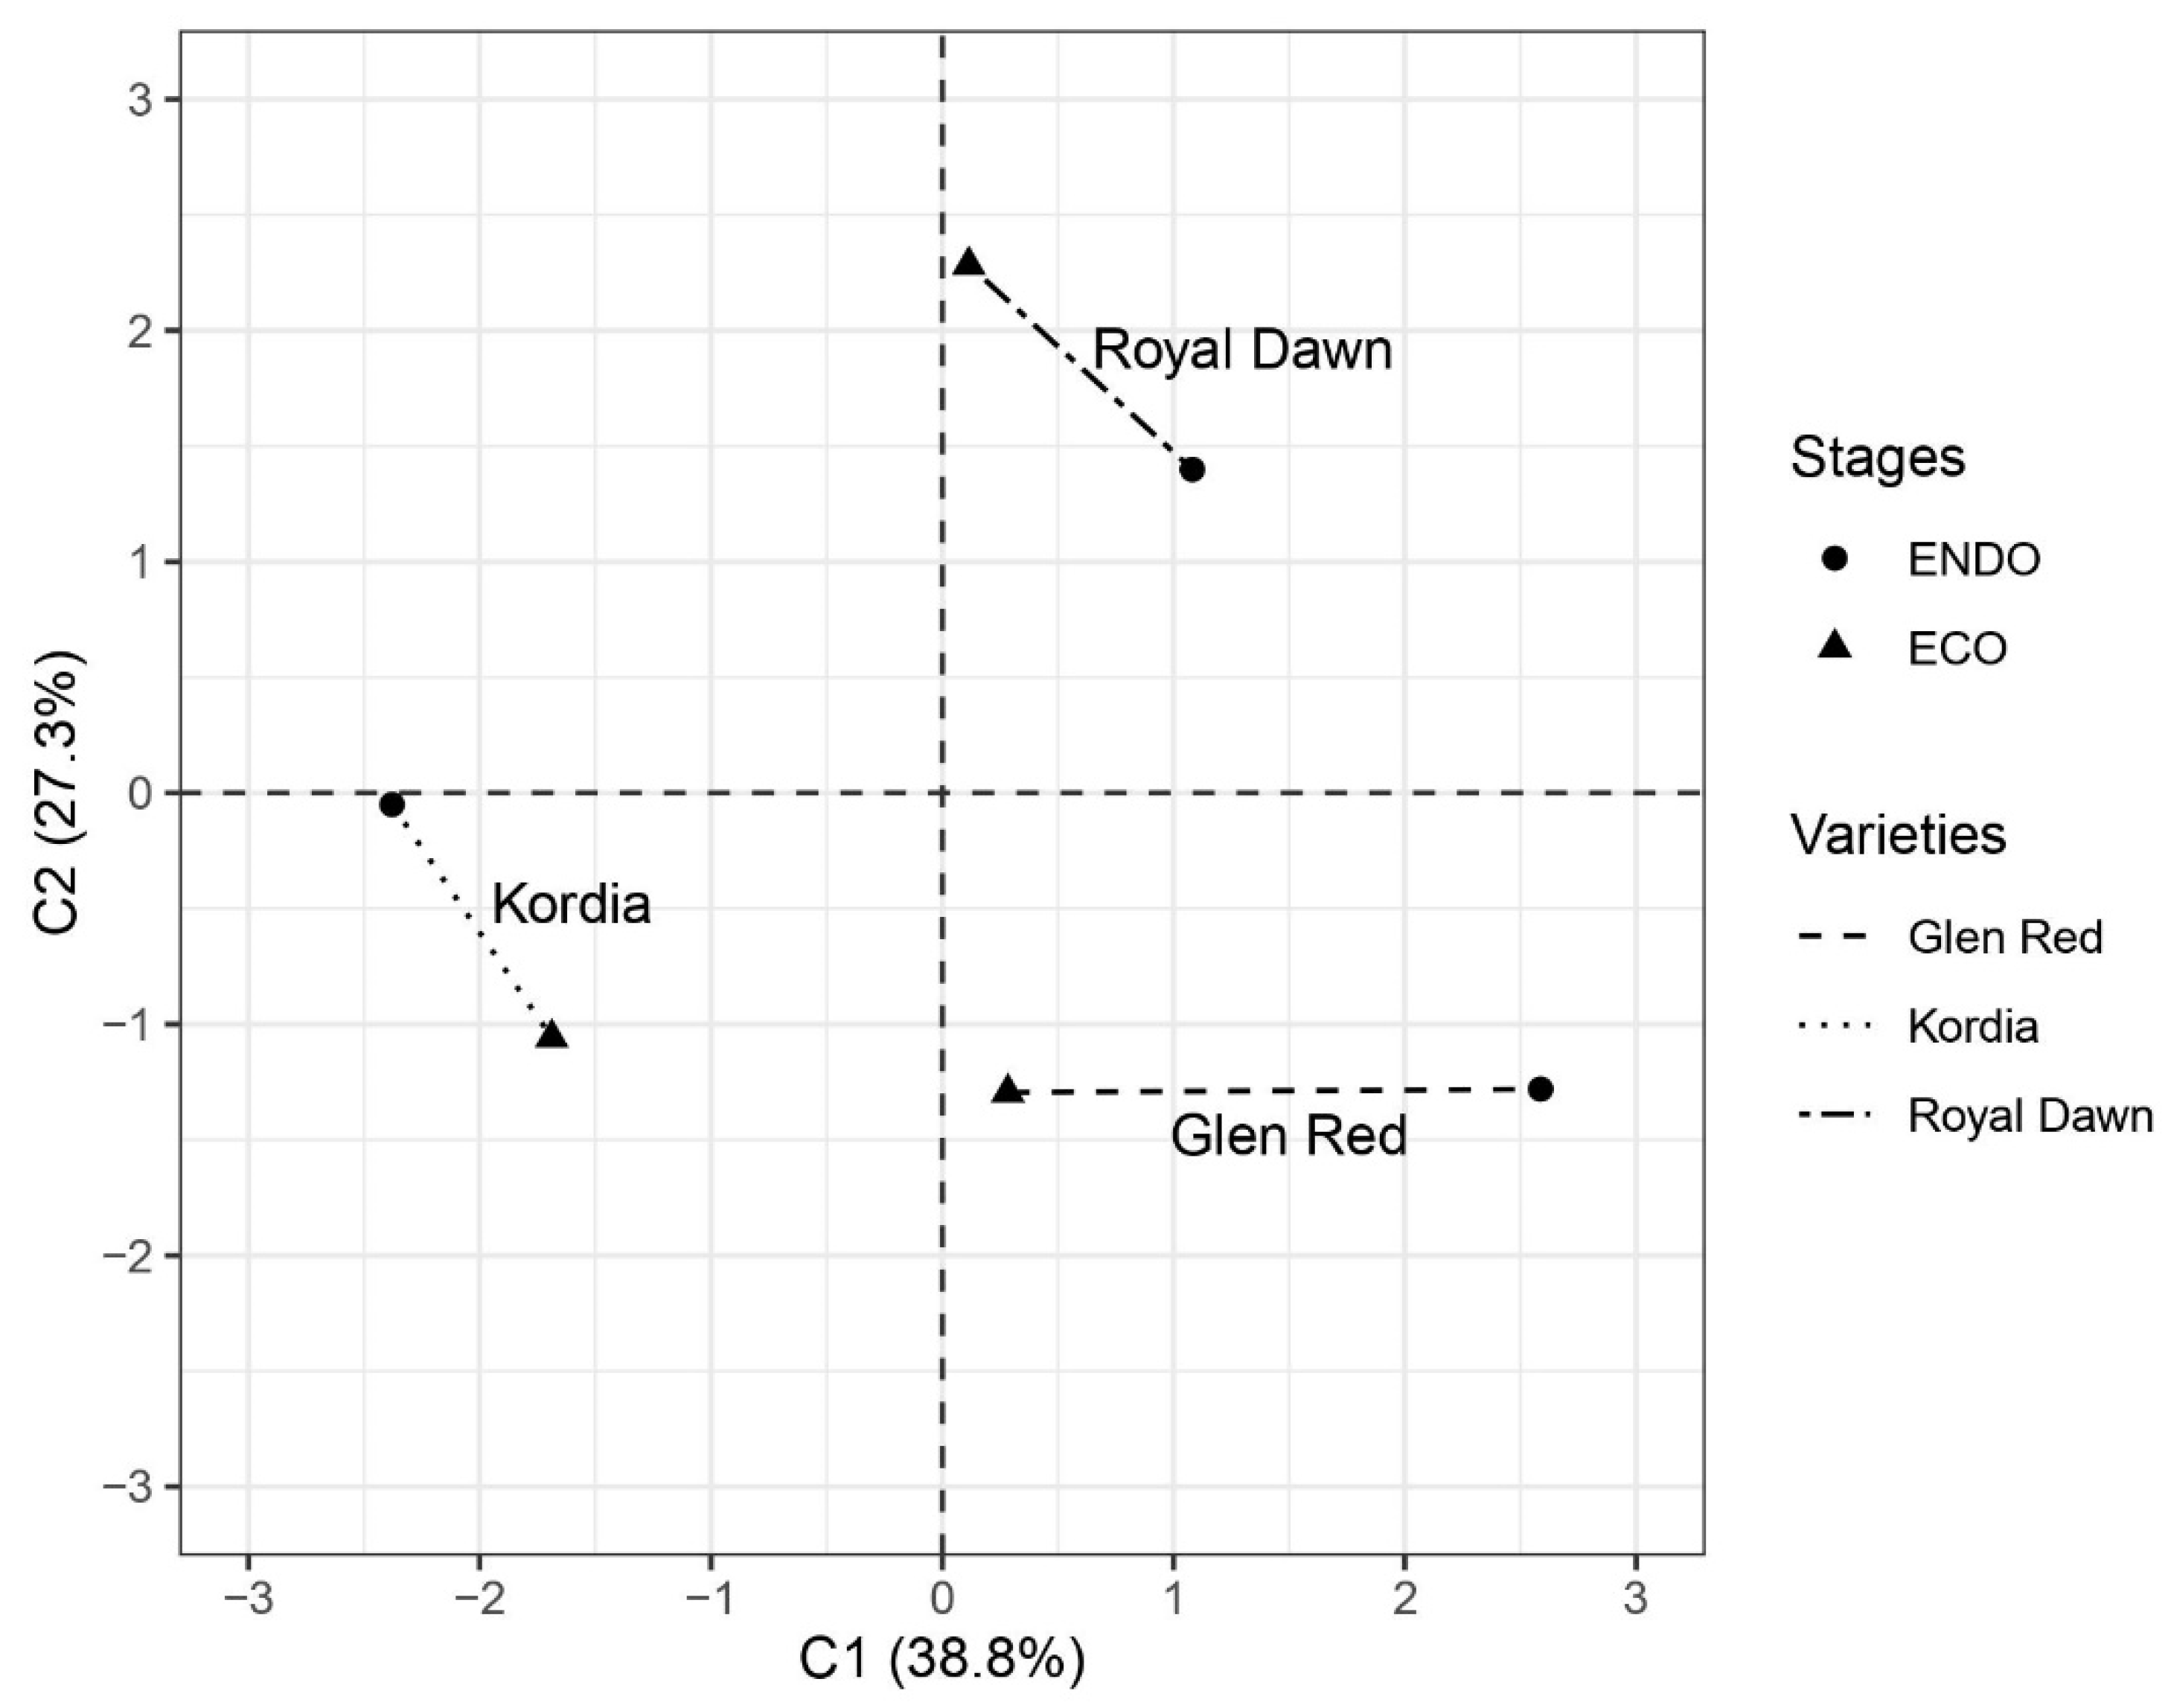
3.3. Dynamics of Methylation/Demethylation Events Concerning Dormancy Stage Transition

All possible banding patterns observed in the transition from ENDO to ECO were compared to analyze the dynamic changes in cytosine methylation patterns during dormancy release (Table 3). Patterns A to D correspond to monomorphic class bands, considering that the MSAP pattern remains unchanged compared with the ENDO and ECO stages, with A being the most common. Patterns E to J represent demethylation events. Being the most frequent, profiles K to P indicate methylation occurrence, E and F patterns in the first case, and O and K for the latter (Table 3).
Global DNA methylation patterns of early varieties ‘Royal Dawn’, ‘Glen Red’, and ‘Kordia’, the high chilling variety, exhibited a higher rate of demethylation than methylation events during the transition from ENDO to ECO stage (Table 3). DNA demethylation was observed in all three varieties, independent of their chilling requirements. Thus, while transitioning from ENDO to ECO stage, demethylations in ‘Royal Dawn’, ‘Glen Red’, and ‘Kordia’ represented 5.8, 12.4, and 5.8%, respectively, possibly due to the fulfillment of chilling requirements to achieve bud break stage (Table 3). Similar methylation values were observed in the transition from the ENDO to ECO stage in ‘Royal Dawn’ and ‘Glen Red’ (5–5.8%), in contrast with cv. ‘Kordia’, which presented 2.5% of methylation (Table 3).
Results from the principal coordinate analysis (PCoA) of the MSAP patterns obtained from genetic variability non-methylated loci (NML) and MSL (epigenetic variability/methylated susceptible loci) [27] revealed significant differences in methylation patterns between varieties, reflected in the associated AMOVA test [PhiST = 0.5485 (p = 0.0036)]. In fact, ‘Royal Dawn’ and ‘Glen Red’ varieties with low chilling requirements are grouped separately from ‘Kordia’, which exhibits high chilling requirements, according to coordinate 1, which explained 38.8% of the total observed variation (Figure 2). Furthermore, coordinate 2 explained 27.3% of the total observed variation and might separate both low chilling requirement varieties (Figure 2). The AMOVA test of NML revealed significant differences between varieties [PhiST = 0.9677 (p = 0.0042)]. In addition, Shannon’s diversity index revealed similar values for genetic (NML) and epigenetic (MSL) diversity, corresponding to 0.620 for the former and 0.596 for the latter (Table 4). The Mantel test showed a positive correlation (r = 0.4264) between pairwise epigenetic and genetic variance. This evidence suggests that epigenetic distances based on methylation-susceptible loci, including methylated and/or demethylated bands, may explain the differences between early and late varieties during dormancy release.

3.4. Sequence Analysis of MSAP Polymorphic Fragments

A group of 24 polymorphic bands (average size 440 bp) derived from MSAP analysis of the three sweet cherry varieties was selected for sequencing. The sequencing results obtained from the analysis of eight MSAP bands isolated from the ENDO (5) and ECO (3) stages in Royal Dawn (1), Glen Red (1), and Kordia (6) are presented in Table 5. Searches for similarities with known genes and genome sequences were undertaken using the P. avium (sweet cherry) and P. persica (peach) genome databases [28,29]. At least one significant alignment of up to five was obtained (Table 5). In cases where more than one hit was obtained, all were considered possible owing to the low e-value. Differentially methylated regions (DMR), obtained through whole genome bisulfite sequencing of Royal Dawn and Kordia floral buds at the same time points, were also compared (Table 5). In some cases, DMRs agreed with the methylation status change detected by MSAP, but not in others. For instance, bands M3, M4, M6, and M7 indicated methylation status changes detected by MSAP, which coincided with the fold-change observed in DMRs (Table 5).

4. Discussion

Epigenetic mechanisms are involved in the modulation of plant growth and development, driving adaptation in response, and in diverse environmental signals [17,18,19,20,31]. DNA methylation/demethylation is important in regulating gene expression under abiotic stress conditions and in developmental processes guided by environmental stimuli such as dormancy progression. Sweet cherry is a temperate crop that requires an adequate chilling temperature during the endodormancy period, to resume normal active growth and flowering in response to warm temperatures (ecodormancy). Cytosine methylation is mediated by cytosine methyltransferases and may be inherited across generations, whereas cytosine demethylation is actively catalyzed by DNA glycosylases and passive removal by the replication process [32]. Several techniques have been used to study epigenetic regulation through DNA methylation. MSAP is a reliable and cost-effective technique that does not require the use of previous genome sequence information [15,16,17,18,19,20]. It has been used to study epigenetic changes associated with gene expression regulation and natural epigenetic variations among varieties, populations, and species [15,16,17,18,19,20,31]. In this study, the temporal changes in the methylation status of the 5’-CCGG-3’ tetra-nucleotide were evaluated using the MSAP technique in the sweet cherry floral bud genome of three varieties with contrasting chilling requirements, in two dormancy phases: endodormancy (ENDO), before chilling requirement fulfillment, and ecodormancy (ECO), once the chilling requirement was completed. The methylation profiles observed indicate progressive demethylation upon chilling requirement fulfillment. The same phenomenon was previously observed during dormancy progression in chestnuts, apples, and almonds [6,8,11]. It appears that demethylation is associated with growth resumption in plants, as other reports have described reductions in DNA methylation or demethylation associated with the triggering of differentiation programs, such as flowering [33] or active growth [34,35].
Among the genes that were hypermethylated in ECO, compared with ENDO in the high-chill variety, ‘Kordia’ is a glycosyltransferase family 61, previously shown to be responsive to gibberellin [36]. Enzymes from this family are involved in xylan backbone substitution in seed mucilage just after the previous germination [37]. Accordingly, [36] observed that this gene was downregulated during sweet cherry fruit development. Nonetheless, the reason underlying the hypermethylated state of this gene in ECO flower buds of the high-chill genotype ‘Kordia’ has yet to be unraveled.
Most of the genes identified in this study were found to be hypomethylated in ECO compared with ENDO. These results indicate that these genes are upregulated in ECO and may be related to metabolism activation and growth resumption in sweet cherry floral buds. Some of the identified genes were related to sugar metabolism and respiration processes (bands M6 and M7, Table 5), which may indicate the activation of oxidative metabolism.
A gene encoding an endo-1,4-beta-glucanase (band M5, Table 5) was non-methylated in ‘Kordia’ and ‘Royal Dawn’ at ECO, indicating that this gene may be expressed at this phase. Endoglucanases are enzymes involved in cell wall modification [38], and are upregulated in apple spur buds during floral initiation [39] and at the beginning of dormancy release and sprout phase in grapevine buds [40]. Endoglucanases are involved in cell elongation, which requires cell wall weakening and could be related to floral bud swelling during dormancy release [41].
MSAP is a modification of the amplified fragment length polymorphism (AFLP) technique [42] used to develop molecular markers without previous knowledge of genome sequences. Interestingly, MSAP can also be used to develop genetic and epigenetic markers based on methylation polymorphisms and somaclonal variation in different non-model plant species with complex genomes [43,44,45]. This is of practical importance in cultivar improvement for the development of epigenetic markers based on methylation variants that are stable in response to external stimuli. Genetic molecular markers can also be obtained by MSAP (band type I in Table 2 and methylation patterns A, B, C, and D in Table 3). In our work, both variety-specific genetic markers were identified, as well as potential epigenetic markers that could be used to determine dormancy stages in sweet cherry floral buds.
In conclusion, our main results suggest the occurrence of a progressive DNA demethylation associated with chilling accumulation during dormancy release in the three sweet cherry varieties independently of their chilling requirement. Moreover, our results suggest that epigenetic distances based on methylation-susceptible loci may contribute to the explanation of the differences between low- and high-chill varieties during dormancy release. We believe that MSAP-based (epi-)molecular markers could be developed to be used to measure cold accumulation in sweet cherry floral buds.

Supplementary Materials

The following supporting information can be downloaded at: https://www.mdpi.com/article/10.3390/horticulturae8100962/s1, Table S1: Sequences of adapters, pre-amplification, and selective amplification primers were used for MSAP analysis.

Author Contributions

Conceptualization, R.H., S.B. and A.M.A.; validation, C.M.-E.; formal analysis, G.N., C.M.-E. and K.R.; investigation, G.N., C.M.-E., E.S., K.R. and M.B.; resources, J.G., R.H., S.B., C.M. and A.M.A.; data curation, C.M.-E.; writing—original draft preparation, C.M.-E. and A.M.A.; writing—review and editing, C.M.-E., R.H. and A.M.A.; visualization, C.M.-E.; supervision, R.H., S.B. and A.M.A.; project administration, C.M. and A.M.A.; funding acquisition, A.M.A. All authors have read and agreed to the published version of the manuscript.

Funding

This research was funded by Corporación de Fomento de la Producción CORFO grant 13CTI21520-SP05 (A.M.A., C.M.), Chilean ANID Fondecyt grant 1201010 (A.M.A.), Chilean ANID/ACT210007 (A.M.A.) and Universidad Mayor internal funding grant I-2018032 (A.M.A.).

Data Availability Statement

Not applicable.

Acknowledgments

We want to thank Agrícola Garcés and Pontificia Universidad Católica de Valparaíso (PUCV) for giving us access to the plant material from their fields and José Gaete for bioinformatic analysis of transcriptome data.

Conflicts of Interest

The authors declare no conflict of interest. The funders had no role in the design of the study; in the collection, analyses, or interpretation of data; in the writing of the manuscript; or in the decision to publish the results.

References

  1. Van der Schoot, C.; Rinne, P.L. Dormancy cycling at the shoot apical meristem, Transitioning between self-organization and self-arrest. Plant Sci. 2011, 180, 120–131. [Google Scholar] [CrossRef] [PubMed]
  2. Lang, G.A. Dormancy, a new universal terminology. HortScience 1987, 22, 817–820. [Google Scholar] [CrossRef]
  3. Albuquerque, N.; García-Montiel, F.; Carrillo, A.; Burgos, L. Chilling and heat requirements of sweet cherry cultivars and the relationship between altitude and the probability of satisfying the chill requirements. Environ. Exp. Bot. 2008, 64, 162–170. [Google Scholar] [CrossRef]
  4. Castede, S.; Campoy, J.A.; Quero-García, J.; Dantec, L.L.; Lafarge, M.; Barreneche, T.; Wenden, B.; Dirlewanger, E. Genetic determinism of phenological traits highly affected by climate change in Prunus avium, flowering date dissected into chilling and heat requirements. New Phytol. 2014, 202, 703–715. [Google Scholar] [CrossRef]
  5. Campoy, J.; Darbyshire, R.; Dirlewanger, E.; Quero-Garcia, J.; Wenden, B. Yield potential definition of the chilling requirement reveals likely underestimation of the risk of climate change on winter chill accumulation. Int. J. Biometeorol. 2019, 63, 183–192. [Google Scholar] [CrossRef]
  6. Santamaría, M.E.; Hasbún, R.; Valera, M.J.; Meijón, M.; Valledor, L.; Rodríguez, J.L.; Toorop, P.E.; Cañal, M.J.; Rodríguez, R. Acetylated H4 histone and genomic DNA methylation patterns during bud set and bud burst in Castanea sativa. Plant Physiol. 2009, 166, 1360–1369. [Google Scholar] [CrossRef]
  7. Ríos, G.; Leída, C.; Conejero, A.; Badenes, M.L. Epigenetic regulation of bud dormancy events in perennial Plants. Front. Plant Sci. 2014, 5, 247. [Google Scholar]
  8. Kumar, G.; Kumari, U.; Kumar, A. Chilling-mediated DNA methylation changes during dormancy and its release reveal the importance of epigenetic regulation during winter dormancy in Apple (Malus x domestica Borkh.). PLoS ONE 2016, 11, e0149934. [Google Scholar]
  9. Rothkegel, K.; Sánchez, E.; Montes, C.; Greve, M.; Tapia, S.; Bravo, S.; Prieto, H.; Almeida, A.M. DNA methylation and small interference RNAs participate in the regulation of MADS-box genes involved in dormancy in sweet cherry (Prunus avium L.). Tree Physiol. 2017, 12, 1739–1751. [Google Scholar] [CrossRef] [Green Version]
  10. Rothkegel, K.; Sandoval, P.; Ulloa, L.; Riveros, A.; Lillo-Carmona, V.; Cáceres-Molina, J.; Almeida, A.M.; Meneses, C. Dormant but active: Chilling accumulation modulates the epigenome and transcriptome of Prunus avium during bud dormancy. Front. Plant Sci. 2021, 11, 1115. [Google Scholar] [CrossRef]
  11. Prudencio, A.S.; Werner, O.; Martínez-García, P.J.; Dicenta, F.; Ros, R.M.; Martínez-Gómez, P. DNA methylation analysis of dormancy release in almond (Prunus dulcis) flower buds using epi-genotyping by sequencing. Int. J. Mol. Sci. 2018, 19, 3542. [Google Scholar] [CrossRef] [PubMed] [Green Version]
  12. Law, J.A.; Jacobsen, S.E. Establishing; maintaining and modifying DNA methylation patterns in plants and animals. Nat. Rev. Genet. 2010, 11, 2014–2220. [Google Scholar] [CrossRef] [PubMed]
  13. Bonduriansky, R.; Crean, A.J.; Day, T. The implications of nongenetic inheritance for evolution in changing environments. Evol. Appl. 2012, 5, 192–201. [Google Scholar] [CrossRef]
  14. Avramidou, E.; Ganopoulos, I.; Doulis, A.; Tsaftaris, A.; Aravanopoulos, F. Beyond population genetics, natural epigenetic variation in wild cherry (Prunus avium). Tree Genet. Genomes 2015, 11, 95. [Google Scholar] [CrossRef]
  15. Guevara, M.Á.; de María, N.; Sáez-Laguna, E.; Vélez, M.D.; Cervera, M.T.; Cabezas, J.A. Analysis of DNA cytosine methylation patterns using methylation-sensitive amplification polymorphism (MSAP). In Plant Epigenetics. Methods in Molecular Biology; Kovalchuck, I., Ed.; Humana Press: Boston, MA, USA, 2017; Volume 1456. [Google Scholar]
  16. Cao, D.H.; Gao, X.; Liu, J.; Kimatu, J.N.; Geng, S.J.; Wang, X.P.; Zhao, J.; Shi, D.C. Methylation sensitive amplified polymorphism (MSAP) reveals that alkali stress triggers more DNA hypomethylation levels in cotton (Gossypium hirsutum L.) roots than salt stress. Afr. J. Biotechnol. 2011, 10, 18971–18980. [Google Scholar]
  17. Shan, X.; Wang, X.; Yang, G.; Wu, Y.; Su, S.; Li, S.; Liu, H.; Yuan, Y. Analysis of the DNA methylation of maize (Zea mays L.) in response to cold stress based on methylation-sensitive amplified polymorphisms. J. Plant Biol. 2013, 56, 32–38. [Google Scholar] [CrossRef]
  18. Tang, X.M.; Tao, X.; Wang, Y.; Ma, D.W.; Li, D.; Yang, H.; Ma, X.R. Analysis of DNA methylation of perennial ryegrass under drought using the methylation-sensitive amplification polymorphism (MSAP) technique. Mol. Genet. Genom. 2014, 289, 1075–1084. [Google Scholar] [CrossRef]
  19. Yu, Y.; Yang, X.; Wang, H.; Shi, F.; Liu, Y.; Liu, J.; Li, L.; Wang, D.; Liu, B. Cytosine methylation alteration in natural populations of Leymus chinensis induced by multiple abiotic stresses. PLoS ONE 2013, 8, e55772. [Google Scholar] [CrossRef] [Green Version]
  20. Bednarek, P.; Orlowska, R.; Niedziela, A. A relative quantitative methylation-sensitive amplified polymorphism (MSAP) method for the analysis of abiotic stress. BMC Plant Biol. 2017, 17, 79. [Google Scholar] [CrossRef] [Green Version]
  21. Weinberg, J.H. Chilling requirements of peach varieties. J. Am. Soc. Hortic. Sci. 1950, 56, 122–128. [Google Scholar]
  22. Richardson, E.; Seeley, S.; Walker, D. A model for estimating the completion of rest for ‘Redhaven’ and ‘Elberta’ peach trees. HortScience 1974, 9, 331–332. [Google Scholar] [CrossRef]
  23. Hasbún, R.; Iturra, C.; Moraga, P.; Wachtendorff, P.; Quiroga, P.; Valenzuela, S. An efficient and reproducible protocol for production of AFLP markers in tree genomes using fluorescent capillary detection. Tree Genet. Genomes 2012, 8, 925–931. [Google Scholar] [CrossRef]
  24. Rodríguez-López, C.; Morán, P.; Lago, F.C.; Espiñeira, M.; Beckmann, M.; Consuegra, S. Detection and quantification of tissue of origin in salmon and veal products using Methylation Sensitive AFLPs. Food Chem. 2012, 131, 1493–1498. [Google Scholar] [CrossRef]
  25. Karan, R.; DeLeon, T.; Biradar, H.; Subudhi, P. Salt stress induced variation in DNA methylation pattern and its influence on gene expression in contrasting rice genotypes. PLoS ONE 2012, 7, e40203. [Google Scholar] [CrossRef] [PubMed]
  26. Caballero, A.; Quesada, H.; Rolán-Alvarez, E. Impact of amplified fragment length polymorphism size homoplasy on the estimation of population genetic diversity and the detection of selective loci. Genetics 2008, 179, 539–554. [Google Scholar] [CrossRef] [Green Version]
  27. Pérez-Figueroa, A. Msap, a tool for the statistical analysis of methylation-sensitive amplified polymorphim data. Mol. Ecol. Resour. 2013, 13, 522–527. [Google Scholar] [CrossRef]
  28. Shirasawa, K.; Isuzugawa, K.; Ikenaga, M.; Saito, Y.; Yamamoto, T.; Hirakawa, H.; Isobe, S. The genome sequence of sweet cherry (Prunus avium) for use in genomics-assisted breeding. DNA Res. 2017, 24, 499–508. [Google Scholar] [CrossRef] [Green Version]
  29. Verde, I.; Jenkins, J.; Dondini, L.; Micali, S.; Pagliarani, G.; Vendramin, E.; Paris, R.; Aramini, V.; Gazza, L.; Rossini, L.; et al. The Peach v2.0 release: High-resolution linkage mapping and deep resequencing improve chromosome-scale assembly and contiguity. BMC Genom. 2017, 18, 225. [Google Scholar] [CrossRef] [Green Version]
  30. Krueger, F.; Andrews, S.R. Bismark: A flexible aligner and methylation caller for bisulfite-seq applications. Bioinformatics 2011, 27, 1571–1572. [Google Scholar] [CrossRef] [Green Version]
  31. Bird, A. DNA methylation patterns and epigenetic memory. Genes Dev. 2002, 16, 6–21. [Google Scholar] [CrossRef] [Green Version]
  32. Zhang, M.; Kimatu, J.N.; Xu, K.; Liu, B. DNA cytosine methylation in plant development. J. Genet. Genom. 2010, 37, 1–12. [Google Scholar] [CrossRef]
  33. Zluvova, J.; Janousek, B.; Vyskot, B. Immunohistochemical study of DNA methylation dynamics during plant development. J. Exp. Bot. 2001, 52, 2265–2273. [Google Scholar] [CrossRef] [PubMed]
  34. Steimer, A.; Schob, H.; Grossniklaus, U. Epigenetic control of plant development, new layers of complexity. Curr. Opin. Plant Biol. 2004, 7, 11–19. [Google Scholar] [CrossRef]
  35. Valledor, L.; Hasbún, R.; Meijón, M.; Rodríguez, J.L.; Santamaría, E.; Viejo, M.; Berdasco, M.; Feito, I.; Fraga, M.; Cañal, M.J.; et al. Involvement of DNA methylation in tree development and micropropagation. Plant Cell Tissue Organ Cult. 2007, 91, 75–86. [Google Scholar] [CrossRef]
  36. Kuhn, N.; Maldonado, J.; Ponce, C.; Arellano, M.; Time, A.; Multari, S.; Martens, S.; Carrera, E.; Donoso, J.M.; Sagredo, B.; et al. RNAseq reveals different transcriptomic responses to GA3 in early and midseason varieties before ripening initiation in sweet cherry fruits. Sci. Rep. 2021, 11, 13075. [Google Scholar] [CrossRef] [PubMed]
  37. Phan, J.L.; Tucker, M.R.; Khor, S.F.; Shirley, N.; Lahnstein, J.; Beahan, C.; Bacic, A.; Burton, R.A. Differences in glycosyltransferase family 61 accompany variation in seed coat mucilage composition in Plantago spp. J. Exp. Bot. 2016, 67, 6481–6495. [Google Scholar] [CrossRef] [Green Version]
  38. Cosgrove, D.J. Plant cell wall extensibility, connecting plant cell growth with cell wall structure; mechanics; and the action of wall-modifying enzymes. J. Exp. Bot. 2016, 67, 463–476. [Google Scholar] [CrossRef] [Green Version]
  39. Kofler, J.; Milyaev, A.; Würtz, B.; Pfannstiel, J.; Flachowsky, H.; Wünsche, J.-N. Proteomic differences in apple spur buds from high and non-cropping trees during floral initiation. J. Proteom. 2022, 253, 104459. [Google Scholar] [CrossRef] [PubMed]
  40. Shangguan, L.; Chen, M.; Fang, X.; Xie, Z.; Gong, P.; Huang, Y.; Wang, Z.; Fang, J. Comparative transcriptome analysis provides insight into regulation pathways and temporal and spatial expression characteristics of grapevine (Vitis vinifera) dormant buds in different nodes. BMC Plant Biol. 2020, 20, 390. [Google Scholar] [CrossRef]
  41. Shani, Z.; Dekel, M.; Roiz, L.; Horowitz, M.; Kolosovski, N.; Lapidot, S.; Alkan, S.; Koltai, H.; Tsabary, G.; Goren, R.; et al. Expression of endo-1;4-beta-glucanase (cel1) in Arabidopsis thaliana is associated with plant growth; xylem development and cell wall thickening. Plant Cell Rep 2006, 25, 1067–1074. [Google Scholar] [CrossRef]
  42. Vos, P.; Hogers, R.; Bleeker, M.; Reijans, M.; van de Lee, T.; Hornes, M.; Friters, A.; Pot, J.; Paleman, J.; Kuiper, M.; et al. AFLP: A new technique for DNA fingerprinting. Nucleic Acids Res. 1995, 23, 4407–4414. [Google Scholar] [CrossRef] [Green Version]
  43. Kaity, A.; Ashmore, S.E.; Drew, R.A.; Duloo, M.E. Assessment of genetic and epigenetic changes following cryopreservation in papaya. Plant Cell Rep. 2008, 27, 1529–1539. [Google Scholar] [CrossRef] [PubMed]
  44. López, C.M.R.; Wetten, A.C.; Wilkinson, M.J. Progressive erosion of genetic and epigenetic variation in callus-derived cocoa (Theobroma cacao) plants. New Phytol. 2010, 186, 856–868. [Google Scholar] [CrossRef] [PubMed]
  45. Landey, R.B.; Cenci, A.; Georget, F.; Bertrand, B.; Camayo, G.; Dechamp, E.; Herrera, J.C.; Santoni, S.; Lashermes, P.; Simpson, J.; et al. High genetic and epigenetic stability in Coffea arabica plants derived from embryogenic suspensions and secondary embryogenesis as revealed by AFLP, MSAP and the phenotypic variation rate. PLoS ONE 2013, 8, e56372. [Google Scholar]
Figure 1. Representative gel image of MSAP analysis of polymorphic fragments observed among sweet cherry varieties Royal Dawn, Glen Red and Kordia, during ENDO and ECO stages. Lane 1 and 14: ladder; lanes 2 and 3: Royal Dawn, at ENDO and ECO stages, respectively, digested with EcoRI–HpaII; lanes 4 and 5: Glen Red, at ENDO and ECO stages, respectively, digested with EcoRI–HpaII; lanes 6 and 7: Kordia, at ENDO and ECO stages, respectively, digested with EcoRI–HpaII; lanes 8 and 9: Royal Dawn, at ENDO and ECO stages, respectively, digested with EcoRI–MspI; lanes 10 and 11: Glen Red, at ENDO and ECO stages, respectively, digested with EcoRI–MspI; lanes 12 and 13: Kordia, at ENDO and ECO stages, respectively, digested with EcoRI–MspI. The arrow marks indicate the presence of polymorphic fragments, obtained using the combination of selective primers ATA/TCG.
Horticulturae 08 00962 g001
Figure 2. Principal coordinates analyses (PCoA) based on epigenetic diversity (MSL) observed in MSAP analysis of three sweet cherry varieties with contrasting chilling requirements.
Horticulturae 08 00962 g002
Table 1. Determination of dormancy stages of sweet cherry varieties analyzed in this study at different chilling hours (CH) accumulation.
StagesBudbreak (%)‘Royal Dawn’‘Glen Red’‘Kordia’
ENDO0%173 CH173 CH1127 CH
ECO≥50%516 CH684 CH1637 CH
ENDO = endodormancy, ECO = ecodormancy.
Table 2. Changes in DNA methylation patterns in floral buds of ‘Royal Dawn’, ‘Glen Red’, and ‘Kordia’ sweet cherry varieties at endodormancy (ENDO) and ecodormancy (ECO).
‘Royal Dawn’‘Glen Red’‘Kordia’
Band Types (Quantity)ENDOECOENDOECOENDOECO
Type I656555677276
Type II232427192020
Type III131320131411
Type IV201919221514
Total methylation (%)46.346.354.544.640.537.1
Fully methylated bands (%)27.226.432.228.923.920.6
Hemi-methylated bands (%)19.019.822.315.716.516.5
Total methylation ratio = ratio (%) = [(II + III + IV)/(I + II + III + IV)] × 100. Fully methylated ratio (%) = [(II + III)/(I + II + III + IV)] × 100%. Hemimethylated (%) = [(IV))/(I + II + III + IV)] × 100.
Table 3. DNA methylation patterns in floral buds of ‘Royal Dawn’, ‘Glen Red’ and ‘Kordia’ sweet cherry varieties during endodormancy (ENDO) to ecodormancy (ECO) transition.
Banding PatternBands Detected
ENDOECO‘Royal Dawn’‘Glen Red’‘Kordia’
HpaIIMspIHpaIIMspIENDO/ECOENDO/ECOENDO/ECO
No changes
A1111605571
B1010111010
C0101191813
D0000181613
108 (89.2 *)99 (95.8)111 (91.7)
Demethylation
E1011134
F0111460
G0011001
H0110000
7 (5.8)15 (12.4)7 (5.8)
Methylation
K1110101
L1101301
M1001110
N1100100
O1000060
P0100001
6 (5)7 (5.8)3 (2.5)
* Frequency in % is shown between brackets.
Table 4. Analysis of genetic (NML) and epigenetic diversity (MSL) of ‘Royal Dawn’, ‘Red Glen’ and ‘Kordia’ varieties, considering endodormancy (ENDO) and ecodormancy (ECO) stages. # MSL and # NML represent, respectively, the number of methylation-sensitive loci and non-methylated loci.
Shannon Index
Stages# MSL# NML% Polym MSL% Polym NMLMSLNML
ENDO616041220.6410.637
ECO487344220.6500.637
All stages665535110.5960.620
Table 5. List of sequenced MSAP bands identified at ENDO and ECO stages, isolated from sweet cherry varieties at different chilling hours (CH) accumulation. The banding pattern categories are described according to Karan et al., 2012.
BandsSelective Primers CombinationMethylation Status Change Detected by MSAPVarietyGene IDProbable FunctionE-ValueDifferential Methylated Regions (DMR) Fold Change (FC)
Methylation Pattern *ENDOECO Royal Dawn 516 CH vs. 0Kordia 1637 CH vs. 0
M1ATA/TCCANnon-methylatedmethylatedKordiaPav_sc0000350.1_g1030.1.mkGlycosyltransferase 61. Gibberelin-regulated protein 9. uncharacterized protein LOC18787986 [Prunus persica] &gt; gi|1139755066|gb|ONH90523.1| hypothetical protein PRUPE_8G059200 [Prunus persica]0na na
M2ATA/TCCACmethylatedmethylatedRoyal DawnPav_sc0002774.1_g020.1.brPREDICTED: uncharacterized protein LOC1033310761.75 × 10−43−2.18na
Pav_sc0000008.1_g540.1.brhypothetical protein PRUPE_ppa020796mg1.75 × 10-43−1.72na
Pav_sc0000287.1_g500.1.bruncharacterized protein LOC103336567 2.91 × 10⁻²⁸−2.66na
M3ACT/TCCAGmethylatednon-methylatedKordiaPav_sc0000507.1_g110.1.mk No description 3.50 × 10 −111.871.01
M4ACG/TAGFmethylatednon-methylatedKordiaPav_sc0001502.1_g550.1.brcyclic nucleotide-gated ion channel 1-like 3.62094 × 10−08−1.97na
M5ACG/TAGAnon-methylatednon-methylatedKordiaPav_sc0000131.1_g230.1.mkEndo-1,4-beta-glucanase01.56na
M6ACG/TAGJmethylatedhemimethylatedGlen RedPav_sc0005790.1_g010.1.brPREDICTED: probable serine/threonine-protein kinase abkC1.66 × 10 −591.10−2.99
Pav_sc0005156.1_g020.1.brPREDICTED: tether containing UBX domain for GLUT41.66 × 10 −59−2.95na
Pav_sc0000323.1_g460.1.mkPyruvate kinase, cytosolic isozyme OS = Nicotiana tabacum PE = 2 SV = 18.94 × 10−36na−3.06
M7ACG/TAGCmethylatedmethylatedKordiaPav_sc0005790.1_g010.1.brPREDICTED: probable serine/threonine-protein kinase abkC1.84 × 10−441.10−2.99
Pav_sc0005156.1_g010.1.mkPREDICTED: tether containing UBX domain for GLUT41.84 × 10 −44−2.95na
Pav_sc0000323.1_g460.1.mkPyruvate kinase, cytosolic isozyme OS = Nicotiana tabacum PE = 2 SV = 16.93 × 10 −33na−3.06
M8ATA/TCGBmethylatedmethylatedKordiaPav_sc0000933.1_g020.1.brpredicted protein 4.54 × 10 −1503.69−1.13
Pav_sc0001012.1_g020.1.brPREDICTED: uncharacterized protein LOC1033284174.54 × 10−150−1.39−1.11
* According to methylation patterns shown in Table 3. na: indicates not available information.
Publisher’s Note: MDPI stays neutral with regard to jurisdictional claims in published maps and institutional affiliations.

