Article

Foliar Application of ZnO-NPs Influences Chlorophyll Fluorescence and Antioxidants Pool in Capsicum annum L. under Salinity

by
Farzad Rasouli
1,*,
Mohammad Asadi
2,
Mohammad Bagher Hassanpouraghdam
1,
Mohammad Ali Aazami
1,
Asghar Ebrahimzadeh
1,
Karim Kakaei
3,
Libor Dokoupil
4,* and
Jiri Mlcek
5
1
Department of Horticulture, Faculty of Agriculture, University of Maragheh, Maragheh 55187-79842, Iran
2
Department of Plant Production and Genetics, Faculty of Agriculture, University of Maragheh, Maragheh 55187-79842, Iran
3
Department of Chemistry, Faculty of Science, University of Maragheh, Maragheh 55187-79842, Iran
4
Department of Breeding and Propagation of Horticultural Plants, Faculty of Horticulture, Mendel University in Brno, Valtická 337, 69144 Lednice, Czech Republic
5
Department of Food Analysis and Chemistry, Faculty of Technology, Tomas Bata University in Zlín, Vavreckova 5669, 76001 Zlín, Czech Republic
*
Authors to whom correspondence should be addressed.
Horticulturae 2022, 8(10), 908; https://doi.org/10.3390/horticulturae8100908
Submission received: 4 September 2022 / Revised: 27 September 2022 / Accepted: 30 September 2022 / Published: 5 October 2022

Abstract

:
Zinc oxide nanoparticles (ZnO-NPs) have been proven to helpfully improve plant tolerance to several abiotic stresses. However, no information has been reported concerning the role of ZnO-NPs on pepper plants under salinity stress. Hence, this research aimed to evaluate the growth and physiological responses of pepper (Capsicum annum L.) plants to ZnO-NP foliar application under salinity. Plants were subjected to 0 (control), 25 (S1), 50 (S2), and 75 mM (S3) NaCl salinity with a foliar spray of 0, 1000, and 2000 ppm ZnO-NPs. Significant reductions were recorded in the chlorophyll index (SPAD) and chlorophyll fluorescence parameters, and in the activity and/or ratios of reduced ascorbate (AsA), reduced ascorbate/dehydroascorbic acid (AsA/DHA), reduced glutathione (GSH), reduced glutathione/oxidized glutathione (GSH/GSSG), and K+ content. There was a significant increase in proline content, electrolyte leakage (EL), H2O2 content, guaiacol peroxidase (GPX), ascorbate peroxidase (APX), superoxide dismutase (SOD), glutathione reductase (GR), dehydroascorbic acid (DHA), and oxidized glutathione (GSSG) activities, and in Na+ content and Na+/K+ ratio. Foliar treatments improved the salinity tolerance of the pepper plants by fortifying the antioxidant defense system, leaf fluorescence parameters, K+, and proline content, and in contrast, by decreasing the EL, Na+, and H2O2 levels. ZnO-NP foliar treatment efficiently improved the pepper plants’ physiological responses under salinity. Considering the overall results, 1000 ppm of ZnO-NPs would be advisable for the amelioration of salinity depression and to promote growth potential. However, at higher levels, the nanoparticle showed toxicity symptoms that limited its reliable applications.

1. Introduction

Salinity stress is affecting crops in several ways; for example: osmotic tensions, ions toxicity, and disorders in the nutritional, biochemical, and photosynthesis attributes [1]. The adverse effects of salinity on plants depends upon the genotype, plant growth phase, and environmental signals [2]. Plants under saline-prone environments are facing two obstacles: the problems in the absorption of water from the soil despite the negative osmotic potential arising from the presence of salts and the elevated concentrations of ions such as Na+, CO32−, SO42−, and Cl1− [3]. Plants undergo diverse defense mechanisms facing salt stress by modifying their molecular, biochemical, nutritional, and physiological responses. Alterations occur in the enzymatic and non-enzymatic antioxidant compounds dynamics, compatible solutes amounts, ions hemostasis, osmotic regulation, hormonal balance, and even at the gene expression levels [4,5].
The chlorophyll fluorescence assay is a well-known technique in plant physiology to attain reliable data about the photosystem II state in a relatively feasible manner, which has a key role in crop responses to the environmental stimuli [6]. An influential technique for assessing the impact of salinity stress on photosynthetic traits is evaluating the initial fluorescence (F0), maximum fluorescence (Fm), their (F0 and Fm) difference (Fv), the maximum primary photochemical yield of photosystem II (Fv/F0), and maximum quantum yield of photosystem II (Fv/Fm) [7,8]. Fluorescence monitoring in the range of 380–750 nm; delivers information on the localization type, and contents of special fluorophores, containing chlorophyll (Chl) molecules [9].
One of the most important reasons for the diminished growth potential, especially under the saline conditions, might be a sharp decrease in photosynthesis potential [10]. The chlorophyll fluorescence and its features are extremely susceptible to alterations in photosynthesis, which can be measured with high accuracy. The trapped solar energy in the shape of exciting electrons of pigment molecules can be transported from energy antennae to photosynthetic reaction systems, where they stimulate biochemical pathways [11]. Salinity impacts the photosynthetic pathways, especially photosystem II (PS II) potential. Photosynthetic capabilities and the salinity tolerance can be evaluated by chlorophyll fluorescence indices (e.g., Fv/Fm) [12]. Environmental cues which enhance the Na+ and Cl amounts in cells generally reduce K+ content leading to the partial deactivation of photosystem I (PS I) and PS II. The limitation can also happen in the electron transport chain [13]. The high accumulation of toxic ions in the chloroplast under salinity impairs the electron transport chain and photophosphorylation rate in the thylakoid membranes [14].
Zinc is a vital micronutrient essential for diverse metabolic pathways in plants. Zinc mediates several enzyme activities and is a core cation in some biochemical reactions such as photosynthetic pigments and carbohydrates biosynthesis [15,16]. Zinc surpasses Na over uptake under salinity by affecting the cell membrane’s integrity [17]. Moreover, zinc performs a role in reducing Na accumulation and enhancing the K+/Na+ ratio in plants under salinity [18,19]. In contrast, Zn deficiency leads to the accumulation of harmful ions such as Na+ and Cl. It should be considered that the joint effects of salinity and Zn-deficiency on the plants’ growth and productivity are in need of more in-depth investigation [20]. Zn foliar application improved the growth responses and yield of several plants under salinity. Moreover, Zn treatment enhanced RWC and chlorophyll biosynthesis under saline conditions. In addition, Zn foliar treatment reduced lipid peroxidation, H2O2 content, and the membrane damage in salinity-exposed plants [21].
Nanoparticles (NPs) are able to mediate plant physiological processes [22] and may ameliorate the adverse consequences of stressor effects. Through a tiny particle size and a greater surface area, Zn-NPs are used as fertilizer in plant production systems. Using micronutrients as NPs is a valuable procedure to nourish the plants gradually in an organized way, to escape the troubles of soil pollution triggered by the overuse of chemical fertilizers [23]. Reynolds [24] noted that micronutrients as NPs are able to be used in plant production systems. Zn keeps a prominent role in the survival of plants under saline environments. However, NPs can be dangerous at high concentrations [25]. ZnO-NPs are the frequently utilized nanomaterials in plant nutrition protocols. Since ZnO is more soluble compared to other oxide NPs, its possible toxic impacts can be attributed to the higher dissolved ionic Zn ions [26]. According to the report of Kahru and Dubourguier [27], ZnO can be a harmful nanomaterial if applied with higher than 50 mg L−1 [28].
Pepper (Capsicum annuum L.) is an annual vegetable from the family Solanaceae under grown in temperate and tropical climates around the world [29]. Green bell pepper is a source of several nutrients and vitamins in the human diet and is consumed fresh or in processed food products [30].
Owing to the ameliorative role of Zn application to smoothen the damaging effects of salinity stress, ZnO-NPs have the enhanced Zn entry into plant cells and, therefore, increase the plant’s growth and productivity. Consequently, ZnO-NPs were synthesized and applied on pepper plants in the hope to ameliorate the adverse effects of salinity, which has not been reported so far. This research aimed to study the antioxidants’ pool and chlorophyll fluorescence parameters under salinity in response to the ZnO-NP foliar treatment.

2. Materials and Methods

2.1. Plant Material and Growth Conditions

The Capsicum annum cv. California Wonder seeds were supplied by Pakan Bazr seed Company, Isfahan, Iran. The seeds were planted in a greenhouse under 25 ± 5 °C and 75 ± 10% relative humidity. Seedlings were fed with the modified Hoagland’s nutrient solution including (0.47 g·L−1) calcium nitrate, 0.3 g·L−1 potassium nitrate, 0.25 g·L−1 magnesium sulfate, 0.06 g·L−1 phosphate dihydrogen ammonium, 0.1 g·L−1 Chelate Fe-EDDHA, 2.86 mg·L−1 boric acid, 1.81 mg·L−1 manganese chloride, 0.22 mg·L−1 zinc sulfate, 0.08 mg·L−1 copper sulfate, and 0.02 mg·L−1 sodium molybdate. The pH of the nutrient solution was adjusted at 6 with KOH (0.1 N). The young plants were transferred to 5 L pots filled with soil. The salinity treatments were applied in the six-leaf stage. The soil was sandy clay loam with a pH of 8.1, 1.23% organic carbon, 0.09% total N, 11.05, 570.85, 1.16, and 1.02 mg·kg−1 of available P, K, Zn, and Fe, respectively. The completely randomized design (CRD) was performed as a two-way factorial experiment with four levels of salinity and three levels of ZnO-NPs. NaCl salinity was applied at four levels, 0 mM (1.55 ds·m−1), 25 mM (4.43 ds·m−1), 50 mM (6 ds·m−1), and 75 mM (8.3 ds·m−1), which were presented as S1, S2, S3, and S4. The NaCl solution was applied with irrigation water and 300–500 mL was used based on the growth stage of the pepper plants. In this experiment, tap water was used for watering. The foliar ZnO-NP treatments were applied (1000 and 2000 ppm) three times every other week and 100 mL per plant. For the control, plants were treated with distilled water and nourished with tap water. The plants were harvested 60 days after transplanting and some parameters such as electrolyte leakage were measured immediately after harvesting, and for assessing the other traits, the leaves were frozen instantly in liquid nitrogen and stored at −80 °C and then analyzed for 30 days after harvesting or dried for element determination.

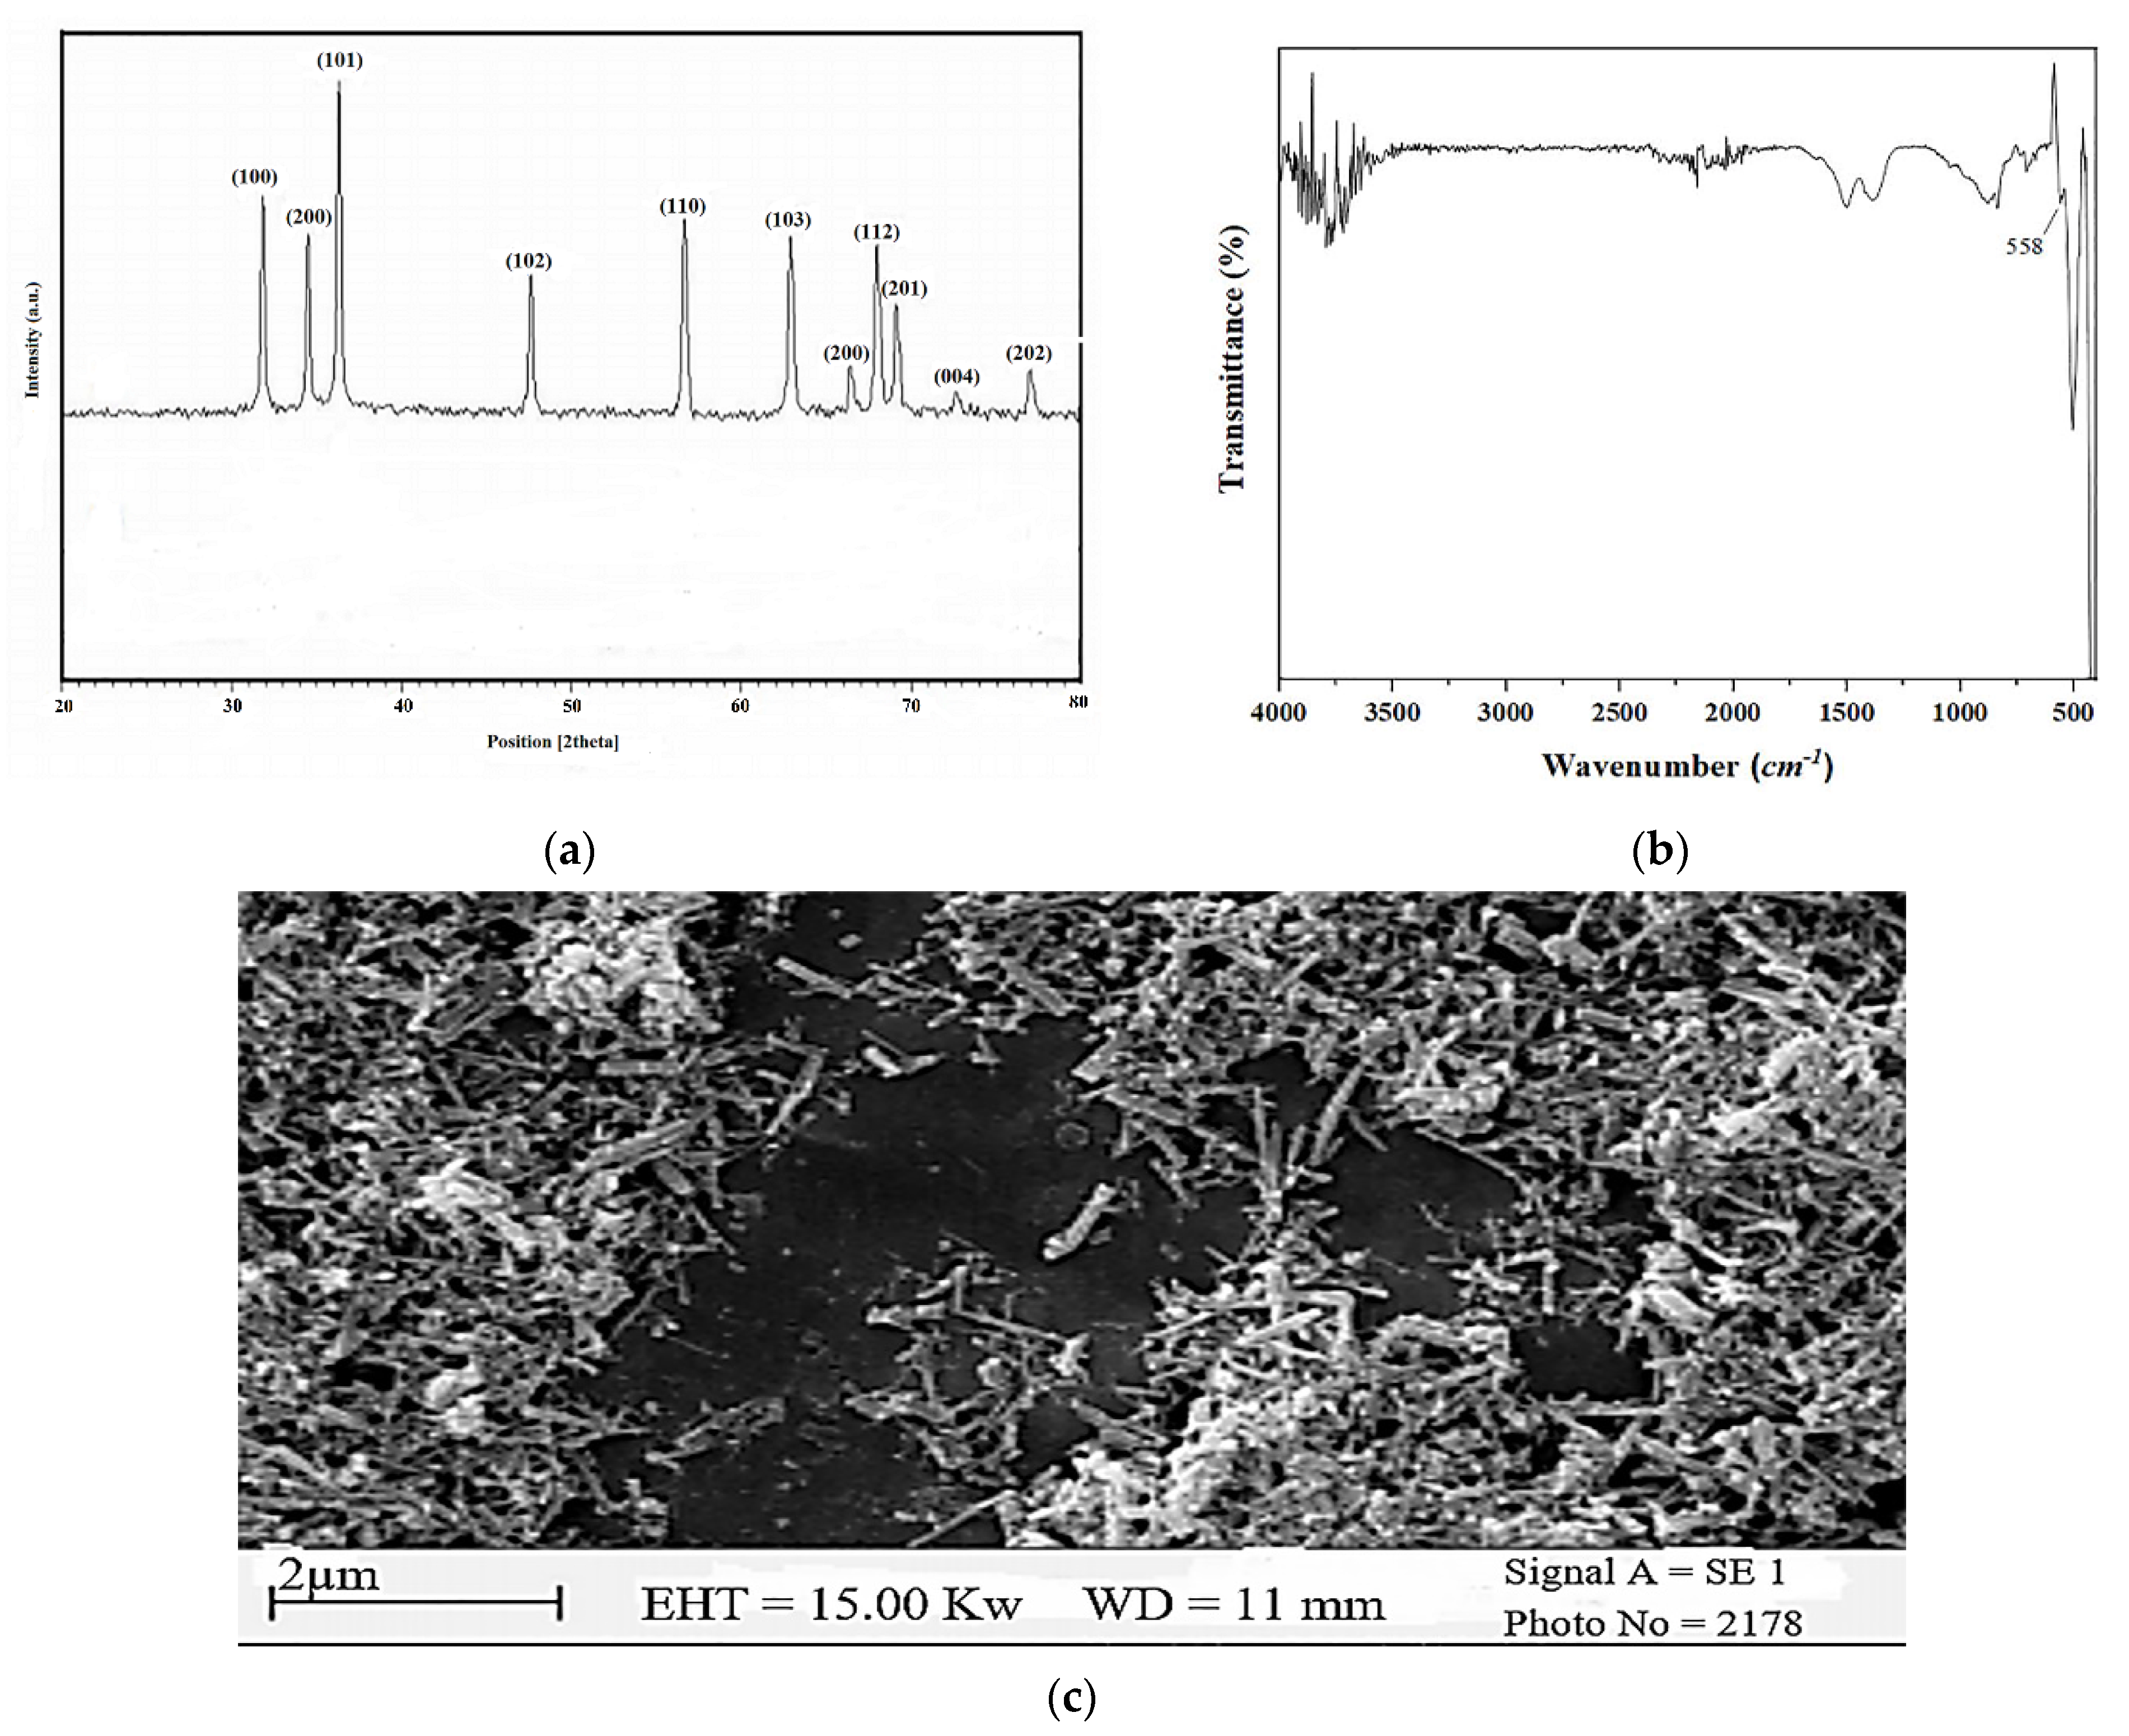
2.2. Preparation of ZnO-NPs

ZnO-NPs were synthesized in an aqueous medium by the direct deposition method; which is to dissolve ammonium carbonate and zinc nitrate in distilled water to reach a clear solution. To prepare the precursor, 50 mM of zinc nitrate solution was slowly poured on to 50 mM of ammonium carbonate in a high-speed stirrer over 30 min. Initially, a white deposit and later, a clear solution was obtained. Stirring continued until reaching a supersaturated solution. The precipitate was removed from the solution by filtration. The separated solid precipitate was washed several times using ethanol and distilled water. The final precipitate was then dried at 100 °C. The resulting precursor was calcined at temperatures above 250 °C to give rise to zinc oxide nanoparticles.

XRD Spectrum, FT-IR Spectrum, and FE-SEM Images

X-ray diffraction (XRD) patterns of Zn nanoparticles were acquired on a Siemens D-500 X-ray diffractometer (λ = 1.54 A° (CuKα); current of 30 mA; voltage of 35 kV. The XRD pattern of the synthesized nanoparticles is shown in (Figure 1a). The peaks appearing at 2θ = 31.8°, 34.3°, 36.2°, 47.2°, 56.6°, and 62.8° are related to the reflection from (100), (002), (101), (102), (116), and (103) crystal planes of the hexagonal zinc oxide nanoparticles. The results are in agreement with the JCPDS data [31].
The Fourier transform infrared (FT-IR) spectrum of Zn nanoparticles was recorded using a FT-IR spectrometer (PerkinElmer, L1600300 Spectrum TWO LiTa, Llantrisant, UK). Figure 1b shows the FT-IR spectrum of the synthesized ZnO nanoparticles (Figure 1b). The characteristic band of ZnO nanoparticles appearing at 558 cm−1 belongs to the Zn-O stretching vibration.
The surface morphology of Zn nanoparticles was analyzed by scanning electron microscopy (VEGAII, XMU, Brno, Czech Republic). Figure 1c shows the FE-SEM image of ZnO nanoparticles.

2.3. Chlorophyll Index

The SPAD-502 meter (Konica, Minolta, Japan) was utilized to estimate the leaf chlorophyll index. A relative SPAD index (ranging from 0–99) was obtained in the fully expanded young leaves [32].

2.4. Measurement of Chlorophyll Fluorescence Parameters

Chlorophyll fluorescence indices were recorded on three fully expanded young leaves in the middle portion of shoots using a pulse amplitude modulation fluorometer (PAM-2500, Heinz Walz, Effeltrich, Germany). The data were recorded whenever the plants were adapted in the dark for 20 min, and later, the data were analyzed by PamWin-3 software as described in detail by Maxwell and Johnson [12]. The parameters included: the minimum value for chlorophyll fluorescence (F0), the maximal possible fluorescence value (Fm), the difference between F0 and Fm (Fv), the maximal quantum yield of PS II (Fv/Fm), and the non-photochemical quantum efficiency of PSII Y(NO).

2.5. Na+ and K+ Concentration

The content of Na+ and K+ was assessed by the flame photometric assessment (Flame Photometer 410, Sherwood, UK) as described by Ghosh [32]. The Na+/K+ ratio was calculated accordingly.

2.6. Proline

Proline content was traced by Bates et al. [33]. The reaction mixture contained 2 mL of extract, 2 mL of ninhydrin reagent, and 2 mL of glacial acetic acid. Absorbance was recorded at 520 nm (UV-1800 Shimadzu, Kyoto, Japan), and reported as μmol·g−1 FW.

2.7. H2O2 Content

For measurement of H2O2 content, 0.5 g of leaf fresh tissue and 5 mL of ice cooled trichloroacetic acid (0.1% w/v) were centrifuged at 11,180× g during 20 min. A total of 500 μL supernatant was added to 500 μL potassium phosphate buffer (pH 6.8, 10 mM) and, 1000 μL potassium iodide (1 M). The mixture absorbance was recorded at 390 nm. H2O2 content was presented as μmol·g−1 FW [34].

2.8. Electrolyte Leakage (EL)

Leaf discs of 0.5 cm diameter from the fully expanded leaves were washed three times with distilled water and incubated in the ambient temperature (24 h) to measure the primary electrical conductivity (EC1) by a conductivity meter (Hanna Instrument (HI 8033, Inc., Woonsocket, RI, USA) [35]. The samples were incubated in a water bath of 95 °C for 20 min and then cooled down to 25 °C. The final electrical conductivity (EC2) was recorded. EL was calculated by the following equation.
EL (%) = (EC1/EC2) ∗ 100

2.9. Enzymatic Antioxidants Activity

2.9.1. Guaiacol Peroxidase (GPX)

A total of 0.5 g of leaf fresh tissue was homogenized with potassium phosphate buffer (pH = 6.8, 100 mM) containing EDTA (4 mM) and 1% PVP and then centrifuged at 11,180× g for 20 min. The GPX activity was calculated at 470 nm based on the extinction coefficient of tetraguaiacol (25.5 mmol−1·cm−1) and expressed as U·mg−1 protein or μM·mL−1·min−1·mg−1 protein [36].

2.9.2. Superoxide Dismutase Activity (SOD)

SOD activity was traced by its ability to prevent the photochemical reduction of nitro-blue-tetrazolium (NBT) [37]. The reaction mixture included 1.5 mM Na2CO3, 100 mM Na phosphate buffer (pH = 7.6), 3 mM EDTA, 0.2 mM methionine, 60 μM riboflavin, 2.25 mM NBT, and 100 μL of the extract. The reaction mixture was treated at 25 °C for 15 min under light and finally, the absorbance was recorded at 560 nm.

2.9.3. Ascorbate Peroxidase Activity (APX)

The reaction mixture contained: 100 mM phosphate buffer (pH = 7.6, EDTA), 2 mM H2O2, 0.5 mM sodium ascorbate, and 50 μL of the extract. The absorbance was recorded at 290 nm for 120 s, and APX activity was calculated by the extinction coefficient of ascorbate (2.8 mmol−1·cm−1), The result was reported as U·mg−1 protein or μM·mL−1·min−1·mg−1 protein [38].

2.9.4. Glutathione Reductase (GR) Activity

Glutathione reductase activity was monitored by a reaction mixture of 200 mM phosphate buffer (pH = 7.5), 6.3 mM EDTA, 3 mM 5,5′-dithiobis-2-benzoic acid or DTNB dissolved in phosphate buffer, 2 mM NADPH, and 100 μL of the extract. The reaction was activated with 2 mM glutathione oxide. The absorbance was recorded at 412 nm for 60 s. GR activity was recorded as extinction coefficient for DTNB (14.15 mmol−1·cm−1) and reported as U·mg−1 protein or μM·mL−1·min−1·mg−1 protein [39].

2.10. Non-Enzymatic Antioxidants Assay

2.10.1. Ascorbate (AsA) Assay

A total of 1 mL of metaphosphoric acid was employed to reach a homogenized leaf tissue extract. AsA concentration was monitored via extraction by 150 μM phosphate buffer (pH = 7.4) and 200 μL of distilled water. Later, 400 μL of 10% trichloroacetic acid, 400 μL of 44% phosphoric acid, 400 μL of 4% bipyridyl in 70% ethanol, and 200 μL of 3% FeCl3 were added. The mixture was incubated at 40 °C in dark for 40 min. Finally, the absorbance was recorded at 525 nm. The reduced AsA was quantified in the same way as the previous procedure, replacing 0.1 mL of DTT with 0.1 mL of distilled H2O. Finally, the dehydroascorbate (DHA) concentration was deduced from the difference between total AsA and reduced AsA, and expressed as nmol·g−1 FW [40].

2.10.2. Glutathione

The leaf tissue was homogenized in 2 mL of 5% sulfosalicylic acid solution and then centrifuged at 25,155× g for 10 min. Amounts of 700 μL of 0.3 mM NADPH, 100 μL of DTNB, 150 μL of 125 mM phosphate buffer (pH 6.5) containing EDTA (6.3 mM) were mixed with 50 μL of the supernatant and triethanolamine. Finally, total glutathione content was measured in the same reaction mixture with the addition of 0.1 unit of glutathione reductase enzyme. The absorbance was recorded at 412 nm. The concentration of total glutathione, GSH, and GSSG was expressed as nmol·g−1 FW [41].

2.11. Statistical Analysis

Analysis of variance (ANOVA) was conducted using MSTAT-C ver 2.1. The significant differences among means were compared with the least significance difference test (LSD) at p < 0.05. Pearson correlation and cluster dendrogram heat maps were depicted in R software for statistical computing. R foundation for statistical computing (version 4.1.2), Iran (2021). URL https://cran.um.ac.ir/ (release in 23 June 2022). R packages of ‘corrplot’ (Visualization of a Correlation Matrix, version 0.91; https://github.com/taiyun/corrplot release in 23 June 2022) and ‘gplots’ (Various R Programming Tools for Plotting Data, version 3.1.1; https://github.com/talgalili/gplots/issues release in 23 June 2022) were used.

3. Results

3.1. Chlorophyll Fluorescence Parameters

The results revealed the significant effects (p ≤ 0.05) of salinity on the SPAD index (Table 1). Salt stress induced a meaningful diminution in the leaf SPAD index. The interaction of NaCl and ZnO-NPs was also significant on the trait. Initially, ZnO-NPs significantly increased the SPAD values under salinity stress followed by a marked decrease in a higher concentration of ZnO-NPs. The highest SPAD index was recorded in 25 mM of NaCl × 1000 ppm of ZnO-NPs, while the lowest recorded was in 75 mM of NaCl × 2000 ppm of ZnO-NPs (Table 1).
The maximal possible fluorescence value (Fm) was statistically (p ≤ 0.05) decreased by salinity. The highest and the lowest Fm values were observed in 1000 ppm ZnO-NPs without salinity and 75 mM of NaCl × 2000 ppm of ZnO-NPs, respectively (Table 1).
F0 (p ≤ 0.05) increased with salinity stress and a high concentration of ZnO-NP foliar application. The highest F0 belonged to the plants supplemented with 2000 ppm of ZnO-NPs under 75 mM NaCl and, the lowest was recorded at 1000 ppm of ZnO-NPs with no salinity (Table 1).
The difference between F0 and Fm (Fv) significantly decreased with NaCl and ZnO-NPs (2000 ppm), while its values were improved at 1000 ppm of ZnO-NPs. The highest recorded data for Fv were in 25 mM NaCl × 1000 ppm ZnO-NPs (Table 1).
Salinity and ZnO-NP foliar uses affected the Fv/Fm ratio. The data were reduced by ZnO-NPs at 1000 ppm. The highest Fv/Fm value was recorded in 25 mM of NaCl × 2000 ppm of ZnO-NPs. In contrast, the least value was recorded in 75 mM NaCl × 2000 ppm ZnO (Table 1).
Salinity (p ≤ 0.05) enhanced the unregulated non-photochemical quantum efficiency of PS II, Y (NO). In addition, salinity × ZnO-NP treatment combinations significantly increased Y (NO). The highest amount of Y(NO) was obtained in 2000 ppm of ZnO × 75 mM of NaCl, and the lowest belonged to the control (Table 1).

3.2. Ionic Homeostasis
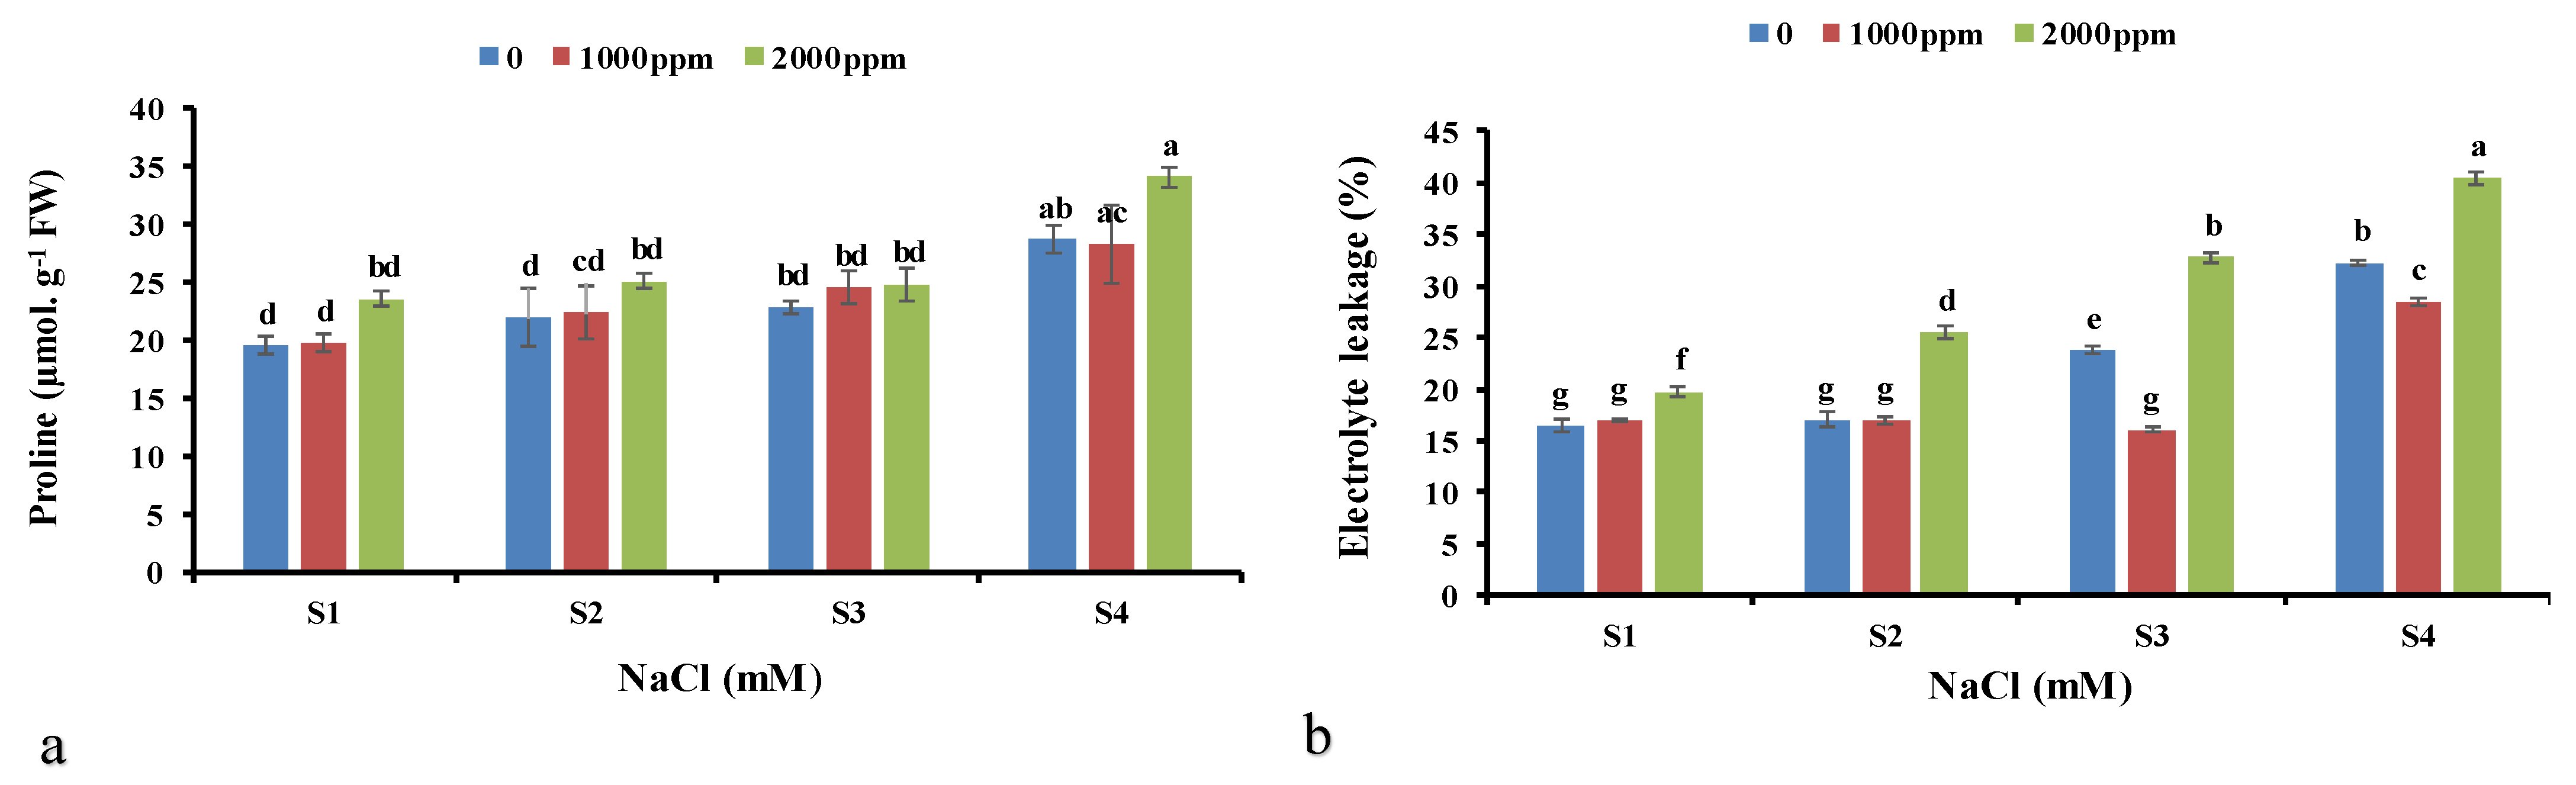
The high salinity levels significantly reduced K+ content, but increased Na+ accumulation, and the Na+/K+ ratio in the shoots (p ≤ 0.05). The highest Na+ concentration was recorded in 75 mM of NaCl, while the lowest was determined at 1000 ppm ZnO-NPs without salinity exposure. K+ concentrations increased in pepper plants foliar treated with 1000 and 2000 ppm of ZnO-NPs under the no-saline and in 25 mM of NaCl × 1000 ppm ZnO-NPs. However, the lowest K+ concentration was recorded in 2000 ppm of ZnO-NPs × 25, 50, and 75 mM of NaCl. The highest K+ concentration was observed in 1000 ppm of ZnO-NPs × no salinity. In contrast, the lowest was recorded in 75 mM of NaCl × 2000 ppm of ZnO-NPs. Na+/K+ ratio was maximized in 75 mM of NaCl × 2000 ppm of ZnO-NPs. Under salinity, all treatments except 1000 ppm ZnO-NPs × no salinity, increased Na+ accumulation and the Na+/K+ ratio compared to the control. ZnO 1000 × moderate salinity levels attained the highest K+ content (Table 1).

3.3. Proline

Proline content was significantly influenced by salinity and ZnO-NPs (p ≤ 0.05) (Table 2). Leaf proline content was enhanced by intensifying the salinity levels. The highest amount of proline (34.06 μmol·g1 FW) was detected in 2000 ppm of ZnO-NPs × 75 mM of NaCl, and the lowest data (19.5 μmol·g1 FW) were recorded in the control (Figure 2a).

3.4. Electrolyte Leakage (EL)

Referring to the above traits, salinity caused a significant rise (p ≤ 0.05) in EL (Table 2). The highest value of EL (40.5%) was obtained in 75 mM of NaCl × 2000 ppm of ZnO-NPs. ZnO-NPs decreased EL under moderate salinity, but it was not able to prevent the progressive EL at the high NaCl concentrations (Figure 2b).

3.5. Hydrogen Peroxide (H2O2)

The content of H2O2 was significantly affected by the interaction of NaCl and ZnO-NP treatments (p ≤ 0.05) (Table 2). All three levels of salinity and ZnO-NPs increased H2O2 content, and the highest and the lowest H2O2 contents were obtained in 75 mM of NaCl alone, combined with 2000 ppm of ZnO-NPs, and in 25 mM of NaCl × 2000 ppm of ZnO-NPs, respectively (Figure 2c).

3.6. The Activity of Enzymatic Antioxidants

Increasing salinity and ZnO-NP concentrations significantly increased the GPX activity (p ≤ 0.05) (Table 2). The highest and the lowest GPX activities were obtained in 50 mM of NaCl with 1000 ppm of ZnO and in the control ones, respectively (Figure 2d).
Additionally, the APX activity was significantly affected by different NaCl and ZnO-NP levels (p ≤ 0.05) (Table 2). The highest and the lowest APX activities were observed in 50 mM of NaCl × 2000 ppm treatments and in 2000 ppm of ZnO-NPs without salinity stress, respectively. Different concentrations of ZnO-NPs were not able to ameliorate the APX activity in 75 mM salinity stress conditions (Figure 2e).
Table 2 shows that salinity × ZnO-NPs significantly (p ≤ 0.05) increased the activity of SOD enzyme. The top SOD activity was obtained with 25 mM NaCl × 1000 ppm of ZnO, which increased up to 1.5 times compared to the control, which attained the lowest SOD activity (Figure 2f).
The activity of GR was significantly (p ≤ 0.05) affected by NaCl × ZnO-NP treatments (Table 2). The highest GR activity belonged to 1000 ppm of ZnO × 25 mM of salinity (Figure 2h).

3.7. The Activity of Non-Enzymatic Antioxidants

Ascorbate (AsA) content was declined by salinity levels (Table 3). The highest ascorbate content (264 nmol·g1 FW) was recorded in 1000 ppm of ZnO × 25 mM NaCl. In contrast, the lowest level of AsA (142.3 nmol·g1 FW) was obtained in 2000 ppm of ZnO-NPs × 75 mM of NaCl. Ascorbate oxide (DHA) was affected (p ≤ 0.05) by salinity stress (Table 3). The highest DHA content (197.8 nmol·g1 FW) was achieved in 25 mM of NaCl × 2000 ppm of ZnO-NPs (1.8 times more than control) (Figure 3a,b). The highest and the lowest AsA/DHA ratios under no-saline conditions were associated with 1000 and 2000 ppm of ZnO-NPs, respectively. Salinity reduced GSH and GSH/GSSG. The highest and the lowest GSH contents were recorded with 1000 ppm of ZnO-NPs without NaCl treatment and 2000 ppm of ZnO-NPs × 75 mM of NaCl, respectively. The highest GSSG content belonged to 2000 ppm of ZnO-NPs × 75 mM salinity. GSSG/GSH ratio decreased by adding up NaCl concentrations. The uppermost and the lowest GSSG/GSH ratios were recorded at 2000 ppm of ZnO-NPs with no salinity × 75 mM of NaCl × 2000 ppm of ZnO-NPs, respectively (Figure 3c–f).

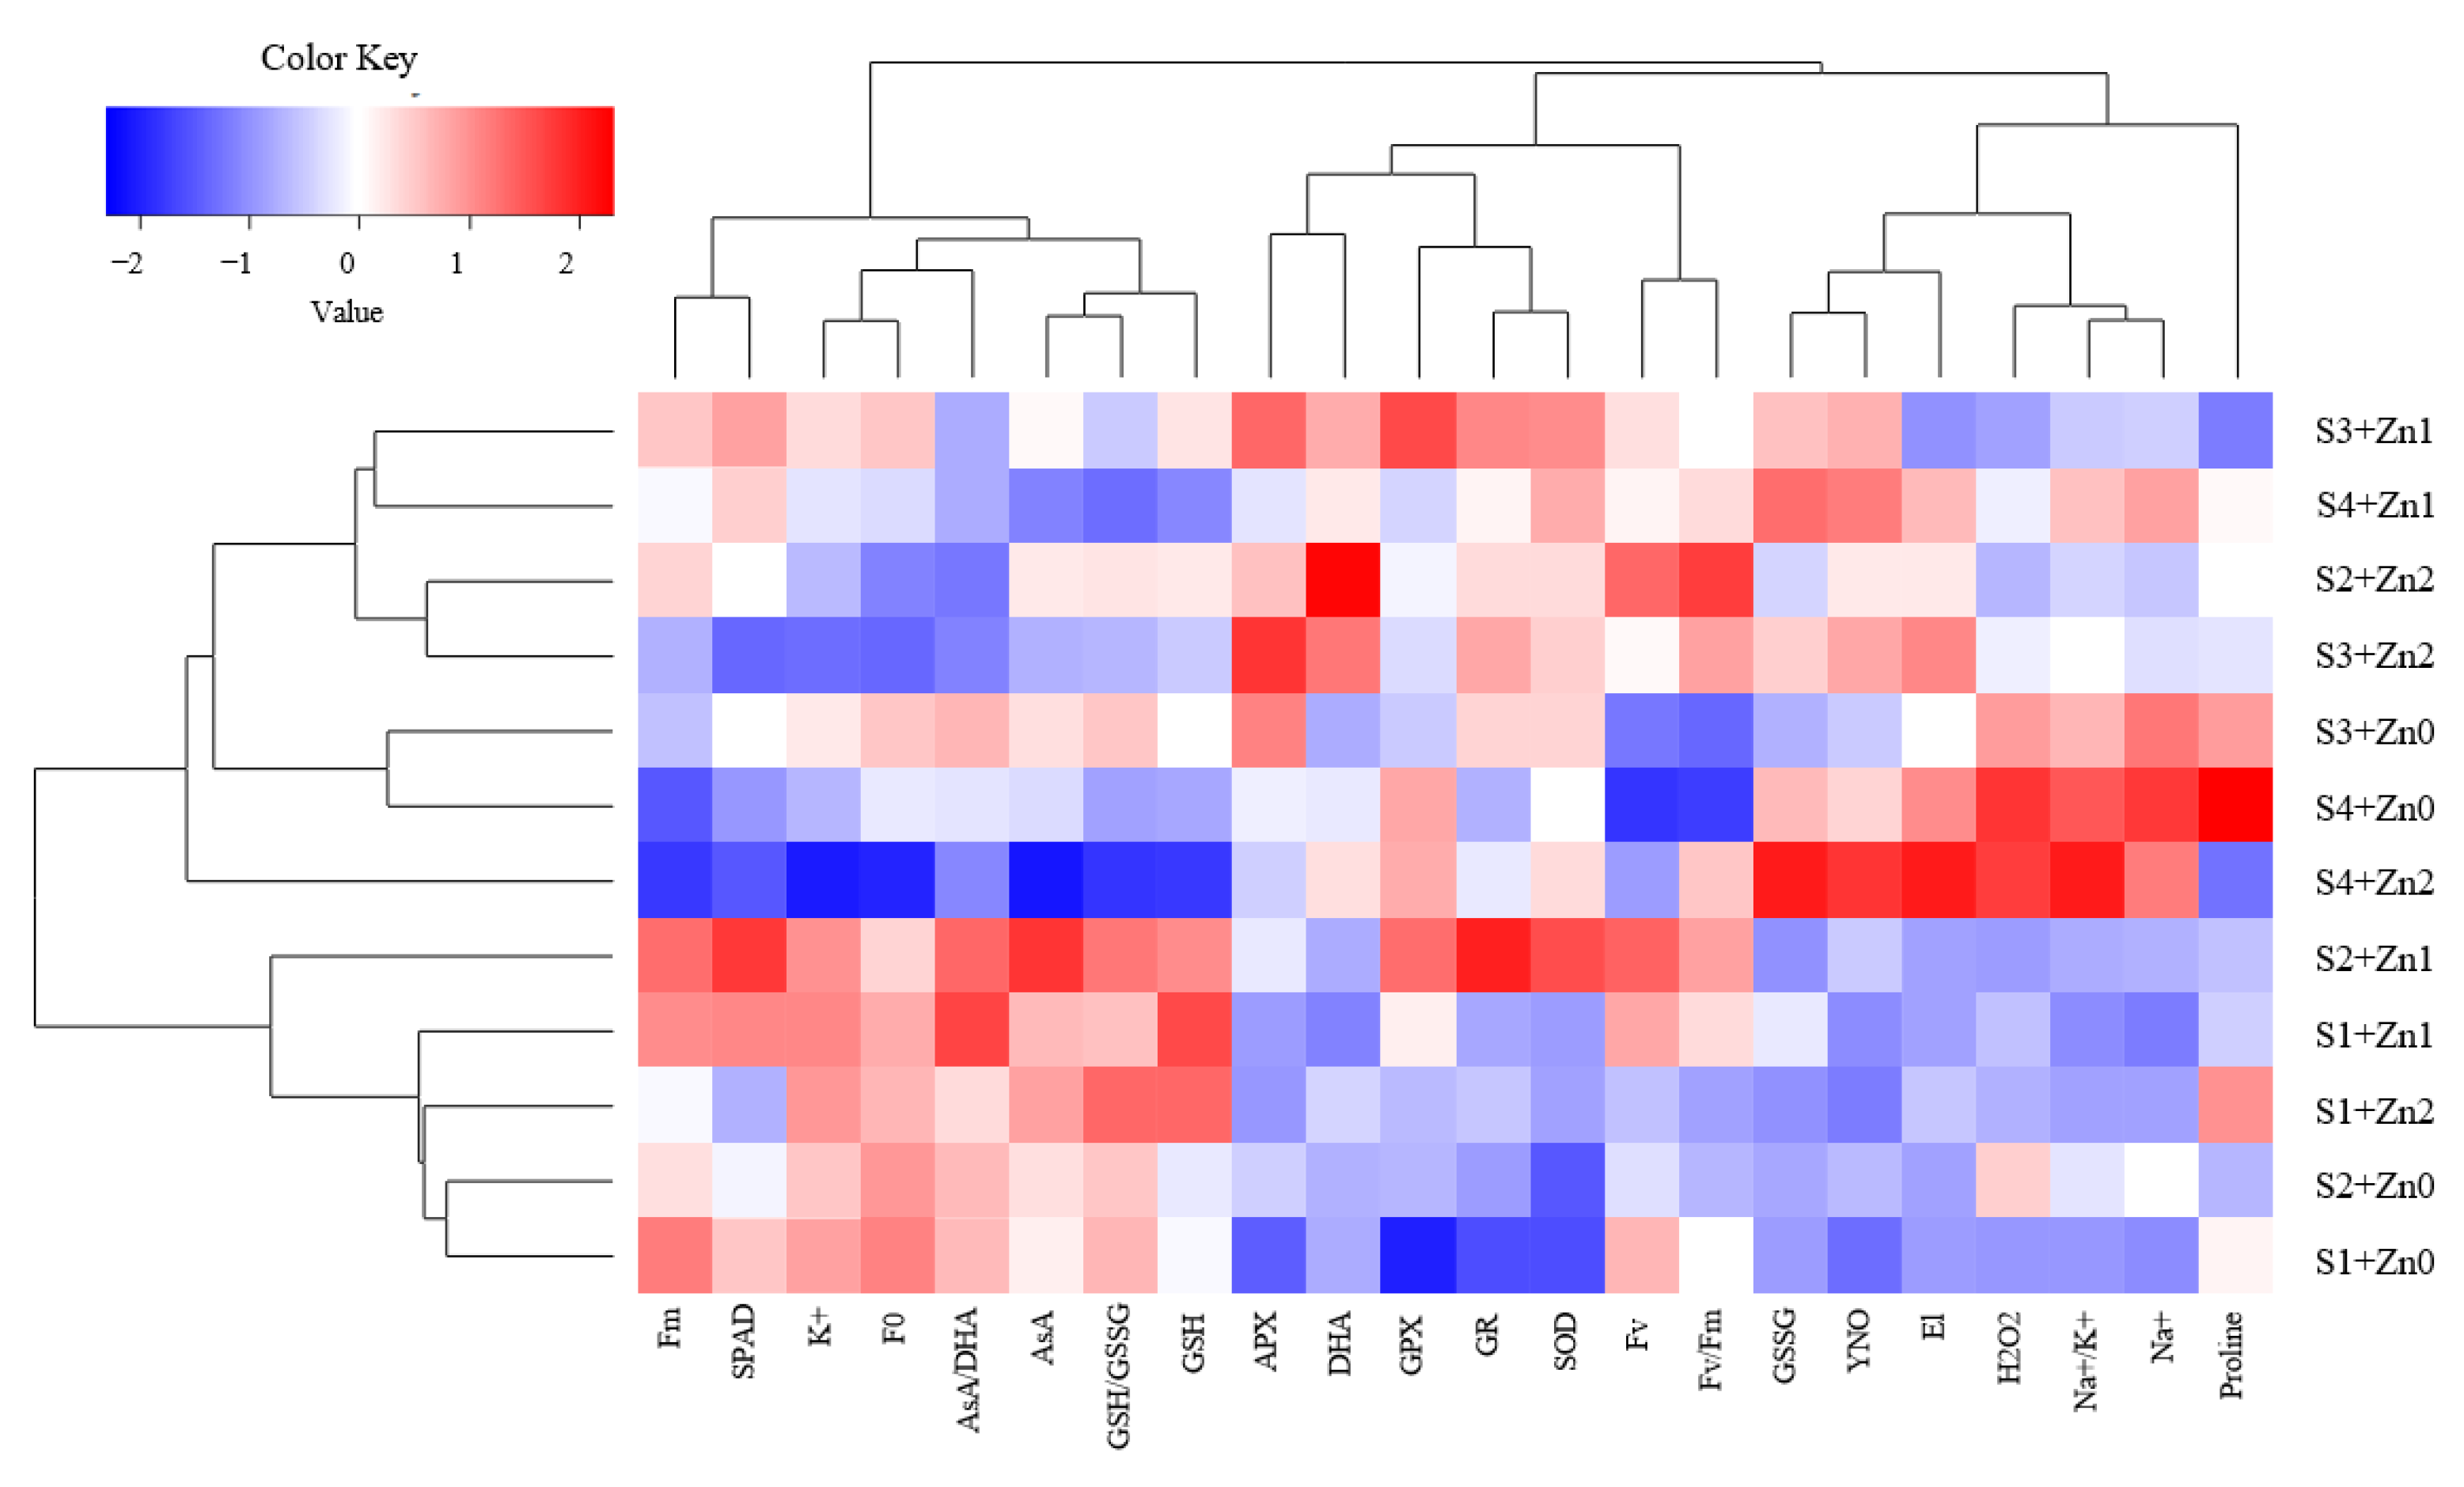
3.8. Correlation Matrix and Relative Expressions

The Pearson’s correlations for the traits are presented in Figure 3. The results revealed a positive significant correlation among Y(NO), Na+, Na+/K+, H2O2, F0, and El. Additionally, H2O2 negatively correlated to AsA, GSH, GSH/GSSG, Fm, and Fv. GSSG, Na+, H2O2, DHA, Na+/K+, and El showed a significantly negative correlation with Fm, Fv, GSH/GSSG, AsA, GSH, K, SOD, and AsA/DHA. Moreover, Fm, Fv, GSH/GSSG, AsA, GSH, K+, SOD, and AsA/GSH positively were related to each other. A negative correlation was recorded among F0 and Y(NO) with Fv, Fm, and Fv/Fm. GR had a positive relationship with SOD and GPX activities.
Heat map matrices (Figure 4) revealed that the traits including GR, APX, AsA/DHA, GSH, AsA and GSSG, Y(NO), EL, H2O2, Na+, and Na+/K+ had positive compliance under salinity. However, ZnO-NPs displayed a reducing effect on the traits such as GSSG, EL, H2O2, DHA, Na+, Y (NO), F0, and proline, while improved k+, GSH, GSH/GSSG, AsA, SPAD, and Fm.
Cluster pattern and heat map analysis (Figure 5) revealed three main groups in the evaluated traits of plants under salinity × ZnO-NP application. Group1 contained: Fm, Fv/Fm, Fv, K+, and SPAD. Group 2 contained: APX, GPX, GR, GSH/GSSG, AsA/DHA, AsA, GSH, and SOD. Group 3 included: GSSG, EL, H2O2, DHA, Na+/K+, Na+, Y (NO), F0, and proline. Moreover, group1 and 2 had a negative correlation with groups 2 and 3. Cluster dendrograms showed two main groups. The first group contained use of 0, 1000, 2000 ppm of ZnO-NPs × 50 and 75 mM NaCl, and 2000 ppm of ZnO-NPs × 25 mM salinity stress. Group 2 included all ZnO-NP treatments × 0 mM NaCl, as well as 1000 and 2000 ppm of ZnO-NPs × 50 mM NaCl.

4. Discussion

Salinity influenced photosynthesis by its negative effects on SPAD value, Fv, Fm, and maximum photochemical efficiency (Fv/Fm) (Table 1). However, F0 was increased by salinity × 2000 ppm ZnO-NPs, which reflects the photochemical shutdown under stress leading to the declined photosynthetic potential [42]. In our findings, 1000 ppm of ZnO-NPs improved the fluorescence parameters and SPAD value under salinity stress. ZnO-NPs mitigated salinity adverse effects in lower NaCl concentrations. Meanwhile, 2000 ppm of ZnO-NPs showed toxicity symptoms and maximized the effects of salinity in chlorophyll fluorescence-related traits. ZnO-NPs may improve the chemical energy performance in photosynthetic systems by enhancing the activity of the Rubisco enzyme and even by the improved protein biosynthesis [43]. ZnO-NPs promote the ribulose-1, 5-bisphosphate carboxylase/oxygenase function, which is directly associated with the higher photosynthetic potential [44]. Our results are similar to those recently reported by Kaya and Ashraf on tomato [45], Samadi et al. on strawberry [46], and Faizan et al. on tomato [28].
In our study, the plants exposed to salinity contained high Na+ content and Na+/K+ ratio. K+ content increased in the plants treated with 1000 ppm of ZnO-NPs under salinity and control conditions. However, 2000 ppm of ZnO-NPs led to toxicity symptoms and greatly declined potassium content (Table 1). Salinity mediates Na+/K+ ratios in cells with the over-accumulation of Na+ and lower K+ absorption [47]. Rahimi et al. [48] reported similar results for rye plants under salinity in a way that the hyper-accumulation of Na+ reduced the uptake, transfer, and accumulation of K+ ions. K is needed to maintain cellular turgor and enzymatic activities; therefore, its deficiency inhibits plant growth, development, and productivity. A high Na+/K+ ratio will have much harmful influence on plants [49]. ZnO-NPs stimulate K+ accumulation in mesophyll cells and thus improve plant photosynthetic efficiency under salinity [50]. Similar results were reported by Chen et al. (rice) [51], Yasmin et al. (safflower) [52], and Singh et al. (Solanum lycopersicum) [53].
Salinity raises the proline content in plants [54,55]. A similar result was detected in the current experiment. Proline plays an important role in osmotic regulation and ROSs scavenging during stress, protects macromolecules, and thereby, inhibits membranes damage [56]. Proline content was increased in ZnO-NPs treated pepper plants in our study (Figure 2a). The enhanced proline content increases the leaf water potential and declines oxidative stress [57]. Besides fortifying the antioxidant defense system and proline levels, ZnO-NPs also maintain the stability of proteins and biomembranes [58]. Our results are consistent with the finding of Yusefi-Tanha [59] on soybeans and Faizan et al. [60] on tomatoes.
In the present experiment, salinity increased EL, whereas 1000 ppm of ZnO-NP foliar treatment retained EL under the low and moderate salinity levels. A total of 2000 ppm of ZnO-NPs increased EL under the saline and control conditions (Figure 2b). Stress-induced ROSs over-genesis hugely reduces the membrane integrity, which causes the electrolytes’ over-leakage from the different cell organelles [61]. Membrane lipids peroxidation and the elevated EL are the dominant symptoms of salinity stress in plants. This phenomenon is widely used as a biomarker for stress-induced damage on the plant tissues [62].
A significant increase in H2O2 content has frequently been reported under salinity [63]. In our study, salinity × higher ZnO-NPs concentration increased H2O2 content, while its content was declined by 1000 ppm of ZnO-NPs treatment compared to the conditions without using ZnO-NPs (Figure 2c). As a cofactor, Zn plays a crucial role in the activity of antioxidant enzymes and in the detoxification of O2 by its conversion into H2O2, which finally decomposes into water and oxygen under the action of catalase. The function prevents membranes’ lipid peroxidation and so retains the membrane’s stability [63]. Our findings are consistent with those of Rizwan et al. (Zea mays) [64] and Zeeshan et al. (soybean) [65].
Antioxidant enzymes, such as APX, GPX, and SOD are in the forefront of plant defense against stressor effects; their gross amounts and activity increase under salinity [66]. SOD is the first defensive soldier against ROS. This enzyme converts superoxide radicals into H2O2 [67]. Naheed et al. [68] and Ates et al. [69] reported similar results on Brassica napus and Leucojum aestivum, respectively. APX as a portion of ascorbic acid (AsA)-Glu cycle manages the removal of H2O2 [70]. In our experiment, APX activity was increased in the lower salinity levels but it was reduced in the highest NaCl treatment, probably due to the APX denaturation. GPX employs the oxidation power of phenolics, such as guaiacol, to detoxify and decompose H2O2, and act as an electron donors to H2O2 [59]. The increased GPX activity in response to the salinity stress in the current research is consistent with the result of Mohammadi et al. on Dracocephalum moldavica L. [71]. ZnO-NPs mediate the plant metabolic pathways and the activity of some antioxidant enzymes to decline the environmental stressor effects [72]. Our findings revealed that the activity of antioxidant enzymes increased in the presence of ZnO-NPs. GPX and SOD activity increased with the low and moderate salinity levels × 1000 ppm ZnO-NPs, while, under 2000 ppm of ZnO-NPs, APX activity was hugely enhanced (Figure 2d–f), which is consistent with that of Adrees et al. [73]. In the current study, similar to Molnár et al. [74] and Faizan et al. [28], ZnO-NPs significantly improved GR activity in Brassica species and Capsicum annum respectively, under salinity. As already known, GR uses NADPH in the glutathione-ascorbate cycle to increase the conversion of glutathione oxide to reductive glutathione under salinity condition [75,76]. The glutathione–ascorbate cycle has a crucial function in mitigating oxidative stress [77].
In our study, salinity reduced AsA and GSH, while 1000 ppm of ZnO-NPs induced the AsA–GSH cycle enzymes activities and increased the associated metabolites such as AsA and GSH under moderate salinity conditions (Figure 3a,d). GSH and GSSG are the known components of the intracellular redox homeostasis system [78]. GSH is the most plentiful non-protein thiol in the cell that triggers several physiological responses in plants, such as antioxidants, and modulates the immune responses [79]. The other system for reducing intracellular oxidation is GSH and its oxidized form (glutathione disulfide or GSSG). The redox potential of these compounds can be up-regulated by the AsA–GSH cycle [80]. Glutathione peroxidase catalyzes the oxidation of GSH into GSSG, while glutathione reductase recycles the reduction of GSSG to GSH [81]. In the current research under high salinity levels, ZnO-NPs increased GSSG and reduced GSH, AsA, and the GSH/GSSG ratio, while the GSSG content was reduced with 1000 ppm of ZnO-NPs under the lower salinity levels (Figure 3e,f). The findings are consistent with Zeeshan et al. [65] on soybean. The GSH/GSSG ratio has been defined as a chief indicator of oxidative damage in different biochemical processes in many plant species [82]. Plants are also able to protect themselves against oxidative stress by regulating enzymes associated with the glutathione–ascorbate cycle (AsA-GSH) such as APX and GR to reduce H2O2 activity during stress times [83]. In agreement with our results, Ahmad et al. [84] reported that ZnO-NPs improved salinity tolerance in soybean by enhancing the ascorbate–glutathione cycle activity.

5. Conclusions

Pepper plants subjected to salinity had the damaged chlorophyll fluorescence parameters and the declined enzymatic and non-enzymatic antioxidant activities as a result of changes in the Na+/K+ ratio. The foliar application of ZnO-NPs improved the traits by the declined Na+/K+ ratio. The foliar treatment of ZnO-NPs strengthened the antioxidant potential. Under salinity, NP treatment improved the activity of antioxidants, such as GPX, SOD, APX, GR, AsA, and GSH. The findings suggest that foliar application of ZnO-NPs improved the plant’s antioxidant defense system and would be a promising way for dealing with and/or alleviating the depressions caused by salinity stress in pepper. However, with higher levels, ZnO-NPs showed toxicity symptoms, and the idea and suggestion are to apply the compound with lower than 1000 ppm concentrations. However, there may be a need for more in-depth studies with broad levels to decide on the near-exact beneficial concentration.

Author Contributions

F.R. contributed with the writing of this manuscript and data processing. M.A. and F.R. carried out culture of the plants, laboratory analysis, and creation of the figures and tables. M.B.H., M.A.A. and A.E. had the idea, set the trial programming. M.B.H. synthesis, writing and interpretation by K.K. writing, review and editing by L.D. and J.M. All authors have read and agreed to the published version of the manuscript.

Funding

This study was funded by the University of Maragheh, Iran, and Mendel University in Brno, Czech Republic.

Institutional Review Board Statement

Ethics approval and consent to participate. The plant material (seeds) was in compliance with some relevant international guidelines and legislation.

Informed Consent Statement

Not applicable.

Data Availability Statement

The data that support the findings of this study are available from the corresponding author upon reasonable request.

Acknowledgments

We sincerely thank the Research Deputy and the Central Laboratory of the University of Maragheh for their help during the experiment.

Conflicts of Interest

The authors declare no conflict of interest.

References

  1. Pérez-Labrada, F.; López-Vargas, E.R.; Ortega-Ortiz, H.; Cadenas-Pliego, G.; Benavides-Mendoza, A.; Juárez-Maldonado, A. Responses of tomato plants under saline stress to foliar application of copper nanoparticles. Plants 2019, 8, 151. [Google Scholar] [CrossRef] [PubMed] [Green Version]
  2. Jenks, M.A.; Hasegawa, P.M.; Jain, S.M.; Foolad, M. Advances in Molecular Breeding toward Drought and Salt Tolerant Crops; Springer: Berlin/Heidelberg, Germany, 2007. [Google Scholar]
  3. Naveed, M.; Sajid, H.; Mustafa, A.; Niamat, B.; Ahmad, Z.; Yaseen, M.; Kamran, M.; Rafique, M.; Ahmar, S.; Chen, J.-T. Alleviation of salinity-induced oxidative stress, improvement in growth, physiology and mineral nutrition of canola (Brassica napus L.) through calcium-fortified composted animal manure. Sustainability 2020, 12, 846. [Google Scholar] [CrossRef] [Green Version]
  4. Hanin, M.; Ebel, C.; Ngom, M.; Laplaze, L.; Masmoudi, K. New insights on plant salt tolerance mechanisms and their potential use for breeding. Front. Plant Sci. 2016, 7, 1787. [Google Scholar] [CrossRef] [Green Version]
  5. Van Zelm, E.; Zhang, Y.; Testerink, C. Salt tolerance mechanisms of plants. Annu. Rev. Plant Biol. 2020, 71, 403–433. [Google Scholar] [CrossRef] [Green Version]
  6. Murchie, E.H.; Lawson, T. Chlorophyll fluorescence analysis: A guide to good practice and understanding some new applications. J. Exp. Bot. 2013, 64, 3983–3998. [Google Scholar] [CrossRef] [Green Version]
  7. Li, R.-h.; Guo, P.-G.; Michael, B.; Stefania, G.; Salvatore, C. Evaluation of chlorophyll content and fluorescence parameters as indicators of drought tolerance in barley. Agric. Sci. China 2006, 5, 751–757. [Google Scholar] [CrossRef]
  8. Havaux, M.; Lannoye, R. Chlorophyll fluorescence induction: A sensitive indicator of water stress in maize plants. Irrig. Sci. 1983, 4, 147–151. [Google Scholar]
  9. Cerovic, Z.G.; Samson, G.; Morales, F.; Tremblay, N.; Moya, I. Ultraviolet-induced fluorescence for plant monitoring: Present state and prospects. Agronomie 1999, 19, 543–578. [Google Scholar] [CrossRef] [Green Version]
  10. Ouerghi, Z.; Cornic, G.; Roudani, M.; Ayadi, A.; Brulfert, J. Effect of NaCl on photosynthesis of two wheat species (Triticum durum and T. aestivum) differing in their sensitivity to salt stress. J. Plant Physiol. 2000, 156, 335–340. [Google Scholar] [CrossRef]
  11. Kalaji, H.M.; Schansker, G.; Ladle, R.J.; Goltsev, V.; Bosa, K.; Allakhverdiev, S.I.; Brestic, M.; Bussotti, F.; Calatayud, A.; Dąbrowski, P. Frequently asked questions about in vivo chlorophyll fluorescence: Practical issues. Photosynth. Res. 2014, 122, 121–158. [Google Scholar] [CrossRef] [PubMed] [Green Version]
  12. Maxwell, K.; Johnson, G.N. Chlorophyll fluorescence—A practical guide. J. Exp. Bot. 2000, 51, 659–668. [Google Scholar] [CrossRef]
  13. Suleyman, I.A.; Allakhverdiev, A.S.; Yoshitaka, N.; Masami, I.; Norio, M. Ionic and osmotic effects of NaCl-induced inactivation of photosystems I and II in Synechococcus sp. Plant Physiol. 2000, 123, 1047–1056. [Google Scholar]
  14. Munns, R.; James, R.A.; Läuchli, A. Approaches to increasing the salt tolerance of wheat and other cereals. J. Exp. Bot. 2006, 57, 1025–1043. [Google Scholar] [CrossRef] [Green Version]
  15. Baybordi, A. Zinc in Soils and Crop Nutrition; Parivar Press: Tehran, Iran, 2006; p. 179. [Google Scholar]
  16. Rogers, S.O.; Bendich, A.J. Extraction of DNA from plant tissues. In Plant Molecular Biology Manual; Springer: Berlin/Heidelberg, Germany, 1989; pp. 73–83. [Google Scholar]
  17. Aktaş, H.; ABAK, K.; Öztürk, L.; Çakmak, İ. The effect of zinc on growth and shoot concentrations of sodium and potassium in pepper plants under salinity stress. Turkish J. Agric. For. 2006, 30, 407–412. [Google Scholar]
  18. Saleh, J.; Maftoun, M.; Safarzadeh, S.; Gholami, A. Growth, mineral composition, and biochemical changes of broad bean as affected by sodium chloride and zinc levels and sources. Commun. Soil Sci. Plant Anal. 2009, 40, 3046–3060. [Google Scholar] [CrossRef]
  19. Nadeem, F.; Azhar, M.; Anwar-ul-Haq, M.; Sabir, M.; Samreen, T.; Tufail, A.; Awan, H.U.M.; Juan, W. Comparative response of two rice (Oryza sativa L.) cultivars to applied zinc and manganese for mitigation of salt stress. J. Soil Sci. Plant Nutr. 2020, 20, 2059–2072. [Google Scholar] [CrossRef]
  20. Tolay, I. The impact of different Zinc (Zn) levels on growth and nutrient uptake of Basil (Ocimum basilicum L.) grown under salinity stress. PLoS ONE 2021, 16, e0246493. [Google Scholar] [CrossRef] [PubMed]
  21. Iqbal, M.N.; Rasheed, R.; Ashraf, M.Y.; Ashraf, M.A.; Hussain, I. Exogenously applied zinc and copper mitigate salinity effect in maize (Zea mays L.) by improving key physiological and biochemical attributes. Environ. Sci. Pollut. Res. 2018, 25, 23883–23896. [Google Scholar] [CrossRef]
  22. García-Sánchez, S.; Bernales, I.; Cristobal, S. Early response to nanoparticles in the Arabidopsis transcriptome compromises plant defence and root-hair development through salicylic acid signalling. BMC Genom. 2015, 16, 341. [Google Scholar] [CrossRef] [PubMed] [Green Version]
  23. Kisan, B.; Shruthi, H.; Sharanagouda, H.; Revanappa, S.; Pramod, N. Effect of nano-zinc oxide on the leaf physical and nutritional quality of spinach. Agrotechnology 2015, 5, 135. [Google Scholar]
  24. Reynolds, G.H. Nanotechnology and regulatory policy: Three futures. Harv. J. L. Tech. 2003, 17, 179. [Google Scholar]
  25. Prasad, R.Y.; McGee, J.K.; Killius, M.G.; Suarez, D.A.; Blackman, C.F.; DeMarini, D.M.; Simmons, S.O. Investigating oxidative stress and inflammatory responses elicited by silver nanoparticles using high-throughput reporter genes in HepG2 cells: Effect of size, surface coating, and intracellular uptake. Toxicol. Vitr. 2013, 27, 2013–2021. [Google Scholar] [CrossRef]
  26. Sávoly, Z.; Hrács, K.; Pemmer, B.; Streli, C.; Záray, G.; Nagy, P.I. Uptake and toxicity of nano-ZnO in the plant-feeding nematode, Xiphinema vuittenezi: The role of dissolved zinc and nanoparticle-specific effects. Environ. Sci. Pollut. Res. 2016, 23, 9669–9678. [Google Scholar] [CrossRef] [PubMed]
  27. Kahru, A.; Dubourguier, H.-C. From ecotoxicology to nanoecotoxicology. Toxicology 2010, 269, 105–119. [Google Scholar] [CrossRef]
  28. Faizan, M.; Bhat, J.A.; Chen, C.; Alyemeni, M.N.; Wijaya, L.; Ahmad, P.; Yu, F. Zinc oxide nanoparticles (ZnO-NPs) induce salt tolerance by improving the antioxidant system and photosynthetic machinery in tomato. Plant Physiol. Biochem. 2021, 161, 122–130. [Google Scholar] [CrossRef]
  29. Cheema, A.; Padmanabhan, P.; Amer, A.; Parry, M.J.; Lim, L.-T.; Subramanian, J.; Paliyath, G. Postharvest hexanal vapor treatment delays ripening and enhances shelf life of greenhouse grown sweet bell pepper (Capsicum annum L.). Postharvest Biol. Technol. 2018, 136, 80–89. [Google Scholar] [CrossRef]
  30. Uddling, J.; Gelang-Alfredsson, J.; Piikki, K.; Pleijel, H. Evaluating the relationship between leaf chlorophyll concentration and SPAD-502 chlorophyll meter readings. Photosynth. Res. 2007, 91, 37–46. [Google Scholar] [CrossRef] [PubMed]
  31. Al Abdullah, K.; Awad, S.; Zaraket, J.; Salame, C. Synthesis of ZnO nanopowders by using sol-gel and studying their structural and electrical properties at different temperature. Energy Procedia 2017, 119, 565–570. [Google Scholar] [CrossRef]
  32. Ghosh, K. Methods of Analysis of Soils, Plants, Waters and Fertilisers. J. Indian Soc. Soil Sci. 1993, 41, 814–815. [Google Scholar]
  33. Bates, J. Tell it how it is: Few school leavers understand what nursing is all about. Nurs. Stand. 2004, 18, 25–26. [Google Scholar]
  34. Sinha, S.; Saxena, R.; Singh, S. Chromium induced lipid peroxidation in the plants of Pistia stratiotes L.: Role of antioxidants and antioxidant enzymes. Chemosphere 2005, 58, 595–604. [Google Scholar] [CrossRef]
  35. Lutts, S.; Kinet, J.; Bouharmont, J. Effects of salt stress on growth, mineral nutrition and proline accumulation in relation to osmotic adjustment in rice (Oryza sativa L.) cultivars differing in salinity resistance. Plant Growth Regul. 1996, 19, 207–218. [Google Scholar] [CrossRef]
  36. Yoshimura, K.; Yabuta, Y.; Ishikawa, T.; Shigeoka, S. Expression of spinach ascorbate peroxidase isoenzymes in response to oxidative stresses. Plant Physiol. 2000, 123, 223–234. [Google Scholar] [CrossRef] [Green Version]
  37. Beauchamp, C.; Fridovich, I. Superoxide dismutase: Improved assays and an assay applicable to acrylamide gels. Anal. Biochem. 1971, 44, 276–287. [Google Scholar] [CrossRef]
  38. Karuppanapandian, T.; Moon, J.-C.; Kim, C.; Manoharan, K.; Kim, W. Reactive oxygen species in plants: Their generation, signal transduction, and scavenging mechanisms. Aust. J. Crop Sci. 2011, 5, 709–725. [Google Scholar]
  39. Sairam, R.; Srivastava, G. Changes in antioxidant activity in sub-cellular fractions of tolerant and susceptible wheat genotypes in response to long term salt stress. Plant Sci. 2002, 162, 897–904. [Google Scholar] [CrossRef]
  40. Law, M.; Charles, S.A.; Halliwell, B. Glutathione and ascorbic acid in spinach (Spinacia oleracea) chloroplasts. The effect of hydrogen peroxide and of paraquat. Biochem. J. 1983, 210, 899–903. [Google Scholar] [CrossRef] [Green Version]
  41. Griffith, O.W. Determination of glutathione and glutathione disulfide using glutathione reductase and 2-vinylpyridine. Anal. Biochem. 1980, 106, 207–212. [Google Scholar] [CrossRef]
  42. Wang, H.; Zhang, M.; Song, Y.; Li, H.; Huang, H.; Shao, M.; Liu, Y.; Kang, Z. Carbon dots promote the growth and photosynthesis of mung bean sprouts. Carbon 2018, 136, 94–102. [Google Scholar] [CrossRef]
  43. Zhao, G.; Xu, H.; Zhang, P.; Su, X.; Zhao, H. Effects of 2, 4-epibrassinolide on photosynthesis and Rubisco activase gene expression in Triticum aestivum L. seedlings under a combination of drought and heat stress. Plant Growth Regul. 2017, 81, 377–384. [Google Scholar] [CrossRef] [Green Version]
  44. Gao, S.; Zhang, H.; Wang, X.; Deng, R.; Sun, D.; Zheng, G. ZnO-based hollow microspheres: Biopolymer-assisted assemblies from ZnO nanorods. J. Phys. Chem. B 2006, 110, 15847–15852. [Google Scholar] [CrossRef] [PubMed]
  45. Kaya, C.; Ashraf, M. Exogenous application of nitric oxide promotes growth and oxidative defense system in highly boron stressed tomato plants bearing fruit. Sci. Hortic. 2015, 185, 43–47. [Google Scholar] [CrossRef]
  46. Samadi, S.; Habibi, G.; Vaziri, A. Effects of exogenous salicylic acid on antioxidative responses, phenolic metabolism and photochemical activity of strawberry under salt stress. Iran. J. Plant Physiol. 2019, 9, 2685–2694. [Google Scholar]
  47. Zhou, Y.; Diao, M.; Chen, X.; Cui, J.; Pang, S.; Li, Y.; Hou, C.; Liu, H.-y. Application of exogenous glutathione confers salinity stress tolerance in tomato seedlings by modulating ions homeostasis and polyamine metabolism. Sci. Hortic. 2019, 250, 45–58. [Google Scholar] [CrossRef]
  48. Rahimi, E.; Nazari, F.; Javadi, T.; Samadi, S.; da Silva, J.A.T. Potassium-enriched clinoptilolite zeolite mitigates the adverse impacts of salinity stress in perennial ryegrass (Lolium perenne L.) by increasing silicon absorption and improving the K/Na ratio. J. Environ. Manag. 2021, 285, 112142. [Google Scholar] [CrossRef] [PubMed]
  49. Hussain, S.; Hussain, S.; Ali, B.; Ren, X.; Chen, X.; Li, Q.; Saqib, M.; Ahmad, N. Recent progress in understanding salinity tolerance in plants: Story of Na+/K+ balance and beyond. Plant Physiol. Biochem. 2021, 160, 239–256. [Google Scholar] [CrossRef]
  50. Noohpisheh, Z.; Amiri, H.; Mohammadi, A.; Farhadi, S. Effect of the foliar application of zinc oxide nanoparticles on some biochemical and physiological parameters of Trigonella foenum-graecum under salinity stress. Plant Biosyst.- Int. J. Deal. All Asp. Plant Biol. 2021, 155, 267–280. [Google Scholar] [CrossRef]
  51. Chen, Y.; Li, R.; Ge, J.; Liu, J.; Wang, W.; Xu, M.; Zhang, R.; Hussain, S.; Wei, H.; Dai, Q. Exogenous melatonin confers enhanced salinity tolerance in rice by blocking the ROS burst and improving Na+/K+ homeostasis. Environ. Exp. Bot. 2021, 189, 104530. [Google Scholar] [CrossRef]
  52. Yasmin, H.; Mazher, J.; Azmat, A.; Nosheen, A.; Naz, R.; Hassan, M.N.; Noureldeen, A.; Ahmad, P. Combined application of zinc oxide nanoparticles and biofertilizer to induce salt resistance in safflower by regulating ion homeostasis and antioxidant defence responses. Ecotoxicol. Environ. Saf. 2021, 218, 112262. [Google Scholar] [CrossRef]
  53. Singh, M.; Singh, V.P.; Prasad, S.M. Responses of photosynthesis, nitrogen and proline metabolism to salinity stress in Solanum lycopersicum under different levels of nitrogen supplementation. Plant Physiol. Biochem. 2016, 109, 72–83. [Google Scholar] [CrossRef]
  54. Singh, P.; Arif, Y.; Siddiqui, H.; Sami, F.; Zaidi, R.; Azam, A.; Alam, P.; Hayat, S. Nanoparticles enhances the salinity toxicity tolerance in Linum usitatissimum L. by modulating the antioxidative enzymes, photosynthetic efficiency, redox status and cellular damage. Ecotoxicol. Environ. Saf. 2021, 213, 112020. [Google Scholar] [CrossRef] [PubMed]
  55. Sarabi, B.; Bolandnazar, S.; Ghaderi, N.; Ghashghaie, J. Genotypic differences in physiological and biochemical responses to salinity stress in melon (Cucumis melo L.) plants: Prospects for selection of salt tolerant landraces. Plant Physiol. Biochem. 2017, 119, 294–311. [Google Scholar] [CrossRef] [PubMed]
  56. Bakhoum, G.S.; Sadak, M.S.; Badr, E.A.E.M. Mitigation of adverse effects of salinity stress on sunflower plant (Helianthus annuus L.) by exogenous application of chitosan. Bull. Natl. Res. Cent. 2020, 44, 1–11. [Google Scholar] [CrossRef]
  57. Kaya, C.; Ashraf, M.; Alyemeni, M.N.; Ahmad, P. The role of endogenous nitric oxide in salicylic acid-induced up-regulation of ascorbate-glutathione cycle involved in salinity tolerance of pepper (Capsicum annuum L.) plants. Plant Physiol. Biochem. 2020, 147, 10–20. [Google Scholar] [CrossRef]
  58. Panda, S. Physiological impact of Zinc nanoparticle on germination of rice (Oryza sativa L) seed. J. Plant Sci. Phytopathol. 2017, 1, 062–070. [Google Scholar]
  59. Yusefi-Tanha, E.; Fallah, S.; Rostamnejadi, A.; Pokhrel, L.R. Zinc oxide nanoparticles (ZnONPs) as a novel nanofertilizer: Influence on seed yield and antioxidant defense system in soil grown soybean (Glycine max cv. Kowsar). Sci. Total Environ. 2020, 738, 140240. [Google Scholar] [CrossRef] [PubMed]
  60. Faizan, M.; Faraz, A.; Yusuf, M.; Khan, S.; Hayat, S. Zinc oxide nanoparticle-mediated changes in photosynthetic efficiency and antioxidant system of tomato plants. Photosynthetica 2018, 56, 678–686. [Google Scholar] [CrossRef]
  61. Tuna, A.L.; Kaya, C.; Dikilitaş, M.; Yokaş, İ.; Burun, B.; Altunlu, H. Comparative effects of various salicylic acid derivatives on key growth parameters and some enzyme activities in salinity stressed maize (Zea mays L.) plants. Pak. J. Bot. 2007, 39, 787–798. [Google Scholar]
  62. Hniličková, H.; Hnilička, F.; Orsák, M.; Hejnák, V. Effect of salt stress on growth, electrolyte leakage, Na+ and K+ content in selected plant species. Plant Soil Environ. 2019, 65, 90–96. [Google Scholar] [CrossRef] [Green Version]
  63. El-Badri, A.M.; Batool, M.; Mohamed, I.A.; Khatab, A.; Sherif, A.; Wang, Z.; Salah, A.; Nishawy, E.; Ayaad, M.; Kuai, J. Modulation of salinity impact on early seedling stage via nano-priming application of zinc oxide on rapeseed (Brassica napus L.). Plant Physiol. Biochem. 2021, 166, 376–392. [Google Scholar] [CrossRef]
  64. Rizwan, M.; Ali, S.; ur Rehman, M.Z.; Adrees, M.; Arshad, M.; Qayyum, M.F.; Ali, L.; Hussain, A.; Chatha, S.A.S.; Imran, M. Alleviation of cadmium accumulation in maize (Zea mays L.) by foliar spray of zinc oxide nanoparticles and biochar to contaminated soil. Environ. Pollut. 2019, 248, 358–367. [Google Scholar] [CrossRef] [PubMed]
  65. Zeeshan, M.; Hu, Y.X.; Iqbal, A.; Salam, A.; Liu, Y.X.; Muhammad, I.; Ahmad, S.; Khan, A.H.; Hale, B.; Wu, H.Y. Amelioration of AsV toxicity by concurrent application of ZnO-NPs and Se-NPs is associated with differential regulation of photosynthetic indexes, antioxidant pool and osmolytes content in soybean seedling. Ecotoxicol. Environ. Saf. 2021, 225, 112738. [Google Scholar] [CrossRef] [PubMed]
  66. Hasanuzzaman, M.; Bhuyan, M.; Zulfiqar, F.; Raza, A.; Mohsin, S.M.; Mahmud, J.A.; Fujita, M.; Fotopoulos, V. Reactive oxygen species and antioxidant defense in plants under abiotic stress: Revisiting the crucial role of a universal defense regulator. Antioxidants 2020, 9, 681. [Google Scholar] [CrossRef] [PubMed]
  67. Gharsallah, C.; Fakhfakh, H.; Grubb, D.; Gorsane, F. Effect of salt stress on ion concentration, proline content, antioxidant enzyme activities and gene expression in tomato cultivars. AoB Plants 2016, 8, 1–21. [Google Scholar] [CrossRef] [Green Version]
  68. Naheed, R.; Aslam, H.; Kanwal, H.; Farhat, F.; Gamar, M.I.A.; Al-Mushhin, A.A.; Jabborova, D.; Ansari, M.J.; Shaheen, S.; Aqeel, M. Growth attributes, biochemical modulations, antioxidant enzymatic metabolism and yield in Brassica napus varieties for salinity tolerance. Saudi J. Biol. Sci. 2021, 28, 5469–5479. [Google Scholar] [CrossRef]
  69. Ates, M.T.; Yildirim, A.B.; Turker, A.U. Enhancement of alkaloid content (galanthamine and lycorine) and antioxidant activities (enzymatic and non-enzymatic) unders salt stress in summer snowflake (Leucojum aestivum L.). S. Afr. J. Bot. 2021, 140, 182–188. [Google Scholar] [CrossRef]
  70. Hussain, I.; Singh, A.; Singh, N.; Singh, P. Plant-nanoceria interaction: Toxicity, accumulation, translocation and biotransformation. S. Afr. J. Bot. 2019, 121, 239–247. [Google Scholar] [CrossRef]
  71. Mohammadi, M.H.Z.; Panahirad, S.; Navai, A.; Bahrami, M.K.; Kulak, M.; Gohari, G. Cerium oxide nanoparticles (CeO2-NPs) improve growth parameters and antioxidant defense system in Moldavian Balm (Dracocephalum moldavica L.) under salinity stress. Plant Stress 2021, 1, 100006. [Google Scholar] [CrossRef]
  72. Lacerda, J.S.; Martinez, H.E.; Pedrosa, A.W.; Clemente, J.M.; Santos, R.H.; Oliveira, G.L.; Jifon, J.L. Importance of zinc for arabica coffee and its effects on the chemical composition of raw grain and beverage quality. Crop Sci. 2018, 58, 1360–1370. [Google Scholar] [CrossRef]
  73. Adrees, M.; Khan, Z.S.; Hafeez, M.; Rizwan, M.; Hussain, K.; Asrar, M.; Alyemeni, M.N.; Wijaya, L.; Ali, S. Foliar exposure of zinc oxide nanoparticles improved the growth of wheat (Triticum aestivum L.) and decreased cadmium concentration in grains under simultaneous Cd and water deficient stress. Ecotoxicol. Environ. Saf. 2021, 208, 111627. [Google Scholar] [CrossRef]
  74. Molnár, Á.; Papp, M.; Kovács, D.Z.; Bélteky, P.; Oláh, D.; Feigl, G.; Szőllősi, R.; Rázga, Z.; Ördög, A.; Erdei, L. Nitro-oxidative signalling induced by chemically synthetized zinc oxide nanoparticles (ZnO NPs) in Brassica species. Chemosphere 2020, 251, 126419. [Google Scholar] [CrossRef] [PubMed]
  75. Noctor, G.; Reichheld, J.-P.; Foyer, C.H. ROS-related redox regulation and signaling in plants. In Seminars in Cell & Developmental Biology; Academic Press: Cambridge, MA, USA, 2018; pp. 3–12. [Google Scholar]
  76. Singh, M.; Singh, V.P.; Prasad, S.M. Nitrogen alleviates salinity toxicity in Solanum lycopersicum seedlings by regulating ROS homeostasis. Plant Physiol. Biochem. 2019, 141, 466–476. [Google Scholar] [CrossRef] [PubMed]
  77. Khanna-Chopra, R.; Selote, D.S. Acclimation to drought stress generates oxidative stress tolerance in drought-resistant than-susceptible wheat cultivar under field conditions. Environ. Exp. Bot. 2007, 60, 276–283. [Google Scholar] [CrossRef]
  78. Zhu, Y.; Wu, J.; Wang, K.; Xu, H.; Qu, M.; Gao, Z.; Guo, L.; Xie, J. Facile and sensitive measurement of GSH/GSSG in cells by surface-enhanced Raman spectroscopy. Talanta 2021, 224, 121852. [Google Scholar] [CrossRef]
  79. Kataria, S.; Baghel, L.; Jain, M.; Guruprasad, K. Magnetopriming regulates antioxidant defense system in soybean against salt stress. Biocatal. Agric. Biotechnol. 2019, 18, 101090. [Google Scholar] [CrossRef]
  80. Chen, H.; Liu, T.; Xiang, L.; Hu, L.; Hu, X. GABA enhances muskmelon chloroplast antioxidants to defense salinity-alkalinity stress. Russ. J. Plant Physiol. 2018, 65, 674–679. [Google Scholar] [CrossRef]
  81. Huang, C.; Ding, G.; Gu, C.; Zhou, J.; Kuang, M.; Ji, Y.; He, Y.; Kondo, T.; Fan, J. Decreased Selenium-Binding Protein 1 Enhances Glutathione Peroxidase 1 Activity and Downregulates HIF-1α to Promote Hepatocellular Carcinoma InvasivenessDecreased SBP1 Promotes HCC through GPX1 and HIF-1α. Clin. Cancer Res. 2012, 18, 3042–3053. [Google Scholar] [CrossRef] [PubMed] [Green Version]
  82. Rahman, A.; Hossain, M.; Mahmud, J.-A.; Nahar, K.; Hasanuzzaman, M.; Fujita, M. Manganese-induced salt stress tolerance in rice seedlings: Regulation of ion homeostasis, antioxidant defense and glyoxalase systems. Physiol. Mol. Biol. Plants 2016, 22, 291–306. [Google Scholar] [CrossRef] [PubMed]
  83. Kang, G.; Li, G.; Liu, G.; Xu, W.; Peng, X.; Wang, C.; Zhu, Y.; Guo, T. Exogenous salicylic acid enhances wheat drought tolerance by influence on the expression of genes related to ascorbate-glutathione cycle. Biol. Plant. 2013, 57, 718–724. [Google Scholar] [CrossRef]
  84. Ahmad, P.; Alyemeni, M.N.; Al-Huqail, A.A.; Alqahtani, M.A.; Wijaya, L.; Ashraf, M.; Kaya, C.; Bajguz, A. Zinc oxide nanoparticles application alleviates arsenic (As) toxicity in soybean plants by restricting the uptake of as and modulating key biochemical attributes, antioxidant enzymes, ascorbate-glutathione cycle and glyoxalase system. Plants 2020, 9, 825. [Google Scholar] [CrossRef]
Figure 1. XRD spectrum (a), FT-IR spectrum (b), and the FE-SEM (c) of synthesized ZnO nanoparticles.
Horticulturae 08 00908 g001
Figure 2. The effects of salinity × ZnO-NPs foliar application on proline content (a), Electrolyte leakage (b), H2O2 content (c) and guaiacol peroxidase (GPX) (d) Ascorbate peroxidase (APX) (e), Superoxide dismutase (SOD) (f) and Glutathione reductase (GR) (g) activity of pepper plants. S1, S2, S3 and S4 refer to 0, 25, 50, and 75 mM NaCl concentrations, respectively. Different letters indicate significant differences according to LSD test at p < 0.05.
Horticulturae 08 00908 g002aHorticulturae 08 00908 g002b
Figure 3. The effects of salinity × ZnO-NP foliar application on Reduced ascorbate (AsA) (a), Oxide ascorbate (DHA) (b) AsA/DHA (c), Oxide glutathione (GSH) (d), Reduced glutathione (GSSG) (e), and GSH/GSSG (f) of pepper plants. S1, S2, S3, and S4 refer to 0, 25, 50, and 75 mM NaCl concentrations, respectively. Different letters indicate significant differences according to LSD test p < 0.05.
Horticulturae 08 00908 g003
Figure 4. Pearson’s correlation heat map analysis for the effects of salinity × ZnO-NP foliar use on pepper. Heat map represents Proline content, H2O2 content, Guaiacol peroxidase (GPX) activity, Ascorbate peroxidase (APX) activity, Superoxide dismutase (SOD) activity, Redox ascorbate (AsA), Oxide ascorbate (DHA), AsA/DHA, Oxide glutathione (GSH), Redox glutathione (GSSG), GSH/GSSG, Electrolyte leakage (EL), SPAD, the maximal possible value for fluorescence (Fm), the minimum value for chlorophyll fluorescence (F0), the difference between F0 and Fm (Fv), the maximum quantum yield of PSII (Fv/Fm), the non-photochemical quantum efficiency of PSII Y (No), Na+ content, K+ content and Na+/K+ ratio.
Horticulturae 08 00908 g004
Figure 5. Heat map pattern for the enzymatic and non-enzymatic antioxidants pool and the biochemical traits of pepper plants exposed to salinity × ZnO-NP foliar application. Heat map depicts Proline, H2O2, Guaiacol peroxidase (GPX), Ascorbate peroxidase (APX), Superoxide dismutase (SOD), Redox ascorbate (AsA), Oxide ascorbate (DHA), AsA/DHA, Oxide glutathione (GSH), Redox glutathione (GSSG), GSH/GSSG, Electrolyte leakage (EL), SPAD, the maximal possible value for fluorescence (Fm), the minimum value for chlorophyll fluorescence (F0), F0 and Fm difference (Fv), the maximum quantum yield of PSII (Fv/Fm), the non-photochemical quantum efficiency of PSII Y (No), Na+, K+ and Na+/K+. S1, S2, S3, and S4 refer to 0, 25, 50 and 75 Mm NaCl salinity, and Zn0, Zn1 and Zn2 refers to 0, 1000, and 2000 ppm of ZnO-NP foliar application, respectively.
Horticulturae 08 00908 g005
Table 1. Effect of ZnO nanoparticle foliar treatment on SPAD value, Y (No), Maximum Fluorescence Fm, Initial Fluorescence F0, variable fluorescence, Fv, Maximum potential quantum yield of PS II Fv/Fm and Na and K content as well as Na/K ratio of pepper plants under salinity (Mean ± SE).
NaCl (mM)ZnSPADFmF0FvFv/FmY (NO)Na+ (mmol·g−1 DW)K+ (mmol·g−1 DW)Na+/K+
0041.6 ± 2.8 c5.22 ± 0.19 c0.86 ± 0.19 i4.35 ± 0.137 b0.83 ± 0.0053 ab0.33 ± 0.016 g0.467 ± 0.032 i5.573 ± 0.053 b0.083 ± 0.0024 gh
100048.8 ± 0.9 b5.65 ± 0.18 a0.74 ± 0.18 j4.91 ± 0.117 a0.86 ± 0.0224 a0.37 ± 0.014 fg0.400 ± 0.033 g5.777 ± 0.047 a0.070 ± 0.0134 h
200024.8 ± 1.1 e4.87 ± 0.129 f0.96 ± 0.129 h3.91 ± 0.079 cd0.81 ± 0.0041 bc0.35 ± 0.014 g0.570 ± 0.024 f5.655 ± 0.041 ab0.100 ± 0.0042 g
25033.1 ± 3.3 d5.07 ± 0.04 de1.10 ± 0.04 fg3.96 ± 0.085 c0.78 ± 0.0120 c0.44 ± 0.017 ef1.082 ± 0.042 d5.307 ± 0.066 c0.203 ± 0.0033 e
100057.8 ± 1.6 a5.39 ± 0.112 b1.07 ± 0.112 g4.32 ± 0.089 b0.80 ± 0.0094 bc0.46 ± 0.032 e0.647 ± 0.050 f5.705 ± 0.064 ab0.113 ± 0.0129 fg
200034.3 ± 1.1 d4.94 ± 0.097 ef1.14 ± 0.097 f3.80 ± 0.114 d0.76 ± 0.0116 cd0.57 ± 0.018 d0.755 ± 0.015 e4.265 ± 0.068 f0.177 ± 0.009 e
50034.4 ± 1.5 d4.65 ± 0.13 d1.24 ± 0.13 de3.41 ± 0.031 f0.73 ± 0.0037 de0.46 ± 0.01 ef1.77 ± 0.063 b5.02 ± 0.078 d0.352 ± 0.0047 c
100045.6 ± 1.0 bc5.16 ± 0.178 cd1.20 ± 0.178 e3.96 ± 0.074 c0.76 ± 0.0047 cd0.65 ± 0.031 bd0.820 ± 0.022 e5.125 ± 0.079 d0.160 ± 0.0169 f
200016.4 ± 4.5 f4.71 ± 0.17 d1.28 ± 0.17 cd3.43 ± 0.064 f0.72 ± 0.0071 de0.67 ± 0.036 bc0.890 ± 0.035 e3.655 ± 0.079 g0.243 ± 0.0063 d
75021.9 ± 4.5 ef4.47 ± 0.107 h1.34 ± 0.107 b3.13 ± 0.084 g0.70 ± 0.0011 e0.60 ± 0.034 cd2.085 ± 0.071 a4.212 ± 0.071 f0.495 ± 0.0021 b
100040.6 ± 0.8 c4.95 ± 0.113 ef1.31 ± 0.113 bc3.64 ± 0.067 e0.73 ± 0.0087 de0.73 ± 0.029 b1.567 ± 0.065 c4.608 ± 0.067 e0.340 ± 0.0191 cd
200014.9 ± 2.4 f4.05 ± 0.101 i1.45 ± 0.101 a2.60 ± 0.034 h0.64 ± 0.0014 f0.83 ± 0.016 a1.742 ± 0.039 b2.963 ± 0.058 h0.587 ± 0.0088 a
LSD at 0.05%0.750.0.0390.170.150.0450.0900.0740.130.052
S.O.V.
NaCl.3220110.68 *1.366 **0.576 **3.582 **0.044 **0.244 **5.970 **10.02 **0.535 **
ZnO-NPs1481.61 **1.720 **0.067 **2.440 **0.013 **0.004 ns2.008 **1.67 **0.214 **
NaCl × ZnO-NPs732.81 **0.071 **0.005 *0.102 **0.001 **0.070 **0.374 **0.339 **0.057 **
Error143.30.0110.0010.0120.0000.0030.0020.0070.002
C.V.12.323.388.662.9010.2110.868.8011.7412.56
ns, * and ** refer to no-significant difference, significant at 5% and 1% probability level, respectively. S.O.V. refers to the source of variation. Different letters at each column indicate a significant difference at p ≤ 0.05.
Table 2. ANOVA for the effects of ZnO nanoparticle foliar use on the physiological traits and enzymatic antioxidant activity of pepper plants under salinity.
Mean square
S.O.V.dfProlineElectrolyte Leakage H2O2 ContentGPX
Activity
APX
Activity
SOD Activity GR
Activity
NaCl325.99 ns600.3 **5.896 **3.396 **0.055 **2.002 *0.052 **
ZnO-NPs299.37 **232.5 *2.764 **1.363 **0.017 *0.658 **0.041 *
NaCl × ZnO-NPs577.20 **36.50 **0.439 **0.240 **0.001 **0.117 **0.003 **
Error3613.761.040.0160.0010.0020.0020.003
C.V.15.077.388.3813.0211.4214.3512.84
ns, * and ** refer to no-significant difference, significant at 5% and 1% probability level, respectively. S.O.V. refers to the source of variation.
Table 3. ANOVA for the effect of ZnO nanoparticle foliar treatment on the physiological responses and non-enzymatic antioxidants pool of pepper plants under salinity.
Mean Square
S.O.V.dfAsA DHA ASA/DHAGSHGSSG GSH/GSG
NaCl35092.6 **19,276.8 **11.92 **1838.2 **3165.4 **1.074 **
ZnO-NPs210,354.3 **7359.8 **7.408 **7267.1 *6300.5 **3.555 *
NaCl × ZnO-NPs51028.02 **1194.8 **1.207 **818.9 **1066.6 **0.541 **
Error3616.7912.770.01010.777.2990.004
C.V.9.1911.9213.519.1110.9811.94
*, ** and ns, significant at 5% and 1% probability levels and non-significant, respectively. S.O.V. and df refer to the source of variation and degree of freedom, respectively.
Publisher’s Note: MDPI stays neutral with regard to jurisdictional claims in published maps and institutional affiliations.

