Article

Comparative Growth, Photosynthetic Pigments, and Osmolytes Analysis of Hemp (Cannabis sativa L.) Seedlings under an Aeroponics System with Different LED Light Sources

by
Md. Jahirul Islam
1,2,†,
Byeong Ryeol Ryu
1,†,
Md. Obyedul Kalam Azad
1,
Md. Hafizur Rahman
1,†,
Md. Soyel Rana
1,
Chang-Won Kang
3,
Jung-Dae Lim
1,* and
Young-Seok Lim
1,*
1
Department of Bio-Health Convergence, College of Biomedical Science, Kangwon National University, Chuncheon 24341, Korea
2
Physiology and Sugar Chemistry Division, Bangladesh Sugarcrop Research Institute, Ishurdi 6620, Bangladesh
3
Department of Biotechnology, Kangwon National University, Chuncheon 24341, Korea
*
Authors to whom correspondence should be addressed.
These authors contribute equally.
Horticulturae 2021, 7(8), 239; https://doi.org/10.3390/horticulturae7080239
Submission received: 7 July 2021 / Revised: 6 August 2021 / Accepted: 9 August 2021 / Published: 10 August 2021
(This article belongs to the Special Issue Smart Farming Techniques for Protected Horticulture Facilities)

Abstract

:
The performance of hemp seedlings was evaluated through morphological traits, photosynthetic pigments, and osmolytes under 11 light treatments (10 LED light compositions + natural light) in an aeroponics system. The seedlings were brought under treatment at 25 days of age, where the light intensity was 300 µmol m−2s−1 and duration was 20 days. A higher leaf number and node number were observed in L10 (R4:B2:W2:FR1:UV1) and L11 (R2:B2:G2:W2:FR1:UV1), and a higher leaf length and leaf width were recorded in the L2 (white), L3 (R8:B2), and L5 (R7:B2:FR1) treatments. Furthermore, a higher shoot length was recorded in L3 (R8:B2), L6 (R6:B2:G1:FR1), and L9 (R6:B2:FR1:UV1) while roots developed more in the L1 (natural light), L5 (R7:B2:FR1), and L9 (R6:B2:FR1:UV1) treatments. On the other hand, the L3 (R8:B2) treatment manifested higher chlorophyll a, chlorophyll b, and photosynthetic quantum yield (Fv/Fm). The hierarchical clustering and heatmap analysis revealed that higher leaf numbers and node numbers resulted in bushy plants with shorter shoots and longer roots. A negative correlation was also observed in photosynthetic traits (pigments and fluorescence) with osmolytes and root length. Importantly, the treatments L4 (R7:B2:G1), L6 (R6:B2:G1:FR1), L8 (R5:B2:G1:FR1:UV1), and L11 (R2:B2:G2:W2:FR1:UV1) manifested higher nodes with a higher osmolyte content, such as proline, ascorbic acid, total soluble carbohydrate, and sucrose, which may be a helpful indicator for higher branches and inflorescences, and ultimately higher cannabinoids accumulation in the plants. The approach and findings of this study could provide future research with the baseline information on optimizing the light composition to produce hemp plants with ideal phenotypes.

1. Introduction

Plant growth, development, metabolism, and morphology can be greatly manipulated by the quality and duration of light [1]. Light quality denotes the color or wavelength adjacent to the surface of the plant, which affects plant growth, foliar and floral morphology, biochemical changes, and photosynthesis process [2]. Plants use light sources both as energy sources and to adjust to environmental conditions [3]. It was demonstrated that wavelengths ranging from 430 to 500 nm is effective for pigmentation, secondary metabolites production, chloroplast development, and functioning in photosynthesis [3,4]. The wavelength range 500–600 nm also influences chlorophyll production and photosynthetic activity [5,6]. On the other hand, the wavelength range 640–670 nm was found effective in leaf area, photosynthetic activity, and plant biomass accumulation [3,7]. Light quality and quantity also have a drastic effect on the excitation of PS I and PS II, which is directly interlinked with photosynthesis processes [8,9].
Light quality has a direct contribution to the formation of photosynthetic pigments, whose composition and concentration control the photosynthetic rate of plant leaves [10]. Blue light generally helps the biosynthesis of Chl a and Chl a/b ratios by modulating some gene expressions, such as MgCH, GluTR, and FeCH [11,12,13,14]. Blue light also enhances the total soluble carbohydrates (TSC) and starch accumulation efficiency, while RB treatment enhances the fresh mass and dry mass of the plant [15]. It was also reported that plants grown under blue light (400–500 nm) produce smaller leaves and shorter stem, green light (510–585 nm; a less photosynthetic efficient) reduce loss of lower leaves, and red light (620–700 nm) can prevent flowering; in turn, the combination of red and far-red light (700–780 nm) can promote flowering and elongation of leaf and stem [16].
Light is an inevitable component for plant growth and development, which is maintained by an elaborate light quality sensor called photoreceptors [17]. Among the photoreceptor, phytochromes (PHY) are sensitive to red and far-red, while cryptochromes and phototropins absorb UV-A and blue light. Plants mainly use these three photoreceptors to sense their light environment [18]. A low R:FR light ratio promotes the inactivation of phytochrome b and enhances the level of gibberellin (GA), which subsequently leads to degradation of growth retardants DELLA protein [19,20]. It was reported that despite the negative effect on quantum yield, plants attained a higher photosynthetic rate and biomass accumulation under supplemental UV-A radiation. This higher photosynthetic rate was due to an increase in stomatal conductance (gs), instead of the ratio of intracellular to ambient CO2 content (Ci/Ca) [21]. Hemp (Cannabis sativa L.) is an annual herb belonging to the Cannabaceae family, widely used for fiber and terpenophenol compounds (cannabinoids) [22]. Furthermore, light quality and quantity have a significant effect on the biologically active components, such as Δ9-tetrahydrocannabinol (THC), cannabichromene (CBC), and cannabidiol (CBD), in hemp plants [23,24]. Light also has an influencing role in the branching of hemp plants, where intense branching may develop a more compound raceme [25], desirable for higher cannabinoid accumulation. Therefore, the objective of the study was to determine the suitable LED spectra for higher growth and establishment of the suitable architecture of hemp plants to ensure the maximum content of the biologically active components.

2. Materials and Methods

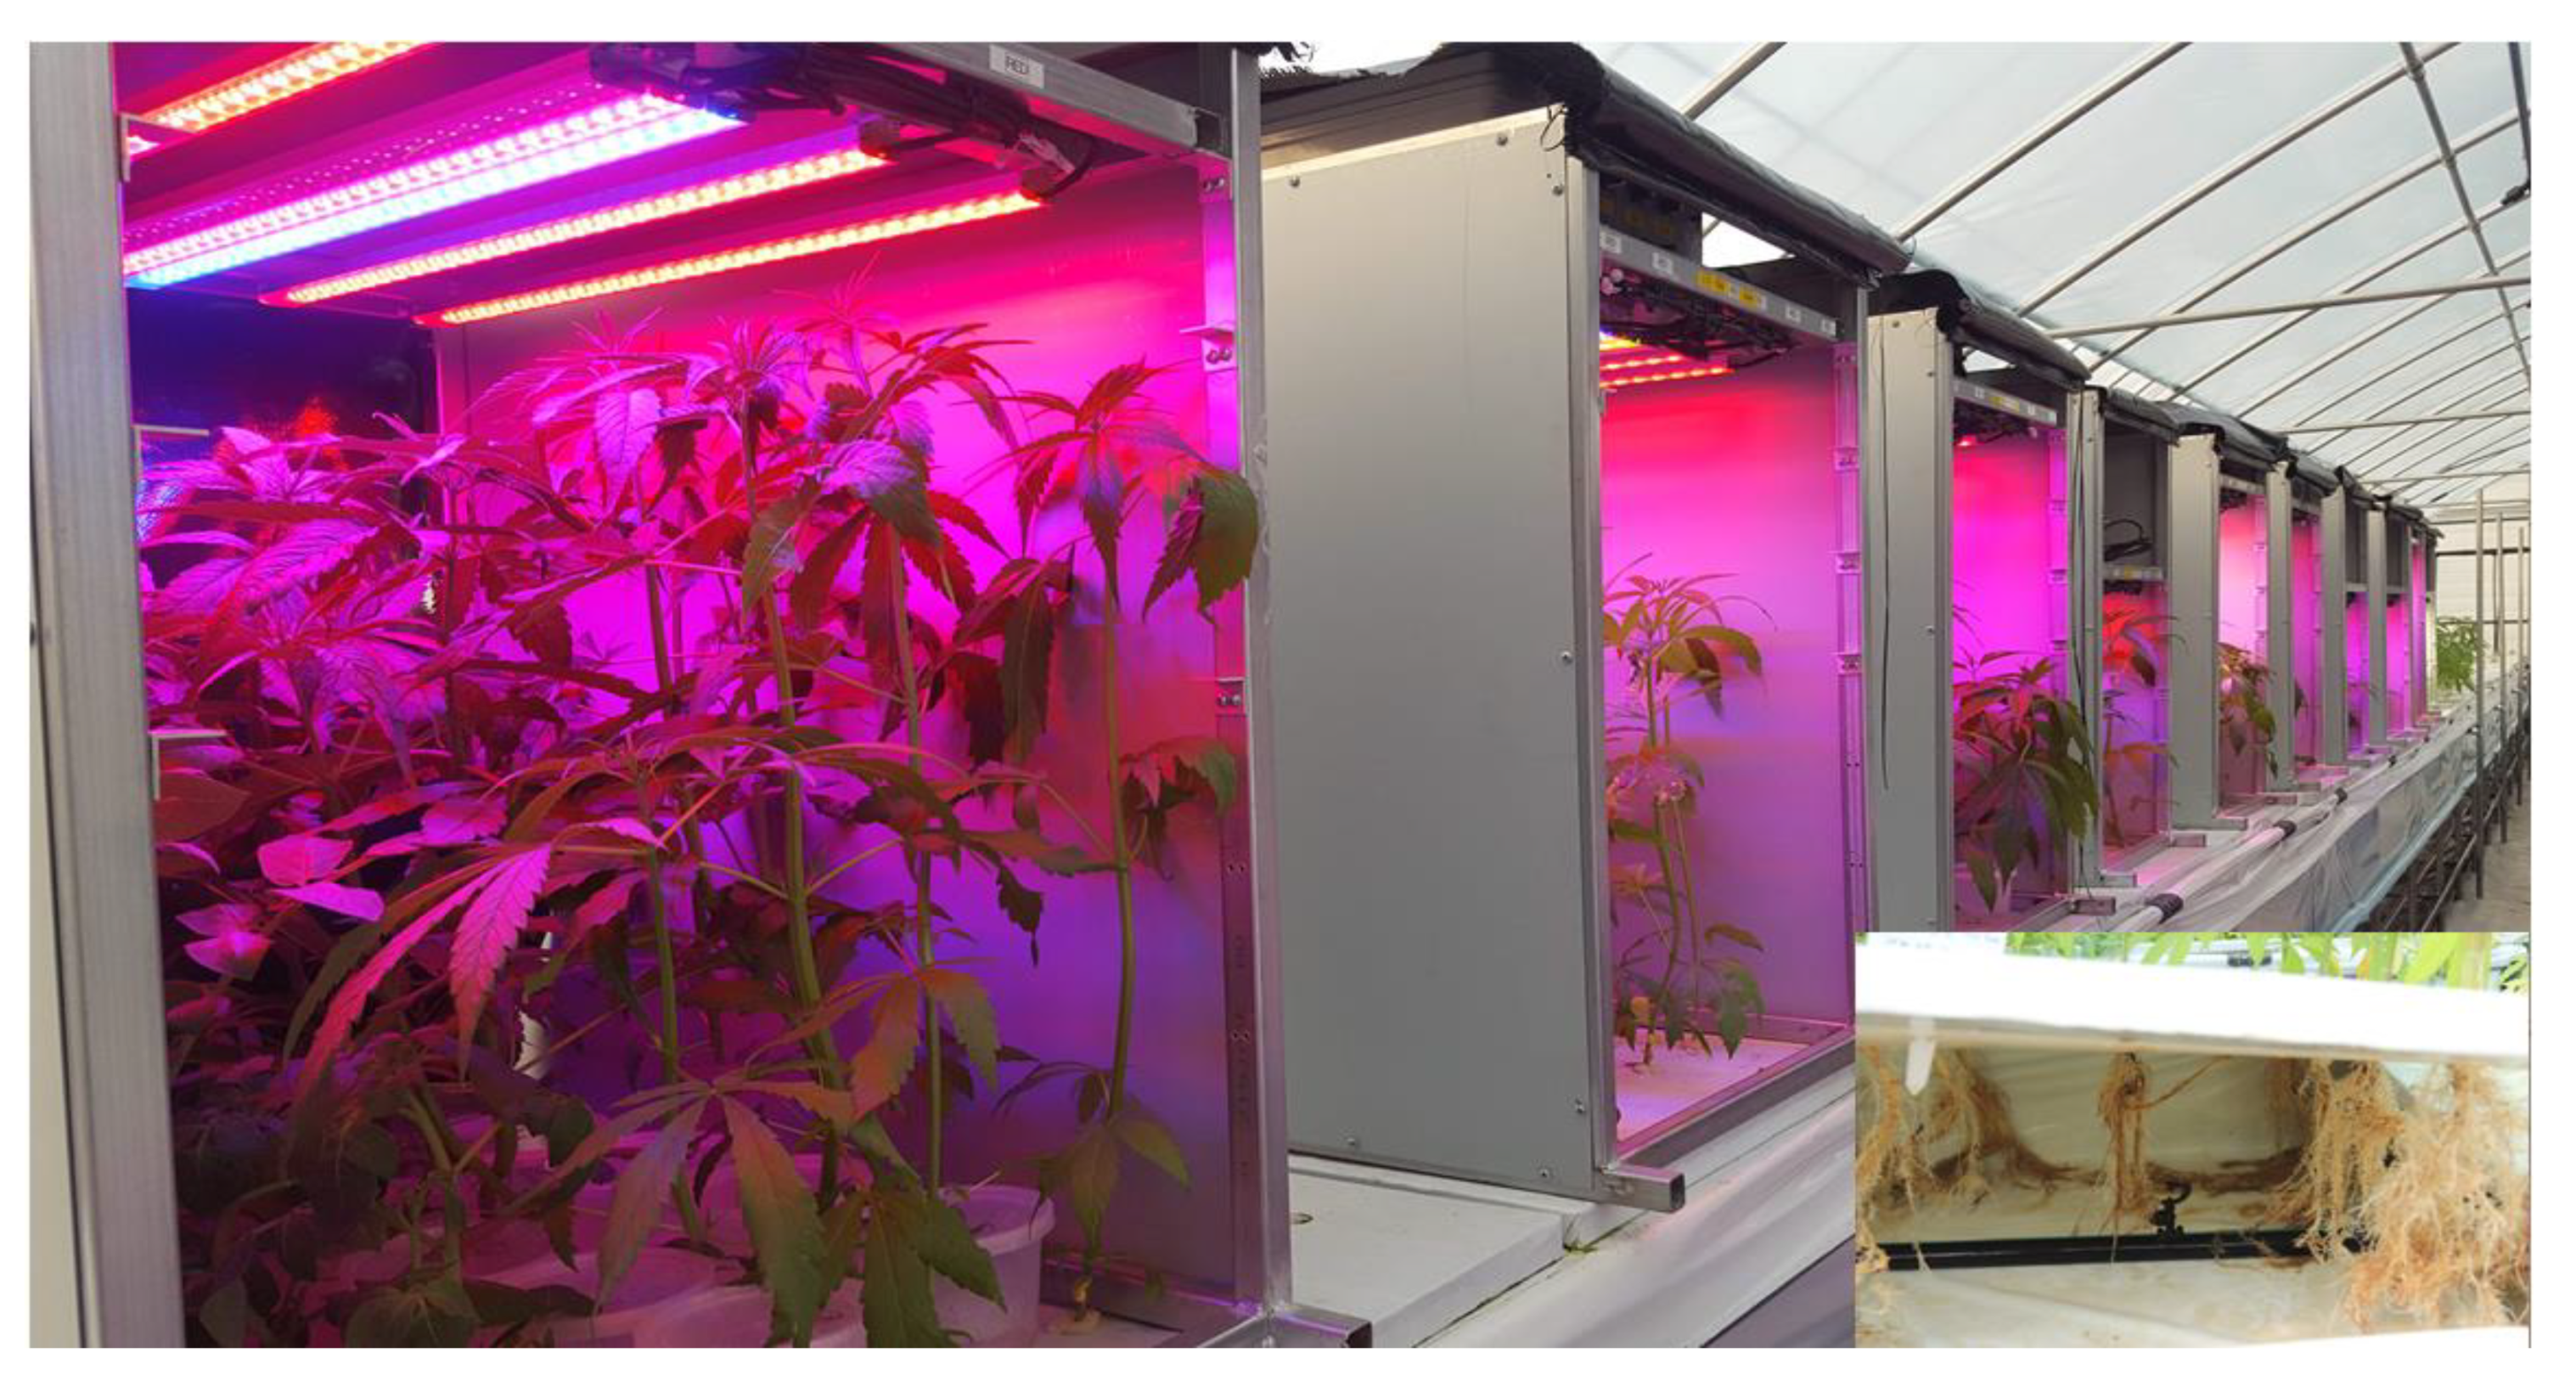
2.1. Experimental Design and Treatment

Hemp seeds (Cannabis sativa L. strain India) were sown in sixteen cells of a plug tray filled with commercial soil mixture (Bio-soil No. 1, Heungnong Agricultural Materials Mart, Korea) in a glasshouse. Before sowing, the seeds were sterilized (70% (v/v) ethanol, 0.1% (w/v) HgCl2, and 0.2% (w/v) thiram) and soaked in water for 24 h at room temperature to facilitate the germination. The environmental conditions, such as temperature, relative humidity (RH), and photoperiod, were set at 30/25 °C (day/night), 60–70 %, and 12 h, respectively. The seedlings were irrigated daily using tap water to the field capacity level. After three weeks, 20 uniformly grown seedlings were transferred to a steel-made chamber (80 cm × 60 cm × 80 cm) equipped with different LED light (Bisol LED light Co. Korea) combinations (Figure 1; Table 1). The plant growth chamber was designed for an aeroponics system where the nutrient solution (Table 2) was sprayed onto the plant root zone for twenty seconds every two minutes. The seedlings were adjusted with nutrient solution for 4 days without any artificial light. After that, the treatments were applied where the photosynthetic photon flux density (PPFD), photoperiod, and temperature of the chamber were 300 µmol m−2s−1, 16 h (6.00 a.m. to 10.00 p.m.), and 23 to 27 °C, respectively. The natural photoperiod ranged from 11.44 h to 12.32 h during treatment time (10–30 March 2020). After 20 days of treatments, sampling was done by randomly selecting three plants for each replication, where two replications were done for each treatment. The experiment was repeated one more time following the same conditions, where the natural photoperiod ranged from 11.44 h to 12.32 h (10–30 March 2020).

2.2. Determination of the Morphological Traits of Hemp Seedlings

Two samples (three plants/sample) from each chamber were randomly selected at the end of the treatment to determine the shoot length (SL), root length (RL), number of nodes (NN), number of leaves (LN), leaf length (LL), leaf width (LW), and plant fresh weight (PFW). The LN was counted from both the main stem and branches. The plant growth rate (PGR) was calculated based on the height differences between the 1st and 20th day of treatment application. The third leaf from the top was selected for measuring length and width.

2.3. Photosynthetic Pigments Analysis

2.3.1. Chlorophyll (Chl) and Carotenoid (Car) Determination

For the determination of photosynthetic pigments, the freeze-dried (25 mg) leaves were extracted (10 mL of 80% acetone) and placed at room temperature for 15 min, then centrifuged at 4000 rpm for 10 min. The absorbance was taken at 647, 663, and 470 nm, respectively, using a spectrophotometer (UV-1800 240 V, Shimadzu Corporation, Kyoto, Japan). Chlorophyll a, Chlorophyll b, and Car were determined according to the formula proposed by Lichtenthaler [26] and expressed as mg g−1 DW:
Chl a = 12.25 × A663 − 2.79 × A647
Chl b = 21.50 × A647 − 5.10 × A663
Car = [(1000 × A470) − (1.82 × Chl a) − (85.02 × Chl b)]/198

2.3.2. Determination of Photosystem II Quantum Yield

The photosynthetic quantum yield (Fv/Fm) of photosystem II (PSII) was measured using a Fluor Pen FP 100 (Photon system Instruments, Drasov 470, 66424 Drasov, Czech Republic) under the dark-adapted condition at least for 20 min [27].

2.4. Determination of Osmolytes

2.4.1. Free Proline Content

Proline concentration was determined by following the method of Bates et al. [28]. Approximately 25 mg of freeze-dried plant material was homogenized in 10 mL sulfosalicylic acid (3%) and filtered through Whatman’s filter paper. Two milliliters of the filtrate were mixed with a similar amount (2 mL) of acid-ninhydrin and glacial acetic acid. The mixture was heated for 1 h at 100 °C and cooled immediately in an ice bath. The reaction mixture was extracted with toluene (4 mL). The upper chromophore layer (upper layer) was aspirated and cooled to room temperature. The absorbance was taken at 520 nm with a UV-Vis spectrophotometer (UV-1800 240 V, Shimadzu Corporation, Kyoto, Japan), and calculations were done using an appropriate proline standard curve.

2.4.2. Total Soluble Carbohydrates (TSC) and Sucrose Content

A sample of freeze-dried leaves (25 mg) was homogenized in 5 mL ethanol (95%) followed by centrifuging at 3500 rpm for 10 min. After collecting the supernatant, the pellets were resuspended with 70% ethanol, and the process was repeated. Both supernatants were mixed together and kept in a refrigerator (4 °C) to determine the TSC and sucrose content [29].
The TSC content was determined according to Khoyerdi et al. [30]. At first, 0.1 mL of the aliquot was mixed with 1 mL anthrone (200 mg anthrone mixed with 100 mL of 72% sulfuric acid). The mixture was heated at 100 °C for 10 min and then cooled. The total soluble carbohydrates was estimated by using a glucose standard curve; the detection wavelength was 625 nm, and the results were expressed as mg g−1 dry weight.
Sucrose content was determined according to van Handel [31]. Briefly, 0.2 mL of the supernatant was mixed with 0.1 mL of KOH (30%) and heated at 100 °C for 10 min. After cooling at room temperature, 3 mL of anthrone (150 mg anthrone mixed with 100 mL 70% sulfuric acid) was added. Ten minutes later, the samples were cooled, and absorbance was read at 620 nm. The sucrose concentration was calculated using the standard curve, and the results were expressed as mg g−1 dry weight.

2.4.3. Ascorbic Acid

Ascorbic acid was determined by following the method described by Mukherjee and Choudhuri [32]. A sample of freeze-dried leaf sample (25 mg) was homogenized with 6% trichloroacetic acid (10 mL). After that, 4 mL of the extract was mixed with 2 mL of dinitrophenyl hydrazine (2%), and then 1 drop of 10% thiourea solution (in 70% ethanol) was added to the mixture. The mixture was boiled for 15 min and then allowed to cool to room temperature in a water bath. Then, 5 mL of 80% H2SO4 (v/v) were added to the mixture at 0 °C. The absorbance of the solution was read at 530 nm in a spectrophotometer and compared with the standard curve by using ascorbic acid ranges from 10 to 100 mg L−1.

2.5. Statistical Analysis

All results were expressed as the mean ± SE (standard error). A one-way analysis of variance was performed using Statistix 10 (Tallahassee, FL, USA) following a Complete Randomized Design (CRD) with 4 replications. Different letters indicate the statistically significant differences between the treatments at p < 0.05, according to the least significant differences (LSD). The heatmap and clustering analysis were prepared by MetaboAnalyst 4.0 (www.metaboanalyst.ca), accessed on 26 July 2021, where the samples were normalized by sum and auto-scaling features were applied. A hierarchical cluster analysis was conducted using the Euclidean distance metric (average linking clustering). The principal component analysis (PCA) was carried out using OriginLab 10.0 software (OriginLab, Northampton, MA, USA).

3. Results

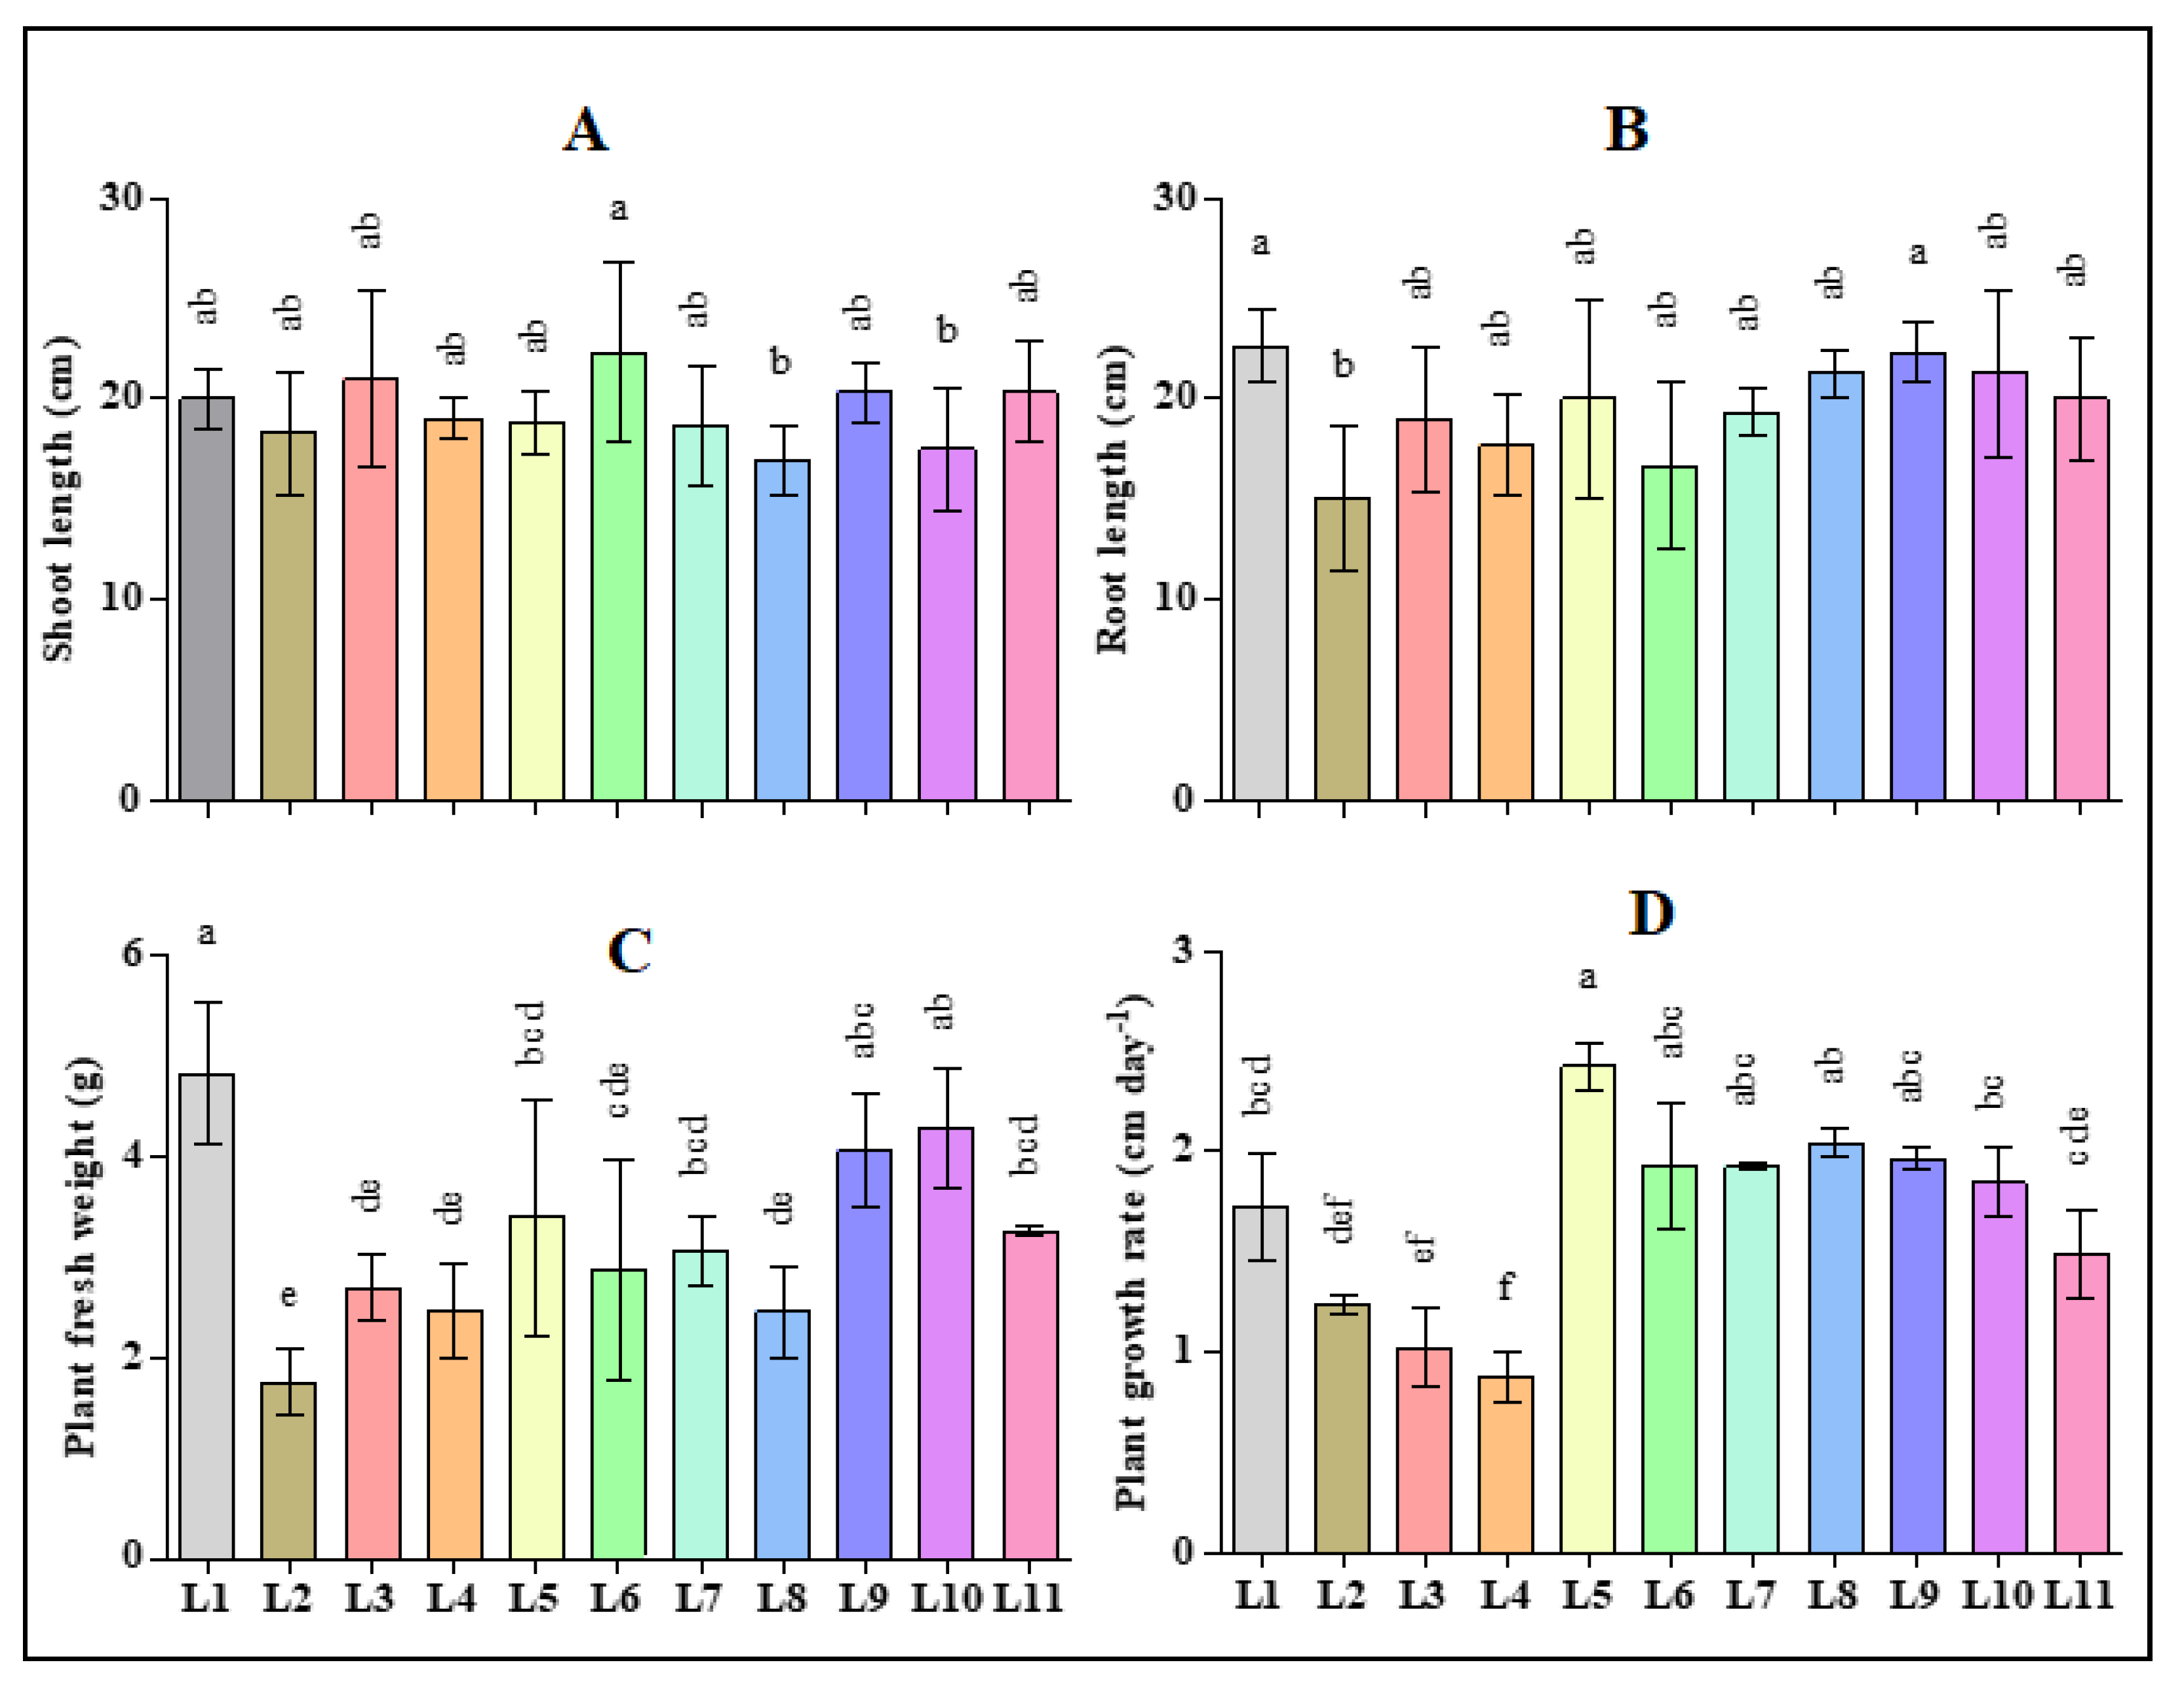
3.1. Effect of LED Light on the Morphological Traits of Hemp Seedlings

From the current study, it was observed that different combinations of light spectra have an effect on the SL, RL, PFW, and PGR of hemp seedlings (Figure 2). The maximum SL was recorded from L6, while the lowest plant height was recorded from L8 and L10. Higher RL and PFW were recorded in the L1, L9, and L10 spectra, while L2 gave the minimum value. On the other hand, the L5 treatment manifested the highest PGR whereas L2, L3, and L4 recorded the minimum PGR.
It was also observed that different combinations of light spectra have a significant effect (p ≤ 0.05) on the LN, NN, LL, and LW of hemp seedlings (Figure 3). From the results, both the L10 and L11 treatments gave higher LN and NN. On the other hand, both LL and LW were recorded higher in the L5 light treatment.

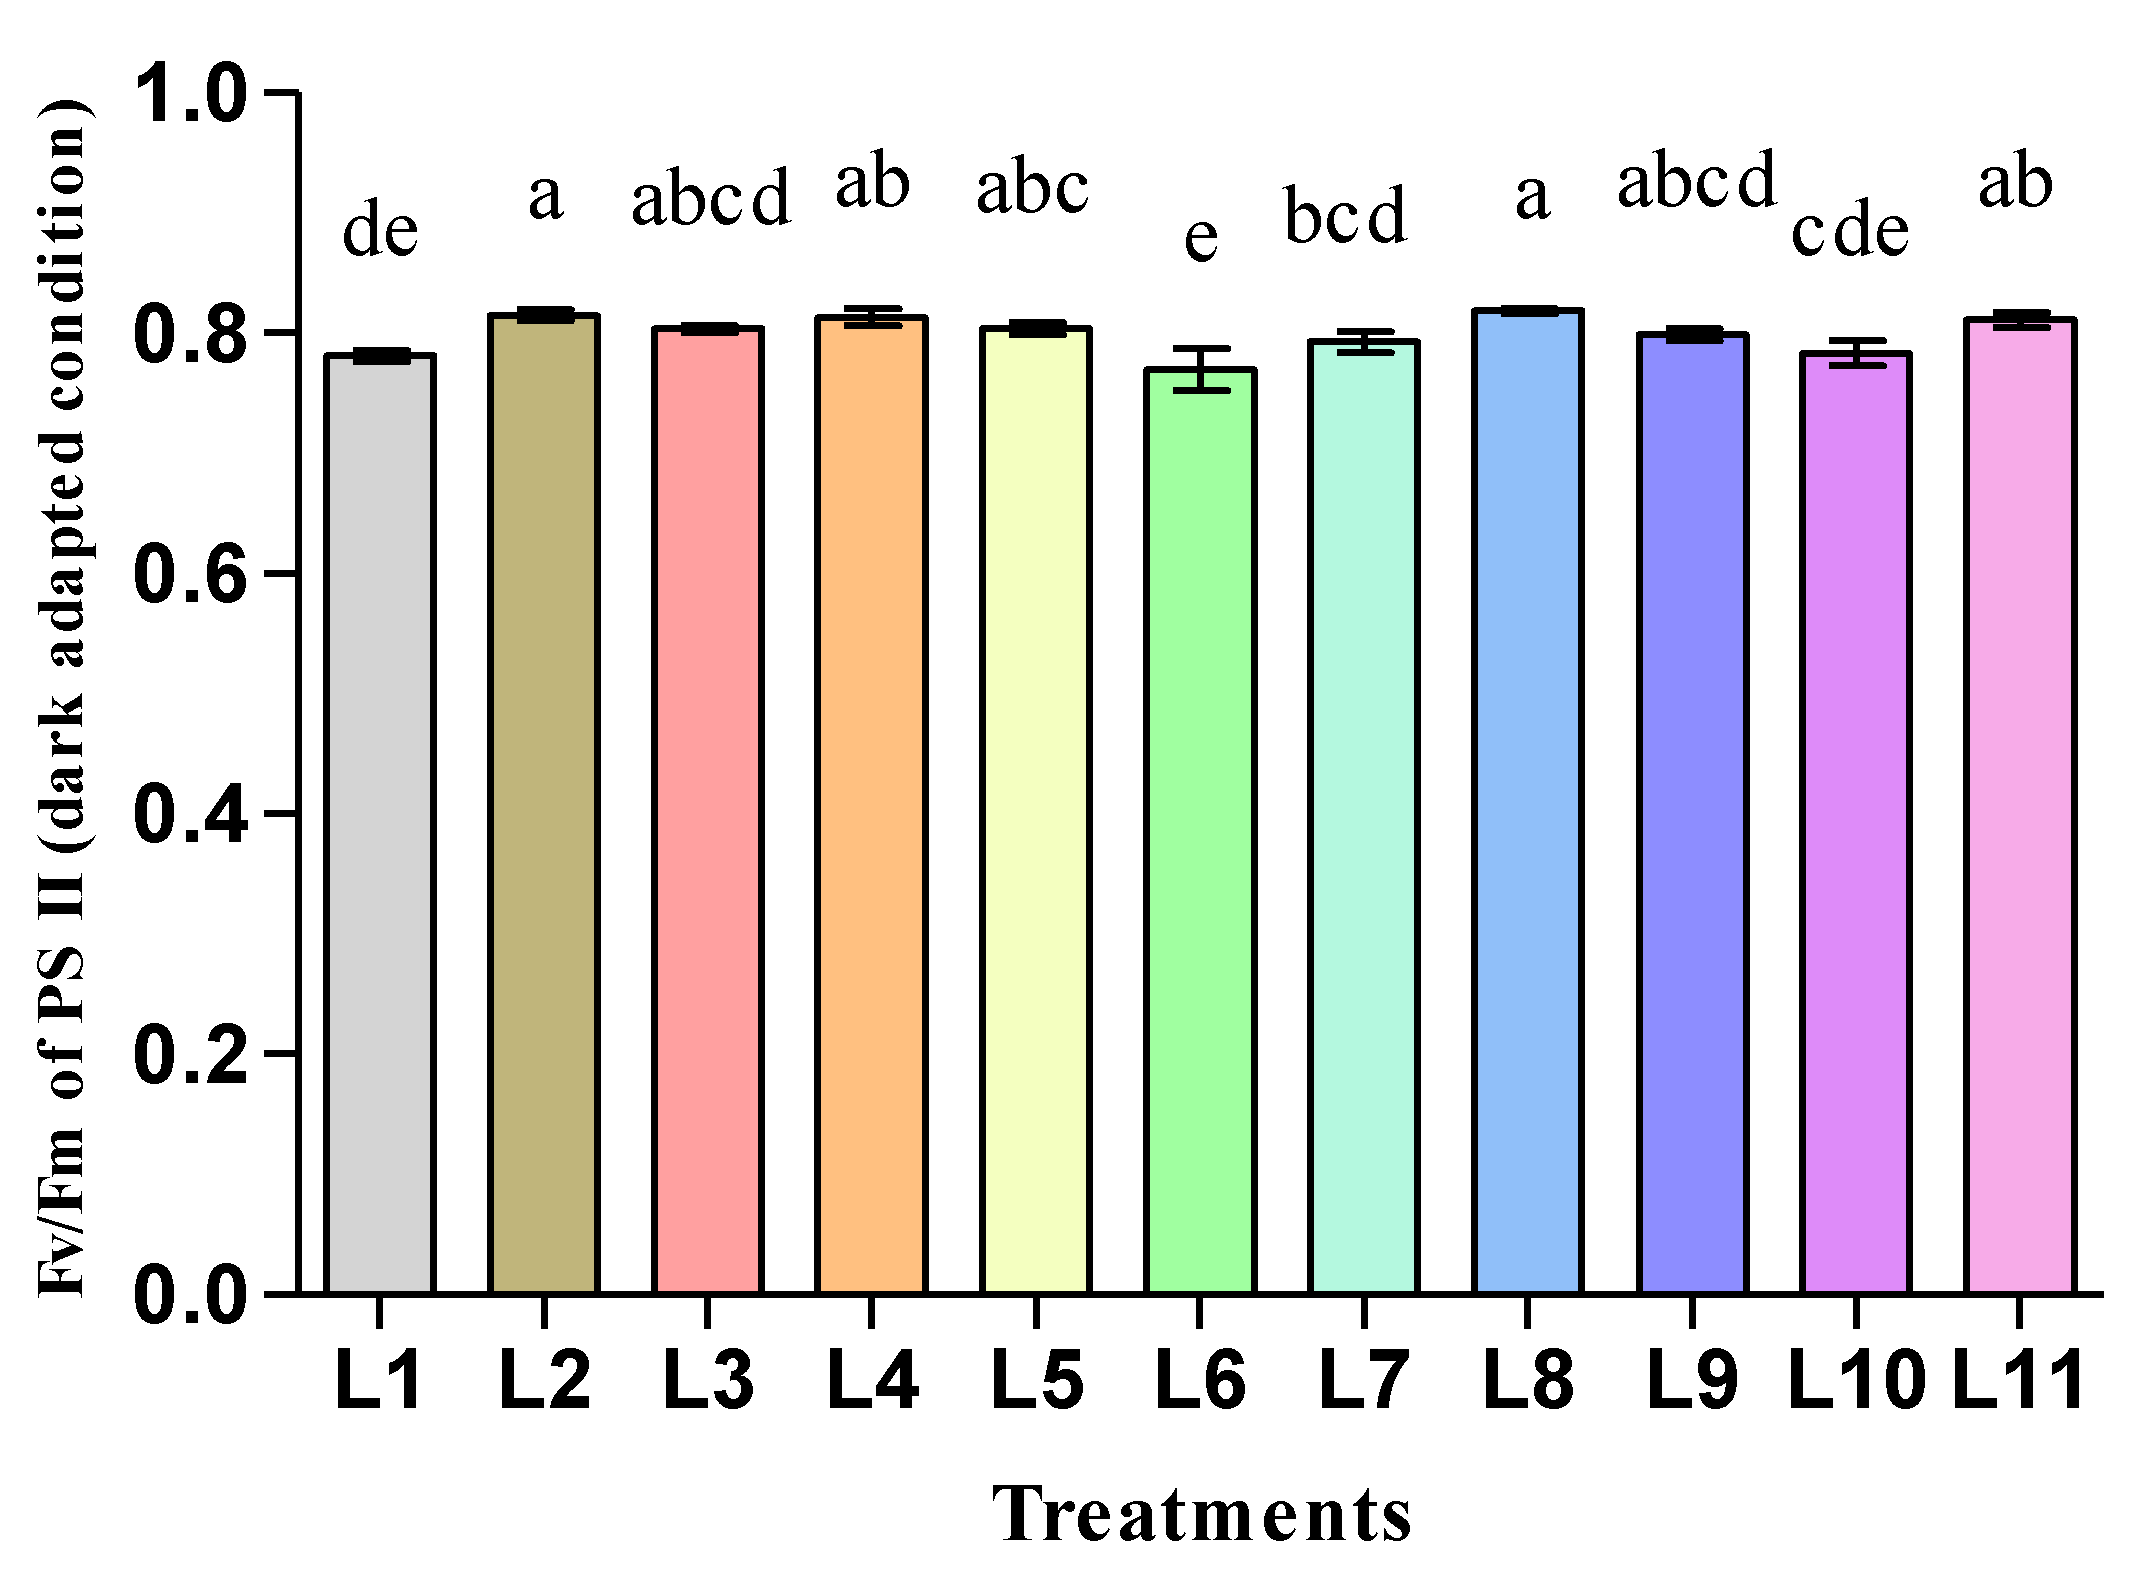
3.2. Effect of LED Light on the Photosynthetic Pigments and Fluorescence of Hemp Seedlings

Higher Chl a was recorded in L3 and L10 followed by L2, L4, L11, and L6, respectively (Figure 4). Higher Chl b was recorded in L3 followed by L2, L4, and L10. Higher Car was recorded in L8 and L11 followed by L1, L10, and L7. On the other hand, a higher chlorophyll a/b ratio was observed in the control (L1) followed by L9, L8, and L7, respectively.
On the other hand, photosynthetic quantum yield (under dark acclimated condition) ranged from 0.77 to 0.818, where it was found higher in L2 followed by L8, L4, L11, and L5, respectively, and lower in the L6 treatment (Figure 5).

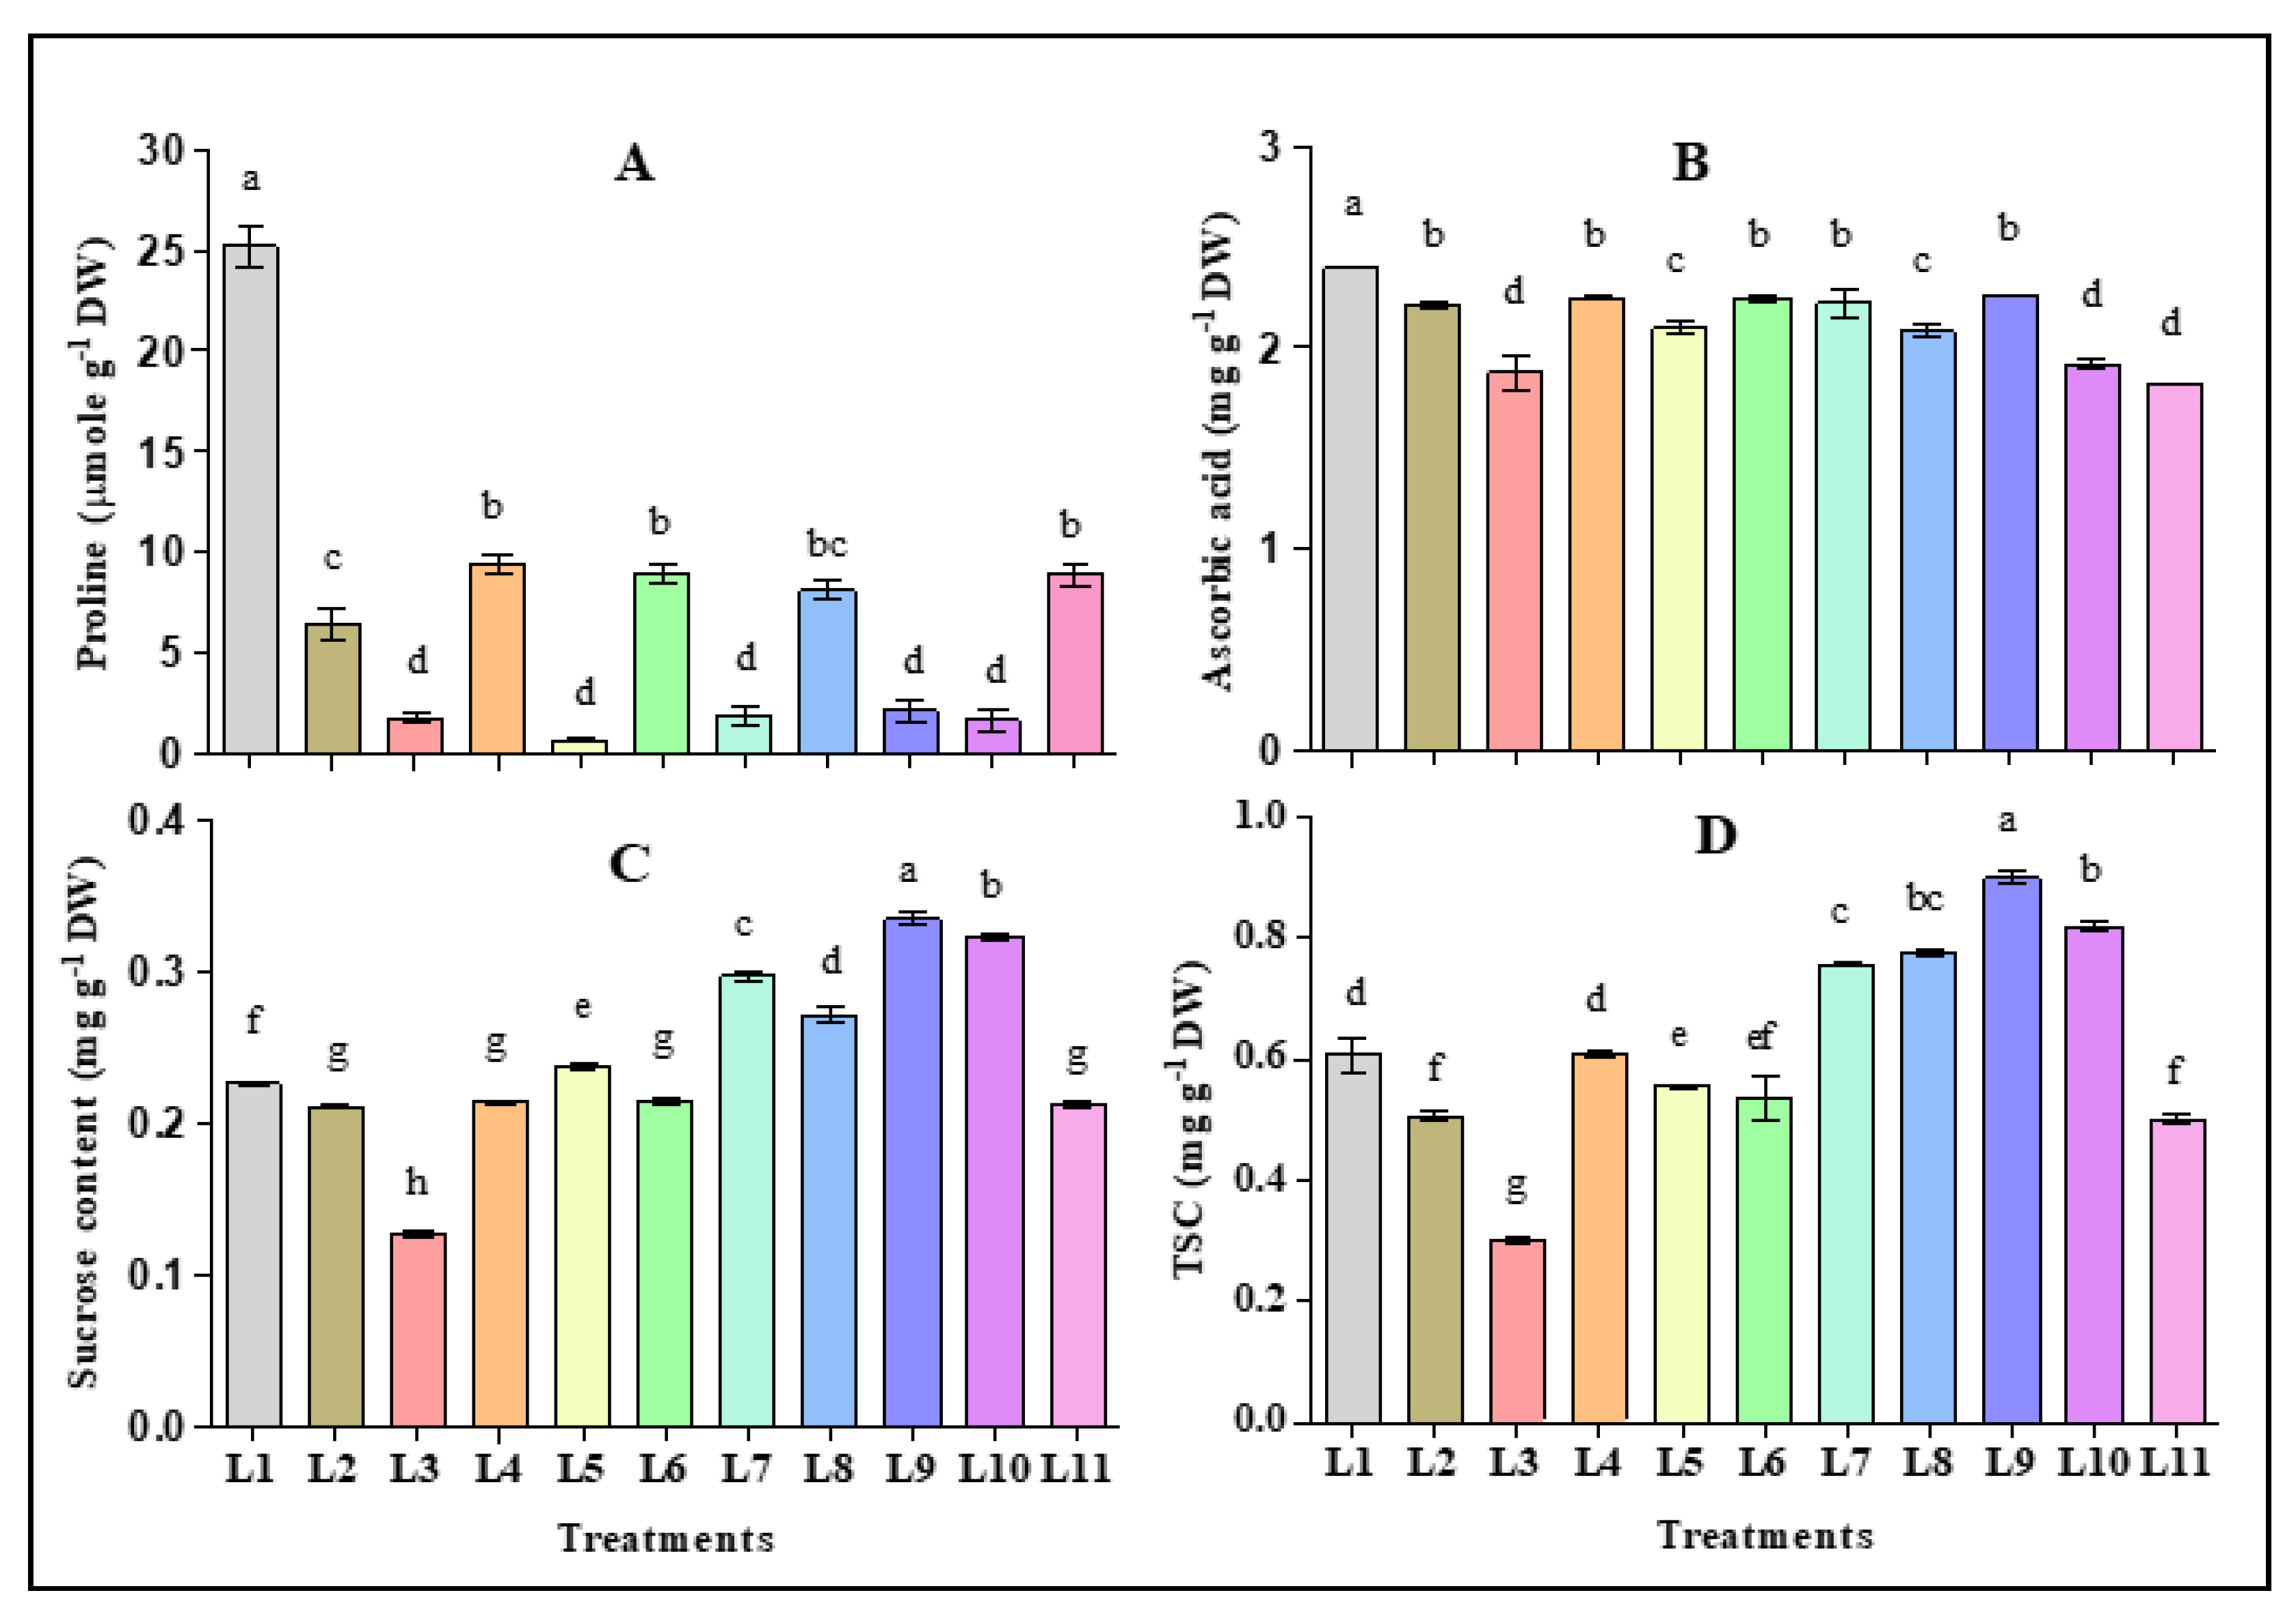
3.3. Effect of LED Light Spectra on Osmotic Adjustment Molecules

Each osmotic adjustment molecule varied according to the individual LED spectra in hemp leaves (Figure 6). Proline ranged from 25.22 to 0.62 (µmol g−1 dry weight), total soluble carbohydrate (TSC) ranged from 0.90 to 0.303 (mg g−1 dry weight), and sucrose content ranged from 0.335 to 0.127 (mg g−1 dry weight) across the 11 light sources. Under natural light, plants generated the highest amount of proline (p ≤ 0.05). Beside this, higher proline was also recorded from the L4, L6, L11, L7, and L2 light spectra. On the other hand, lower proline was observed from that of the L5, L10, L3, L9, and L8 spectra. Higher TSC was recorded from spectrum L9 followed by the L10, L8, and L7 spectra, while it was found lower in L3, L2, L11, L6, and L5. Higher sucrose content was observed from spectrum L9 followed by the L10, L8, and L7 spectra, while it was found lower in L3, L2, L4, L6, and L11. Higher ascorbic acid was recorded from natural light followed by L2, L4, L6, L7, and L9, respectively, while it was found lower in L11 followed by L3, L10, L5, and L8.

3.4. Hierarchical Clustering, Heatmap, and PCA Analysis Unveiled the Connection between Variables and Treatments

The morpho-physiological and biochemical data from the hemp seedlings under all treatments were employed to construct the heatmap, hierarchical clustering, and PCA. Hierarchical clustering grouped all the variables into two clusters (Cluster A and Cluster B) (Figure 7a). Hierarchical clustering and heatmap revealed that Cluster A was characterized by the photosynthetic pigments (Chl a and Chl b), Fv/Fm, leaf length, leaf width, shoot length, proline, and ascorbic acid. Cluster A also indicated a close relation of the photosynthetic pigments and fluorescence with shoot length and leaf area. On the other hand, Cluster B represents the leaf number, node number, root length, plant fresh weight, plant growth rate, Car, chlorophyll a/b ratio, total soluble carbohydrates, and sucrose content. Cluster B also indicated a close relation of growth rate, leaf number, and brach number with root length and plant fresh weight.
The PCA analysis was carried out to uncover the connection of the different parameters with the different treatment groups (Figure 7b). The PCA biplot reveals clear segregation of the treatments into two groups (L2, L3, L4, L5, and L6; and L1, L7, L8, L9, L10, and L11). The elements of PC1 and PC2 together described 60.67 % of the variability in the data. The results displayed that the variables that relate to photosynthetic pigments (Chl a, Chl b, and Fv/Fm) were negatively correlated with Pro, AsA, and RL. The biplot also showed that LL, LW, and SL maintained a negative correlation with LN and NN.

4. Discussion

Light spectral quality considerably affects plant shoots and roots regarding their growth and morphology, and their interaction [33,34]. In the present experiment, the longest RL was recorded from L1 and L9, and the opposite result was found from L2 and L6 (Figure 2). In a previous study, plant height and weight were found better in red light; RL was longer in red and natural light while shorter in white and blue light under greenhouse conditions [35]. In the present study, the addition of FR light to R and B (L5) increased the LL and LW, while decreasing the LN and NN (Figure 3). It was reported that the cannabis plant attained a higher plant height and leaf area in white light compared to the combination of red and blue light [36], but we did not find any significant differences in those morphological traits under similar light conditions. In a previous study, the addition of FR to R and B decreased the LL and SL of tomato plants while no significant effect was observed for RL and LN [37]. The PCA analysis revealed that LL, LW, and SL were negatively correlated with LN and NN (Figure 7). Results indicated that a higher number of leaves and branches will make the hemp plants shorter in size with narrow leaves and vice versa. Importantly, LN and NN were closely associated with the treatments L9, L10, and L11, whereas LL and LW manifested an opposite relationship with them (Figure 7). This may be due to the influence of UV-A, which reduced the leaf area but increased the leaf number and branching. Generally, UV radiation impacts the phytohormone auxin levels higher in leaf regions with high division activity and lower in areas of cell expansion [38], resulting in a decrease in adaxial pavement cell expansion [39]. Furthermore, compared to white light, PFW, PGR, and NN increased in most LED composition. The results indicate the incapability of monochromatic white light for plant growth and development, as it also resulted in lower TSC and sucrose accumulation in most cases. The PCA analysis indicated a negative relationship between the L2 treatment (white) and NN, PFW, PGR, TSC, and sucrose, which also had a positive correlation with the parameters.
An earlier study showed that the Chl a and Chl b contents increased in lettuce, basil, spinach, kale, and pepper under different combinations of R and B [40]. In our study, the Chl a and b of hemp plants were significantly increased, but the chlorophyll a/b ratio and Car drastically decreased in the L3 (R8:B2) treatment compared to L1 (Figure 4). Besides this, Chl a and b significantly increased, and the Chl a/b ratio significantly decreased in all treatments, while the carotenoid concentration was found decreased in the L2, L3, L4, L6, and L9 treatments compared to L1 (natural light). Similar results from a previous study described that a high ratio of both R:B and R:B:W manifested higher chlorophyll compared to natural light in Silene capitate Kom. [41]. Each of the plant pigments has been characterized by an absorbance pattern in wavelength called the absorbance spectrum, where the blue and red regions are absorbed strongly by Chl a and b, with less absorbance of other wavelengths [42]. It is also known that the Chl and Car pigments absorb 400–500 nm and 630–680 nm in the light spectrum in plants with the help of light-harvesting antenna [43,44]. The positive influence of red and blue light on Chl synthesis in the present study complies with these findings [45]. Furthermore, the accumulation of Car and the Chl a/b ratio were increased, whereas Chl b was decreased significantly under the spectra composed with green light (L4, L6, L8, and L11) when compared to the red and blue spectra (L3). Since red and blue light are absorbed by photosynthetic pigments more strongly, their influence is predominant in the upper cell layers, while green light can penetrate deeper into leaf tissues and excite the photosystem in the deeper cell layer [46]. On the other hand, Car are lipid-soluble colored pigments that mostly consist of carotenes and xanthophylls (red and orange in color), whose absorbance range extend into the green region (400–500 nm, peaking at around 470 nm), effectively cover the poorest region of chlorophyll absorbance (500–550 nm) [47]. Thus, the addition of green light along with others in the present study might increase the concentration of Car.
The photochemical activity of photosystem II (PS II) is expressed by Fv/Fm, which characterizes the maximum efficiency of the photochemical activity under PS II [48], where Fv (Fm-F0), Fm, and F0 denotes the maximal variable fluorescence, maximal fluorescence intensity, and fluorescence intensity at 50 µs, respectively. The photosynthetic fluorescence is a byproduct of the photosynthetic process created by trapping light energy at the reaction center within a photosynthetic membrane and after being used in photochemistry that dissipates along with heat energy [49,50]. A decreasing trend in Fv/Fm was observed in the treatments L1, L6, L7, and L10 in the present study (Figure 5). A lower Fv/Fm may be a consequence of decreasing Fm, since F0 does not change too much in light stress [49]. Besides light stress, a decreasing trend in Fv/Fm by reducing Fm was also observed under stress from heat, ozone, and other pollutants [49,51]. Interestingly, Fv/Fm was found higher in the white, R:B:W, and R:B:G ratio in some previous studies [41,52], which quite supports our present findings. PCA analysis revealed that Chl a, Chl b, and Fv/Fm were negatively correlated with Pro, AsA, RL, PFW, and Car (Figure 7). Higher accumulation of osmolytes and Car indicates a stress response of plants where oxidative stress reduces photosynthetic pigments and fluorescence [53]. In this connection, the treatments L2, L3, and L4 were found closely associated with higher photosynthetic pigments and fluorescence efficiency, which indicated that UV A and far-red has very little influence on the photosynthetic pigmentation of hemp plants.
Proline is an important compound as its synthesis and catabolism play an important role in the stress adaptation of plants by keeping in balance the redox reaction [54,55]. Under stress conditions, ROS-mediated regulation, including H2O2, can upregulate P5CS and downregulate PRODH activity in the plant, which can trigger the biosynthesis of proline [56,57,58]. Over biosynthesis of proline by the overexpression of P5CS may play an important role in flower initiation and bolting promotion at the early stage of plant development [59,60]. Lower photosynthetic pigments and fluorescence with higher accumulation of proline in the present study indicate a stress response of plants in the L1 treatment (Figure 6). This stress may be due to the lower intensity of natural light under greenhouse conditions.
Carbohydrates are the main source of energy and are considered the main criterion of cell division activity in plants, and their concentration depends on the amount of photosynthetically active radiation [61]. In a previous study, it was reported that UV-A light influenced the plants to accumulate more carbohydrates [21], whereas at a low R:FR ratio plants accumulated more soluble sugar, carbohydrates, and secondary metabolites [17,62]. The ratio of red spectrum ranged from 40 to 60%, with other light sources increasing the TSC and sugar in L7, L8, L9, and L10 (Figure 6). The monochromatic red, blue, and their combined spectra manifested decreased soluble carbohydrate in Anthurium cut flowers in a previous study [63]. Our present study also found a lower TSC and sucrose content in combined red-blue spectra compared to all other treatments. From the PCA analysis, it can be revealed that both the TSC and sucrose content manifested a negative correlation with SL, LL, and LW (Figure 7) and are closely associated with the L9 treatment. A possible explanation is based on the fact that under stress plants produce excess carbon skeletons to prevent the declining trend in photosynthetic rate and growth in plants, which help to increase osmolytes production [64]. The reduced photosynthetic pigments (Chl a and Chl b), LL, and LW under the L9 treatment in the present study quite support this hypothesis.
Our study found a similar pattern of TSC and sucrose content while little dissimilarities were also observed from ascorbic acid under different light spectra. It was narrated that TSC are the precursor for ascorbic acid biosynthesis, and mature green tomatoes can achieve both compounds in higher amounts under high irradiance of light, but no correlations were observed in a series of experiments between them [65]. These results indicate that the accumulation of sucrose content and TSC is interdependent, whereas ascorbic acid is independent of both compounds. Moreover, plants accumulate all osmoprotectant molecules (proline, AsA, sucrose, and TSC) significantly higher when the green light was added to the other light spectra (L4, L6, L8, and L11), compared to the red and blue combination (L3).

5. Conclusions

A complex response of hemp seedlings along with variation among the parameters was observed under different light spectra. A higher leaf number and node number were observed in L11 (R2 + B2 + G2 + W2 + FR1 + UV1), whereas a higher leaf length and leaf width were recorded in L2 (W), L3 (R8 + B2), and L5 (R7:B2:FR1). Furthermore, higher shoots were recorded in L3 (R8:B2), L6 (R6:B2:G1:FR1), and L9 (R6:B2:FR1:UV1), while roots developed more in the L1 (natural light), L5 (R7:B2:FR1), and L9 (R6:B2:FR1:UV1) treatments. On the other hand, L3 (R8:B2) manifested higher chlorophyll a, chlorophyll b, and photosynthetic quantum yield (Fv/Fm), with a lower accumulation of osmolytes such as proline, ascorbic acid, total soluble carbohydrates, and sucrose. Leaf length, leaf width, and shoot length have a negative correlation with leaf number and node number. A negative correlation was also observed in photosynthetic traits (pigments and fluorescence) with osmolytes and root length. Finally, the treatments L4 (R7:B2:G1), L6 (R6:B2:G1:FR1), L8 (R5:B2:G1:FR1:UV1), and L11 (R2:B2:G2:W2:FR1:UV1) seems to be more suitable for hemp cultivation as they manifested bushy-type plants, desirable for higher inflorescence number with more bioactive compounds.

Author Contributions

M.J.I., B.R.R. and M.H.R. conceived and designed the experiments, carried out all the experimental works, collected and analyzed the data, and drafted the final manuscript; M.O.K.A., M.S.R. and C.-W.K. improved the manuscript; J.-D.L. and Y.-S.L. validated all the protocols and supervised the study. All authors have read and agreed to the published version of the manuscript.

Funding

This research did not receive any specific grant.

Institutional Review Board Statement

Not applicable.

Informed Consent Statement

The study followed the relevant institutional and national guidelines and legislation, with research permission (license number 1770) from the Ministry of Food and Drug Safety (MFDS), Korea.

Data Availability Statement

Not applicable.

Acknowledgments

This research was supported by the Ministry of Science and ICT (MSIT, Korea, (support program: 2021-DD-UP-0379) and the BK21 FOUR program of the National Research Foundation (NRF, Korea). The authors also express their gratitude and profound appreciation to the CBF (Chuncheon Bioindustry Foundation, Korea) and Chuncheon City for their support in hemp variety breeding project.

Conflicts of Interest

The authors declare no competing interest.

References

  1. Folta, K.M.; Carvalho, S.D. Photoreceptors and control of horticultural plant traits. HortScience 2015, 50, 1274–1280. [Google Scholar] [CrossRef] [Green Version]
  2. Lee, S.-H.; Tewari, R.K.; Hahn, E.-J.; Paek, K.-Y. Photon flux density and light quality induce changes in growth, stomatal development, photosynthesis and transpiration of Withania somnifera (L.) Dunal. plantlets. Plant Cell. Tissue Organ Cult. 2007, 90, 141–151. [Google Scholar] [CrossRef]
  3. Yavari, N.; Tripathi, R.; Wu, B.-S.; MacPherson, S.; Singh, J.; Lefsrud, M. The effect of light quality on plant physiology, photosynthetic, and stress response in Arabidopsis thaliana leaves. PLoS ONE 2021, 16, e0247380. [Google Scholar] [CrossRef] [PubMed]
  4. Li, C.-X.; Xu, Z.-G.; Dong, R.-Q.; Chang, S.-X.; Wang, L.-Z.; Khalil-Ur-Rehman, M.; Tao, J.-M. An RNA-seq analysis of grape plantlets grown in vitro reveals different responses to blue, green, red LED light, and white fluorescent light. Front. Plant Sci. 2017, 8, 78. [Google Scholar] [CrossRef] [PubMed] [Green Version]
  5. Ma, X.; Wang, Y.; Liu, M.; Xu, J.; Xu, Z. Effects of green and red lights on the growth and morphogenesis of potato (Solanum tuberosum L.) plantlets in vitro. Sci. Hortic. 2015, 190, 104–109. [Google Scholar] [CrossRef]
  6. Wu, Q.; Su, N.; Shen, W.; Cui, J. Analyzing photosynthetic activity and growth of Solanum lycopersicum seedlings exposed to different light qualities. Acta Physiol. Plant. 2014, 36, 1411–1420. [Google Scholar] [CrossRef]
  7. Johkan, M.; Shoji, K.; Goto, F.; Hashida, S.; Yoshihara, T. Blue light-emitting diode light irradiation of seedlings improves seedling quality and growth after transplanting in red leaf lettuce. HortScience 2010, 45, 1809–1814. [Google Scholar] [CrossRef] [Green Version]
  8. Croce, R.; Van Amerongen, H. Natural strategies for photosynthetic light harvesting. Nat. Chem. Biol. 2014, 10, 492–501. [Google Scholar] [CrossRef]
  9. Zavafer, A.; Cheah, M.H.; Hillier, W.; Chow, W.S.; Takahashi, S. Photodamage to the oxygen evolving complex of photosystem II by visible light. Sci. Rep. 2015, 5, 16363. [Google Scholar] [CrossRef] [PubMed] [Green Version]
  10. Fan, X.; Zang, J.; Xu, Z.; Guo, S.; Jiao, X.; Liu, X.; Gao, Y. Effects of different light quality on growth, chlorophyll concentration and chlorophyll biosynthesis precursors of non-heading Chinese cabbage (Brassica campestris L.). Acta Physiol. Plant. 2013, 35, 2721–2726. [Google Scholar] [CrossRef]
  11. Rivkin, R.B. Influence of irradiance and spectral quality on the carbon metabolism of phytoplankton. I. Photosynthesis, chemical composition and growth. Mar. Ecol. Prog. Ser. Oldend. 1989, 55, 291–304. [Google Scholar] [CrossRef]
  12. Wang, H.; Gu, M.; Cui, J.; Shi, K.; Zhou, Y.; Yu, J. Effects of light quality on CO2 assimilation, chlorophyll-fluorescence quenching, expression of Calvin cycle genes and carbohydrate accumulation in Cucumis sativus. J. Photochem. Photobiol. B Biol. 2009, 96, 30–37. [Google Scholar] [CrossRef]
  13. Poudel, P.R.; Kataoka, I.; Mochioka, R. Effect of red-and blue-light-emitting diodes on growth and morphogenesis of grapes. Plant Cell. Tissue Organ Cult. 2008, 92, 147–153. [Google Scholar] [CrossRef]
  14. Sood, S.; Gupta, V.; Tripathy, B.C. Photoregulation of the greening process of wheat seedlings grown in red light. Plant Mol. Biol. 2005, 59, 269–287. [Google Scholar] [CrossRef]
  15. Fan, X.; Jie, Z.; Xu, Z.; Jiao, X.; Liu, X.; Ying, G. Effects of different light spectra on photosynthetic structures and photosynthate of non-heading Chinese cabbage. Res. Crop. 2013, 14, 555–560. [Google Scholar]
  16. Wang, Y.; Folta, K.M. Contributions of green light to plant growth and development. Am. J. Bot. 2013, 100, 70–78. [Google Scholar] [CrossRef]
  17. Courbier, S.; Pierik, R. Canopy light quality modulates stress responses in plants. Iscience 2019, 22, 441–452. [Google Scholar] [CrossRef] [PubMed] [Green Version]
  18. Quail, P.H.; Boylan, M.T.; Parks, B.M.; Short, T.W.; Xu, Y.; Wagner, D. Phytochromes: Photosensory perception and signal transduction. Science 1995, 268, 675–680. [Google Scholar] [CrossRef] [PubMed]
  19. Djakovic-Petrovic, T.; Wit, M. de; Voesenek, L.A.C.J.; Pierik, R. DELLA protein function in growth responses to canopy signals. Plant J. 2007, 51, 117–126. [Google Scholar] [CrossRef]
  20. Li, K.; Yu, R.; Fan, L.-M.; Wei, N.; Chen, H.; Deng, X.W. DELLA-mediated PIF degradation contributes to coordination of light and gibberellin signalling in Arabidopsis. Nat. Commun. 2016, 7, 11868. [Google Scholar] [CrossRef] [Green Version]
  21. Samuolienė, G.; Viršilė, A.; Miliauskienė, J.; Haimi, P.; Laužikė, K.; Jankauskienė, J.; Novičkovas, A.; Kupčinskienė, A.; Brazaitytė, A. The Photosynthetic Performance of Red Leaf Lettuce under UV-A Irradiation. Agronomy 2020, 10, 761. [Google Scholar] [CrossRef]
  22. Ryu, B.R.; Islam, M.; Azad, M.; Kalam, O.; Go, E.-J.; Rahman, M.; Rana, M.; Lim, Y.-S.; Lim, J.-D. Conversion Characteristics of Some Major Cannabinoids from Hemp (Cannabis sativa L.) Raw Materials by New Rapid Simultaneous Analysis Method. Molecules 2021, 26, 4113. [Google Scholar] [CrossRef]
  23. Mahlberg, P.G.; Hemphill, J.K. Effect of light quality on cannabinoid content of Cannabis sativa L.(Cannabaceae). Bot. Gaz. 1983, 144, 43–48. [Google Scholar] [CrossRef]
  24. Islam, M.J.; Ryu, B.R.; Azad, M.O.; Rahman, M.H.; Cheong, E.J.; Lim, J.-D.; Lim, Y.-S. Cannabinoids Accumulation in Hemp (Cannabis sativa L.) Plants under LED Light Spectra and Their Discrete Role as a Stress Marker. Biology 2021, 10, 710. [Google Scholar] [CrossRef]
  25. Spitzer-Rimon, B.; Duchin, S.; Bernstein, N.; Kamenetsky, R. Architecture and florogenesis in female Cannabis sativa plants. Front. Plant Sci. 2019, 10, 350. [Google Scholar] [CrossRef] [PubMed] [Green Version]
  26. Lichtenthaler, H.K. Chlorophylls and carotenoids: Pigments of photosynthetic biomembranes. In Methods in Enzymology; Elsevier: Amsterdam, The Netherlands, 1987; Volume 148, pp. 350–382. ISBN 0076-6879. [Google Scholar]
  27. Meng, L.-L.; Song, J.-F.; Wen, J.; Zhang, J.; Wei, J.-H. Effects of drought stress on fluorescence characteristics of photosystem II in leaves of Plectranthus scutellarioides. Photosynthetica 2016, 54, 414–421. [Google Scholar] [CrossRef]
  28. Bates, L.S.; Waldren, R.P.; Teare, I.D. Rapid determination of free proline for water-stress studies. Plant Soil 1973, 39, 205–207. [Google Scholar] [CrossRef]
  29. Islam, M.J.; Ryu, B.R.; Azad, M.O.K.; Rahman, M.H.; Rana, M.S.; Lim, J.-D.; Lim, Y.-S. Exogenous Putrescine Enhances Salt Tolerance and Ginsenosides Content in Korean Ginseng (Panax ginseng Meyer) Sprouts. Plants 2021, 10, 1313. [Google Scholar] [CrossRef]
  30. Khoyerdi, F.F.; Shamshiri, M.H.; Estaji, A. Changes in some physiological and osmotic parameters of several pistachio genotypes under drought stress. Sci. Hortic. 2016, 198, 44–51. [Google Scholar] [CrossRef]
  31. van Handel, E. Direct microdetermination of sucrose. Anal. Biochem. 1968, 22, 280–283. [Google Scholar] [CrossRef]
  32. Mukherjee, S.P.; Choudhuri, M.A. Implications of water stress-induced changes in the levels of endogenous ascorbic acid and hydrogen peroxide in Vigna seedlings. Physiol. Plant. 1983, 58, 166–170. [Google Scholar] [CrossRef]
  33. Gundel, P.E.; Pierik, R.; Mommer, L.; Ballaré, C.L. Competing neighbors: Light perception and root function. Oecologia 2014, 176, 1–10. [Google Scholar] [CrossRef] [PubMed]
  34. Klem, K.; Gargallo-Garriga, A.; Rattanapichai, W.; Oravec, M.; Holub, P.; Veselá, B.; Sardans, J.; Peñuelas, J.; Urban, O. Distinct morphological, physiological and biochemical responses to light quality in barley leaves and roots. Front. Plant Sci. 2019, 10, 1026. [Google Scholar] [CrossRef] [PubMed] [Green Version]
  35. Rabara, R.C.; Behrman, G.; Timbol, T.; Rushton, P.J. Effect of spectral quality of monochromatic LED lights on the growth of artichoke seedlings. Front. Plant Sci. 2017, 8, 190. [Google Scholar] [CrossRef] [PubMed] [Green Version]
  36. Lalge, A.; Cerny, P.; Trojan, V.; Vyhnanek, T. The effects of red, blue and white light on the growth and development of Cannabis sativa L. Mendel Net 2017, 8, 646–651. [Google Scholar]
  37. Kalaitzoglou, P.; Van Ieperen, W.; Harbinson, J.; van der Meer, M.; Martinakos, S.; Weerheim, K.; Nicole, C.; Marcelis, L.F.M. Effects of continuous or end-of-day far-red light on tomato plant growth, morphology, light absorption, and fruit production. Front. Plant Sci. 2019, 10, 322. [Google Scholar] [CrossRef] [PubMed] [Green Version]
  38. Ljung, K.; Bhalerao, R.P.; Sandberg, G. Sites and homeostatic control of auxin biosynthesis in Arabidopsis during vegetative growth. Plant J. 2001, 28, 465–474. [Google Scholar] [CrossRef] [PubMed]
  39. Hectors, K.; Jacques, E.; Prinsen, E.; Guisez, Y.; Verbelen, J.-P.; Jansen, M.A.K.; Vissenberg, K. UV radiation reduces epidermal cell expansion in leaves of Arabidopsis thaliana. J. Exp. Bot. 2010, 61, 4339–4349. [Google Scholar] [CrossRef] [PubMed]
  40. Naznin, M.T.; Lefsrud, M.; Gravel, V.; Azad, M.O.K. Blue light added with red LEDs enhance growth characteristics, pigments content, and antioxidant capacity in lettuce, spinach, kale, basil, and sweet pepper in a controlled environment. Plants 2019, 8, 93. [Google Scholar] [CrossRef] [Green Version]
  41. Park, J.-H.; Lee, E.-P.; Han, Y.-S.; Lee, S.-I.; Cho, K.-T.; Hong, Y.-S.; You, Y.-H. The effects of LEDs and duty ratio on the growth and physiological responses of Silene capitata Kom., endangered plant, in a plant factory. J. Ecol. Environ. 2018, 42, 21. [Google Scholar] [CrossRef]
  42. Eichhorn Bilodeau, S.; Wu, B.-S.; Rufyikiri, A.-S.; MacPherson, S.; Lefsrud, M. An update on plant photobiology and implications for cannabis production. Front. Plant Sci. 2019, 10, 296. [Google Scholar] [CrossRef]
  43. Martínez-García, J.F.; Huq, E.; Quail, P.H. Direct targeting of light signals to a promoter element-bound transcription factor. Science 2000, 288, 859–863. [Google Scholar] [PubMed] [Green Version]
  44. Lin, K.-H.; Huang, M.-Y.; Huang, W.-D.; Hsu, M.-H.; Yang, Z.-W.; Yang, C.-M. The effects of red, blue, and white light-emitting diodes on the growth, development, and edible quality of hydroponically grown lettuce (Lactuca sativa L. var. capitata). Sci. Hortic. 2013, 150, 86–91. [Google Scholar] [CrossRef]
  45. Rahman, M.H.; Azad, M.O.K.; Islam, M.J.; Rana, M.S.; Li, K.; Lim, Y.S. Production of Potato (Solanum tuberosum L.) Seed Tuber under Artificial LED Light Irradiation in Plant Factory. Plants 2021, 10, 297. [Google Scholar] [CrossRef] [PubMed]
  46. Liu, J.; van Iersel, M.W. Photosynthetic Physiology of Blue, Green, and Red Light: Light Intensity Effects and Underlying Mechanisms. Front. Plant Sci. 2021, 12, 328. [Google Scholar]
  47. Smith, H.L.; McAusland, L.; Murchie, E.H. Don’t ignore the green light: Exploring diverse roles in plant processes. J. Exp. Bot. 2017, 68, 2099–2110. [Google Scholar] [CrossRef]
  48. Ptushenko, V.V.; Ptushenko, O.S.; Tikhonov, A.N. Chlorophyll fluorescence induction, chlorophyll content, and chromaticity characteristics of leaves as indicators of photosynthetic apparatus senescence in arboreous plants. Biochemistry 2014, 79, 260–272. [Google Scholar] [CrossRef]
  49. Thwe, A.A.; Kasemsap, P. Quantification of OJIP fluorescence transient in tomato plants under acute ozone stress. Agric. Nat. Resour. 2014, 48, 665–675. [Google Scholar]
  50. Strasser, R.J.; Tsimilli-Michael, M.; Srivastava, A. Analysis of the chlorophyll a fluorescence transient. In Chlorophyll a fluorescence; Springer: Dordrecht, The Netherlands, 2004; pp. 321–362. [Google Scholar]
  51. Calatayud, A.; Barreno, E. Response to ozone in two lettuce varieties on chlorophyll a fluorescence, photosynthetic pigments and lipid peroxidation. Plant Physiol. Biochem. 2004, 42, 549–555. [Google Scholar] [CrossRef]
  52. Xu, Y.; Yang, M.; Cheng, F.; Liu, S.; Liang, Y. Effects of LED photoperiods and light qualities on in vitro growth and chlorophyll fluorescence of Cunninghamia lanceolata. BMC Plant Biol. 2020, 20, 269. [Google Scholar] [CrossRef]
  53. Islam, M.J.; Kim, J.W.; Begum, M.K.; Sohel, M.A.T.; Lim, Y.-S. Physiological and Biochemical Changes in Sugar Beet Seedlings to Confer Stress Adaptability under Drought Condition. Plants 2020, 9, 1511. [Google Scholar] [CrossRef]
  54. Sharma, S.; Villamor, J.G.; Verslues, P.E. Essential role of tissue-specific proline synthesis and catabolism in growth and redox balance at low water potential. Plant Physiol. 2011, 157, 292–304. [Google Scholar] [CrossRef] [PubMed] [Green Version]
  55. Almansa, E.M.; Chica, R.M.; Plaza, B.M.; Lao-Arenas, M.T. Proline test to evaluate light stress in tomato seedlings under artificial light. Acta Hortic. 2017, 1170, 1019–1026. [Google Scholar] [CrossRef]
  56. Yang, S.-L.; Lan, S.-S.; Gong, M. Hydrogen peroxide-induced proline and metabolic pathway of its accumulation in maize seedlings. J. Plant Physiol. 2009, 166, 1694–1699. [Google Scholar] [CrossRef]
  57. Verslues, P.E.; Kim, Y.-S.; Zhu, J.-K. Altered ABA, proline and hydrogen peroxide in an Arabidopsis glutamate: Glyoxylate aminotransferase mutant. Plant Mol. Biol. 2007, 64, 205–217. [Google Scholar] [CrossRef]
  58. Fabro, G.; Kovács, I.; Pavet, V.; Szabados, L.; Alvarez, M.E. Proline accumulation and AtP5CS2 gene activation are induced by plant-pathogen incompatible interactions in Arabidopsis. Mol. Plant-Microbe Interact. 2004, 17, 343–350. [Google Scholar] [CrossRef] [PubMed] [Green Version]
  59. Kavi Kishor, P.B.; Hima Kumari, P.; Sunita, M.S.L.; Sreenivasulu, N. Role of proline in cell wall synthesis and plant development and its implications in plant ontogeny. Front. Plant Sci. 2015, 6, 544. [Google Scholar] [CrossRef] [PubMed] [Green Version]
  60. Mattioli, R.; Marchese, D.; D’Angeli, S.; Altamura, M.M.; Costantino, P.; Trovato, M. Modulation of intracellular proline levels affects flowering time and inflorescence architecture in Arabidopsis. Plant Mol. Biol. 2008, 66, 277–288. [Google Scholar] [CrossRef]
  61. Fahmy, I. Grafting studies on macadamia and sapodilla in relation to carbohydrates, using pre-girdled scions. Proc. Fla. State Hort. Soc. 1952, 65, 190–193. [Google Scholar]
  62. Moghaddam, M.R.B.; Van den Ende, W. Sugars and plant innate immunity. J. Exp. Bot. 2012, 63, 3989–3998. [Google Scholar] [CrossRef] [PubMed] [Green Version]
  63. Aliniaeifard, S.; Falahi, Z.; Dianati Daylami, S.; Li, T.; Woltering, E. Postharvest Spectral Light Composition Affects Chilling Injury in Anthurium Cut Flowers. Front. Plant Sci. 2020, 11, 846. [Google Scholar] [CrossRef] [PubMed]
  64. Gurrieri, L.; Merico, M.; Trost, P.; Forlani, G.; Sparla, F. Impact of Drought on Soluble Sugars and Free Proline Content in Selected Arabidopsis Mutants. Biology 2020, 9, 367. [Google Scholar] [CrossRef] [PubMed]
  65. Ntagkas, N.; Woltering, E.; Bouras, S.; de Vos, R.C.H.; Dieleman, J.A.; Nicole, C.; Labrie, C.; Marcelis, L.F.M. Light-induced vitamin c accumulation in tomato fruits is independent of carbohydrate availability. Plants 2019, 8, 86. [Google Scholar] [CrossRef] [PubMed] [Green Version]
Figure 1. Hemp plants under treatment in the steel-made chambers (80 cm × 60 cm × 80 cm) equipped with different LED lights. Here and subsequent models: L1, Natural light; L2, W; L3, R8:B2; L4, R7:B2:G1; L5, R7:B2:FR1; L6, R6:B2:G1:FR1; L7, R5:B2:W2:FR1; L8, R5:B2:G1:FR1:UV1; L9, R6:B2:FR1:UV1; L10, R4:B2:W2:FR1:UV1; L11, R2:B2:G2:W2:FR1:UV1. All treatments used a photosynthetic photon flux density of 300 µmol m−2s−1. Insert: The root architecture of the hemp under the aeroponics system.
Horticulturae 07 00239 g001
Figure 2. Effect of 20 days exposure to different LED spectra on the shoot length (A), root length (B), plant fresh weight (C), and plant growth rate (D) of hemp seedlings. Here and subsequent figures: L1, Natural light; L2, White; L3, R8:B2; L4, R7:B2:G1; L5, R7:B2:FR1; L6, R6:B2:G1:FR1; L7, R5:B2:W2:FR1; L8, R5:B2:G1:FR1:UV1; L9, R6:B2:FR1:UV1; L10, R4:B2:W2:FR1:UV1; L11, R2:B2:G2:W2:FR1:UV1. All treatments used a photosynthetic photon flux density of 300 µmol m−2s−1. Column height indicates the mean, vertical bars indicate the standard error of the mean (n = 4), and different letters indicate significant differences at p < 0.05.
Horticulturae 07 00239 g002
Figure 3. Effect of 20 days exposure to different LED spectra on the number of leaves plant−1 (A), number of nodes plant−1 (B), leaf length (C), and leaf width (D) of hemp seedlings. Here and subsequent figures: L1, Natural light; L2, White; L3, R8:B2; L4, R7:B2:G1; L5, R7:B2:FR1; L6, R6:B2:G1:FR1; L7, R5:B2:W2:FR1; L8, R5:B2:G1:FR1:UV1; L9, R6:B2:FR1:UV1; L10, R4:B2:W2:FR1:UV1; L11, R2:B2:G2:W2:FR1:UV1. All treatments used a photosynthetic photon flux density of 300 µmol m−2s−1. Column height indicates the mean, vertical bars indicate the standard error of the mean (n = 4), and different letters indicate significant differences at p < 0.05.
Horticulturae 07 00239 g003
Figure 4. Effect of 20 days exposure to different LED spectra on chlorophyll a (A), chlorophyll b (B), carotenoid (C), and chlorophyll a/b ratio (D) of hemp seedlings. Here and subsequent figures: L1, Natural light; L2, White; L3, R8:B2; L4, R7:B2:G1; L5, R7:B2:FR1; L6, R6:B2:G1:FR1; L7, R5:B2:W2:FR1; L8, R5:B2:G1:FR1:UV1; L9, R6:B2:FR1:UV1; L10, R4:B2:W2:FR1:UV1; L11, R2:B2:G2:W2:FR1:UV1. All treatments used a photosynthetic photon flux density of 300 µmol m−2s−1. Column height indicates the mean, vertical bars indicate the standard error of the mean (n = 4), and different letters indicate significant differences at p < 0.05.
Horticulturae 07 00239 g004
Figure 5. Effect of 20 days exposure to different LED spectra on the photosynthetic fluorescence of hemp seedlings. Here and subsequent figures: L1, Natural light; L2, White; L3, R8:B2; L4, R7:B2:G1; L5, R7:B2:FR1; L6, R6:B2:G1:FR1; L7, R5:B2:W2:FR1; L8, R5:B2:G1:FR1:UV1; L9, R6:B2:FR1:UV1; L10, R4:B2:W2:FR1:UV1; L11, R2:B2:G2:W2:FR1:UV1. All treatments used a photosynthetic photon flux density of 300 µmol m−2s−1. Column height indicates the mean, vertical bars indicate the standard error of the mean (n = 4), and different letters indicate significant differences at p < 0.05.
Horticulturae 07 00239 g005
Figure 6. Effect of 20 days exposure to different LED spectra on proline (A), ascorbic acid (B), sucrose content (C), and total soluble carbohydrates (TSC; (D)) of hemp seedlings. Here and subsequent figures: L1, Natural light; L2, White; L3, R8:B2; L4, R7:B2:G1; L5, R7:B2:FR1; L6, R6:B2:G1:FR1; L7, R5:B2:W2:FR1; L8, R5:B2:G1:FR1:UV1; L9, R6:B2:FR1:UV1; L10, R4:B2:W2:FR1:UV1; L11, R2:B2:G2:W2:FR1:UV1. All treatments used a photosynthetic photon flux density of 300 µmol m−2s−1. Column height indicates the mean, vertical bars indicate the standard error of the mean (n = 4), and different letters indicate significant differences at p < 0.05.
Horticulturae 07 00239 g006
Figure 7. Hierarchical clustering and heatmap analysis (a) and principal component analysis (PCA) (b) to elucidate the variable treatment relationships among the eleven treatments for 20 days. In the heatmap, the mean values of the various parameters obtained in this study were normalized and clustered. At the variable level, two major clusters were recognized for each treatment. The color scale displays the intensity of the normalized mean values of the different parameters. In the PCA, the lines starting from the central point of the biplots display the negative or positive associations of the different variables, and their proximity specifies the degree of correlation with specific treatment. L1, Natural light; L2, White; L3, R8:B2; L4, R7:B2:G1; L5, R7:B2:FR1; L6, R6:B2:G1:FR1; L7, R5:B2:W2:FR1; L8, R5:B2:G1:FR1:UV1; L9, R6:B2:FR1:UV1; L10, R4:B2:W2:FR1:UV1; L11, R2:B2:G2:W2:FR1:UV1. SL, shoot length; RL, root length; PFW, plant fresh weight; PGR, plant growth rate; LN, number of leaf plant-1; NN, number of node plant-1, LL, leaf length; LW, leaf width; Chl a, chlorophyll a; Chl b, chlorophyll b; Car, carotenoid; Chl a/b ratio, chlorophyll a/b ratio; Fv/Fm, Fv/Fm of PS II; Pro, proline; AsA, ascorbic acid; Sucrose, sucrose content; TSC, total soluble carbohydrate.
Horticulturae 07 00239 g007
Table 1. LED light composition.
Spectrum CombinationsRatio (%)Intensity
(µmol m−2s−1)
Code Name
Natural light-150–250L1
W *100 **300L2
R8 + B280:20300L3
R7 + B2 + G170:20:10300L4
R7 + B2 + FR170:20:10300L5
R6 + B2 + G1 + FR160:20:10:10300L6
R5 + B2 + W2 + FR150:20:20:10300L7
R5 + B2 + G1 + FR1 + UV150:20:10:10:10300L8
R6 + B2 + FR1 + UV160:20:10:10300L9
R4 + B2 + W2 + FR1 + UV140:20:20:10:10300L10
R2 + B2 + G2 + W2 + FR1 + UV120:20:20:20:10:10300L11
* W, white; R, red; B, blue; G, green; FR, far-red; UV, ultraviolet A. ** Light ratio and intensity were set by a PG200N Handheld spectral PAR meter (UPRtek, Vogt 21, Aachen, Germany).
Table 2. Nutrient solution.
Chemical NameA Tank (50 L) *B Tank (50 L)
Ca(NO3)2. 4H2O1.5 kg
KNO33.79 kg3.79 kg
(NH4)2HPO4 1.6 kg
MgSO4 4.3 kg
K2SO4
Fe-EDTA460 g
MnSO4 30.8 g
H3BO3 57.2 g
ZnSO4 3.6 g
CuSO4 1.3 g
(NH4)6Mo7O24. 4H2O 0.4 g
* Solution of Tank A and Tank B were subjected to mixing to maintain an EC range between 1.2 and 1.7 (dS m−2), pH 6.0.
Publisher’s Note: MDPI stays neutral with regard to jurisdictional claims in published maps and institutional affiliations.

