Article

Effect of Drought Stress on Chlorophyll Fluorescence Parameters, Phytochemical Contents, and Antioxidant Activities in Lettuce Seedlings

1
Department of Horticulture, College of Agriculture & Life Sciences, Jeonbuk National University, Jeonju 54896, Korea
2
Core Research Institute of Intelligent Robots, Jeonbuk National University, Jeonju 54896, Korea
3
Institute of Agricultural Science & Technology, Jeonbuk National University, Jeonju 54896, Korea
*
Author to whom correspondence should be addressed.
Horticulturae 2021, 7(8), 238; https://doi.org/10.3390/horticulturae7080238
Submission received: 25 June 2021 / Revised: 6 August 2021 / Accepted: 8 August 2021 / Published: 10 August 2021
(This article belongs to the Special Issue Smart Farming Techniques for Protected Horticulture Facilities)

Abstract

:
This study monitored changes in chlorophyll fluorescence (CF), growth parameters, soil moisture content, phytochemical content (proline, ascorbic acid, chlorophyll, total phenol content (TPC), and total flavonoid content (TFC)), and antioxidant activities in 12-day-old lettuce (Lactuca sativa L.) seedlings grown under drought stress (no irrigation) and control (well irrigated) treatments in controlled conditions for eight days. Measurements occurred at two-day intervals. Among ten CF parameters studied, effective quantum yield of photochemical energy conversion in PSII (Y(PSII)), coefficient of photochemical quenching (qP), and coefficient of photochemical quenching of variable fluorescence based on the lake model of PSII (qL) significantly decreased in drought-stressed seedlings from day 6 of treatment compared to control. In contrast, maximum quantum yield (Fv/Fm), ratio of fluorescence (Rfd), and quantum yield of non-regulated energy dissipation in PSII (Y(NO)) were significantly affected only at the end. All growth parameters decreased in drought-stressed seedlings compared to control. Proline started increasing from day 4 and showed ~660-fold elevation on day 8 compared to control. Chlorophyll, ascorbic acid, TPC, TFC, and antioxidant activities decreased in drought-stressed seedlings. Results showed major changes in all parameters in seedlings under prolonged drought stress. These findings clarify effects of drought stress in lettuce seedlings during progressive drought exposure and will be useful in the seedling industry.

1. Introduction

Lettuce (Lactuca sativa L.) is one of the most widespread leafy vegetables, with 1.3 million hectares of cultivated area and 29 million tons of worldwide production [1]. It is predominantly consumed as a fresh vegetable [2]. It is a vegetable rich in vitamins, fibers, polyphenols, carotenoids, and antioxidants [3,4]. Lettuce is generally grown in controlled environments, such as hydroponic systems, greenhouses, and plant factories, although open-field cultivation is also common [5,6,7]. Both plant genotype and growing conditions such as temperature, irrigation, nutrient solution, and light quality may influence the quality of lettuce, especially in terms of phytochemical levels and visual appearance. Furthermore, optimal irrigation management at the seedling stage is closely related to future productivity and supply of healthy and uniform seedlings [8,9], which in turn affects the yield of horticultural crops [10,11]. Generally, irrigation management performed at seedling farms is based on skillful cultivation techniques and visual judgment of the cultivation manager [12]. However, inadequate and subjective cultivation techniques create various negative outcomes, such as excess work and time requirements [13].
Among the different stresses experienced during crop cultivation, drought stress is an abiotic stress factor associated with a decrease in photosynthesis rate, ion absorption, respiration, and carbon dioxide metabolism [14,15]. In general, the decline in growth of plants exposed to drought stress is continuous and closely related to crop growth and future yields [16,17]. Drought stress affects not only photosynthetic activity, but also the content and profile of phytochemicals [18,19,20]. A range of phytochemicals show differential functions under the drought stress conditions [21], for example, ascorbic acid detoxifies reactive oxygen species and provides protection from photo inhibition during the stress condition [22]. Proline, an important osmoregulant, helps minimize the osmotic potential and maintains turgor pressure [23]. Therefore, studying the effects of drought stress in plants is an important step for producing high-yield and nutritionally improved crops [18]. Sensitivity to drought stress varies according to the genotype, physiological stage, duration of treatment, and application of several chemicals [24,25,26,27,28,29,30,31]. Both destructive and non-destructive techniques have been applied to detect drought stress in plants [16,19,32,33]. Chlorophyll fluorescence (CF) imaging, a common non-destructive technique, is frequently used to monitor stress levels in a range of crops [32,34], as these parameters provide information on both mechanical detail and extent of damage in plants due to stress. Researchers have identified differential effects of drought stress in photosynthetic activities using CF imaging techniques and measuring phytochemicals in a range of plants, including lettuce [18,28,30,35,36,37]. Several studies have been performed to determine the effect of drought stress on lettuce [6,11,16,19,26,38]. However, these studies were performed mainly on older lettuce at the end of the experiment. Furthermore, the effect of drought stress in lettuce on CF parameters, phytochemical content, and antioxidant activities during progressive exposure to drought stress have not been investigated in detail.
In this context, the main objective of this research was to study the effect of drought stress on CF parameters, photosynthetic pigments, stress-related compounds, antioxidants, and antioxidant activities in lettuce seedlings during progressive exposure to drought stress, as well as to select possible index CF parameters and biochemical compounds for detection of drought stress.

2. Materials and Methods

2.1. Plant Materials and Growth Conditions

A lettuce cultivar ‘Cheong Chi Ma’ was used in this study as it is one of the most popular and consumed cultivars in S. Korea. Seeds were purchased from Asia Seed Co. Ltd., Seoul, Korea. Seeds were sown in 50-cell plug trays (54.4 × 28.2 × 5.4 cm) filled with bed soil (Chorok-i, Nongwoobio Co. Ltd., Suwon, Korea) and irrigated with tap water once a day for 20 min using the sub-irrigation method for 12 days. Seedlings were grown in a closed plant production chamber under a fluorescent lamp (Philips, TLD 32W/865RS) with a photosynthetic photon flux density (PPFD) of 150 ± 10 μmol m2 s1, 24/18 °C (day/night) temperature, 14/10-h (day/night) photoperiod, and 60% relative humidity. For the drought stress experiment, one set of seedlings was irrigated every day and considered as the control (well irrigated), while another set of seedlings was not irrigated (non-irrigated) after initiation of the experiment for eight days and assumed to be drought-stressed.

2.2. Measurement of Growth Parameters and Soil Water Content

Growth parameters, including shoot fresh and dry weights, leaf number, leaf length and width, and epicotyl length of lettuce seedlings, were measured to evaluate the growth performance at the end of the experiment. Leaf length, leaf width, and epicotyl length were measured using a digital caliper (CD-20APX; Mitutoyo Co., Kanagawa, Japan). The fresh shoot weight was measured using a digital weighing machine (UX420H; Shimadzu Corp., Kyoto, Japan), and the dry weight was measured after drying the fresh shoots in an oven for 72 h at 70 °C. Soil moisture content was measured by drying the soil samples at 105 °C for 72 h.

2.3. Measurement of Chlorophyll Fluorescence (CF) Parameters

The CF parameters from the upper surface of all true leaves from intact plants were acquired using an open FluorCam 800-O/1010 (Photon System Instruments, Drasow, Czech Republic) according to Shin et al. [39]. The light source (cool white 6500 K) in LED panels (130 mm × 130 mm) was at an angle of 45°. The distance between the canopy of the lettuce seedlings and the camera lens was 15–18 cm. Altogether, 10 CF parameters were assessed (Table 1) using the following protocols: quenching act 2, shutter speed 20 μs, sensitivity 20%, actinic light 240 μmol m−2 s−1, and saturating flash light 300 μmol m−2 s−1.
Then, CF parameters were computed based on an average of all pixels in every true leaf. Ten lettuce seedlings (from 50 uniform seedlings/treatment) were randomly selected for each time point (0, 2, 4, 6, and 8 days) and used to measure the CF parameters after the initiation of drought stress treatment. After measurement of CF parameters, the seedlings were collected, and growth parameters were assessed. The seedlings (10 seedlings per treatment time and treatment) were then mixed separately and freeze-dried for biochemical analysis. All control (well irrigated) and drought stress samples were ground into fine powder and stored at −80 °C for analysis of proline, chlorophylls, ascorbic acid, total phenol content, total flavonoid content, and antioxidant activities.

2.4. Analysis of Chlorophyll (Chl) Content

The contents of both Chl a and b were analyzed according to Shin et al. [39]. First, 20 mg of freeze-dried and fine-powdered samples were extracted into 5 mL of MeOH (Avantor Performance Materials Co., Center Valley, PA, USA) for 2 h at room temperature. The aliquot was centrifuged at 3500 rpm for 10 min, and the absorbance was measured at 652 and 665 nm using a microplate reader (Multiskan Go; Thermo Scientific Inc., Waltham, MA, USA). Both Chl a and b were then calculated according to a 1 cm-corrected path-length formula.

2.5. Analysis of Proline Content

Proline content was measured according to the modified method of Shin et al. [39] using a microplate reader. The powdered sample was homogenized in 1.5 mL of 3% aqueous sulfosalicylic acid (Sigma-Aldrich, St. Louis, MO, USA) for 30 min by shaking at 150 rpm, centrifuged (3500 rpm for 10 min), and filtered. Five-hundred microliters of supernatant, 500 μL of acetic acid (Sigma-Aldrich), and 500 μL of acid ninhydrin (Sigma-Aldrich) were mixed in a 15 mL tube simultaneously, kept in a 95 °C water bath for 1 h, and cooled on ice. Then, 1 mL of toluene (Sigma Aldrich) was added to the supernatant, and the mixture was vortexed for a moment and centrifuged at 3500 rpm for 10 min. Then, the absorbance of the toluene phase (200 μL) was measured at 520 nm. The amount of proline in the sample was quantified using a commercial L-proline (Sigma-Aldrich) standard with a linear range of 0 to 100 μg mL1.

2.6. Analysis of Ascorbic Acid Content

Twenty milligrams of powdered sample was extracted with 1.5 mL of 5% metaphosphoric acid (Sigma-Aldrich) solution and centrifuged at 12,000 rpm for 10 min at 4 °C. The aliquot was filtered through a 0.22 μm syringe filter and analyzed using a 1260 HPLC system (Agilent Technologies, Santa Clara, CA, USA) equipped with an auto-injector and a photodiode array (PDA) detector set at 254 nm according to Shin et al. [39]. Peaks were separated on an Acquity UPLC® HSS T3 (100 mm × 2.1 mm, 1.8 μm) column using a mobile phase of 1% MeOH and 99% distilled water with 0.1% formic acid (Sigma-Aldrich) solution at a flow rate of 0.3 mL min-1. L-ascorbic acid (Sigma-Aldrich) at 10–150 µg mL1 was used as an authentic standard for identification and quantification of the peak, and ascorbic acid content was expressed as milligrams per gram (mg g1) of dry weight.

2.7. Analysis of Total Phenol and Total Flavonoid Content

Fifty milligrams of powdered sample was extracted with 80% MeOH (1.5 mL) in a water bath (50 °C) at 150 rpm for 1 h. The extract was centrifuged at 12,000 rpm for 10 min at 4 °C. The supernatant was filtered through a 0.45 μm syringe filter, and the total phenol and total flavonoid content (TPC and TFC) were analyzed. TPC was measured according to the method described by Bhandari and Lee [40]. First, 200 μL supernatant was mixed with 600 µL distilled water in a 1.5 mL Eppendorf tube. Then, 200 μL of Folin’s reagent (Sigma-Aldrich) was added and incubated in a water bath at 27 °C for 5 min. After adding 200 μL of 7% sodium carbonate (Sigma-Aldrich), the solution was incubated in the dark at room temperature for 1 h, centrifuged at 12,000 rpm for 10 min at 4 °C, and absorbance was measured at 760 nm using a microplate reader. Gallic acid (Sigma-Aldrich) at different concentrations (10–200 μL mL1) was used to measure the standard curve, and the results were expressed as mg gallic acid equivalents per gram of dry weight (mg GAE g1 DW).
Total flavonoid content was measured according to the method described by Shin et al. [39]. First, 200 μL of extract (the same extract obtained for total phenol analysis) was mixed with 800 μL water, and 60 μL NaNO2 (5%) was added. Then, 60 μL of aluminum chloride hexahydrate (Sigma-Aldrich) and 400 μL of 1M NaOH (Sigma-Aldrich) were added simultaneously after 5 min. Absorbance was measured at 510 nm using a microplate reader. Catechin hydrate (Sigma-Aldrich) at 10–100 μL mL1 was used to calculate the standard curve, and the results were expressed as mg of catechin hydrate equivalent per gram of dry weight (mg CE g1, DW).

2.8. Measurement of Antioxidant Activities

Two different methods were used to measure antioxidant activity: ferric reducing antioxidant power (FRAP) assay and 2,2′-azino-bis (3-ethylbenzothiazoline-6-sulfonic acid) (ABTS) assay. The FRAP assay was performed using the method described by Bhandari et al. [41], with some modifications. Stock solutions of 300 mM acetate buffer (3.1 g of sodium acetate trihydrate (Sigma-Aldrich), 16 mL of acetic acid (Sigma-Aldrich)) at pH 3.6, 10 mM of 2,4,6-Tris(2-pyridyl)-s-triazine (Sigma-Aldrich) in 40 mM HCl (Sigma-Aldrich), and 20 mM of ferric chloride hexahydrate (Sigma-Aldrich) were prepared and mixed in a 10:1:1 (v/v/v) ratio to make a fresh working solution. Fifty microliters of supernatant (50 mg in 1.5 mL 80% MeOH) was mixed with 950 μL of the FRAP working solution and incubated for 10 min at 37 °C. The reaction mixture (200 μL) was used to measure the absorbance at 593 nm using a microplate reader. Trolox [(±)-6-hydroxy-2,5,7,8-tetramethylchromane-2-carboxylic acid (Sigma-Aldrich) at different concentrations (0–1000 μM) was used to generate a standard curve. Results were expressed as μM Trolox equivalent antioxidant capacity per gram of dry weight (μM TE g1 DW).
The ABTS assay was performed according to the method described by Bhandari et al. [41]. ABTS radical cation (ABTS+) was prepared by mixing 7 mM ABTS-2,2-azino-bis(3-ethylbenzothiazoline-6-sulfonic acid) di-ammonium salt; Sigma-Aldrich) solution and 2.45 mM potassium persulfate (Sigma-Aldrich) solution (v/v) in the dark for 16 h at room temperature. The mixture was diluted with methanol to an absorbance of ~0.90 at 734 nm. Fifty microliters of supernatant (50 mg in 1.5 mL 80% MeOH) was mixed with ABTS+ solution (950 μL) and incubated for 2 h in the dark. The absorbance of the reaction mixture (200 µL) was then used to measure the absorbance at 734 nm using a microplate reader. Trolox (10–1000 μM) was used to generate a standard curve, and the results were expressed as μM TE g1 of dry weight.

2.9. Statistical Analysis

The results of CF parameters and growth parameters are reported as a mean of ten biological replications, while the other parameters are reported as the mean of three replications. Correlation analysis was performed using RStudio (ver. 4.0.2; RStudio Desktop, Boston, MA, USA) at p < 0.05, while SPSS software (ver. 20; SPSS Inc., Chicago, IL, USA) was used to perform all the other statistical analyses.

3. Results and Discussion

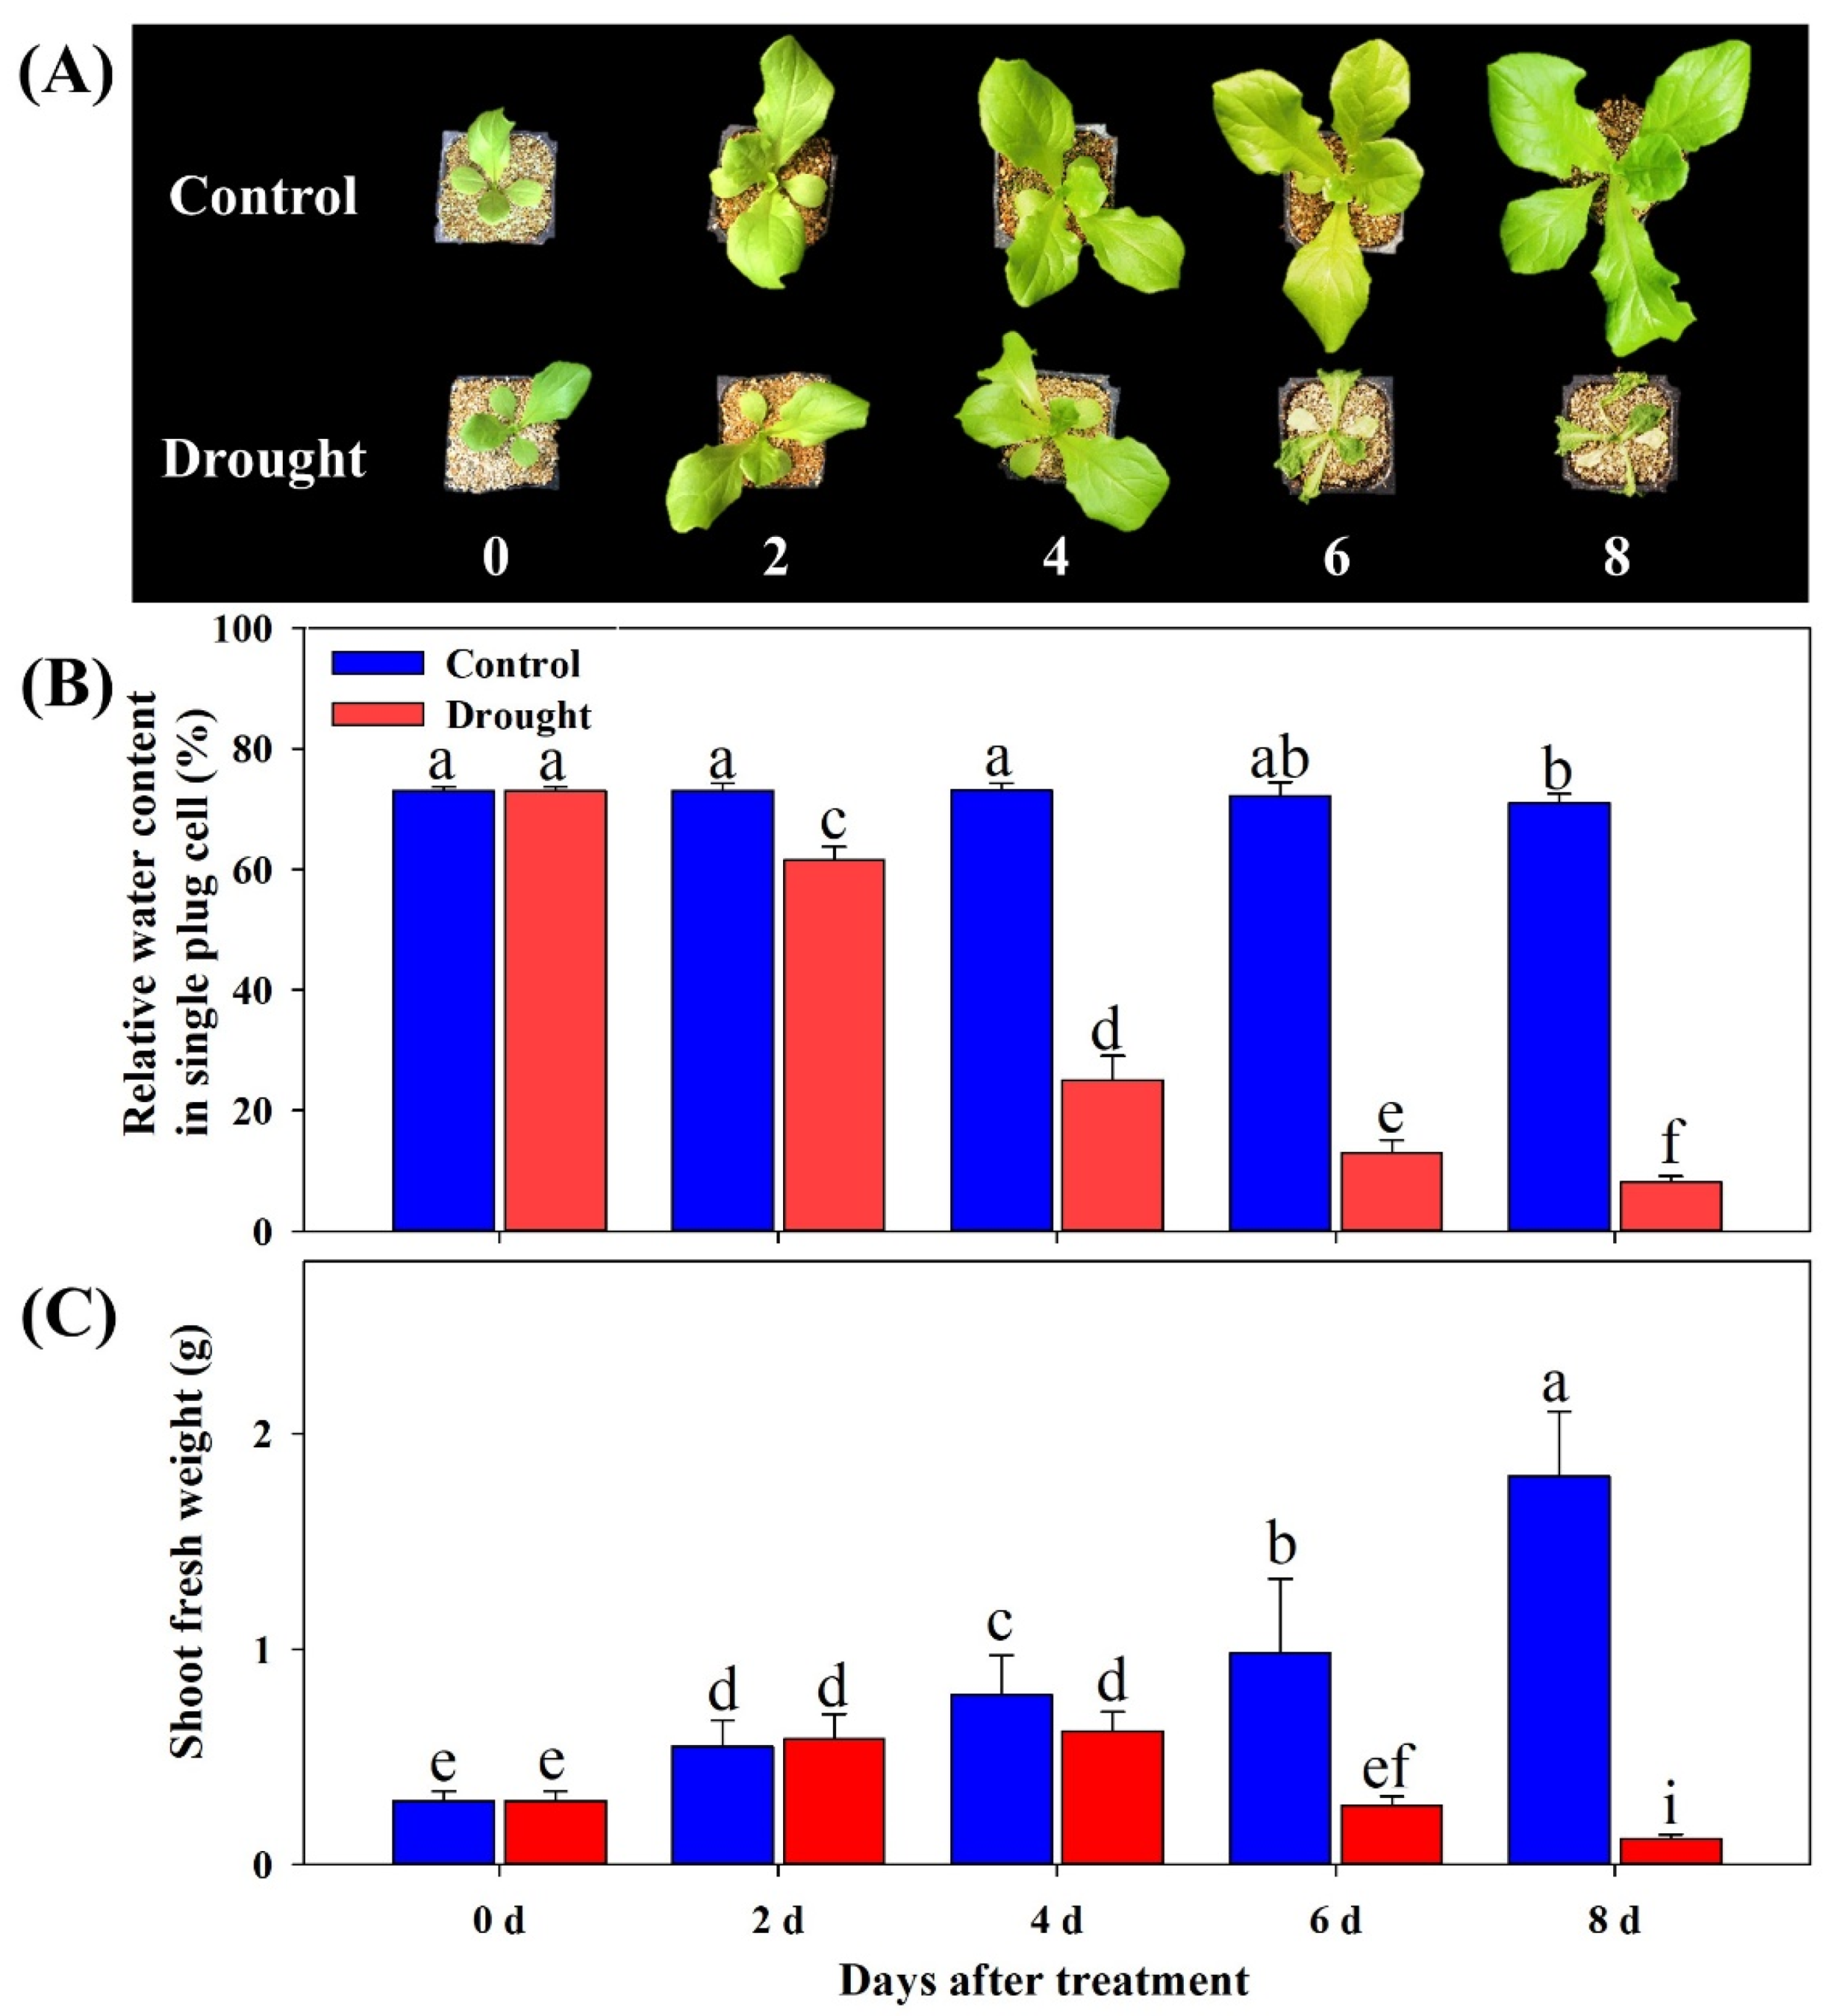
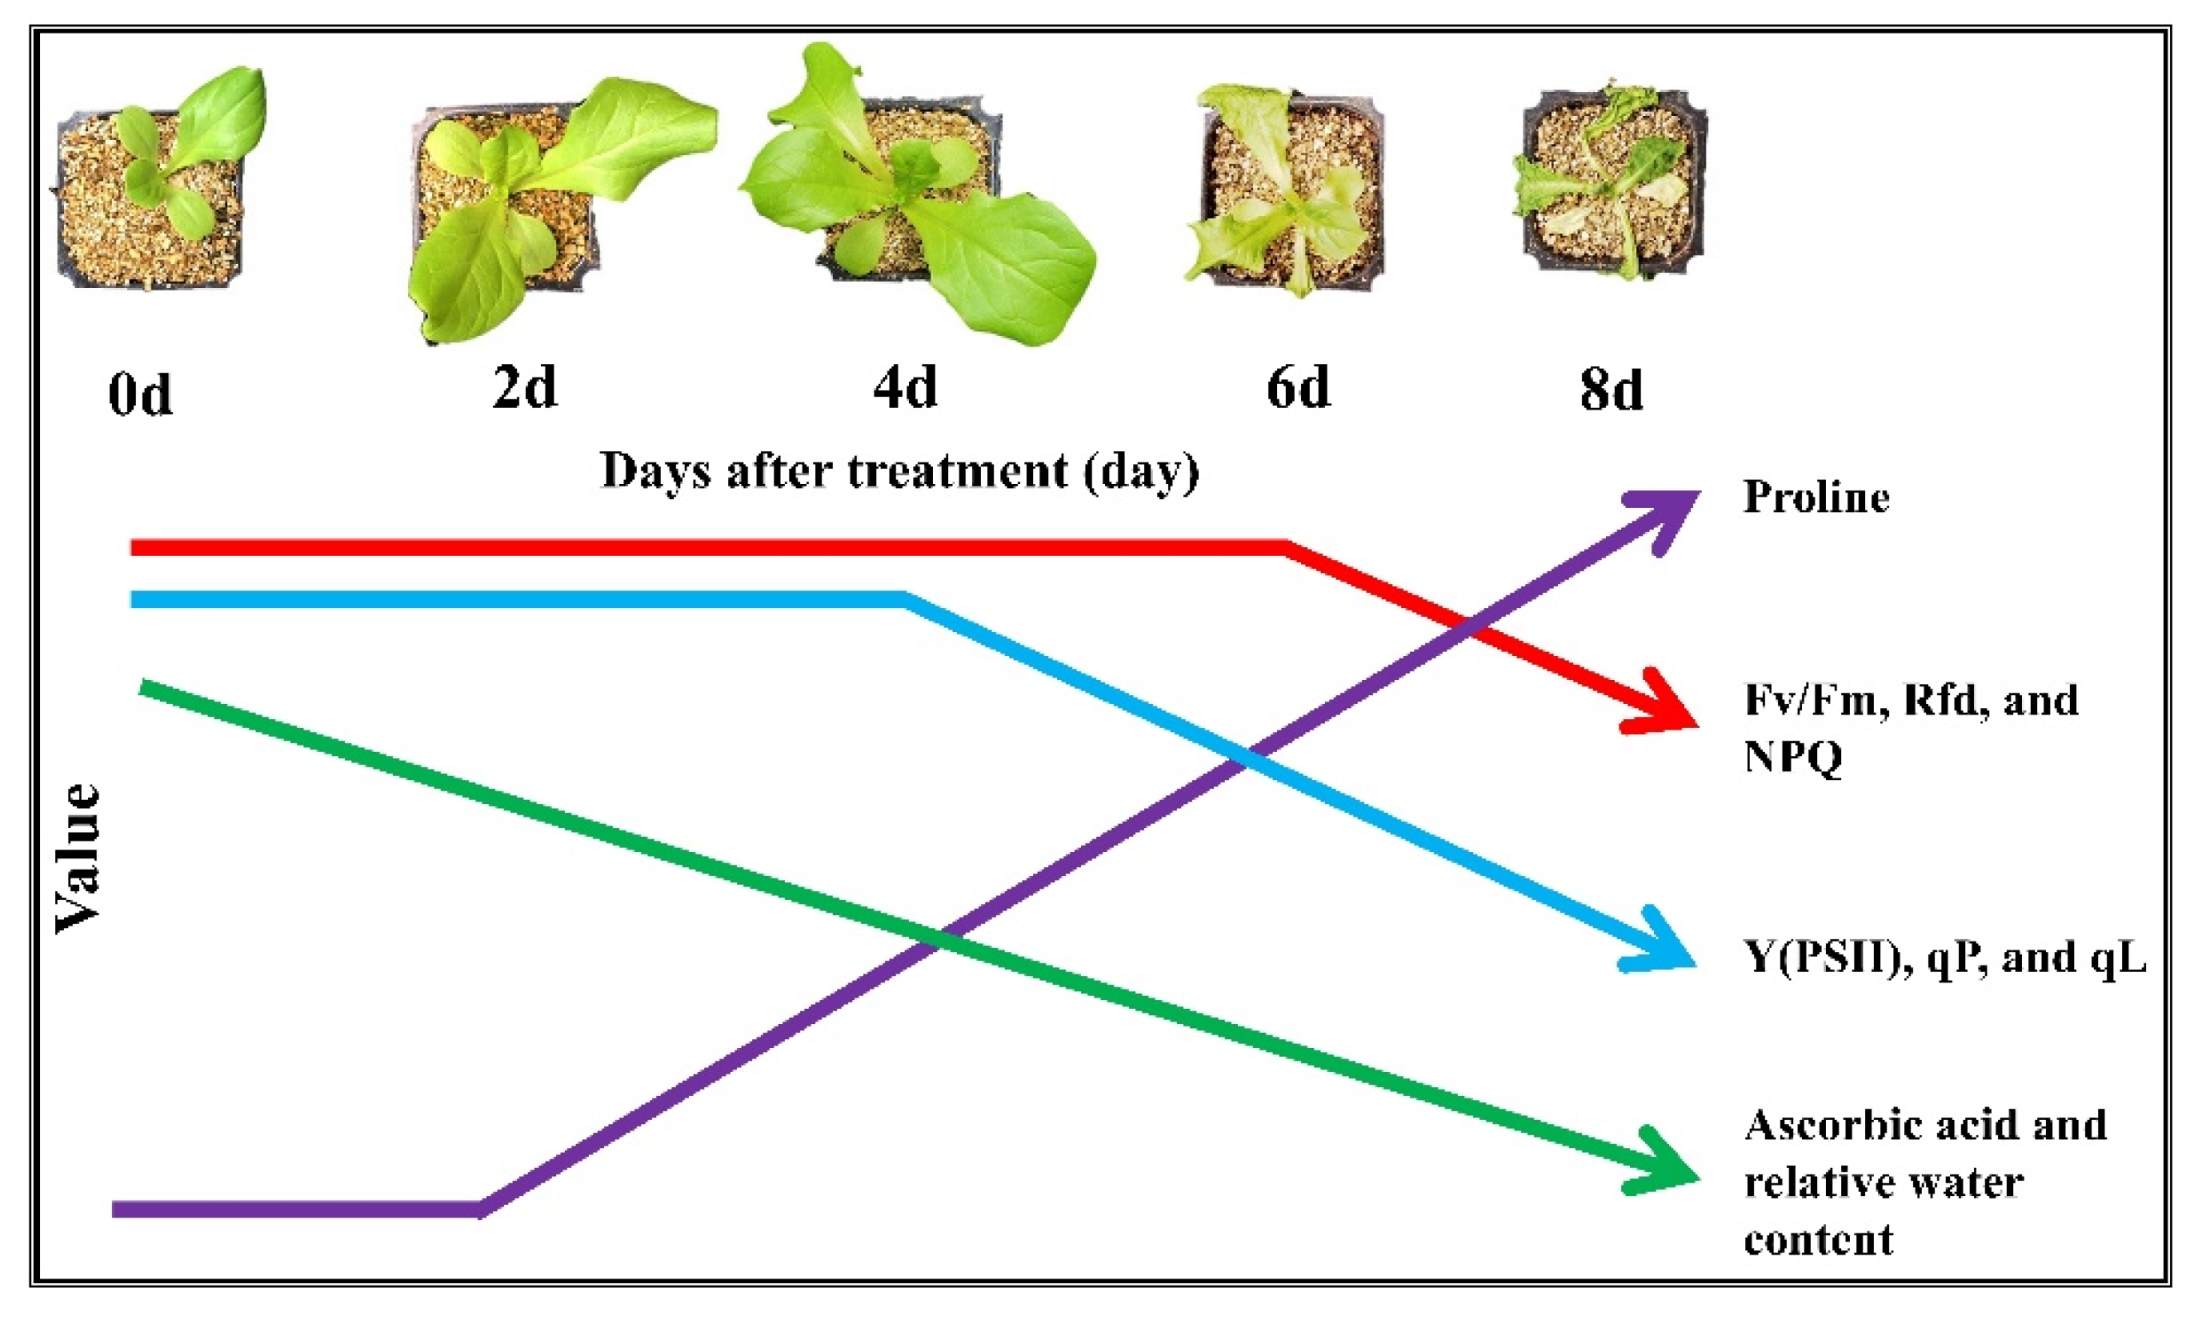
3.1. Effect of Drought Stress on Plant Growth Parameters and Changes in Soil Moisture Content

The change in the phenotype, relative water content in the soil of the root zone, and total shoot fresh weight of lettuce seedlings during the progressive treatment time under control and drought stress treatments are presented in Figure 1. Symptoms of leaf wilting were observed from the day 6 of treatment, which gradually increased on day 8 due to the decrease in water content in the soil. Similar changes in the plant phenotype have also been observed in lettuce and Arabidopsis under drought stress conditions [30,38]. The water content in the soil of the root zone gradually decreased with an increase in the treatment time: ~16% (from day 0), ~60% (from day 2), ~48% (from day 4), and ~37% (from day 6) on day 2, 4, 6, and 8 of the treatment time, respectively. The shoot fresh weight started to continuously increase in control seedlings from the beginning of the experiment. In contrast, it started to decrease from day 4 of treatment in drought-stressed seedlings. Shoot fresh weight was significantly different between the control and drought-stressed seedlings on day 4 of the experiment. Drought-stressed seedlings exhibited ~15 times lower shoot fresh weight compared to the control on the last day of the experiment. Other parameters, including the length of epicotyl, leaf number, leaf length, and leaf width were significantly lower in drought-stressed seedlings than in control seedlings on day 8 (Table S1). A similar reduction in growth parameters under drought stress conditions has also been observed in a number of plants, including lettuce [11,20]. It was found that the decrease in moisture content of soil in the root zone (%) had an effect on the decrease in moisture content of the leaves, which was the same as the result of drought stress due to the decrease in moisture content of the root zone (%) [42,43]. The decrease in agronomic parameters, including fresh shoot weight under the influence of drought stress, was probably due to the decreased photosynthetic function and interruption of ion supply due to the scarcity of water in the root zone [29,44].

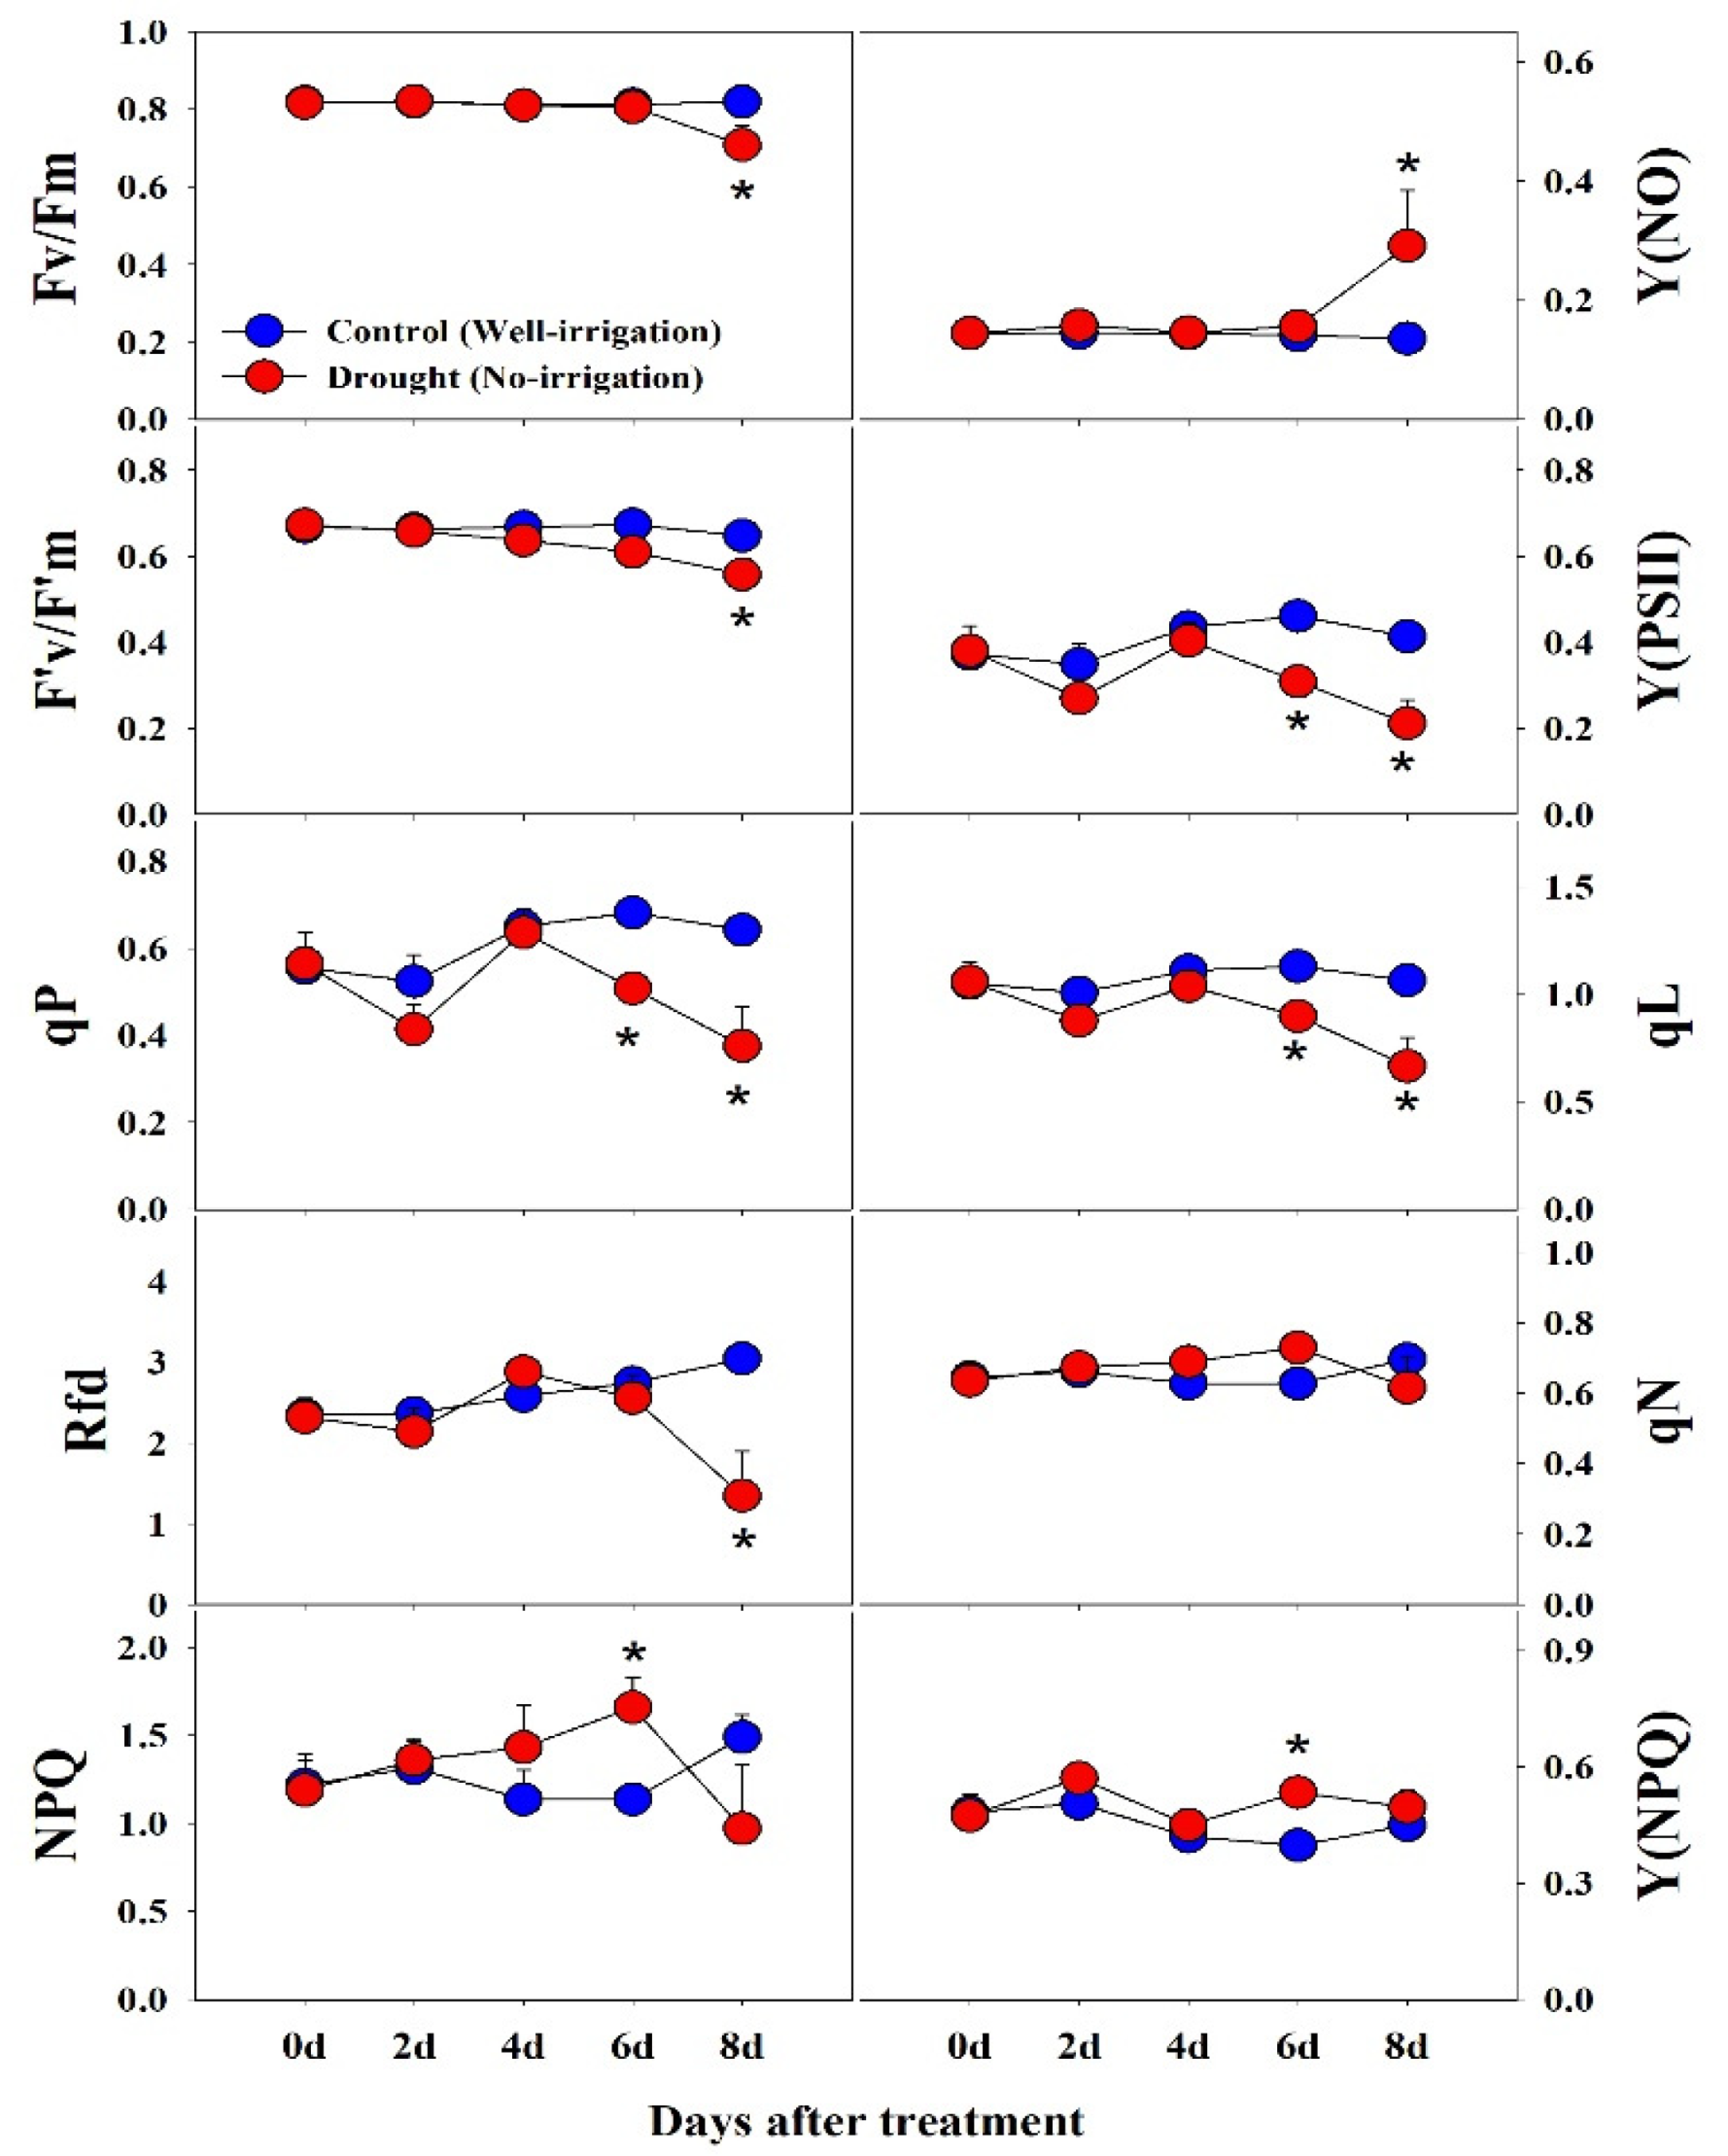
3.2. Effect of Drought Stress on Chlorophyll Fluorescence (CF) Parameters

CF can sensitively detect changes in photosynthetic activities and has been broadly used as a tool to study both abiotic and biotic stress responses in many plant species [32,34,45]. However, the response to different stresses is dependent on the magnitude and type of stress acquired by the plants and plant genotypes [20,30,37]. Our study showed the differential effect of drought stress on CF parameters, which was dependent on the stress treatment time. In general, when exposed to drought stress, PSII efficiency and representative parameters of photochemical quenching decreased, and non-photochemical parameters tended to increase [18,30,34]. The maximum quantum yield (Fv/Fm), an important photochemical quenching parameter for determining the maximum quantum efficiency of PSII, showed no significant changes until the end of the experiment. The value was constant until 6 day of the treatment time and significantly lower in stressed seedlings only on day 8 of the experiment (Figure 2, Table S2), confirming that the PSII reaction center was deactivated due to the photoinhibition only when drought stress reached the extreme stage. Our results were consistent to the previous reports by Franzoni et al. [16], who found reduced Fv/Fm in lettuce exposed to drought stress. Furthermore, Yao et al. [30] also found decrease in Fv/Fm in Arabidopsis only at the long exposure to drought stress. In contrast, Xu et al. [46] found non-significant changes in Fv/Fm in spinach grown under drought stress condition, while Zhou et al. [20] found both a significant and non-significant reduction in Fv/Fm, depending on the genotypes in tomato. Such discrepancies in Fv/Fm were mainly due to differences between plant species and their susceptibility to drought stress [47]. Further studies on seedlings and mature plant of lettuce varieties are required to detect genotypic effects on Fv/Fm.
Y(NO), an important parameter that enacts the photoprotective mechanism in plants, also increased in concentration only on day 8 of the treatment in stressed seedlings (Figure 2), suggesting that the photosynthetic protective mechanisms of lettuce seedlings subjected to drought stress do not normally work under extreme drought conditions [48,49]. Rfd, an indicator of plant vitality and photosynthetic rate under a given condition [34], showed non-significant changes until day 6 of the treatment time and decreased significantly on day 8 in drought-stressed seedlings (Table S2). Yao et al. [30] and Sun et al. [50] also found a similar reduction in Arabidopsis.
F′v/F′m, Y (PSII), qP, and qL, typically known as photochemical quenching parameters, showed similar trends between control and stressed seedlings over the treatment period (Figure 2). All four parameters showed lower values in drought-stressed seedlings than in the control. Fv′/Fm′, an indicator of the light utilization efficiency in the active light adaptation state, was significantly lower in drought-stressed seedlings than in the control seedlings on day 8 of the experiment, while Y (PSII), an effective quantum yield of photochemical energy conversion in PSII under light condition and gives the proportion of absorbed light that is actually used in PSII photochemistry [51], significantly decreased from day 6 of the experiment. qP, photochemical quenching of PSII under light condition and gives an indication of the proportion of reaction centers that are open and is used to indicate the photo inhibition and determine the level of photo protective quenching of fluorescence [52,53], also decreased from 6 day as in the Y (PSII). Furthermore, qL that estimated the fraction of open PSII centers also significantly decreased from day 6 of the experiment. The decrease in these photochemical quenching parameters suggested a decrease in photosynthetic function under drought stress conditions [30,37]. These results were consistent with those of Yao et al. [30], who found significantly lower values of Y(PSII) in Arabidopsis after long exposure to drought stress. Furthermore, Zhou et al. [20] observed a significant decrease in Y(PSII) and qL in tomato seedlings exposed to drought stress for four days. The significant decrease in Y(PSII) on days 6 and 8 of stress indicated a reduction in CO2 supply to the chloroplast as the stomatal closure occurred at that time [20,37]. These results also implied that Y (PSII), qP, and qL are more sensitive to drought stress induction compared to Fv/Fm, as Fv/Fm showed the significant changes only at the 8 day of the experiment, which might be due to the differences in the genotypes of the plant and sensitive ness of Fv/Fm under drought stress [20,46].
The non-photochemical quenching parameters NPQ, Y(NPQ), and qN also showed changes during drought stress treatment (Figure 2). Typically, these parameters increase under drought stress conditions, but the variance depends on the plant species and the level of drought stress [30,48] and decrease under severe exposure to the stress [34]. During the treatment period, NPQ in the seedlings exposed to drought stress increased continuously until day 6 and decreased on day 8 compared to the control indicating the enhancement of the thermal energy dissipation through xanthophyll cycle [54,55,56] in PSII until the 6 day of treatment time. In contrast, the decrease in NPQ on day 8 of extreme drought stress was probably due to reduction in heat dissipation capacity, limitations of CO2 assimilation, and the imbalance of photochemical activity in photosystem II [49]. This result also indicated the incapacity of protection mechanism process due to the senescence for the downregulation at the day 8 of the experiment [29]. Y(NPQ) and qN exhibited a somewhat similar pattern throughout the experimental period in both the control and stressed seedlings, however Y(NPQ) exhibited significantly higher value at day 6 of the treatment in drought stressed seedlings and decreased slightly on day 8 of the experiment suggesting the photo-oxidative damage and generation of reactive oxygen species in the chloroplasts [57].
Overall, the results showed that most of the CF parameters were significantly affected by water level (drought stress) and treatment time (Table S3). However, most of them were not significantly affected by drought stress until day 4 of treatment (Table S2). We also found a similar non-significant response of salinity stress during the early treatment period in this cultivar in our recent study [39]. Only three parameters (qP, qL, and Y(PSII)) could be used as index CF parameters to detect severe drought stress, as these parameters exhibited significant changes in the earlier stage (day 6 of the stress treatment) compared with other parameters; this can also be observed by visualizing the CF image, as presented in Figure 3. Additional studies on seedlings of many lettuce genotypes exposed to long-term weak/strong drought stress are required to detect the effect of genotypes and the impact of initial severe drought stress.

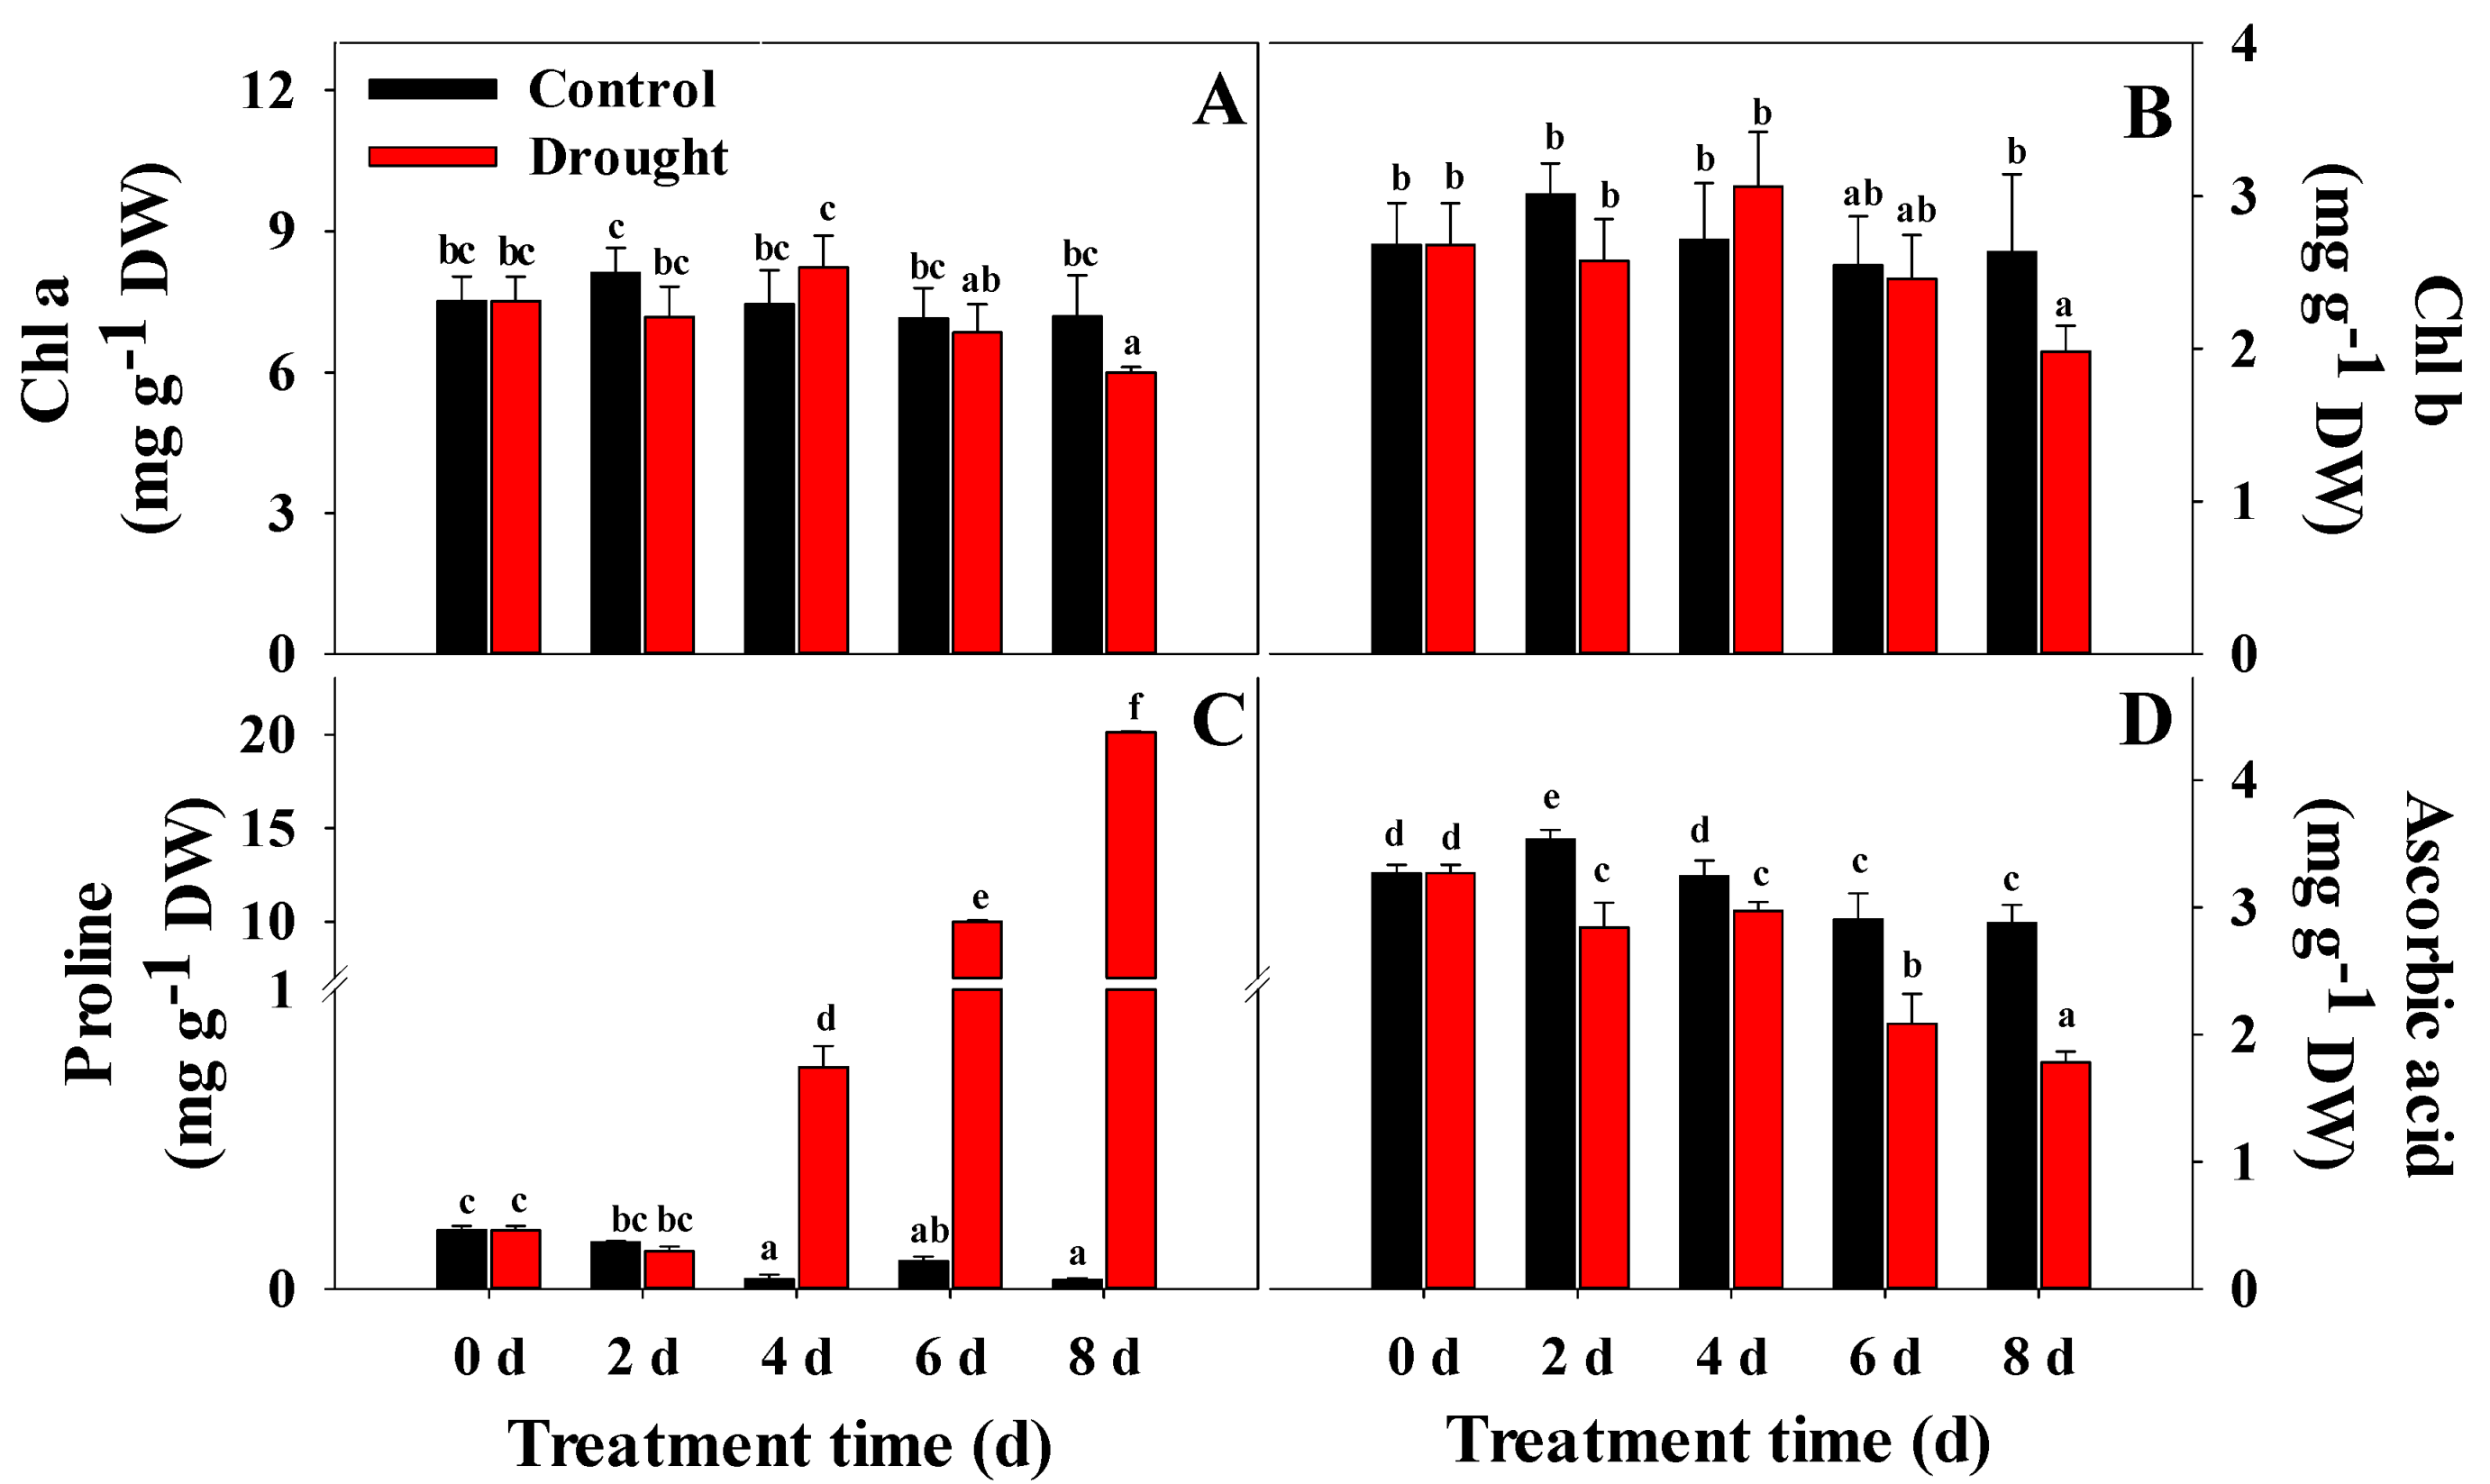
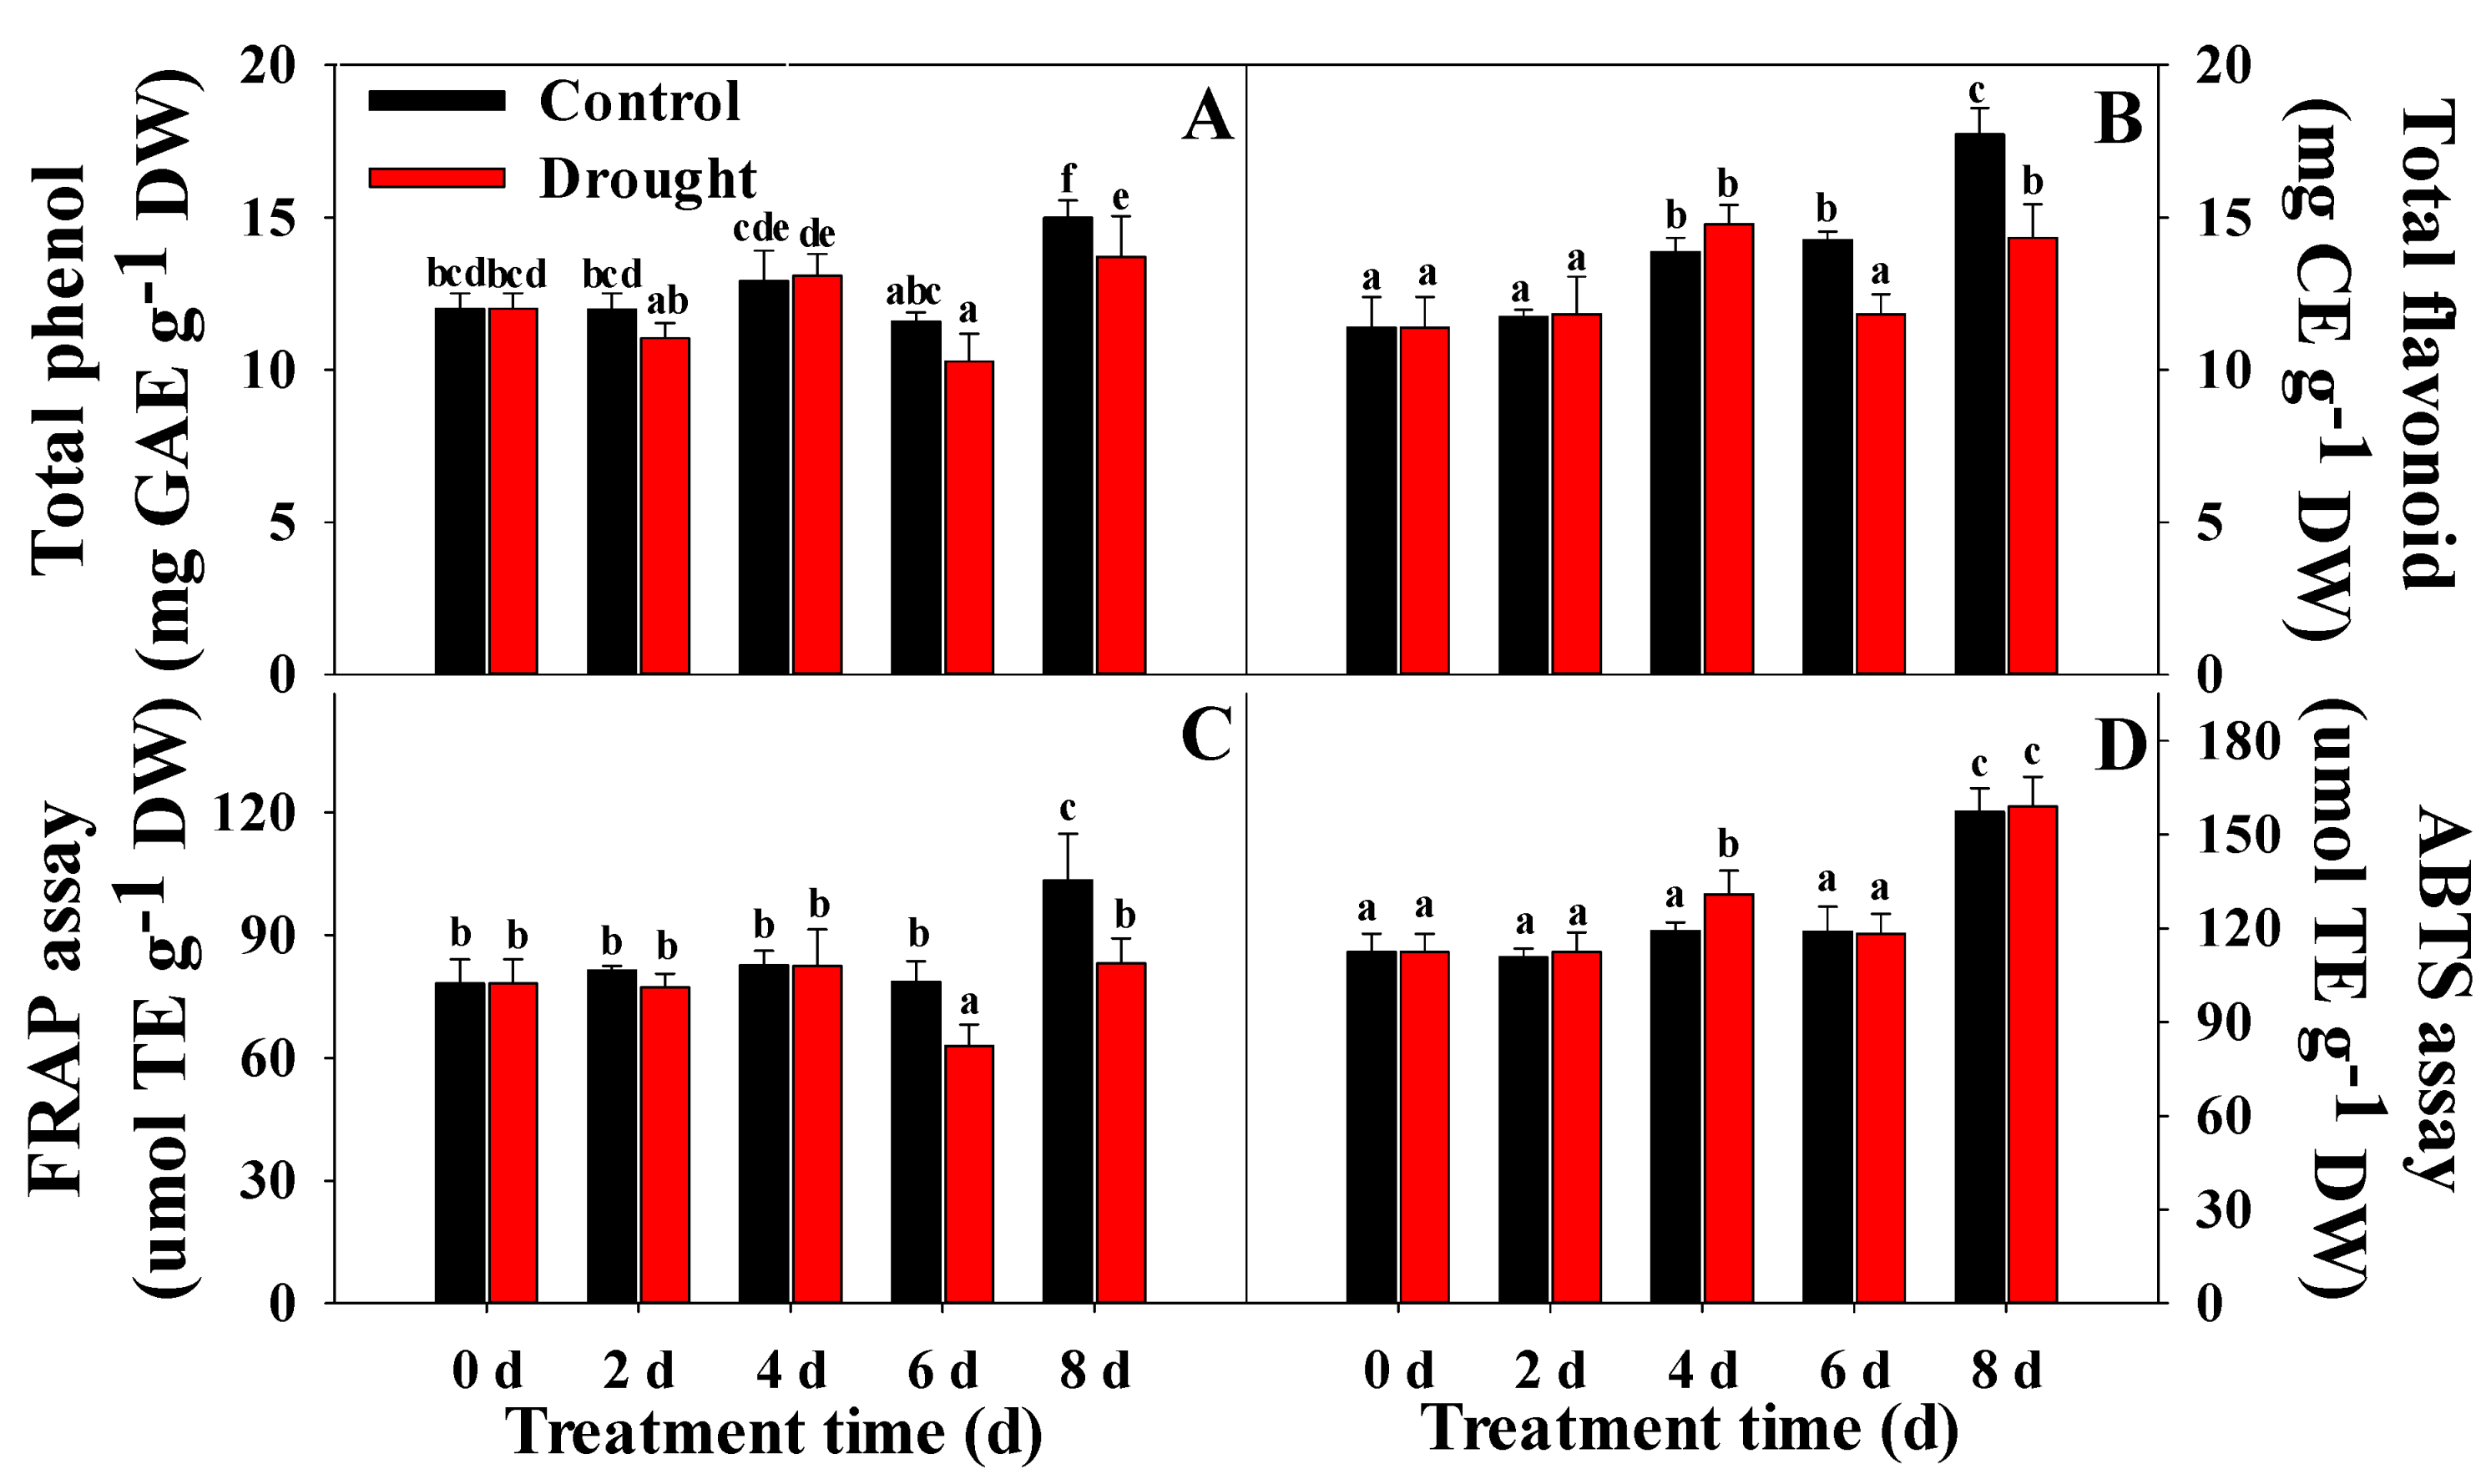
3.3. Variation in Chl, Proline, Ascorbic Acid, Total Phenol, and Total Flavonoid Content, and Antioxidant Activities

Chl a and b were greatly affected by drought stress during the experimental period (Figure 4A,B). Both the Chl a and b contents between control and drought-stressed seedlings were statistically similar until day 6 of the treatment, and the difference was observed only on day 8, showing statistically lower content in drought-stressed seedlings than in the control. On the other hand, chl a and b increased until day 4 in drought-stressed seedlings and suddenly decreased from that point, showing the lowest value on day 8, when the water content in the soil was about 8%. The highest chlorophyll content on day 4 of the experiment suggested that the photosynthetic apparatus still functioned well during that period. In contrast, on day 8 the lowest chlorophyll content implied damage to the chloroplast membrane and structure, photo-oxidation of chlorophyll, increased activity of chlorophyllase, and suppression of biosynthesis of chlorophyll due to water deficiency [25,58]. Franzoni et al. [16] also found reduced chlorophyll content in lettuce grown under water-stress conditions. Similar results have been obtained in different plant species [24,59].
In general, proline is produced and accumulated in plants during stress [16]. Proline plays an important role in regulating osmotic pressure in plants, and its concentration significantly increases with an increase in stress, including drought stress [16,58,60]. Our study showed a continuous increase in proline content in drought stress treatment during the progressive treatment time (Figure 4C), with a dramatic increase from day 4 of the experiment and reaching a maximum on day 8, showing ~660 times higher value in drought-stressed seedlings compared to control. The change in proline from day 4 was due to the significant decrease in root-zone water content from the same day, as presented in Figure 1. Furthermore, increase in proline content was probably due to the decrease in stomatal conductance which increases the accumulation of ABA that in turn led to the up-regulation of P5CS (Δ1-pyroline-5-carboxylate synthetase) [47,61].
Our results were comparable to those of Sahitya et al. [62], who found higher proline content in pepper seedlings exposed to drought stress. However, the difference observed in this study was appreciably higher compared to the previous results, as the accumulation of proline content is dependent on the level and type of stress and plant species [16,24]. Furthermore, this difference can be attributed to the difference in the inhibition of proline dehydrogenase and proline oxidase in the proline production mechanism [47,63]. Overall, the effects of drought stress, duration of treatment time, and interactions between the two showed highly significant results in proline content (Table 2).
Ascorbic acid, a water-soluble vitamin, decreased significantly in drought-stressed seedlings compared to control from day 2 of treatment (Figure 4D). This result was consistent with reports by Seminario et al. [36], who also observed a decrease in ascorbic acid content in soybean plants exposed to drought stress. The decrease in ascorbic acid was mainly attributed to the reduction in water content in the plants during drought stress, as ascorbic acid is produced at high levels and maintained under adequate moisture supply and smooth growth conditions [22,64]. The effects of drought stress, duration of treatment time, and their interaction showed significant effects on ascorbic acid content (Table 2).
The total phenol content (TPC) was also affected by drought stress (Figure 5A); however, the degree of variation observed in TPC was lower than for ascorbic acid content. We found a significant difference in TPC only at day 8, when control seedlings exhibited statistically higher TPC compared to seedlings exposed to drought stress. However, the interaction of water level and treatment time showed non-significant results (Table 2).
Several previous reports on wheat, pepper, kale, Amaranthus, and soybean have shown that plants exposed to drought stress conditions possess both higher and lower TPC, depending upon the plant [28,31,35,62,65], suggesting that drought stress affects plant genotype differently.
Total flavonoid content (TFC) showed a similar accumulation pattern to that of TPC during drought stress treatment (Figure 5B), showing a significantly lower TFC in drought-stressed seedlings on days 6 and 8 of the experiment. The TFC content in the control group continued to increase and reached a maximum at the end of the experiment (day 8). In contrast, TFC in the drought stress treatment temporarily decreased on day 6 of treatment and showed a tendency to rebound on day 8. The effect of water level, treatment time, and their interaction on TFC also exhibited significant results, similar to those for ascorbic acid content (Table 2). Our results were inconsistent with those of previous reports by Sarker and Oba [65] who found significantly higher TFC in Amaranthus exposed to drought stress compared to control. However, Naderi et al. [35] found both higher and lower TFC in drought-stressed wheat cultivars, depending on the genotypes, suggesting that accumulation of TFC content in drought-stressed plants is largely dependent on genotype.
The antioxidant activities of lettuce seedlings were evaluated using two assays: FRAP and ABTS assays, as one method alone may not provide accurate overall antioxidant capacity. Both the FRAP and ABTS assays followed a somewhat similar pattern during the progressive treatment time and showed higher activity in the control than in the drought stress treatment as water deficiency increased (Figure 5C,D). However, the interaction between water level and treatment time showed different results (Table 2). Antioxidant assays results resembled those of TPC and TFC, showing a similar trend in drought stress treatment compared to the control, indicating that these compounds contribute more to antioxidant activity [27]. This has been described previously by several authors in various plants [39,40].
The above results indicate that ascorbic acid and proline were the most predictive biochemical parameters to the drought stress among those studied. The effects of drought stress on ascorbic acid and proline content were statistically significant from days 2 and 4 of the experiment, respectively. However, proline showed a higher variation compared to ascorbic acid. In contrast, the TFC and FRAP assays were affected significantly from day 6 of the experiment, whereas the TPC and chlorophyll content were significantly affected only at the end of the experiment (day 8 of exposure to drought stress). Among the analyzed biochemical parameters, proline could be selected as the most potent biochemical parameter for drought stress detection, as it differed significantly compared to the other parameters (~600-fold difference at the end of the experiment).

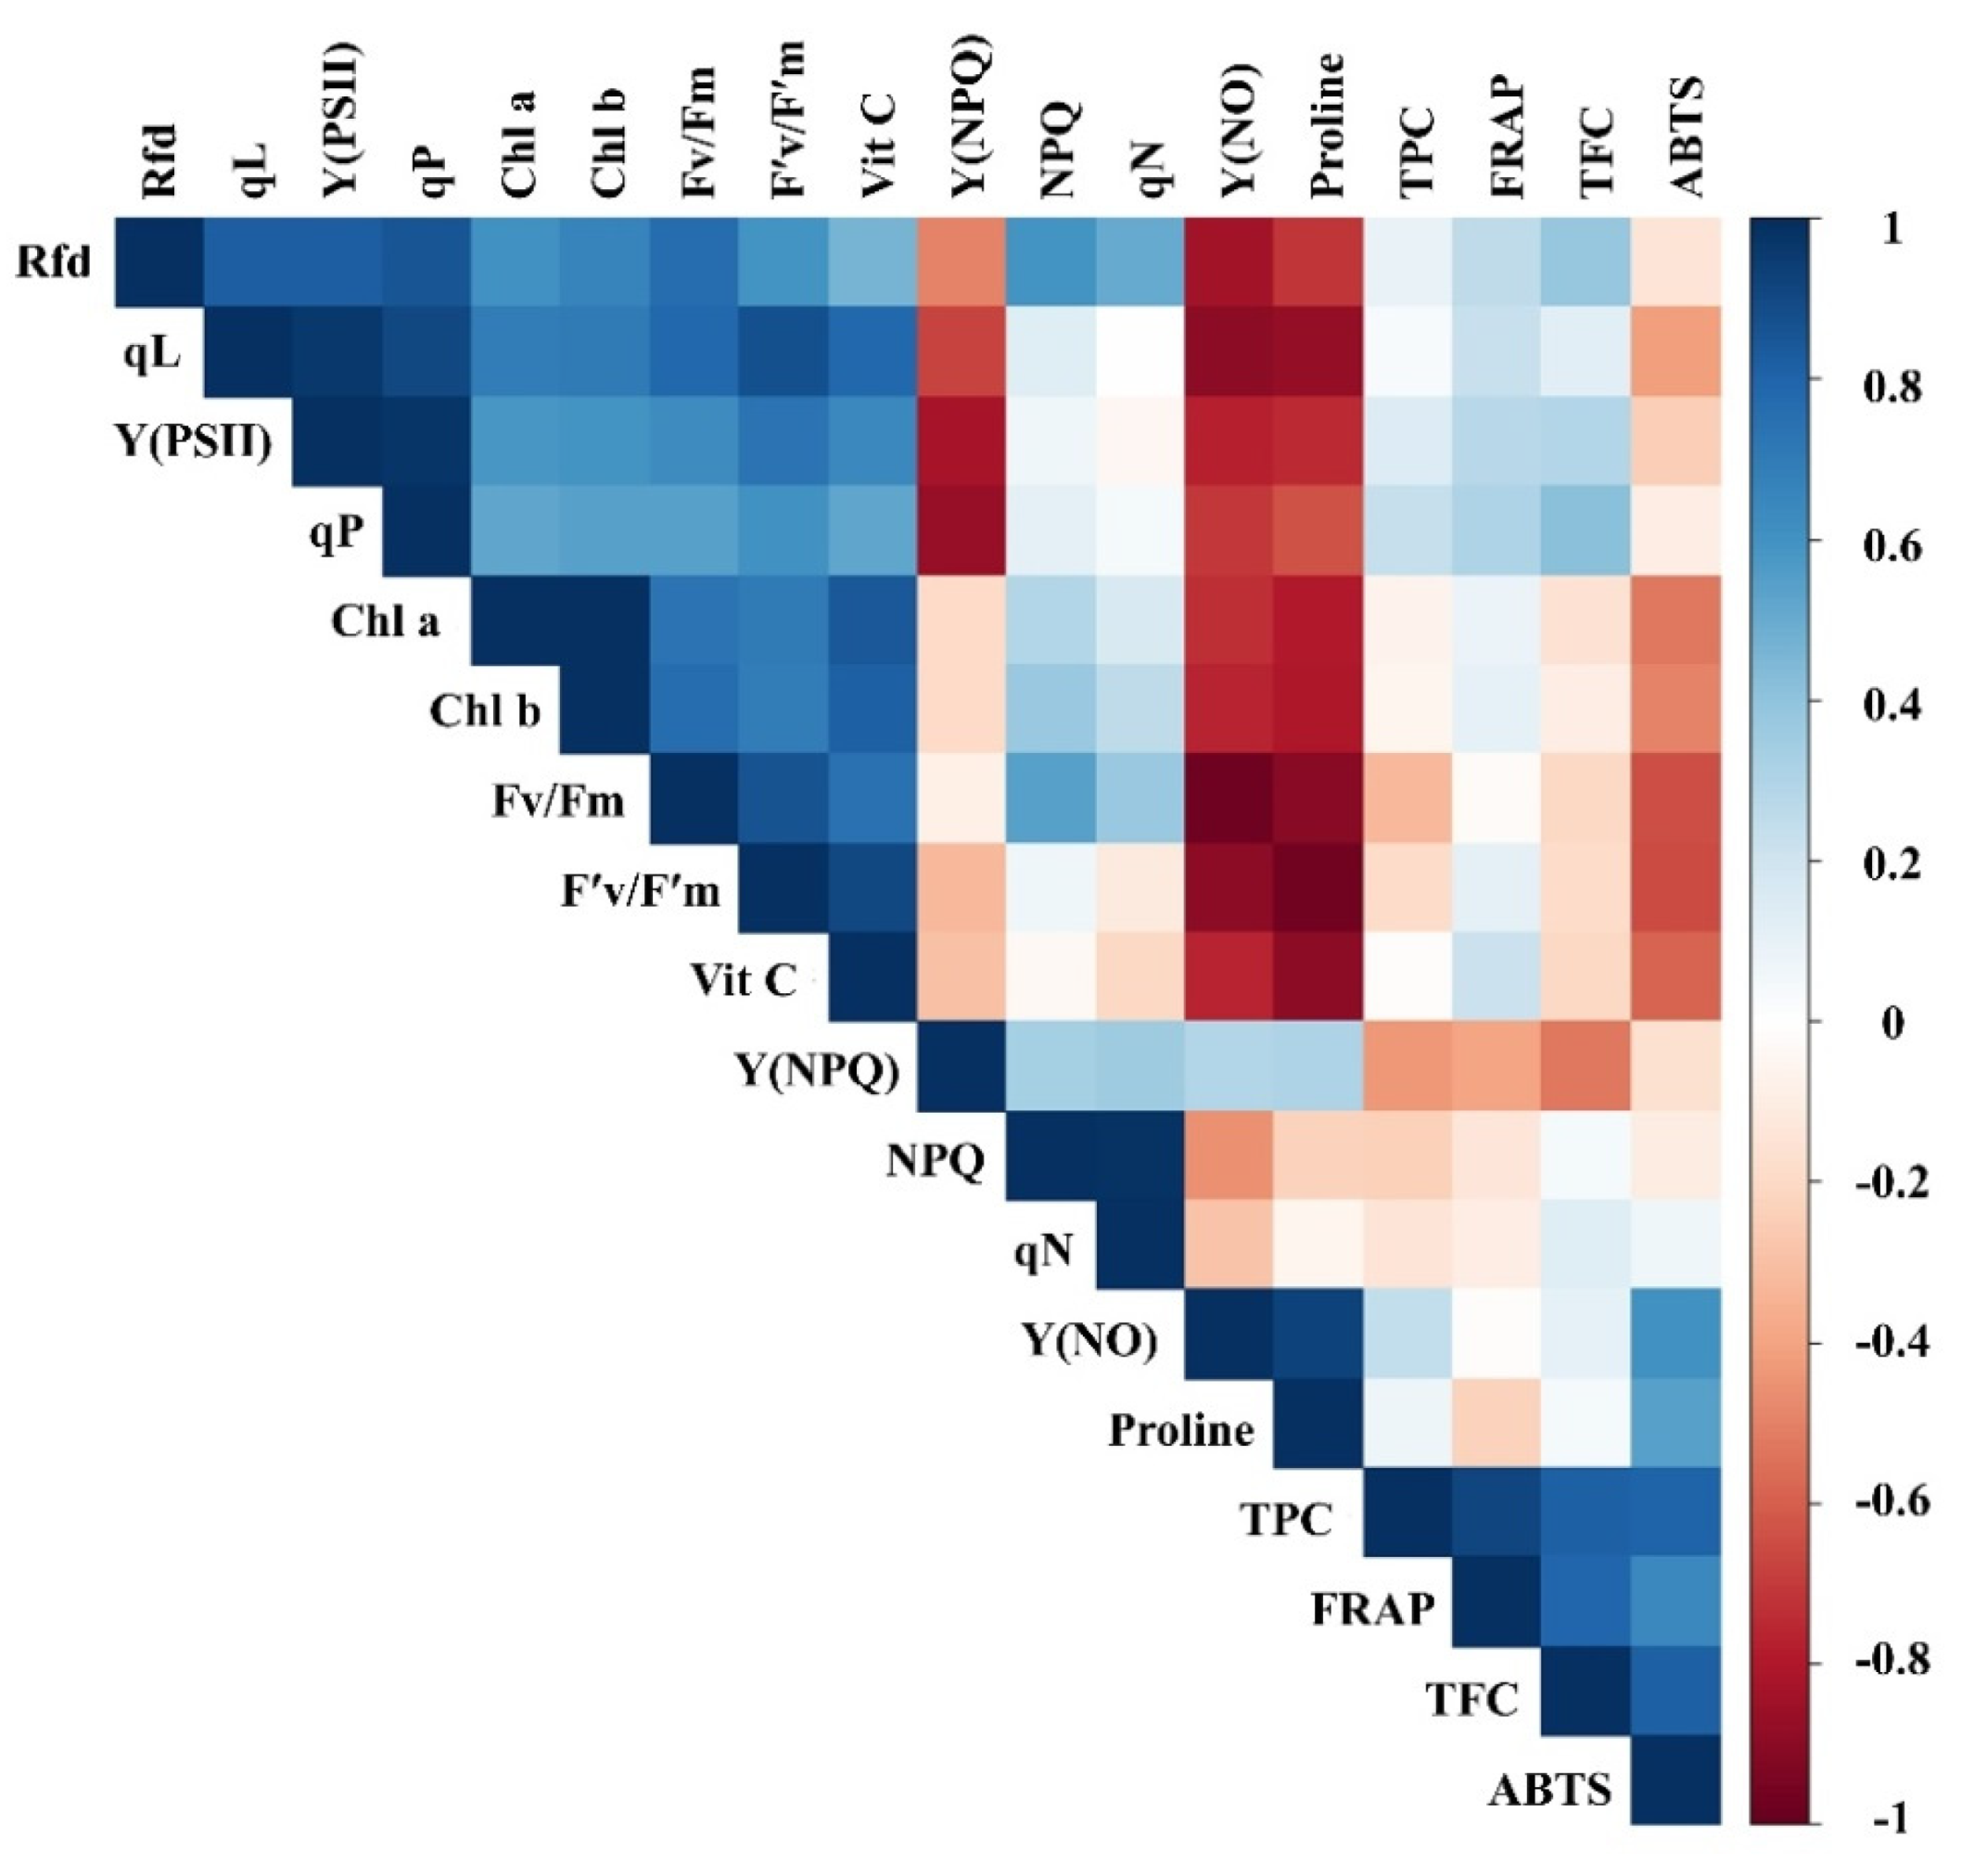
3.4. Correlation Analysis

Correlation analysis was performed among the CF parameters, phytochemical contents, and antioxidant activities to determine the direction and magnitude of parameters, regardless of the treatment time or drought stress (Figure 6).
Fv/Fm showed a significant positive correlation with the three CF parameters: F′v/F′m (r = 0.868***), qL (r = 0.788**), and Rfd (r = 0.761*), and negatively correlated with Y(NO) (r = −0.976***). Y(NO) exhibited a negative significant/non-significant negative correlation with all other CF parameters. Other CF parameters exhibited both significant (positive/negative) and non-significant results, depending on the parameters. Chlorophyll content was significantly positively correlated with Fv/Fm, F′v/F′m, qL, and Rfd, and negatively correlated with Y(NO). This result was somewhat similar to our previous results in lettuce exposed to salinity stress [39], although the magnitude of the correlation was different, likely due to the differences in stress. In contrast to salinity stress, we observed a significant positive/negative correlation between proline and most CF parameters. We found a significant correlation between ascorbic acid and some CF parameters, as in our previous reports. Almost all CF parameters exhibited a non-significant correlation with antioxidant assays. On the other hand, TPC exhibited the highest positive correlations with both FRAP and ABTS assays, followed by TPC and ascorbic acid, due to the higher contribution of TPC to total antioxidant activities, as observed in a range of vegetables [39,40,41].

4. Conclusions

Differential effects of drought stress on CF and growth parameters, phytochemical composition, and antioxidant activities were observed in lettuce seedlings (Figure 7). Most of the CF parameters showed some changes during the course of the experiment, but these changes were significant only under severe drought stress (<25% soil water level). Growth parameters were visually observed from day 6 of treatment (<15% soil water content). Three CF parameters—qP, qL, and Y(PSII)—can be considered in detection of drought stress in lettuce, as they showed significant changes earlier (6 days after drought stress initiation) than other CF parameters. Proline was found to be the most meaningful measurement among the biochemical parameters; it sharply increased with increasing drought stress levels from day 4 of treatment. The results provided here, along with our previous research, can be applied to elucidate optimum ranges of stresses in other seedlings grown under controlled conditions.

Supplementary Materials

The following are available online at https://www.mdpi.com/article/10.3390/horticulturae7080238/s1, Table S1: Growth parameter of lettuce seedling as affected by drought stress during the experiment, Table S2: Changes in chlorophyll fluorescence parameters measured for lettuce seedlings as affected by drought stress during progressive treatment time, Table S3: Summary of analysis of variance of chlorophyll fluorescence (CF) parameters in lettuce seedlings at the drought stress and treatment time.

Author Contributions

Y.K.S., S.R.B. and J.G.L. conceived and designed the experiments; Y.K.S., J.S.J. and J.W.S. performed the experiment; Y.K.S., S.R.B. and J.S.J. analyzed the data; S.R.B. wrote the manuscript; S.R.B. and J.G.L. revised the manuscript. All authors have read and agreed to the published version of the manuscript.

Funding

This research was funded by the Basic Science Research Program through the National Research Foundation of Korea (NRF) by the Ministry of Education (No. 2019R1A6A1A09031717).

Institutional Review Board Statement

Not applicable.

Informed Consent Statement

Not applicable.

Conflicts of Interest

The authors declare no conflict of interest.

References

  1. FAO (Food and Agriculture Organization). Agricultural Statistical Database for 2019. Available online: http://www.fao.org/faostat/en/#data/QC (accessed on 25 May 2021).
  2. Mulabagal, V.; Ngouajio, M.; Nair, A.; Zhang, Y.; Gottumukkala, A.L.; Nair, M.G. In vitro evaluation of red and green lettuce (Lactuca sativa) for functional food properties. Food Chem. 2010, 118, 300–306. [Google Scholar] [CrossRef]
  3. Llorach, R.; Martinez-Sánchez, A.; Tomas-Barberan, F.A.; Gil, M.I.; Ferreres, F. Characterisation of polyphenols and antioxidant properties of five lettuce varieties and escarole. Food Chem. 2008, 108, 1028–1038. [Google Scholar] [CrossRef] [PubMed]
  4. Zlotek, U.; Swieca, M.; Jakubczyk, A. Effect of abiotic elicitation on main health-promoting compounds, antioxidant activity and commercial quality of butter lettuce (Lactuca sativa L.). Food Chem. 2014, 148, 253–260. [Google Scholar] [CrossRef] [PubMed]
  5. Camejo, D.; Frutos, A.; Mestre, T.C.; Pinero, M.D.C.; Rivero, R.M.; Martinez, V. Artificial light impacts the physical and nutritional quality of lettuce. Hortic. Environ. Biotechnol. 2020, 61, 69–82. [Google Scholar] [CrossRef]
  6. Carotti, L.; Graamans, L.; Puksic, F.; Butturini, M.; Meinen, E.; Heuvelink, E.; Stanghellini, C. Plant factories are heating up: Hunting for the best combination of light intensity, air temperature and root-zone temperature in lettuce production. Front. Plant Sci. 2020, 11, 2251. [Google Scholar] [CrossRef]
  7. Sofo, A.; Lundegardh, B.; Martensson, A.; Manfra, M.; Pepe, G.; Sommella, E.; de Nisco, M.; Tenore, G.C.; Campiglia, P.; Scopa, A. Different agronomic and fertilization systems affect polyphenolic profile, antioxidant capacity and mineral composition of lettuce. Sci. Hortic. 2016, 204, 106–115. [Google Scholar] [CrossRef]
  8. Bilalis, D.; Kanatas, P.; Patsiali, S.; Konstantas, A.; Akoumianakis, K. Comparison between conventional and organic floating systems for lettuce and tomato (Lactuca sativa and Lycopersicon esculentum) seedling production. J. Food Agric. Environ. 2009, 7, 623–628. [Google Scholar]
  9. Johkan, M.; Shoji, K.; Goto, F.; Hashida, S.N.; Yoshihara, T. Blue light-emitting diode light irradiation of seedlings improves seedling quality and growth after transplanting in red leaf lettuce. HortScience 2010, 45, 1809–1814. [Google Scholar] [CrossRef] [Green Version]
  10. Fereres, E.; Goldhamer, D.A.; Parsons, L.R. Irrigation water management of horticultural crops. HortScience 2003, 38, 1036–1042. [Google Scholar] [CrossRef] [Green Version]
  11. Kurunc, A. Effects of water and salinity stresses on growth, yield, and water use of iceberg lettuce. J. Sci. Food Agric. 2021. [Google Scholar] [CrossRef]
  12. Dessart, F.J.; Barreiro-Hurlé, J.; van Bavel, R. Behavioural factors affecting the adoption of sustainable farming practices: A policy-oriented review. Eur. Rev. Agric. Econ. 2019, 46, 417–471. [Google Scholar] [CrossRef] [Green Version]
  13. Garcia-Vila, M.; Fereres, E. Combining the simulation crop model aqua crop with an economic model for the optimization of irrigation management at farm level. Eur. J. Agron. 2012, 36, 21–31. [Google Scholar] [CrossRef] [Green Version]
  14. Yuan, G.-F.; Jia, C.-G.; Li, Z.; Sun, B.; Zhang, L.-P.; Liu, N.; Wang, Q.-M. Effect of brassinosteroids on drought resistance and abscisic acid concentration in tomato under water stress. Sci. Hortic. 2010, 126, 103–108. [Google Scholar] [CrossRef]
  15. Zargar, S.M.; Gupta, N.; Nazir, M.; Mahajan, R.; Malik, F.A.; Sofi, N.R.; Shikari, A.B.; Salgotra, R.K. Impact of drought on photosynthesis: Molecular perspective. Plant Gene 2017, 11, 154–159. [Google Scholar] [CrossRef]
  16. Franzoni, G.; Cocetta, G.; Ferrante, A. Effect of glutamic acid foliar applications on lettuce under water stress. Physiol. Mol. Biol. Plants 2021, 27, 1059–1072. [Google Scholar] [CrossRef]
  17. Pervez, M.A.; Ayub, C.M.; Khan, H.A.; Shahid, M.A.; Ashraf, I. Effect of drought stress on growth, yield and seed quality of tomato (Lycopersicon esculentum L.). Pak. J. Agric. Sci. 2009, 46, 174–178. [Google Scholar]
  18. Liang, G.; Liu, J.; Zhang, J.; Guo, J. Effects of drought stress on photosynthetic and physiological parameters of tomato. J. Am. Soc. Hortic. Sci. 2020, 145, 12–17. [Google Scholar] [CrossRef] [Green Version]
  19. Paim, B.T.; Crizel, R.L.; Tatiane, S.J.; Rodrigues, V.R.; Rombaldi, C.V.; Galli, V. Mild drought stress has potential to improve lettuce yield and quality. Sci. Hortic. 2020, 272, 109578. [Google Scholar] [CrossRef]
  20. Zhou, R.; Yu, X.; Ottosen, C.O.; Rosenqvist, E.; Zhao, L.; Wang, Y.; Yu, W.; Zhao, T.; Wu, Z. Drought stress had a predominant effect over heat stress on three tomato cultivars subjected to combined stress. BMC Plant Biol. 2017, 17, 1–13. [Google Scholar] [CrossRef] [Green Version]
  21. Yadav, B.; Jogawat, A.; Rahman, M.S.; Narayan, O.P. Secondary metabolites in the drought stress tolerance of crop plants: A review. Gene Rep. 2021, 23, 101040. [Google Scholar] [CrossRef]
  22. Akram, N.A.; Shafiq, F.; Ashraf, M. Ascorbic acid-a potential oxidant scavenger and its role in plant development and abiotic stress tolerance. Front. Plant Sci. 2017, 8, 613. [Google Scholar] [CrossRef]
  23. Chun, S.C.; Paramasivan, M.; Chandrasekaran, M. Proline accumulation influenced by osmotic stress in arbuscular mycorrhizal symbiotic plants. Front. Plant Sci. 2018, 9, 2525. [Google Scholar] [CrossRef] [PubMed] [Green Version]
  24. Ahmed, I.M.; Dai, H.; Zheng, W.; Cao, F.; Zhang, G.; Sun, D.; Wu, F. Genotypic differences in physiological characteristics in the tolerance to drought and salinity combined stress between Tibetan wild and cultivated barley. Plant Physiol. Biochem. 2013, 63, 49–60. [Google Scholar] [CrossRef]
  25. Kabiri, R.; Nasibi, F.; Farahbakhsh, H. Effect of exogenous salicylic acid on some physiological parameters and alleviation of drought stress in Nigella sativa plant under hydroponic culture. Plant Prot. Sci. 2014, 50, 43–51. [Google Scholar] [CrossRef] [Green Version]
  26. Kiran, S. Effects of vermicompost on some morphological, physiological and biochemical parameters of lettuce (lactuca sativa var. crispa) under drought stress. Not. Bot. Horti Agrobot. Cluj Napoca 2019, 47, 352–358. [Google Scholar] [CrossRef] [Green Version]
  27. Klunklin, W.; Savage, G. Effect on quality characteristics of tomatoes grown under well-watered and drought stress conditions. Foods 2017, 6, 56. [Google Scholar] [CrossRef] [PubMed] [Green Version]
  28. Kopta, T.; Sekara, A.; Pokluda, R.; Ferby, V.; Caruso, G. Screening of chilli pepper genotypes as a source of capsaicinoids and antioxidants under conditions of simulated drought stress. Plants 2020, 9, 364. [Google Scholar] [CrossRef] [PubMed] [Green Version]
  29. Ors, S.; Ekinci, M.; Yildirim, E.; Sahin, U.; Turan, M.; Dursun, A. Interactive effects of salinity and drought stress on photosynthetic characteristics and physiology of tomato (Lycopersicon esculentum L.) seedlings. S. Afr. J. Bot. 2021, 137, 335–339. [Google Scholar] [CrossRef]
  30. Yao, J.; Sun, D.; Cen, H.; Xu, H.; Weng, H.; Yuan, F.; He, Y. Phenotyping of Arabidopsis drought stress response using kinetic chlorophyll fluorescence and multicolor fluorescence imaging. Front. Plant Sci. 2018, 9, 603. [Google Scholar] [CrossRef] [PubMed]
  31. Yoon, H.I.; Zhang, W.; Son, J.E. Optimal duration of drought stress near harvest for promoting bioactive compounds and antioxidant capacity in kale with or without UV-B radiation in plant factories. Plants 2020, 9, 295. [Google Scholar] [CrossRef] [PubMed] [Green Version]
  32. Gorbe, E.; Calatayud, A. Applications of chlorophyll fluorescence imaging technique in horticultural research: A review. Sci. Hortic. 2012, 138, 24–35. [Google Scholar] [CrossRef]
  33. Susic, N.; Zibrat, U.; Sirca, S.; Strajnar, P.; Razinger, J.; Knapic, M.; Voncina, A.; Urek, G.; Stare, B.G. Discrimination between abiotic and biotic drought stress in tomatoes using hyperspectral imaging. Sens. Actuators B Chem. 2018, 273, 842–852. [Google Scholar] [CrossRef] [Green Version]
  34. Murchie, E.H.; Lawson, T. Chlorophyll fluorescence analysis: A guide to good practice and understanding some new applications. J. Exp. Bot. 2013, 64, 3983–3998. [Google Scholar] [CrossRef] [PubMed] [Green Version]
  35. Naderi, S.; Fakheri, B.A.; Maali-Amiri, R.; Mahdinezhad, N. Tolerance responses in wheat landrace Bolani are related to enhanced metabolic adjustments under drought stress. Plant Physiol. Biochem. 2020, 150, 244–253. [Google Scholar] [CrossRef]
  36. Seminario, A.; Song, L.; Zulet, A.; Nguyen, H.T.; González, E.M.; Larrainzar, E. Drought stress causes a reduction in the biosynthesis of ascorbic acid in soybean plants. Front. Plant Sci. 2017, 8, 1042. [Google Scholar] [CrossRef] [Green Version]
  37. Xu, Q.; Ma, X.; Lv, T.; Bai, M.; Wang, Z.; Niu, J. Effects of water stress on fluorescence parameters and photosynthetic characteristics of drip irrigation in rice. Water 2020, 12, 289. [Google Scholar] [CrossRef] [Green Version]
  38. Oh, M.M.; Carey, E.E.; Rajashekar, C.B. Regulated water deficits improve phytochemical concentration in lettuce. J. Am. Soc. Hortic. Sci. 2010, 135, 223–229. [Google Scholar] [CrossRef] [Green Version]
  39. Shin, Y.K.; Bhandari, S.R.; Jo, J.S.; Song, J.W.; Cho, M.C.; Yang, E.Y.; Lee, J.G. Response of salt stress in lettuce: Changes in chlorophyll fluorescence parameters, phytochemical contents, and antioxidant activities. Agronomy 2020, 10, 1627. [Google Scholar] [CrossRef]
  40. Bhandari, S.R.; Lee, J.G. Ripening-dependent changes in antioxidants, color attributes, and antioxidant activity of seven tomato (Solanum lycopersicum L.) cultivars. J. Anal. Method Chem. 2016, 2016, 5498618. [Google Scholar] [CrossRef] [Green Version]
  41. Bhandari, S.R.; Cho, M.-C.; Lee, J.G. Genotypic variation in carotenoid, ascorbic acid, total phenolic, and flavonoid contents, and antioxidant activity in selected tomato breeding lines. Hortic. Environ. Biotechnol. 2016, 57, 440–452. [Google Scholar] [CrossRef]
  42. Dodd, I.C.; Egea, G.; Watts, C.W.; Whalley, W.R. Root water potential integrates discrete soil physical properties to influence ABA signaling during partial rootzone drying. J. Exp. Bot. 2010, 61, 3543–3551. [Google Scholar] [CrossRef] [Green Version]
  43. Ghanbarzadeh, Z.; Zamani, H.; Mohsenzadeh, S.; Marczak, Ł.; Stobiecki, M.; Zarei, M. Rhizosphere symbionts improve water stress tolerance in moldavian balm through modulation of osmolytes. Rhizosphere 2021, 19, 100367. [Google Scholar] [CrossRef]
  44. Inoue, T.; Sunaga, M.; Ito, M.; Yuchen, Q.; Matsushima, Y.; Sakoda, K.; Yamori, W. Minimizing VPD fluctuations maintains higher stomatal conductance and photosynthesis, resulting in improvement of plant growth in lettuce. Front. Plant Sci. 2021, 12, 458. [Google Scholar] [CrossRef]
  45. Banks, J.M. Chlorophyll fluorescence as a tool to identify drought stress in Acer genotypes. Environ. Exp. Bot. 2018, 155, 118–127. [Google Scholar] [CrossRef]
  46. Xu, C.; Leskovar, D.I. Effects of A. nodosum seaweed extracts on spinach growth, physiology and nutrition value under drought stress. Sci. Hortic. 2015, 183, 39–47. [Google Scholar] [CrossRef]
  47. Parkash, V.; Singh, S. A review on potential plant-based water stress indicators for vegetable crops. Sustainability 2020, 12, 3945. [Google Scholar] [CrossRef]
  48. dos Reis, C.O.; Magalhaes, P.C.; Avila, R.G.; Almeida, L.G.; Rabelo, V.M.; Carvalho, D.T.; Cabral, D.F.; Karam, D.; de Souza, T.C. Action of N-Succinyl and N, O-Dicarboxymethyl chitosan derivatives on chlorophyll photosynthesis and fluorescence in drought-sensitive maize. J. Plant Growth Regul. 2019, 38, 619–630. [Google Scholar] [CrossRef] [Green Version]
  49. Huang, B.; Chen, Y.E.; Zhao, Y.Q.; Ding, C.B.; Liao, J.Q.; Hu, C.; Zhou, L.J.; Zhang, Z.W.; Yuan, S.; Yuan, M. Exogenous melatonin alleviates oxidative damages and protects photosystem II in maize seedlings under drought stress. Front. Plant Sci. 2019, 10, 677. [Google Scholar] [CrossRef] [PubMed] [Green Version]
  50. Sun, D.; Zhu, Y.; Xu, H.; He, Y.; Cen, H. Time-series chlorophyll fluorescence imaging reveals dynamic photosynthetic fingerprints of sos mutants to drought stress. Sensors 2019, 19, 2649. [Google Scholar] [CrossRef] [Green Version]
  51. Genty, B.; Briantais, J.M.; Baker, N.R. The relationship between the quantum yield of photosynthetic electron transport and quenching of chlorophyll fluorescence. Biochim. Biophys. Acta 1989, 990, 87–92. [Google Scholar] [CrossRef]
  52. Anderson, J.M.; Chow, W.S.; Park, Y.I. The grand design of photosynthesis: Acclimation of the photosynthetic apparatus to environmental cues. Photosynth. Res. 1995, 46, 129–139. [Google Scholar] [CrossRef] [PubMed]
  53. Ruban, A.V.; Murchie, E.H. Assessing the photoprotective effectiveness of non-photochemical chlorophyll fluorescence quenching: A new approach. Biochim. Biophys. Acta 2012, 1817, 977–982. [Google Scholar] [CrossRef] [Green Version]
  54. Demmig-Adams, B.; Adams, W.W. III. The role of xanthophyll cycle carotenoids in the protection of photosynthesis. Trends Plant Sci. 1996, 1, 21–26. [Google Scholar] [CrossRef]
  55. Wang, Z.; Li, G.; Sun, H.; Ma, L.; Guo, Y.; Zhao, Z.; Gao, H.; Mei, L. Effect of drought stress on photosynthesis and photosynthetic electron transport chain in young apple tree leaves. Biol. Open 2018, 7, bio35279. [Google Scholar] [CrossRef] [PubMed] [Green Version]
  56. Pinnola, A.; Dall’Osto, L.; Gerotto, C.; Morosinotto, T.; Bassi, R.; Alboresi, A. Zeaxanthin binds to light-harvesting complex stress-related protein to enhance nonphotochemical quenching in Physcomitrella patens. Plant Cell 2013, 25, 3519–3534. [Google Scholar] [CrossRef] [Green Version]
  57. Ruban, A.V. Nonphotochemical chlorophyll fluorescence quenching: Mechanism and effectiveness in protecting plants from photodamage. Plant Physiol. 2016, 170, 1903–1916. [Google Scholar] [CrossRef] [Green Version]
  58. Kapoor, D.; Bhardwaj, S.; Landi, M.; Sharma, A.; Ramakrishnan, M.; Sharma, A. The impact of drought in plant metabolism: How to exploit tolerance mechanisms to increase crop production. Appl. Sci. 2020, 10, 5692. [Google Scholar] [CrossRef]
  59. Nikolaeva, M.K.; Maevskaya, S.N.; Shugaev, A.G.; Bukhov, N.G. Effect of drought on chlorophyll content and antioxidant enzyme activities in leaves of three wheat cultivars varying in productivity. Russ. J. Plant Physiol. 2010, 57, 87–95. [Google Scholar] [CrossRef]
  60. Gupta, B.; Huang, B. Mechanism of salinity tolerance in plants: Physiological, biochemical, and molecular characterization. Int. J. Genom. 2014, 2014, 701596. [Google Scholar] [CrossRef]
  61. Trovato, M.; Mattioli, R.; Costantino, P. Multiple role of proline in plant stress tolerance and development. Rend. Lincei 2008, 19, 325–346. [Google Scholar] [CrossRef]
  62. Sahitya, U.L.; Krishna, M.S.R.; Deepthi, R.; Prasad, G.S.; Kasim, D. Seed antioxidants interplay with drought stress tolerance indices in chilli (Capsicum annuum L.) seedlings. BioMed Res. Int. 2018, 2018, 1605096. [Google Scholar] [CrossRef] [PubMed] [Green Version]
  63. Yazdanpanah, S.; Baghizadeh, A.; Abbassi, F. The interaction between drought stress and salicylic and ascorbic acids on some biochemical characteristics of Satureja hortensis. Afr. J. Agric. Res. 2011, 6, 798–807. [Google Scholar] [CrossRef]
  64. Zhang, Z.; Wang, J.; Zhang, R.; Huang, R. The ethylene response factor AtERF98 enhances tolerance to salt through the transcriptional activation of ascorbic acid synthesis in Arabidopsis. Plant J. 2012, 71, 273–287. [Google Scholar] [CrossRef] [PubMed]
  65. Sarker, U.; Oba, S. Drought stress enhances nutritional and bioactive compounds, phenolic acids and antioxidant capacity of Amaranthus leafy vegetable. BMC Plant Biol. 2018, 18, 1–15. [Google Scholar] [CrossRef] [Green Version]
Figure 1. Changes in visual appearance of lettuce seedlings (A), relative water content in single plug cell (B), and shoot fresh weight (C) grown under control and drought stress conditions during progressive treatment time. Different letters indicate a significant difference at p < 0.05 by Duncan’s multiple range test.
Horticulturae 07 00238 g001
Figure 2. Changes in CF parameters in the seedlings of lettuce grown under drought condition at different time points. Each plot point represents the mean ± SD of 10 biological replicates. Asterisk (*) represents the significant difference between control and stressed seedlings in respective treatment time by one way ANOVA at p < 0.05. Refer to Table 1 for the description of each parameter.
Horticulturae 07 00238 g002
Figure 3. Changes in CF images: Fv/Fm, qP, QY_Lss, NPQ, and Rfd in lettuce seedlings grown under drought condition for different time periods. Refer to Table 1 for descriptions of each CF parameter.
Horticulturae 07 00238 g003
Figure 4. Effect of drought stress on Chl a (A), Chl b (B), proline (C), and vitamin C content (D) in lettuce seedlings during progressive treatment time. Vertical bars represent mean ± SD of three replicates, and the different letters indicate statistically significant differences by Duncan’s multiple range test at p < 0.05. Chl: chlorophyll.
Horticulturae 07 00238 g004
Figure 5. Effect of drought stress on total phenol content (A), total flavonoid content (B), FRAP assay (C), and ABTS assay (D) in lettuce seedlings during progressive treatment time. Vertical bars represent mean ± SD of three replicates, and different letters indicate statistically significant differences by Duncan’s multiple range test at p < 0.05. FRAP: ferric-reducing antioxidant power, ABTS: 2,2′-azino-bis(3-ethylbenzothiazoline-6-sulfonic acid).
Horticulturae 07 00238 g005
Figure 6. Correlation analysis for chlorophyll fluorescence parameters, phytochemicals, and antioxidant activities in lettuce seedlings, regardless of treatment length or drought stress. Blue and red boxes represent positive and negative correlation, respectively. Color intensities are proportional to the correlation coefficients, as shown in the legend to the right. Chl: chlorophyll, TPC: total phenol content, TFC: total flavonoid content, FRAP: ferric-reducing antioxidant power; ABTS: 2,2′-azino-bis (3-ethylbenzothiazoline-6-sulfonic acid). Refer to Table 1 for detailed information on CF parameters.
Horticulturae 07 00238 g006
Figure 7. Schematic diagram of the changes of major parameters during progressive treatment time under drought stress condition. Refer to the Table 1 for detailed information of CF parameters.
Horticulturae 07 00238 g007
Table 1. Chlorophyll fluorescence parameters used in this study.
ParameterFormulaDescription
Fv/Fm(Fm − F0)/FmMaximum quantum yield of PSII photochemistry measured in the dark-adapted state
F′v/F′m(F′m − F′0)/F′mExciton transfer efficiency from antenna pigments to the reaction center of photosystem II (PSII) in the light-adapted state
Y(PSII)(F′m − Fs)/F′mEffective quantum yield of photochemical energy conversion in PSII
NPQ(Fm − F′m)/F′mNon-photochemical quenching of maximum fluorescence
qP(F′m − Fs)/(F′m − F′0)Photochemical quenching of PSII
qN(Fm − F′m)/(Fm − F′0)Coefficient of non-photochemical quenching of variable fluorescence
qLqP × F0/FsCoefficient of photochemical quenching of variable fluorescence based on the lake model of PSII
Y(NO)1/[NPQ + 1 + qL(Fm/F0 − 1)]Quantum yield of non-regulated energy dissipation in PSII
Y(NPQ)1 − ϕPSII − ϕNOQuantum yield of regulated energy dissipation in PSII
Rfd(Fm − Fs)/FsRatio of fluorescence decline
Table 2. Summary of analysis of variance for total phenol, total flavonoid, vitamin C, chlorophyll, proline, ferric reducing antioxidant power (FRAP) assay, and 2,2′-azino-bis(3-ethylbenzothiazoline-6-sulfonic acid) (ABTS) assay of lettuce seedlings at the two water levels and multiple treatment times.
ParametersWater Level (W)Treatment Time (T)W × T
F-ValueSignificanceF-ValueSignificanceF-ValueSignificance
Total phenol6.042*19.533***1.365NS
Total flavonoid10.398**32.390***7.556**
Vitamin C125.806***57.209***14.444***
Chlorophyll a2.144NS4.084*2.412NS
Chlorophyll b2.016NS3.247*2.255NS
Total chlorophyll2.127NS3.836*2.393NS
FRAP assay12.371**10.220***3.347*
ABTS assay1.467NS51.220***0.885NS
Proline193,853***79,394***80,921***
*, **, and *** indicate significance at p < 0.05, p < 0.01, and p < 0.001, respectively. NS: non-significant.
Publisher’s Note: MDPI stays neutral with regard to jurisdictional claims in published maps and institutional affiliations.

