Article

Fertilization and Soil Nutrients Impact Differentially Cranberry Yield and Quality in Eastern Canada

by
Reza Jamaly
1,
Serge-Étienne Parent
1,2 and
Léon E. Parent
1,3,*
1
Department of Soil and Agri-Food Engineering, Université Laval, Québec, QC G1V 0A6, Canada
2
Département de Médecine de Famille, Faculté de Médecine et des Sciences de la Santé, Université de Sherbrooke, Sherbrooke, Québec, QC J1K 2R1, Canada
3
Departamento dos Solos, Universidade Federal de Santa Maria, Av. Roraima, 1000 Camobi, Santa Maria 97105-900, Brazil
*
Author to whom correspondence should be addressed.
Horticulturae 2021, 7(7), 191; https://doi.org/10.3390/horticulturae7070191
Submission received: 8 June 2021 / Revised: 7 July 2021 / Accepted: 9 July 2021 / Published: 13 July 2021

Abstract

:
High berry yield and quality of conventionally and organically grown cranberry stands require proper nutrient sources and dosage. Our objective was to model the response of cultivar “Stevens” to N, P, K, Mg, Cu, and B fertilization under conventional and organic farming systems. A 3-year trial was conducted on permanent plots at four production sites in Quebec, Canada. We analyzed yield predictors, marketable yield, and fruit quality in response to fertilization and soil properties. Cranberry responded primarily to nitrogen fertilization and, to a lesser extent, to potassium. Berry yield was closely related to the number of fruiting uprights (r = 0.92), berry counts per fruiting upright (r = 0.91), number of reproductive uprights (r = 0.83), and fruit set (r = 0.77). Nitrogen increased berry yield nonlinearly but decreased berry firmness, total anthocyanin content (TAcy), and total soluble solids content (°Brix) linearly, indicating a trade-off between berry yield and quality. Fertilizer dosage at a high-yield level ranged between 30 and 45 kg N ha−1 in both conventional and organic farming systems. Slow-release fertilizers delayed crop maturity and should thus be managed differently than ammonium sulfate. Berry weight increased with added K. Redundancy analysis showed a close correlation between marketable yield, berry quality indices, and soil tests, especially K and Ca, indicating the need for soil test calibration.

1. Introduction

Cranberry (Vaccinium macrocarpon Ait.) is grown in low-fertility acidic (pH 4.0 to 5.0) sandy or peaty soils located in low-lying landscape positions to facilitate water transfer [1]. Wisconsin, Quebec, and Massachusetts are the world’s largest cranberry producers [2]. Quebec is the world leader in organically grown cranberries. Berry yield and quality depend on site, fertilization, cultivar, maturity, harvest date, and temperature [3,4]. While the fertilization of conventional systems has been documented to some degree, information on the fertilization of organic systems is scanty.
Fruit set, number of uprights, relative abundance of reproductive uprights (% of total uprights), number of flowers per reproductive upright, and berry weight are useful yield predictors [5,6]. A cranberry plant typically produces one to three fruits per reproductive upright from two to seven flowers. Depending on the cultivar and weather, berries take 60 to 120 d or even more to reach maturity and deep coloring [7]. Berry firmness, size, soluble solids, and ascorbic acid and anthocyanin content are the most important traits for the industry [8,9,10]. Berry moisture before harvest is also crucial to reduce the economic loss in terms of yield, quality, and drying cost [11,12].
Fertilization timing, source, and dosage must be managed to balance berry yield and quality [13]. Nitrogen fertilization is the most effective means to stimulate cranberry growth but it may affect floral induction negatively [14]. Excessive N dosage can produce intraspecific competition among neighboring plants [15]. The N source, timing, and rate should thus be managed carefully [16,17,18]. If applied in excess, N decreases berry yield and quality [16,19] and increases the risk of overgrowth of vegetative parts [20]. Ammonium sulfate is the most common N fertilizer in cranberry production. Slow-release nitrogen fertilizers are other sources of N fertilizer that may delay berry maturity depending on the N release rate [21]. Decision on proper N dosage and sources involves a trade-off between berry yield and quality that must be addressed locally but has not yet been modeled under the climatic conditions of eastern Canada.
Soil tests have been little documented in cranberry production. Potassium and phosphorus showed variable effects on berry yield and quality [22]. Soil test P and P fertilization were found to be poorly correlated with crop yield [23,24]. The K dosage was found to depend on soil test K, cultivar, and site, hence requiring local calibration [4]. Tissue testing is the most frequent method to diagnose other elements [4,7,25,26].
On the other hand, redundancy analysis provides a means to explore the relationship between cranberry performance and soil tests. To run a multivariate analysis such as redundancy analysis (RDA), soil compositions should be log-ratio transformed to remove false correlations between components that resonate on each other within the constrained sample space of nutrient compositions [27,28].
We hypothesized that (1) berry yield parameters and berry quality are impacted by N, P, K, Mg, B, and Cu dosage and the N source in conventional and organic cranberry agroecosystems, and (2) cranberry performance indices are correlated with soil test. The first hypothesis was tested using a mixed model. The second hypothesis was addressed by RDA. Our objective was to support site-specific nutrient management decisions in cranberry agroecosystems.

2. Materials and Methods

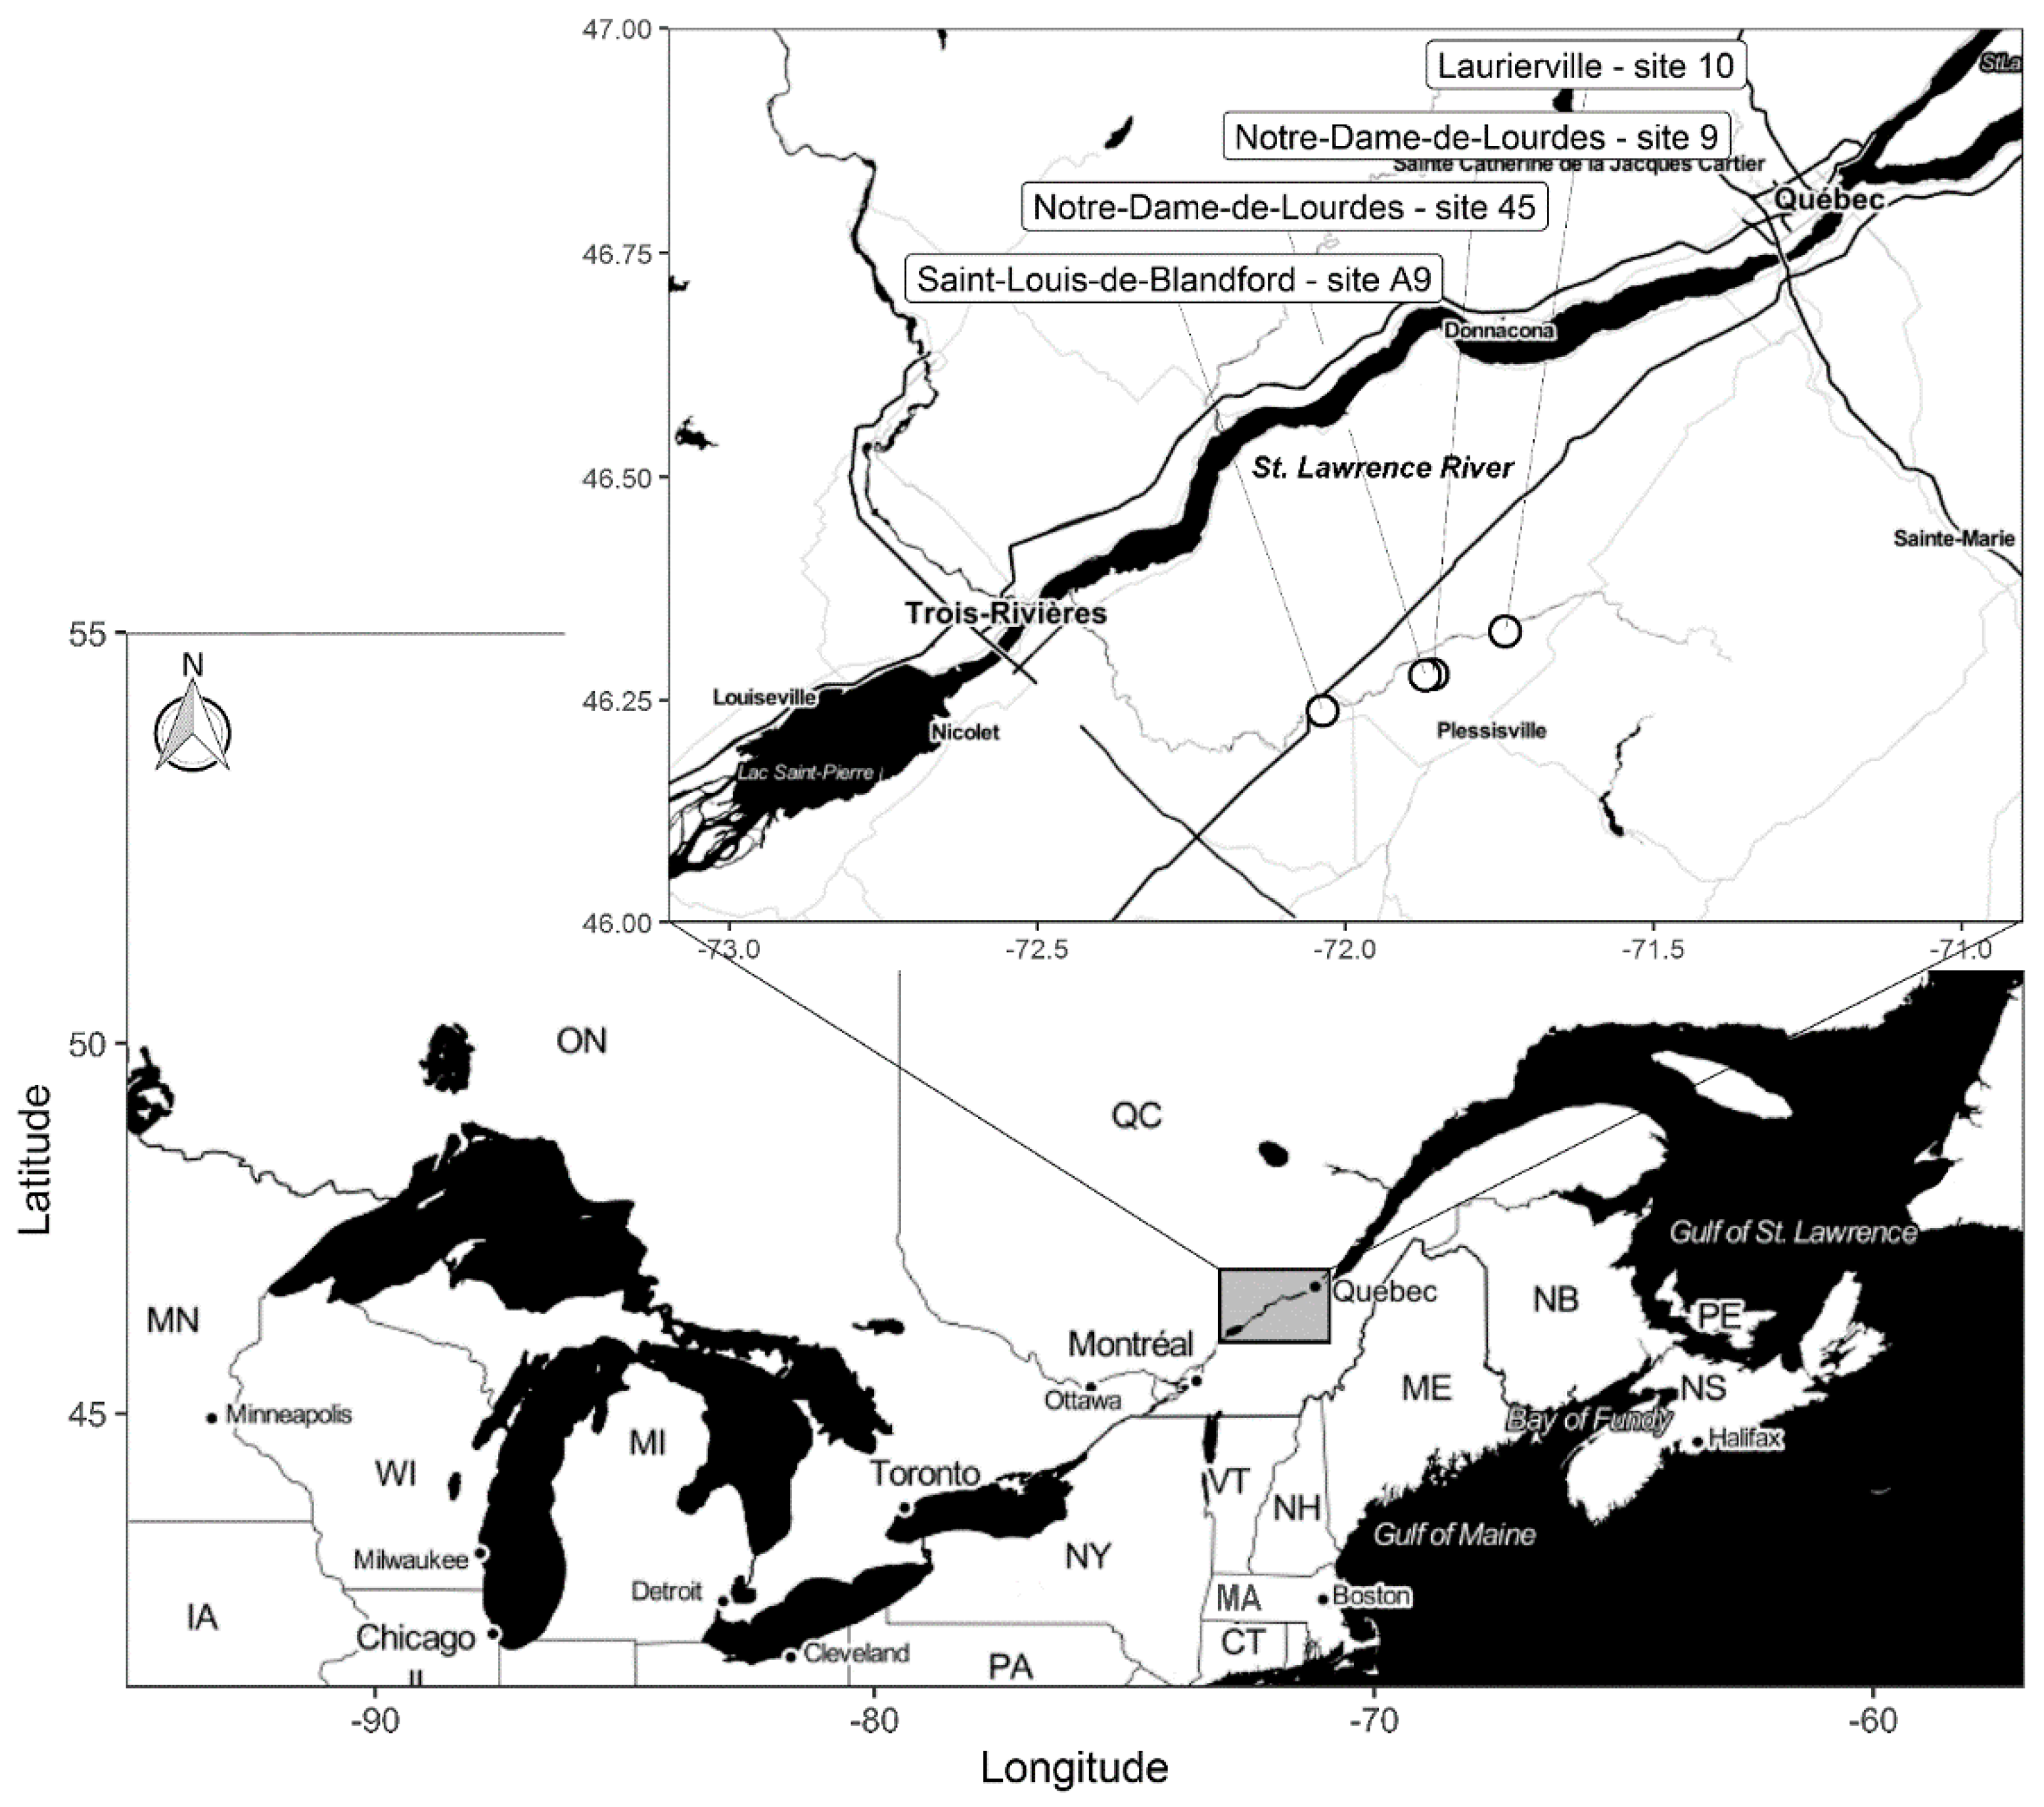
2.1. Experimental Site and Design

One hundred and forty-four permanent plots of cultivar ‘Stevens’ were delineated in four commercial fields in southern Quebec, Canada (Figure 1). ‘Stevens’ is characterized by high yield and moderate color development [29]. The stands established in 1995, 1999, 2004, and 2007 at sites 9, 45, A9, and 10, respectively, were monitored from the spring of 2014 to the fall of 2016. Site A9 was under organic farming. Others were under conventional farming. Meteorological data during the 2014 to 2016 period (Appendix A, Figure A1) were obtained from the closest weather stations of Environment Canada [30]. Cranberry stands were irrigated to maintain soil matric potential between −3 and −7 kPa [31].

2.2. Soil Analysis

Soil samples (0 to 15 cm) were collected in each plot before fertilization in June 2014 and every year thereafter. Samples were air-dried and sieved to less than 2 mm. Grain-size distribution was determined by sedimentation [32] and sand composition by hand-sieving. Grain-size distribution is presented in Table 1. Minerals were extracted using the Mehlich III method [33] and quantified by ICP-OES (inductively coupled plasma optical emission spectrometry). The C and N contents were quantified by combustion (Leco CNS-2000 analyzer, St. Joseph, MI, USA). Soil pH was reported as pHcacl2. Results of soil analyses at the onset of the experiment are presented in Table 1.

2.3. Fertilization

The experiment comprised 18 treatments (Appendix A, Table A1) arranged as randomized block designs and replicated twice at each site, for a total of eight observations per treatment per year. Plot size was 12 m2 (4 by 3 m). Fertilizer treatments are presented in Table 2. The transition to organic farming at site A9 started in 2015. The N treatments (0, 15, 30, 45, or 60 kg N ha−1) comprised ammonium sulfate (21% N) or sulfur-coated urea (SCU = 24% N, 5% P2O5, 11% K2O) on conventional sites and certified fish emulsions (6% N, 1% P2O5, 1% K2O) or amino acids of plant origin (8% N) on the organic site (Table 2). The K doses (0, 40, 80, or 120 kg K ha−1) were applied as potassium sulfate (50% K) or sulfate of potassium and magnesium (18% K and 9% Mg). Phosphorus was supplied as triple superphosphate (46% P2O5) on the conventional sites or as bone meal (13% P2O5) on the organic site. Two Mg doses (0 or 12 kg Mg ha−1), two Cu doses (0 or 2 kg Cu ha−1), and two B doses (0 or 1 kg B ha−1) were applied as Epsom salt (9% Mg), copper sulfate (25% Cu), and sodium borate (20% B), respectively.
Where one element was varied, other elements were applied at rates of 45 kg N ha−1, 15 kg P ha−1, 80 kg K ha−1, 12 kg Mg ha−1, 2 kg Cu ha−1, and 1 kg B ha−1. Fertilizers were applied uniformly by hand during the growing season. The N fertilizer was applied within a 3- to 4-week window that coincides with fruit set and initial bud formation [34]. From early June to mid-June, B, Cu, and Mg fertilizer were applied during bud break and bud elongation. Thereafter, NPK were applied at four occasions as follows: 15% at early flowering (29 June to 2 July), 35% at 50% flowering (8 to 11 July), 35% at 50% fruit set (16 to 19 July), and 15% 1 to 2 weeks after the third application.

2.4. Plant Measurements

Yield parameters used as yield predictors were flower counts, number of reproductive uprights, number of flowers per reproductive upright, berry counts, number of fruiting uprights, berry counts per fruiting upright, and fruit set (ratio of berry counts to flower counts). The counts of flowers and reproductive uprights were measured in 2014 and 2015 at the end of June on four representative areas totaling 0.37 m2 per plot while fruits and fruiting uprights were counted in mid-August. Berries were hand-harvested in four areas totaling 0.37 m2 in each plot, one to two weeks before starting the planned flooding operation at the beginning of October, to avoid too early flooding. Berries were counted and weighed to derive average berry weight (g) and marketable yield (Mg ha−1).

2.5. Berry Quality

Fruit quality followed commercial criteria of the USDA shipping point and market inspection instructions for fresh cranberries (USDA, 2007). One kilogram of randomly selected berries was weighed to determine berry quality after discarding unmarketable fruits. Berry quality was determined as moisture content, total soluble solid concentration (Brix), total anthocyanin concentration, acidity, and firmness [10].
Berries were frozen at −10 °C and analyzed for moisture content, TAcy [35], and °Brix (refractometry) for soluble solids at the Ocean Spray quality department in Warren, Wisconsin. As berries were harvested before commercial harvesting, average TAcy indices [24] could be lower than market requirements of 350 to 450 mg kg−1 for bonus payments reachable at harvest. Berry firmness was quantified using the TA.TX2 Texture Analyzer (Texture Technologies Inc., Scarsdale, NY, USA) [36]. Fifty berries per treatment were refrigerated overnight then maintained at room temperature for 1 to 2 h before performing the test. Pre-test speed was 1 mm s−1, test speed was 2 mm s−1, post-test speed was 10 mm s−1, and trigger force was 0.1 N. Firmness was reported in N mm −1 as the mean and standard deviation of 50 samples.

2.6. Statistical Analysis

Statistical analyses were conducted in the R statistical environment version 4.0.5 [37]. We used the R meta-package tidyverse version 1.3.0 [38] for generic data analysis, weathercan [39] for historical weather data, and ggmap [40] for spatial visualization. There were 13 dependent variables including seven yield predictors, as follows: flower counts, number of reproductive uprights, number of flowers per reproductive upright, berry counts, number of fruiting uprights, berry counts per fruiting upright, and fruit set. Other dependent variables were quality indices (TAcy, Brix, firmness, and berry moisture), marketable yield, and berry weight. The experimental setup was analyzed as a mixed model with treatments as fixed factors and years, sites, and replications as random factors [41]. Ammonium sulfate (21-0-0) was set as the reference fertilizer treatment to run the nlme model. Outliers were removed by Z-score test [42] if they exceeded 5 times the standard deviation (5.85% of total observations).
Tests of significance (p = 0.05) were used to reject the null hypothesis, but not to accept it as true [43]. Non-significant results did not mean that there was no difference between groups or there were no treatment effects [44]. For each primary outcome, we computed 95% compatibility intervals [44].
There were twelve soil properties and six cranberry performance indicators. The dataset of matrix Y (cranberry yield and quality indices) and explanatory matrix X (pH, N, P, K, Mg, Cu, Ca, Zn, Mn, Fe, Al, and C) was explored by redundancy analysis (RDA) to analyze the impact of “explanatory variables” on “response variables”. The R packages to run RDA were the vegan version 2.5-7 [45] for RDA, R meta-package for ordination, and compositions for clr transformations to avoid spurious correlations. A permutation procedure was performed (anova.cca function in vegan package) [45] to test the significance of RDA models. Soil test nutrient concentrations were transformed into centered log-ratios [46] before conducting RDA due to Euclidean geometry. The centered log-ratios (clr) were computed as follows [27,28]:
c l r ( x i ) = l n ( x i g ( x i ) )
where x i is the i t h nutrient soil concentration and g ( x i ) is the geometric mean. The clr transformation allows for computing Euclidean distances between any two compositions [29]. Redundancy analysis (RDA) related matrix Y (cranberry performance) to explanatory matrix X (soil test) based on Euclidean distance between observations [47,48]. Indeed, due to closure to the bounded measurement unit, compositional data should be log-ratio transformed before running linear univariate or multivariate statistical analyses [49].

3. Results

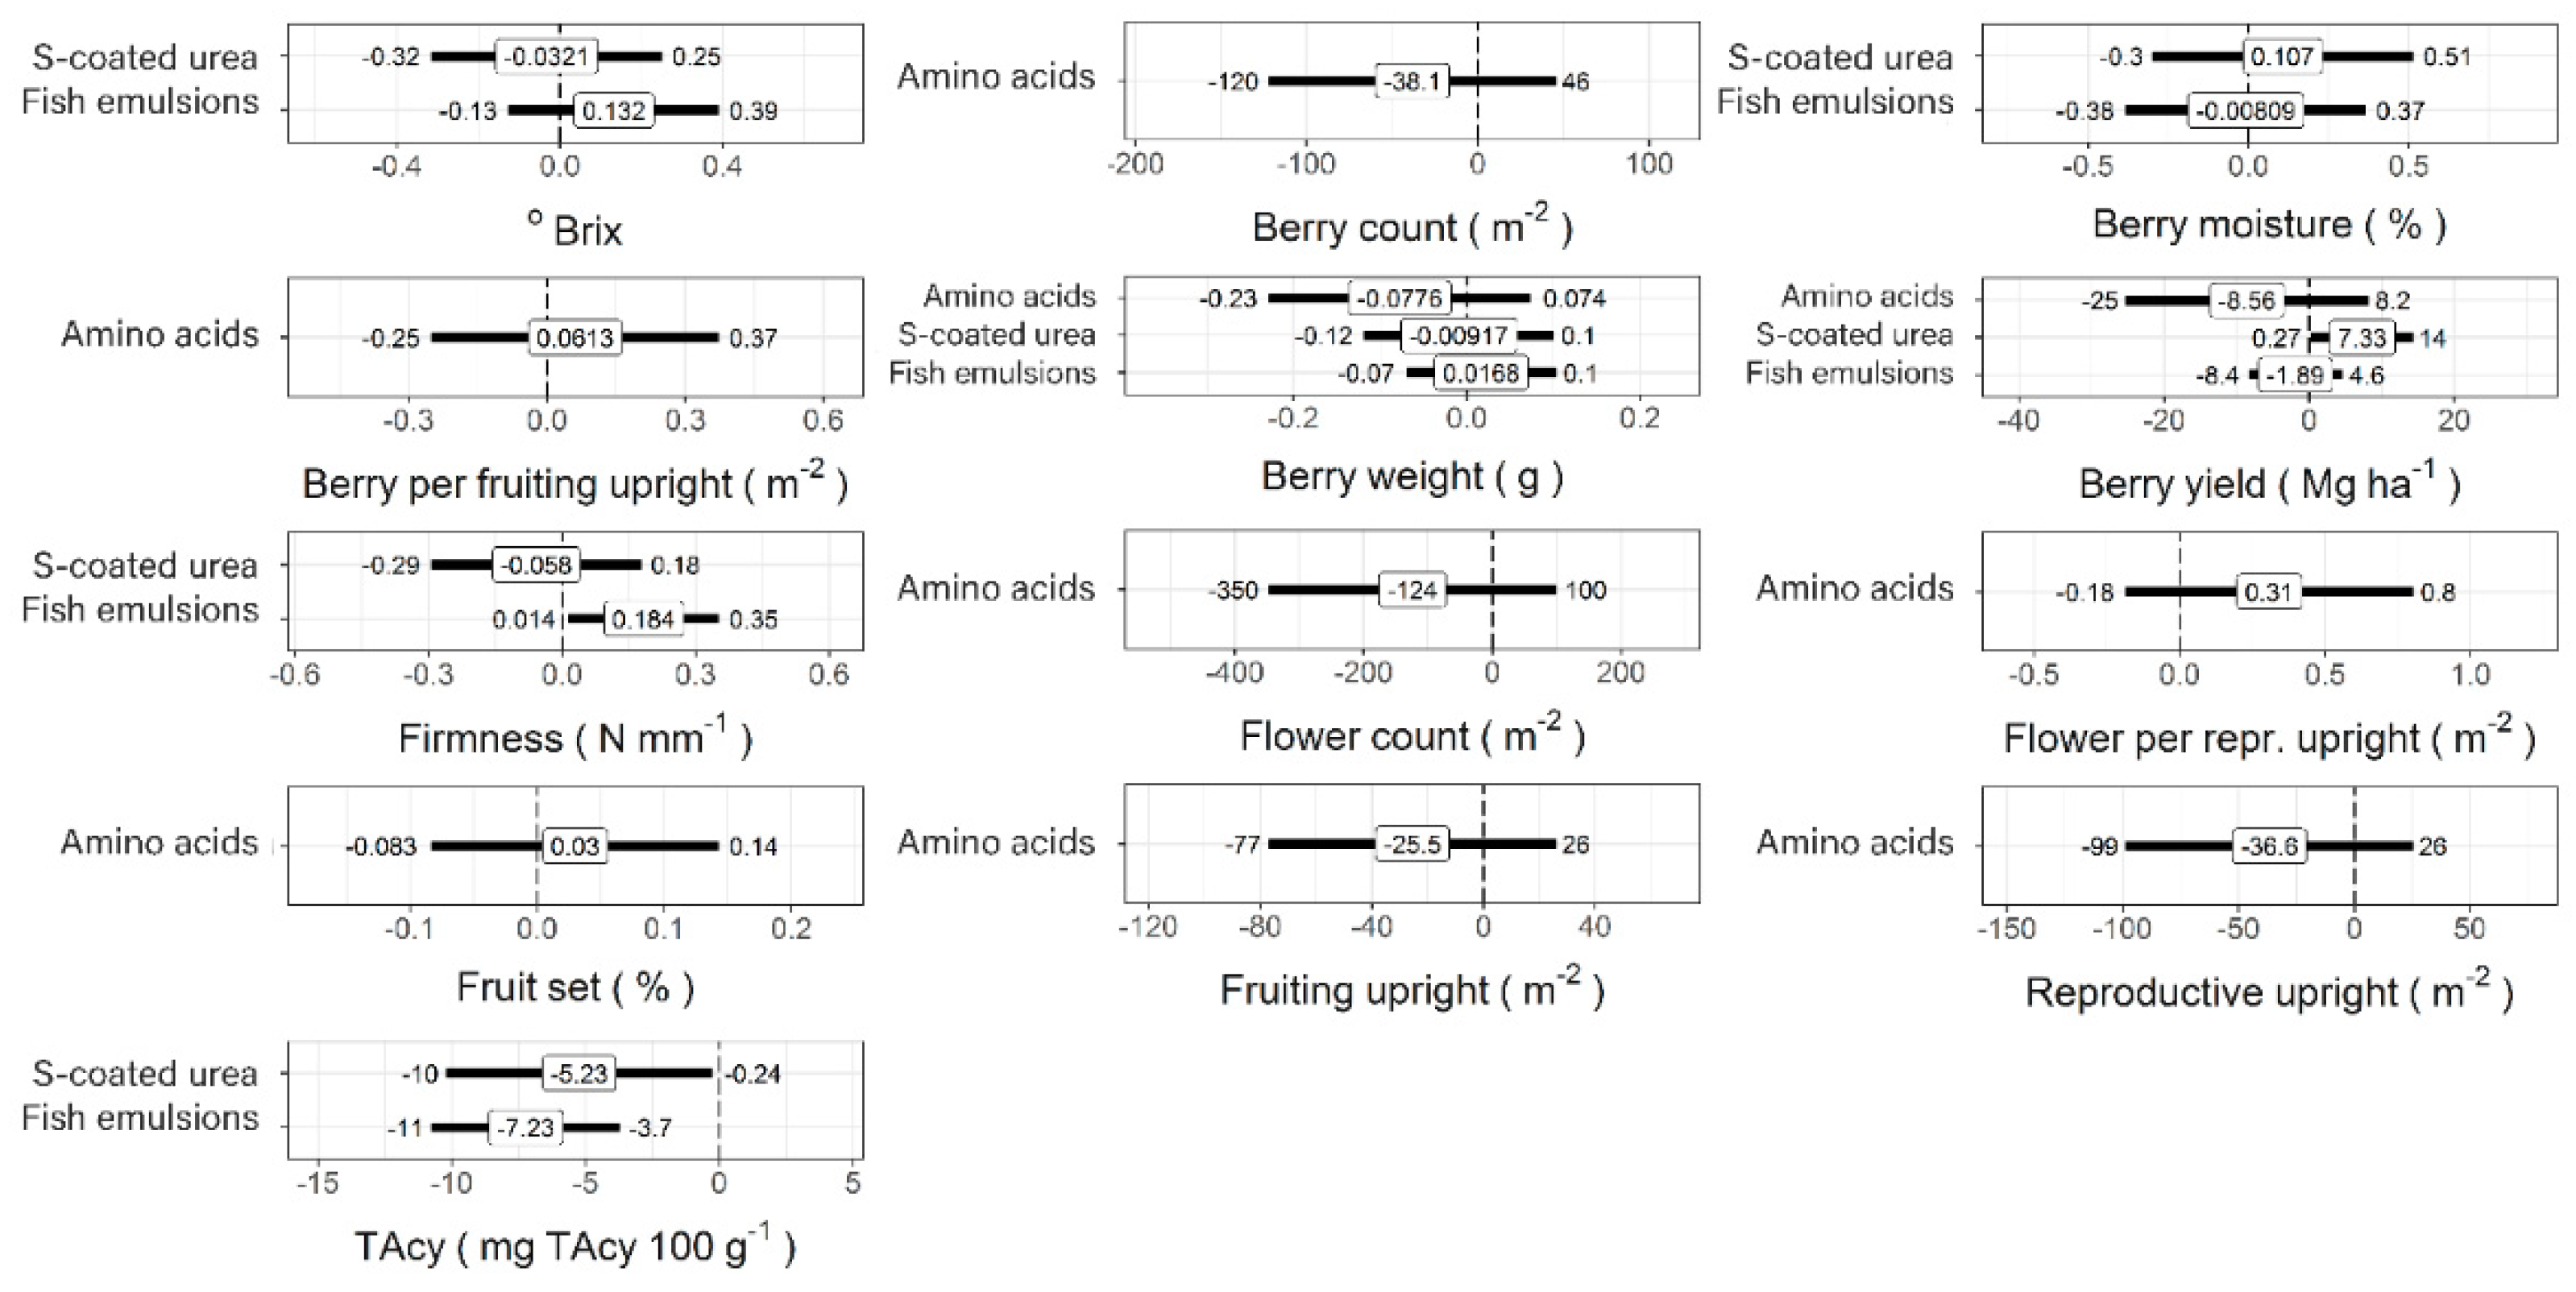
3.1. Effect of Nitrogen Source on Berry Yield and Quality

Berry quality was impacted significantly (p < 0.05) by N sources (Figure 2). The effects of SCU and fish emulsions differed compared to ammonium sulfate depending on the variable tested. Berry counts, flower counts, number of fruiting and reproductive uprights, and percentage of fruit set tended to decrease adding amino acids (8-0-0). Organic fertilizers (6-1-1 and 8-0-0) had similar effects on berry yield (p > 0.05). Fish emulsions and SCU decreased TAcy by four to six units while fish emulsions increased firmness by 11%, indicating delayed maturity. Compared to ammonium sulfate, SCU increased berry yield by 13% (p < 0.05) but reduced TAcy (p < 0.05). TAcy responded differently than firmness and °Brix to fish emulsions. Overall, average anthocyanin content decreased (7.23 mg TAcy 100 g−1) significantly with the organic fertilizer (6-1-1). The °Brix and berry moisture showed no significant differences between nitrogen sources.

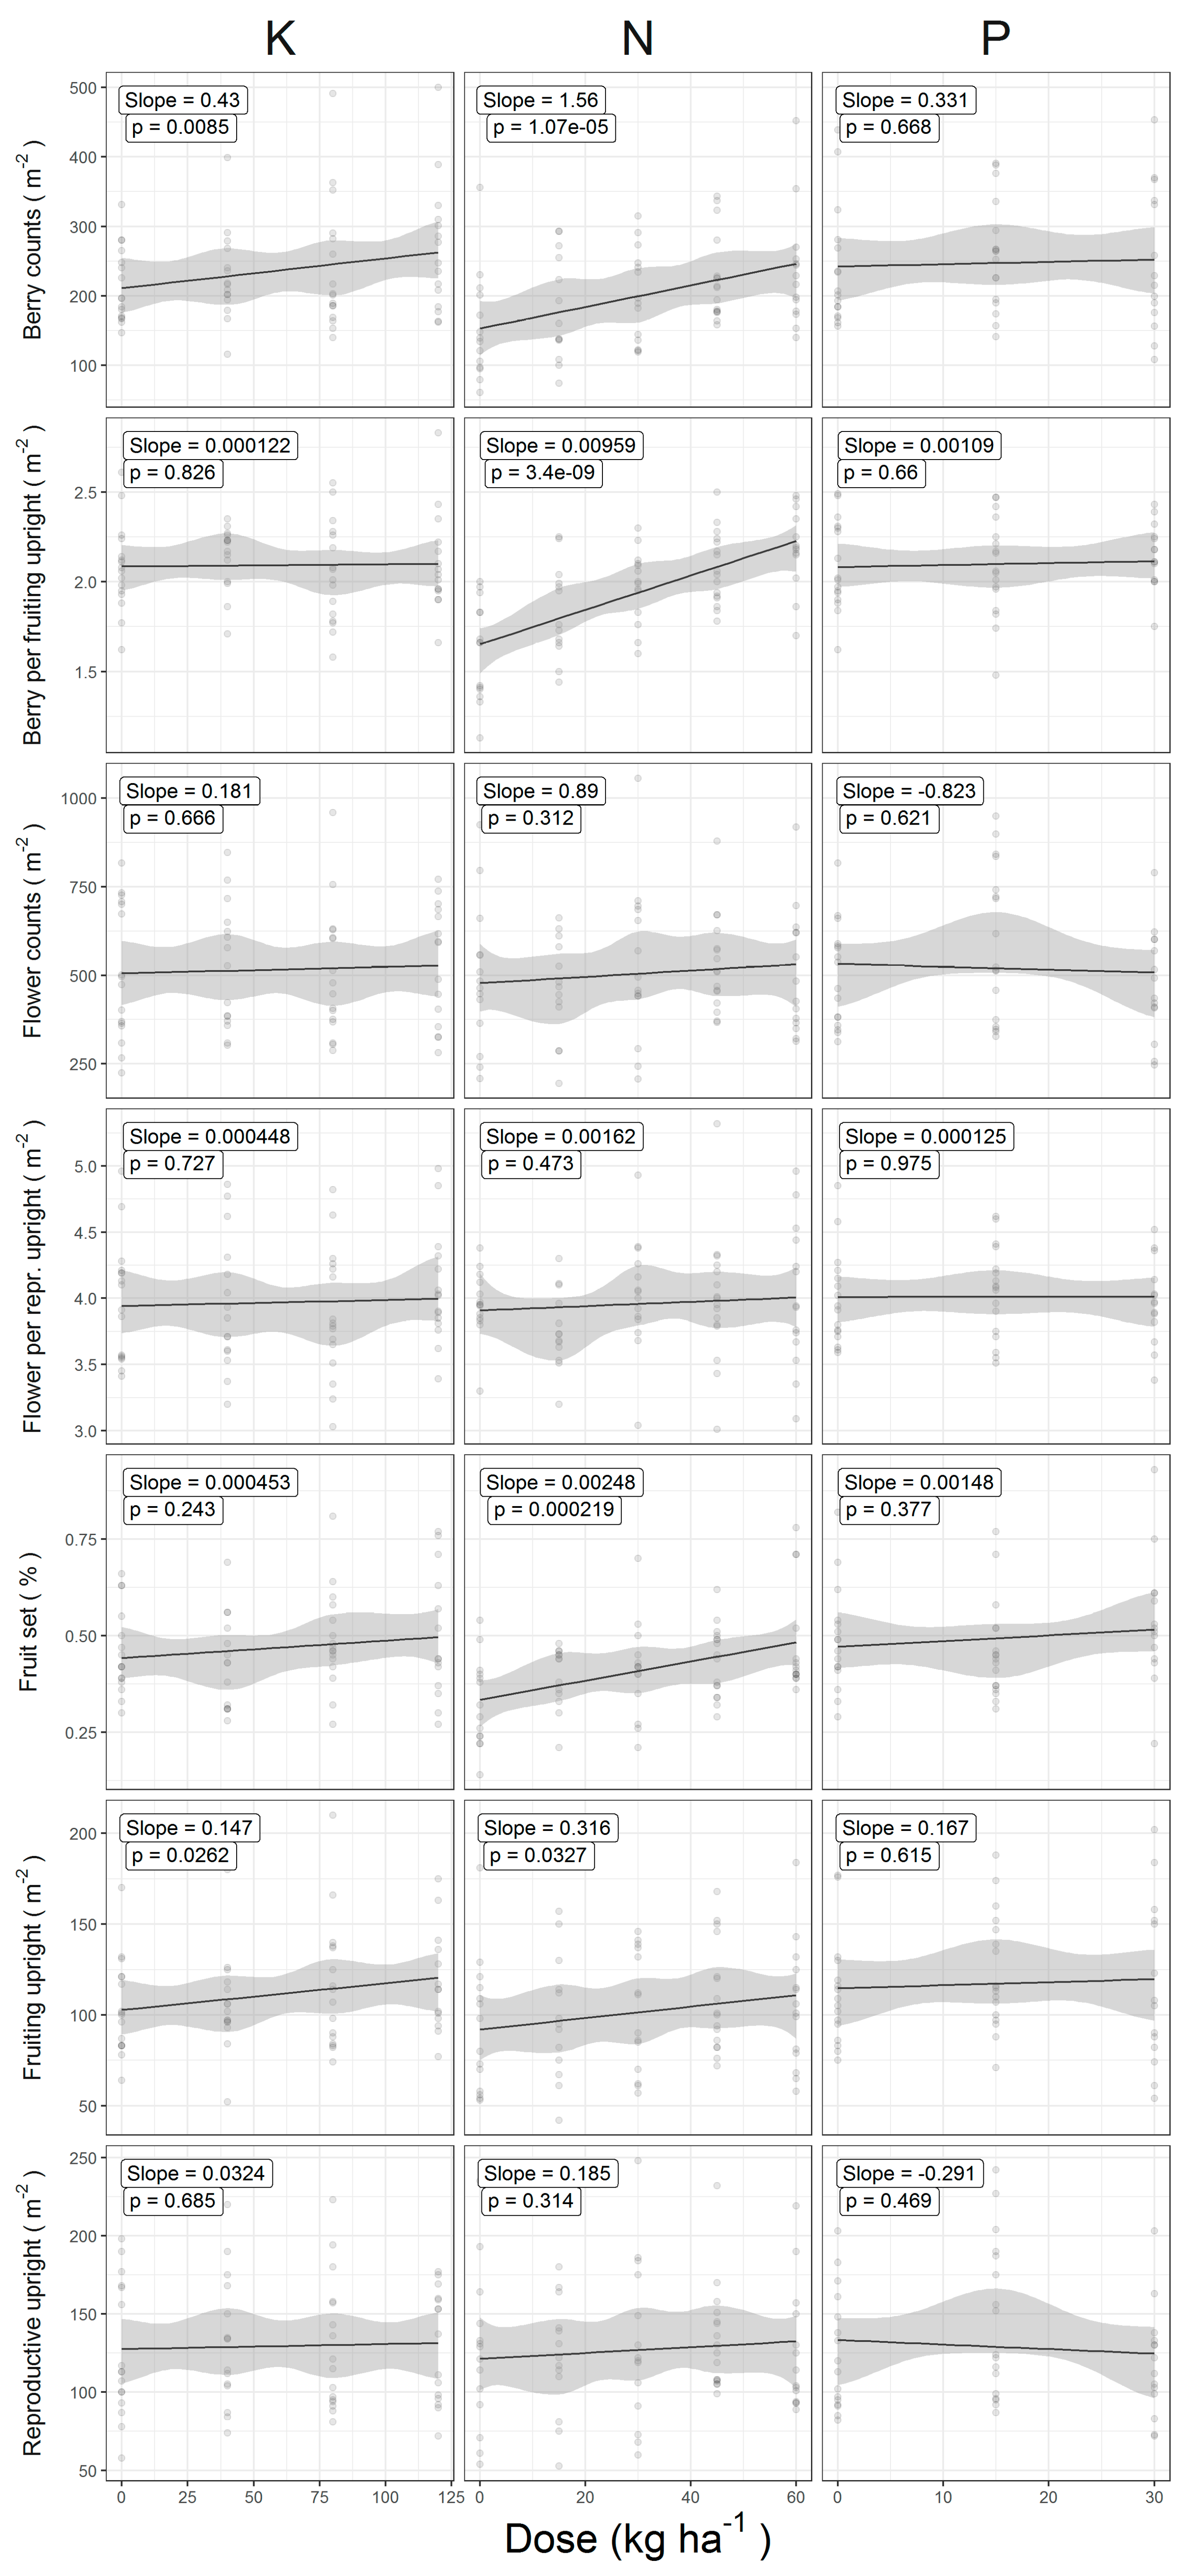
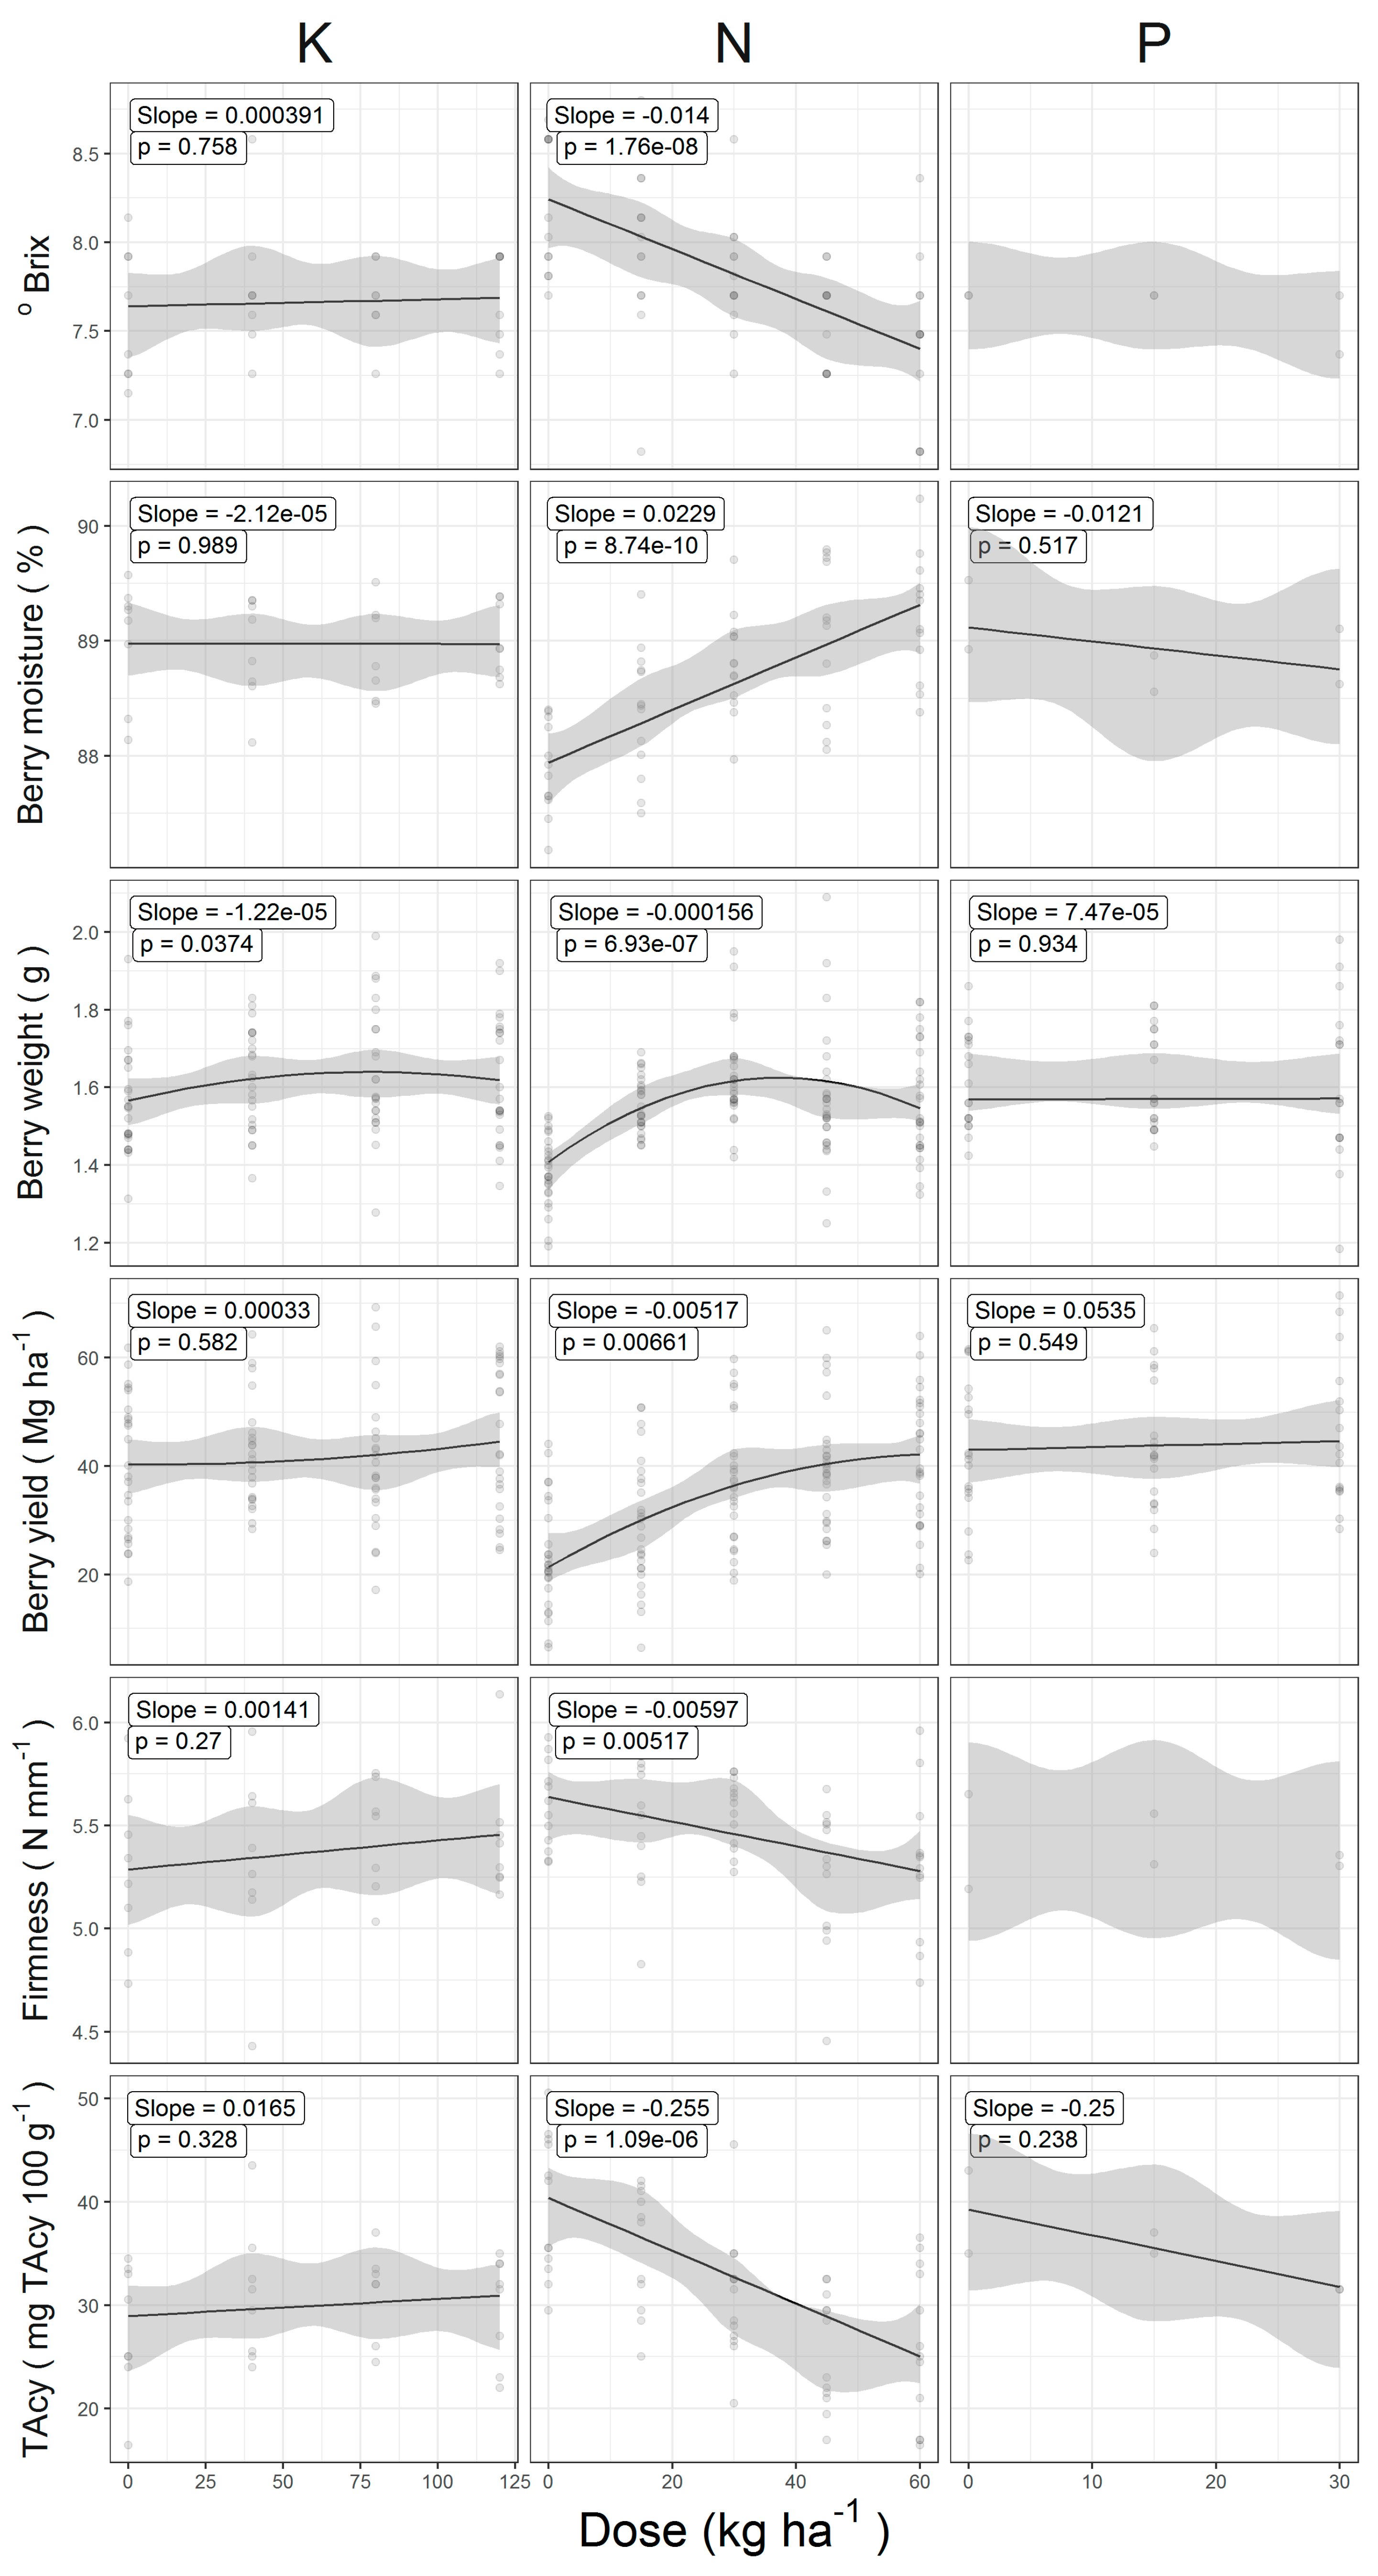
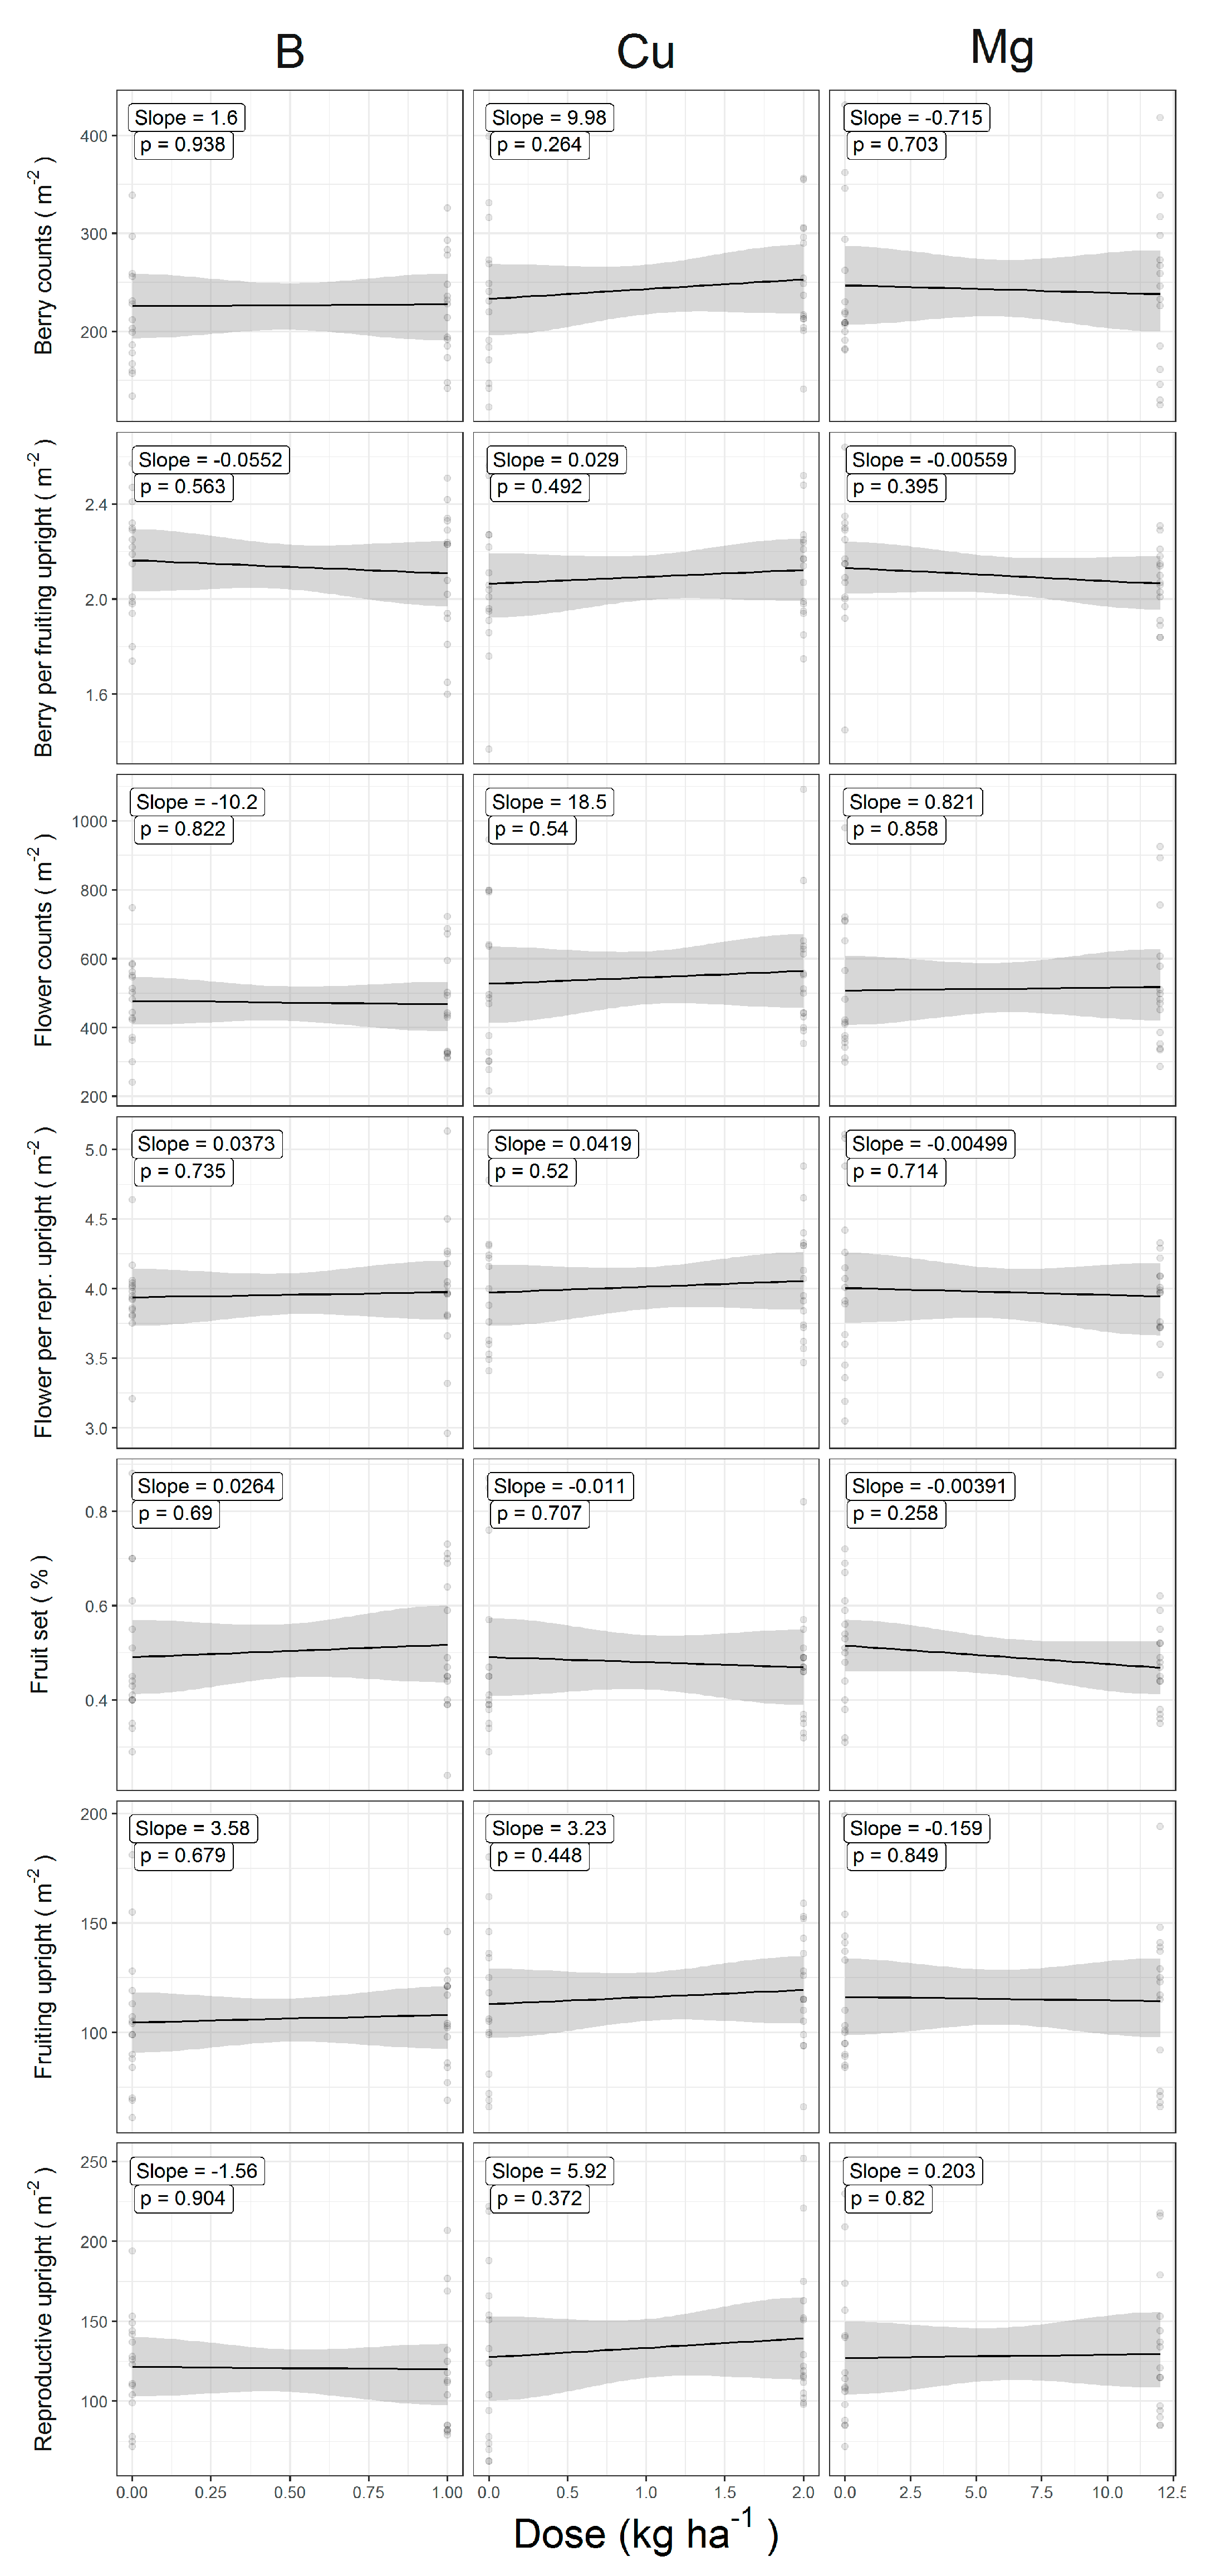
3.2. Effect of N, P, and K Regimes on Yield Parameters and Fruit Quality

The N and K fertilization impacted significantly berry yield and quality while the effect of P fertilization was not significant (Figure 3 and Figure 4). The effects of Mg, B, and Cu regimes were also not significant (Appendix A, Figure A2 and Figure A3). Berry yield responded non-linearly to N fertilization (p < 0.05) and tended to plateau between 30 and 60 kg N ha−1. The highest yield of 33 Mg ha−1 was reached at 45 kg N ha−1 under organic farming. The highest yield average of 48 Mg ha−1 was reached at 30 to 45 N ha−1 under conventional farming.
Fruit set increased linearly between 0 and 60 kg N ha−1 and between 0 and 120 kg K ha−1 (Figure 3). Likewise, counts of fruiting uprights increased linearly from 95 to 123 by adding N and K. Berry count per fruiting upright increased from 205 to 257 with K additions between 0 and 120 kg K ha−1. Berry weight was highest with 30 to 45 kg N ha−1 and 40 to 120 kg K ha−1. There was no significant yield response (p > 0.05) to added K in 2015, where the maximum yield was 36 Mg ha−1, but there was a significant response (p < 0.05) in 2014 and 2016 where yields reached 54 and 44 Mg ha−1, respectively. Hence, yield response to K fertilization was apparently related to yield level.
There were 3.9 flowers per reproductive upright, 2.1 berries per fruiting upright, and 48% of fruit set at N application rate of 45 kg N ha−1. Each kg of N per ha increased berry moisture by 0.023% unit in the range of 0 to 60 kg N ha−1 (Figure 4). Cranberry responded negatively to added N for °Brix, TAcy, firmness, and positively for the percentage of berry moisture (Figure 4). There was a non-linear response to added N for berry weight and berry yield. The K positively impacted °Brix, TAcy, and firmness, increasing gently between 0 and 120 kg K ha−1. Response to added P was not significant. Response to Mg, B, and Cu regimes was also not significant (Appendix A, Figure A2 and Figure A3).

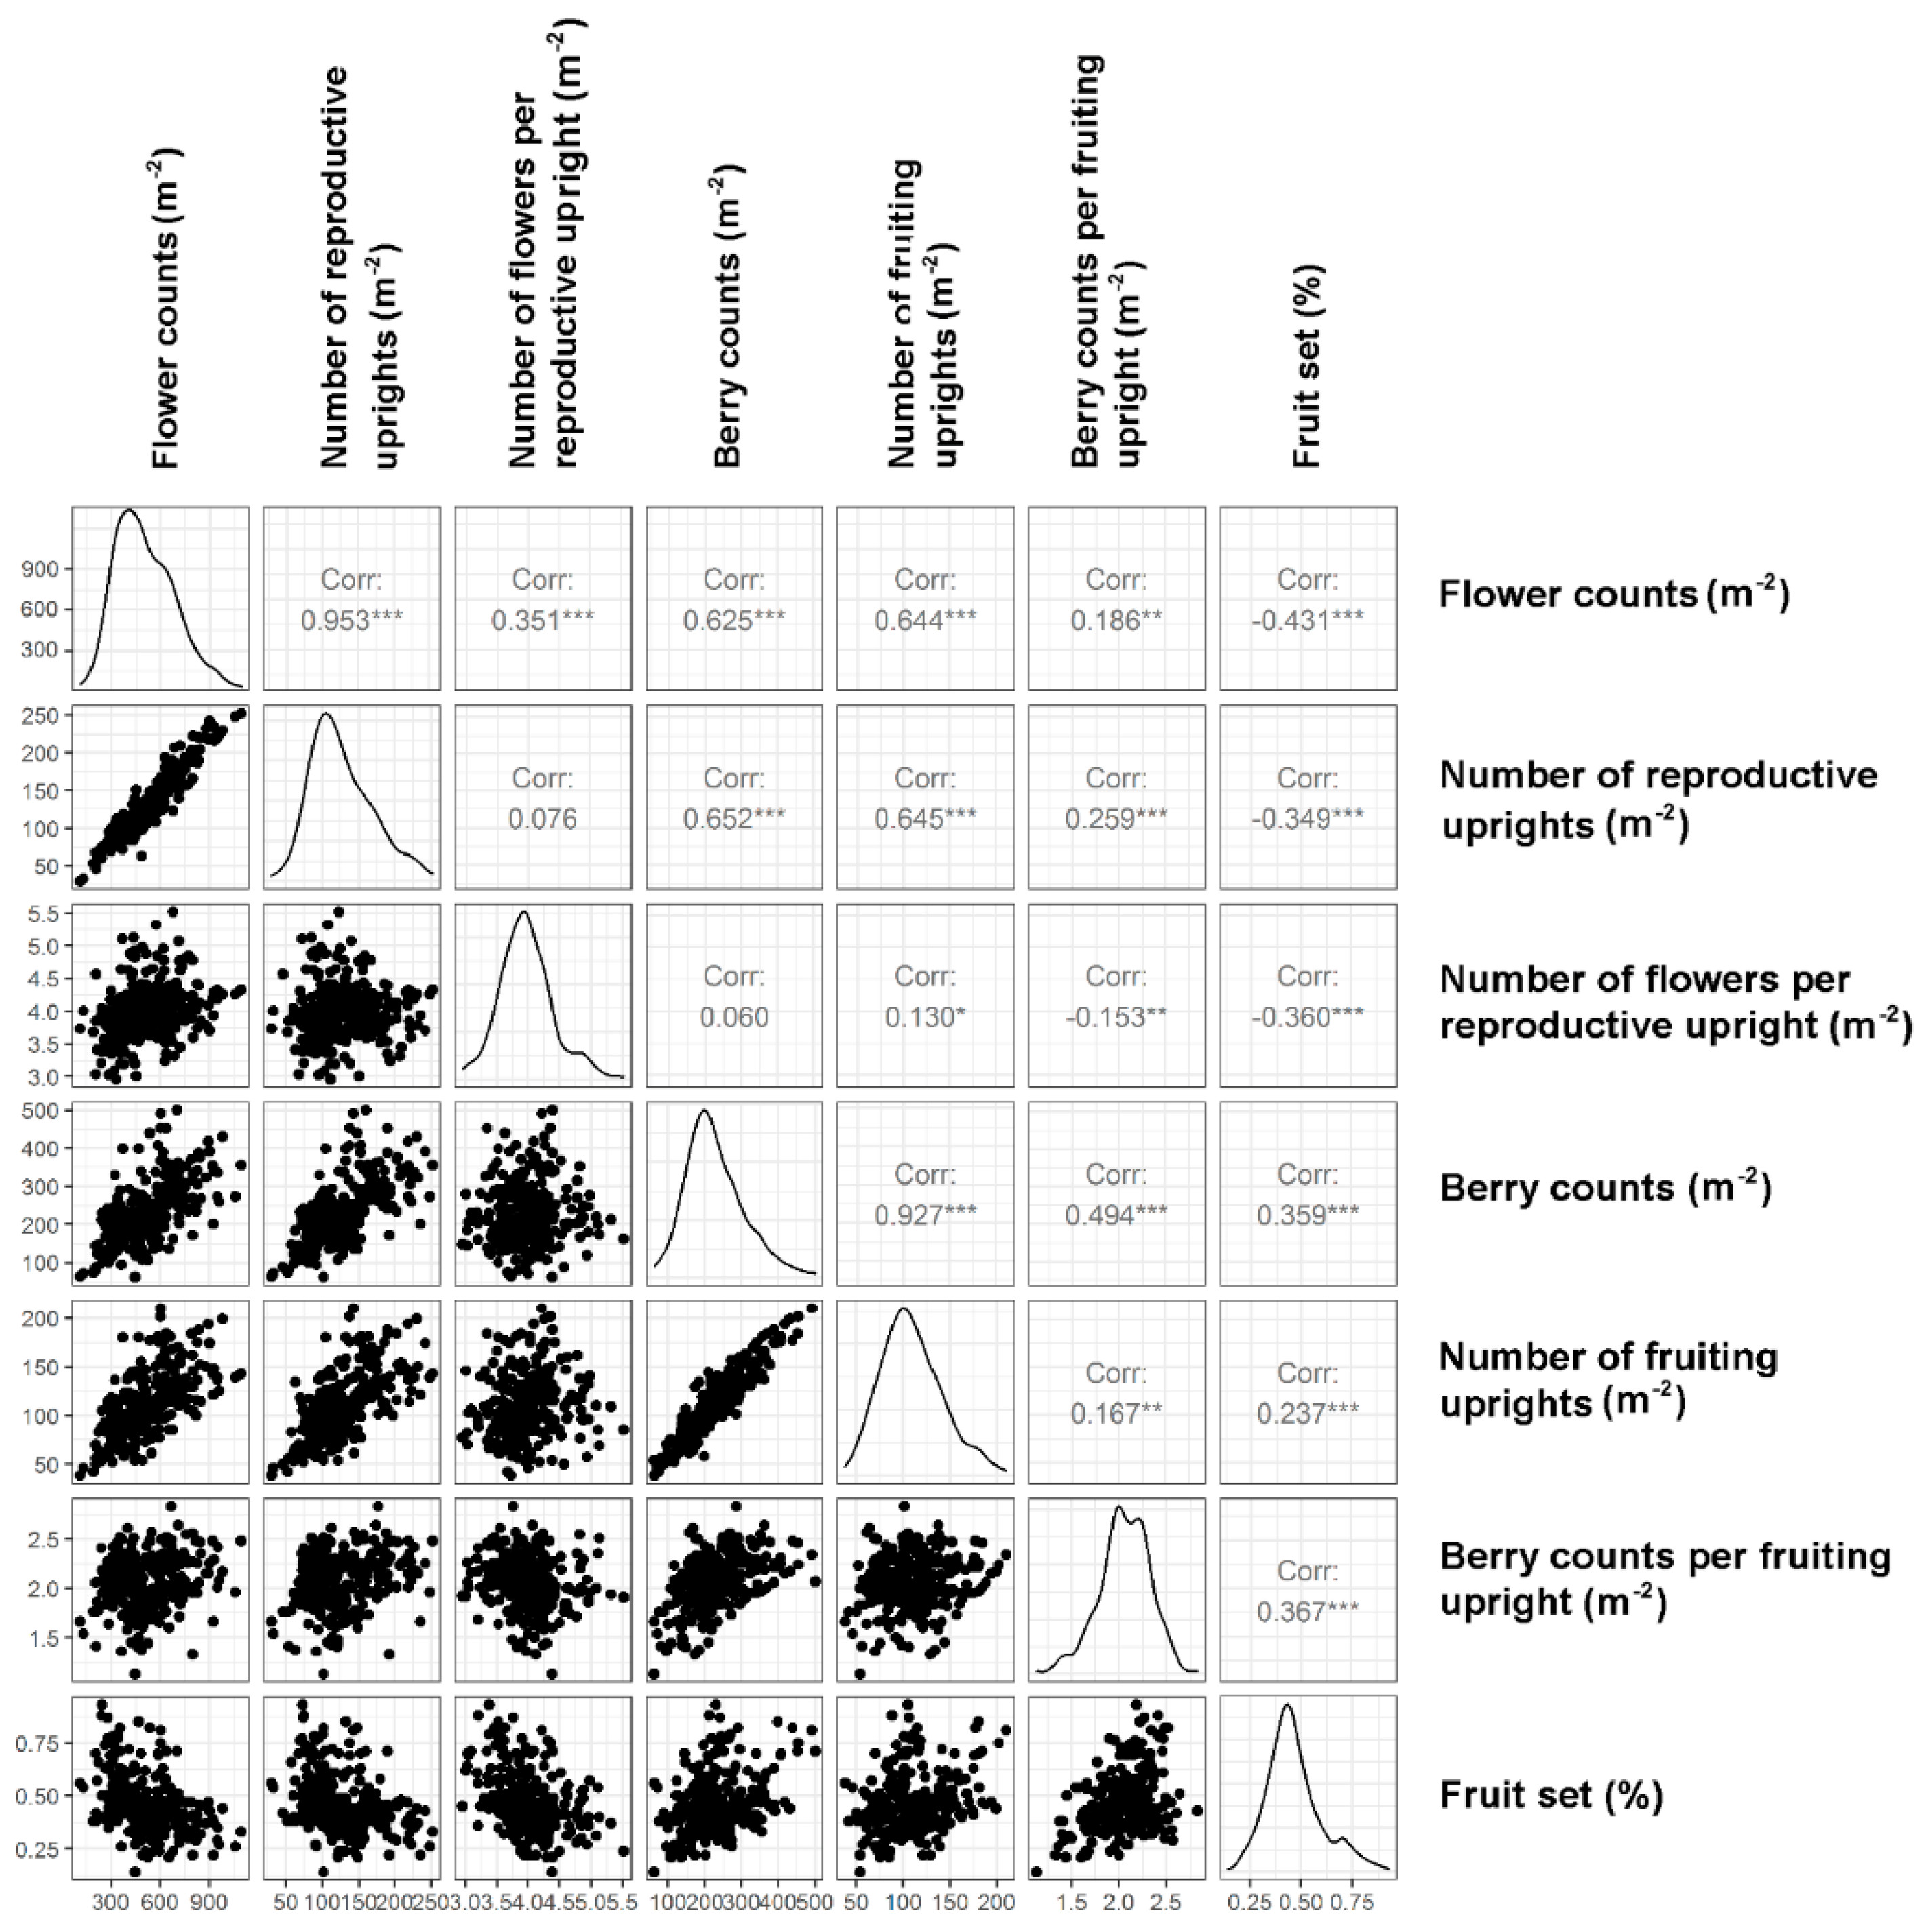
3.3. Correlations among Berry Yield and Quality Parameters

Relationships among yield parameters are presented in Figure 5. There were close correlations between the number of reproductive uprights, flower counts, number of fruiting uprights, and berry counts (Figure 5). Flower counts and the number of reproductive uprights (r = 0.95), as well as berry counts and number of fruiting uprights (r = 0.93) were closely related with marketable yield. Fruit set showed moderate correlation (r = 0.77) with berry counts and flower counts. Fruit set fluctuated between 33% to 59% in 2014 and 36% to 41% in 2015. The relationship between fruit set and berry yield was thus inconsistent across years.

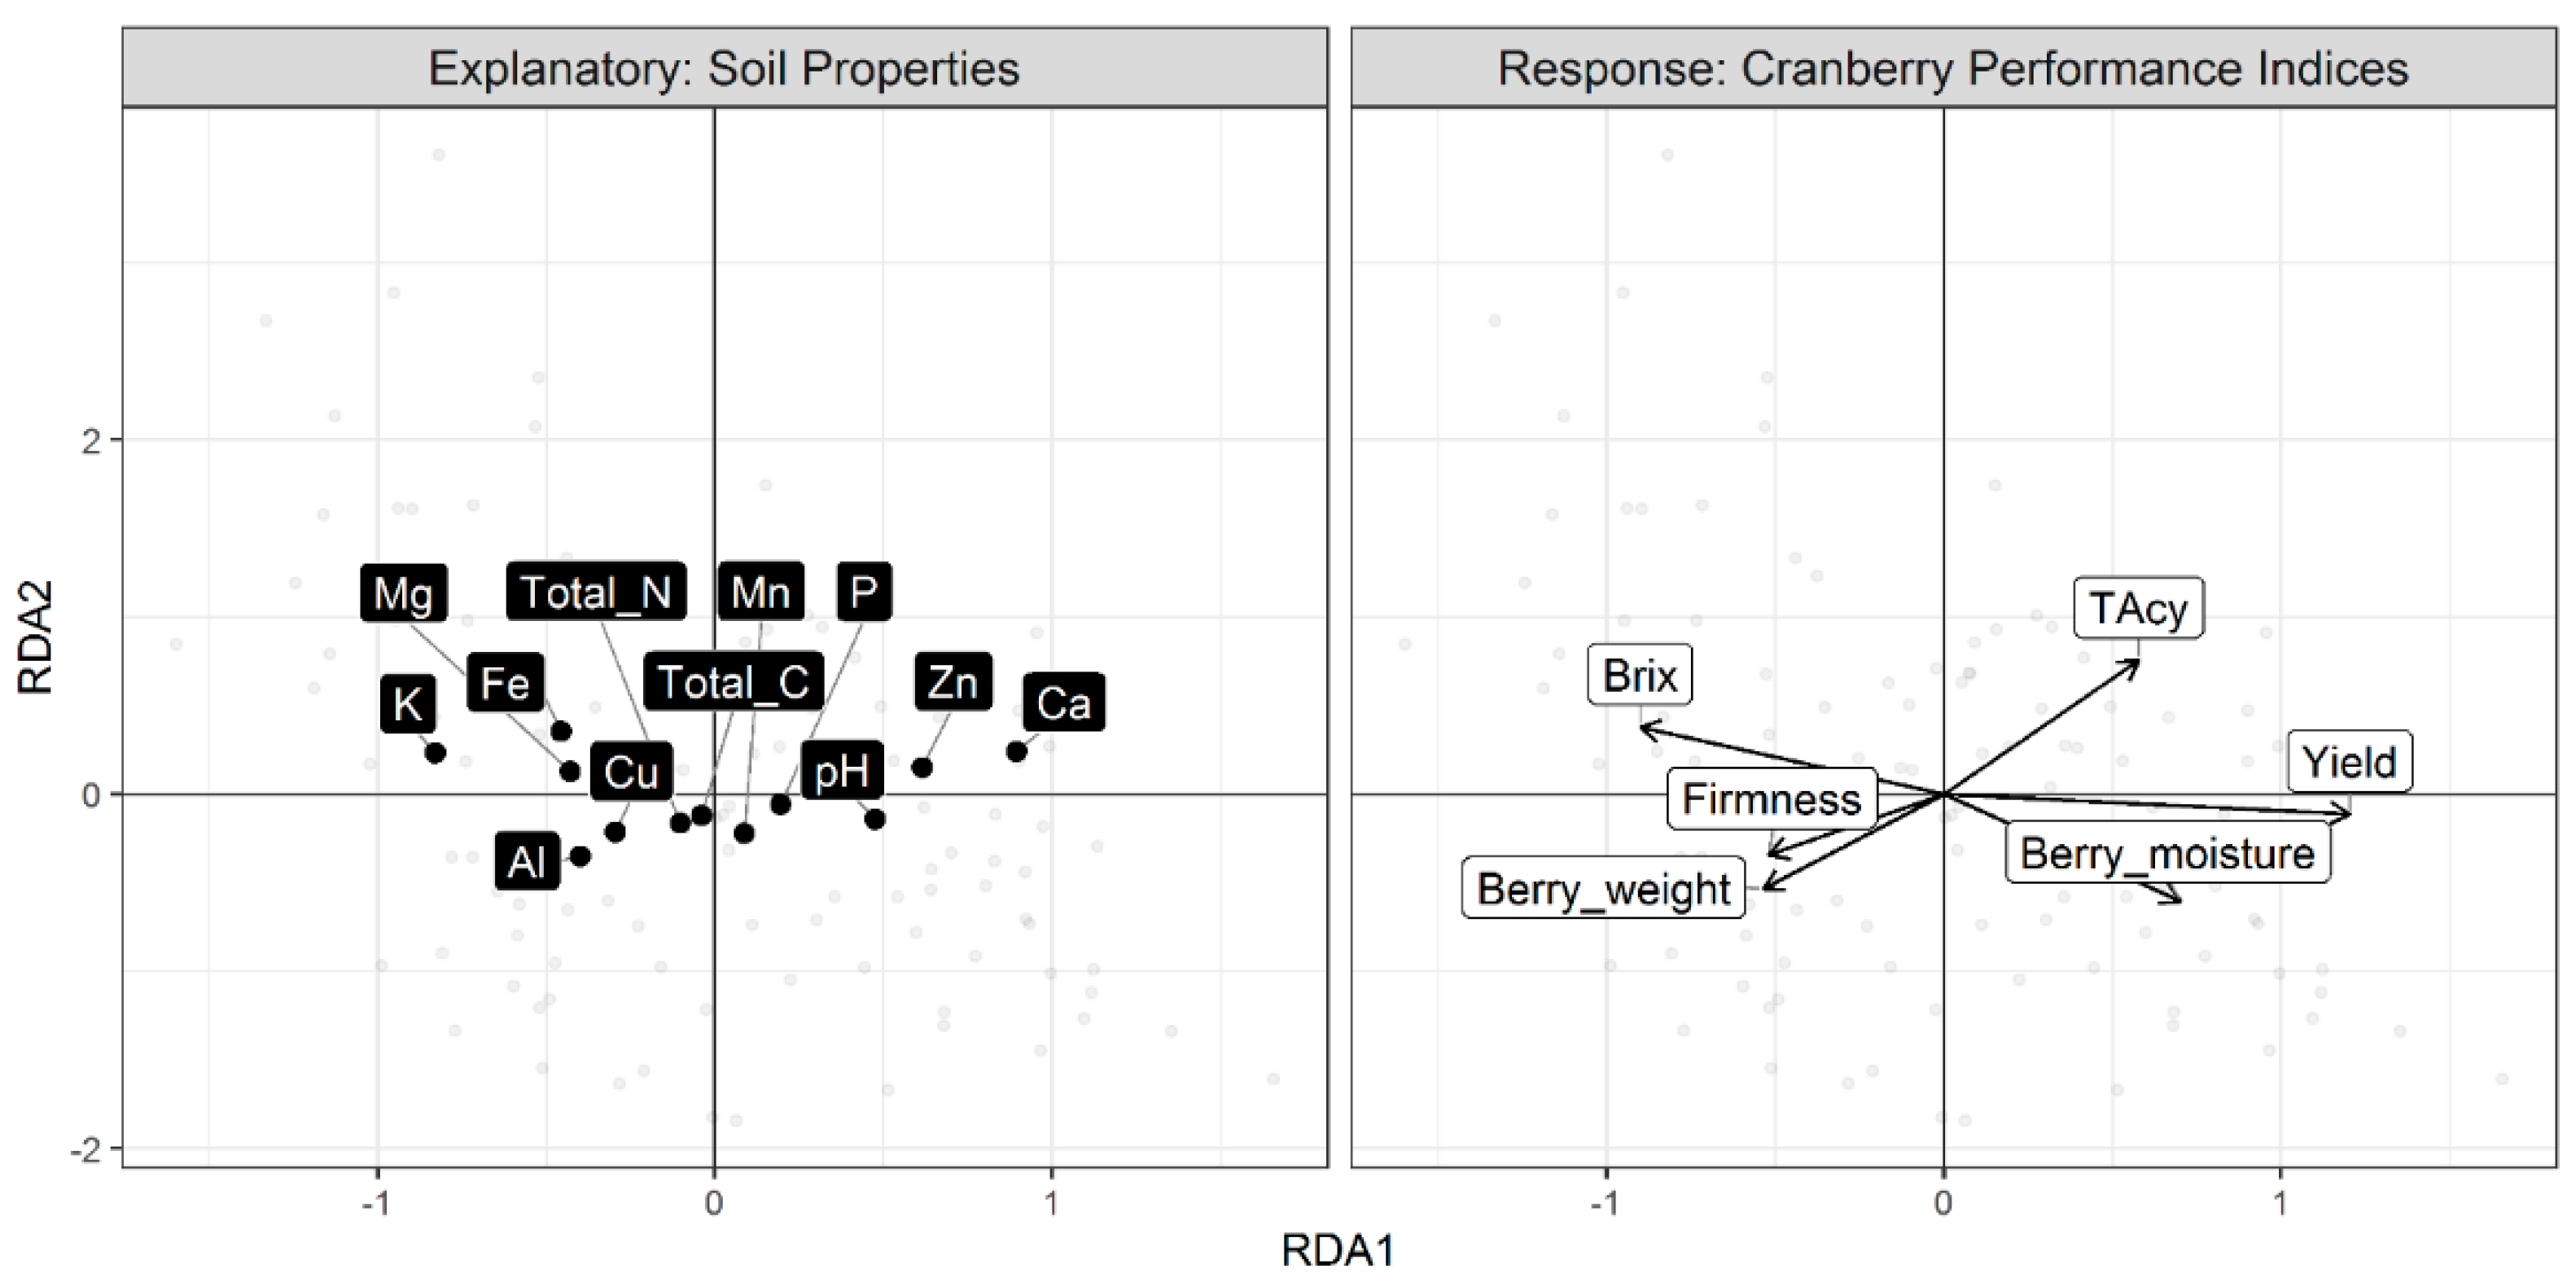
3.4. Redundancy Analysis

Relationships between soil test and cranberry performance are illustrated in Figure 6. The first RDA axis was significant (RDA1: F = 19.44, p = 0.001), and explained 85.9% of the total variation. The anova.cca ranking was Ca (F = 11.98, p < 0.001), K (F = 3.92, p < 0.05), Fe (F = 2.57, p < 0.05), and pHCaCl2 (0.01 M CaCl2) (F = 4.53, p < 0.05). Soil pHCaCl2 was the most important soil factor affecting cranberry performance. The optimum pHCaCl2 was 4.14 ± 1.66. Among soil nutrient tests, Ca ranked first, explaining 56.3% of the cumulative variance. The second key factor was K with 18.4% of the cumulative variance, followed by Fe, and Mg. The K and Ca were negatively related.
Berry yield and quality indices were related to soil tests. Arrows in RDA illustrated the complex relationships between them (Figure 6). Berry weight was related negatively to TAcy. The °Brix was negatively related to berry moisture. Berry moisture was positively related to pH. There was a positive relationship between soil test Ca and TAcy. Soil test K, Fe, and Mg were related positively to °Brix. Berry yield was negatively related to soil test K, Fe, and Mg. Berry weight was related negatively to soil test Ca and Zn. Yield and berry moisture were located in the lower right quadrant, and were positively related to pH. Berry firmness and weight were closely related to each other. The Ca and TAcy located in the upper right quadrants were positively related. In contrast with K fertilization applied as potassium sulfate (Appendix A, Table A1), soil test K was positively related to °Brix but negatively related to berry yield.

4. Discussion

4.1. Impact of Fertilization on Berry Quality

Fruit quality characteristics are of prime importance in cranberry breeding programs [29]. Fruit quality depends on genetics, management, and the environment [50,51]. Berry quality traits comprise anthocyanin content (color), fruit texture characteristics (crispness, hardness, juiciness, and mealiness), fruit anatomy (skin, flesh, or air pocket), and fruit external appearance (size and shape) [52]. Cultivar ‘Stevens’ showed the smallest average berry size (1.51 cm) among commercial cultivars [8]. Stevens [53] first suggested that factors such as temperature and rainfall could impact fruit keeping quality through fungal infection and disturbed fruit physiology.
The N and K fertilization regimes can also influence cranberry production. Increased N dosage resulted in a linear decrease in °Brix, firmness, and TAcy, and increased moisture content. In general, a high N dosage was found to reduce TAcy [4,54], firmness, [55] and °Brix [29]. In contrast, Davenport [56] found no significant effect on TAcy by applying up to 44 kg N ha−1. As anthocyanins are located primarily in the fruit epidermal layers [57], TAcy decreases as fruit size increases [58]. While TAcy increased [59], fruit firmness was found to decrease as the fruit ripened [10]. Bourne [60] found that similar to cranberry, apple firmness decreased with N additions. In contrast with previous research showing a linear response of hybrid cultivars [61], we found a quadratic relationship between added N and berry weight of ‘Stevens’. Cranberry quality indices showed a small but significant response trend adding 80 to 120 kg K ha−1. Crop response to added K was found to be related to yield level in eastern Canada, which was not necessarily the case across cultivars and sites in North America [19,56].

4.2. Impact of Fertilization on Yield Parameters

The numbers of flowers per reproductive upright and number of berries per fruiting upright were within the range of published values [7,62]. As the number of reproductive uprights and flower counts m−2 are related to fruit yield, they provided performance indices a few months before harvest [63]. Berry count m−2 was found to be the yield parameter most closely related to berry yield. Fruit set is also an important indicator of yield variation [5,64] as related to sunlight [65], pollination [64], and yield [66], but the relationship between carbohydrate concentration, fruit set, and yield can be inconsistent [64]. Carbon allocation between reproductive and vegetative parts [67] depends on temperature [63,68] and is affected by excessive rainfall or drought [69].
Marketable yields were higher by 10% to 25% under the conventional vs. organic systems as reported elsewhere [70,71]. In both conventional and organic farming systems, the effect of N dosage on yield plateaued between 30 and 60 kg N ha−1, within the 20 to 65 kg N ha−1 range reported in Davenport [56] and the 39 to 56 kg N ha−1 range reported in DeMoranville and Ghantous [21]. While ‘Stevens’ yield was found to plateau at 20 Mg ha−1 after adding 22 to 44 kg N ha−1 [56], ‘Stevens’ yields up to 40 Mg ha−1 decreased and stolon weight increased where N dosage exceeded 34 kg N ha−1 [20]. The N dosage is site-specific. A too high N dosage (60 kg N ha−1) lead to plant crowding [15,50] and overgrowth of the vegetative parts [72].
Slow-release N fertilizers such as SCU in conventional cranberry production and certified fish emulsions in organic production should be managed differently than ammonium sulfate. Berry firmness increased by applying an organic source likely due to delay in berry maturity. Anthocyanin content tended to decrease where ammonium sulfate was replaced by organic nitrogen or SCU as also reported in [18]. Compared to ammonium sulfate, SCU and fish emulsions should be applied earlier in the season to sustain N release during the whole season and avoid delaying berry maturity and the reddening finish close to harvest time.

4.3. Ranking of Soil Test Variables

Soil test calibration has been little addressed in cranberry production except for P [23,24]. As first shown by Bray [73,74], soil tests for nutrients showing low mobility in the soil as well as nutrient source and placement must show different coefficients of efficiency. Crop response to fertilization dosage and soil test value are generally addressed separately then assembled into a modified Mitscherlich equation. In this paper, we addressed crop response to added nutrients separately using a mixed model and soil test using RDA.
As shown by RDA, soil test K appeared to be the most discriminant nutrient for cranberry performance, followed by Ca, Fe, and Mg. Soil test K is often low in cranberry soils because K is easily leached at soil pH values less than 5.5 [75], and cation-exchange capacity is low in sandy soils [76]. Soil K can also be supplied as non-exchangeable K by primary and secondary soil minerals such as feldspar, mica, and illite, which are common in soils of eastern Canada [77,78,79]. Mica K is released much faster compared to phlogopite, biotite, and muscovite [80]. The reactivity of soil minerals also depends on the grain-size distribution, pH [81], and rhizosphere exploration of the soil [82]. Owing to the low clay and high sand contents in cranberry soils, soil minerals are assumed to contribute little to cranberry K requirements. It is thus difficult to maintain high soil test K values in acidic cranberry sandy soils. Low soil test K results in low berry yield [19,22], requiring fertilization.
The K fertilization should meet annual K requirements, at a rate that avoids affecting the uptake of other cations. Added K may trigger Ca leaching and reduce Ca uptake [17,22,26]. Since tissue K increases with K dosage or soil test K level while tissue Mg might decline [4,17], the tissue K–Mg interaction should also be monitored [83]. The RDA supported calibrating soil tests to provide minimum critical soil test values to sustain the cranberry production on sandy soils. Nevertheless, our results supported the present K recommendation of 54 to 92 kg K ha−1 at a low soil test K [84]. The minimum soil test K value to be maintained in cranberry soils should be addressed in future research.
The RDA indicated that soil pH played a key role in cranberry nutrient management [18,85]. High levels of Ca in cranberry soils can reduce the absorption of Mn, Fe, and Zn, potentially reducing berry yield and size [83]. To address nutritional balance in cranberry crops and predict cranberry yield and nutrient requirements, tissue testing is complementary to soil testing [86].

5. Conclusions

This paper quantified the trade-off between berry yield and quality as driven primarily by N fertilization. Berry count per fruiting upright, fruit set, and berry weight responded consistently to N treatments. Berry yield could be predicted most accurately from berry counts per fruiting upright. Nitrogen fertilization increased berry yield nonlinearly and decreased berry quality indices linearly. The SCU and fish emulsions delayed berry maturity and should thus be managed differently than ammonium sulfate through earlier applications to account for the slow-release patterns.
Cranberry responded moderately to K where yield potential was high. As shown by RDA, cranberry performance was related to soil pH and soil test nutrients. The K and Ca were negatively correlated between them, indicating an upper limit for K additions. The RDA indicated close relationships between cranberry performance indices and soil properties, and thus supported the need for further soil test calibration.

Author Contributions

Conceptualization, R.J., S.-É.P. and L.E.P.; data curation, R.J., S.-É.P. and L.E.P.; formal analysis, R.J., S.-É.P. and L.E.P.; funding acquisition, S.-É.P. and L.E.P.; methodology, R.J., S.-É.P. and L.E.P.; project administration, S.-É.P.; Software: R.J. and S.-É.P.; supervision, S.-É.P. and L.E.P.; validation, R.J., S.-É.P. and L.E.P.; writing—original draft preparation, R.J., S.-É.P. and L.E.P.; writing—review and editing, R.J., S.-É.P. and L.E.P. All authors have read and agreed with the published version of the manuscript.

Funding

This collaborative research project was supported by Les Atocas de l’Érable Inc., Les Atocas Blandford Inc., La Cannebergière Inc., the Natural Sciences and Engineering Research Council of Canada (RDCPJ-469358-14).

Informed Consent Statement

Not applicable.

Conflicts of Interest

The authors declare no conflict of interest.

Appendix A

Figure A1. Monthly mean air temperature and total precipitation at the four experimental sites in Quebec, Canada.
Horticulturae 07 00191 g0a1
Table A1. Fertilizer regimes applied during the 3-year experimental period.
Cropping
Systems
201420152016
NConventionalAmmonium sulfate
(21-0-0)
Ammonium sulfate
(21-0-0)
Ammonium sulfate
(21-0-0)
Sulfur coated urea
(24-5-11)
OrganicAmino acids
(8-0-0)
Fish emulsions
(6-1-1)
PConventionalTriple superphosphate
(0-46-0)
Triple superphosphate
(0-46-0)
Triple superphosphate (0-46-0)
OrganicBone meal
(0-13-0)
Bone meal
(0-13-0)
KConventionalPotassium sulfate
(0-0-50)
Potassium sulfate
(0-0-50)
Potassium sulfate
(0-0-50)
Organic
MgConventionalEpsom salt (9% Mg)
Sulfate of potassium and magnesium
(0-0-22)
Epsom salt (9% Mg)
Sulfate of potassium and
magnesium
(0-0-22)
Epsom salt (9% Mg)
Sulfate of potassium and
magnesium
(0-0-22)
Organic
CuConventionalCopper sulfate
(25% Cu)
Copper sulfate
(25% Cu)
Copper sulfate
(25% Cu)
Organic
BConventionalSolubor
(20% B)
Solubor
(20% B)
Solubor
(20% B)
Organic
Figure A2. Response of cranberry yield components to added B, Cu, and Mg. The solid line represents the model fit with the slope and intercept of the line; the shaded area represents the 95% confidence interval.
Horticulturae 07 00191 g0a2
Figure A3. Response of berry yield, weight, and quality indices to added B, Cu, and Mg. The solid line represents the model fit with the slope and intercept of the line; the shaded area represents the 95% confidence interval.
Horticulturae 07 00191 g0a3

References

  1. Sandler, H.A.; DeMoranville, C.J. Cranberry production: A guide for Massachusetts—Summary edition. In Cranberry Production Guide; Station, C., Ed.; University of Massachusetts: Wareham, MA, USA, 2008; Volume 5, p. 37. [Google Scholar]
  2. APCQ. Association des Producteurs de Canneberges du Québec (Quebec Cranberry Growers Association). Available online: http://www.notrecanneberge.com/Content/Page/Stats (accessed on 1 May 2021).
  3. Vorsa, N.; Polashock, J.; Cunningham, D.; Roderick, R. Genetic inferences and breeding implications from analysis of cranberry germplasm anthocyanin profiles. J. Am. Soc. Hortic. Sci. 2003, 128, 691–697. [Google Scholar] [CrossRef] [Green Version]
  4. Hart, J.M.; Strik, B.C.; DeMoranville, C.; Davenport, J.R.; Roper, T. Cranberries: A nutrient management guide for south coastal Oregon. In OSU Extension Catalog; Service, E., Ed.; Oregon State University: Corvallis, OR, USA, 2015; p. 52. [Google Scholar]
  5. Baumann, T.E.; Eaton, G.W. Competition among berries on the cranberry upright. J. Am. Soc. Hortic. Sci. 1986, 111, 869–872. [Google Scholar]
  6. Eaton, G.W. Floral induction and biennial bearing in the cranberry. Fruit Var. J. 1978, 32, 58–60. [Google Scholar]
  7. Dana, M.N. Cranberry Management; Prentice-Hall: Englewood Cliffs, NJ, USA, 1990; pp. 334–362. [Google Scholar]
  8. Diaz-Garcia, L.; Rodriguez-Bonilla, L.; Phillips, M.; Lopez-Hernandez, A.; Grygleski, E.; Atucha, A.; Zalapa, J. Comprehensive analysis of the internal structure and firmness in American cranberry (Vaccinium macrocarpon Ait.) fruit. PLoS ONE 2019, 14, e0222451. [Google Scholar] [CrossRef] [PubMed] [Green Version]
  9. Berezina, E.V.; Brilkina, A.A.; Veselov, A.P. Content of phenolic compounds, ascorbic acid, and photosynthetic pigments in Vaccinium macrocarpon Ait. dependent on seasonal plant development stages and age (the example of introduction in Russia). Sci. Hortic. 2017, 218, 139–146. [Google Scholar] [CrossRef]
  10. Forney, C.F.; Kalt, W.; Jordan, M.A.; Vinqvist-Tymchuk, M.R.; Fillmore, S.A.E. Blueberry and cranberry fruit composition during development. J. Berry Res. 2012, 2, 169–177. [Google Scholar] [CrossRef] [Green Version]
  11. Rennie, T.J.; Mercer, D.G. Effect of blanching on convective drying and osmotic dehydration of cranberries. Trans. ASABE 2013, 56, 1863–1870. [Google Scholar] [CrossRef]
  12. Sinha, N.; Sidhu, J.; Barta, J.; Wu, J.; Cano, M.P. Handbook of Fruits and Fruit Processing; John Wiley & Sons: Hoboken, NJ, USA, 2012. [Google Scholar]
  13. DeMoranville, C.J.; Sandler, H.A.; Jeranyama, P.; Averill, A.L.; Caruso, F.L.; Sylvia, M.; Ghantous, K. 2014 Chart Book: Table of Contents; University of Massachusetts Amherst: Amherst, MA, USA, 2014. [Google Scholar]
  14. McArthur, D.A.J.; Eaton, G.W. Cranberry growth and yield response to fertilizer and paclobutrazol. Sci. Hortic. 1989, 38, 131–146. [Google Scholar] [CrossRef]
  15. Engels, C.; Kirkby, E.; White, P. Mineral nutrition, yield and source–sink relationships. In Marschner’s Mineral Nutrition of Higher Plants; Elsevier Ltd.: Amsterdam, The Netherlands, 2012; pp. 85–133. [Google Scholar] [CrossRef]
  16. Vanden Heuvel, J.E.; Davenport, J.R. Growth and carbon partitioning in cranberry uprights as influenced by nitrogen supply. Hortscience 2006, 41, 1552–1558. [Google Scholar] [CrossRef] [Green Version]
  17. Eaton, G.W. Effect of N, P, and K fertilizer applications on cranberry leaf nutrient composition, fruit color and yield in a mature bog. J. Am. Soc. Hortic. Sci. 1971, 96, 430–433. [Google Scholar]
  18. Rosen, C.J.; Allan, D.L.; Luby, J.J. Nitrogen form and solution pH influence growth and nutrition of 2 Vaccinium clones. J. Am. Soc. Hortic. Sci. 1990, 115, 83–89. [Google Scholar] [CrossRef]
  19. Davenport, J.; McMoranville, J.; Hart, J.M.; Patten, K.; Peterson, L.; Planer, T.; Poole, A. Cranberry tissue testing for producing beds in North America. In OSU Extension Catalog; Service, E., Ed.; Oregon State University: Corvallis, OR, USA, 1995. [Google Scholar]
  20. Davenport, J.; DeMoranville, C.J.; Hart, J.; Roper, T. Nitrogen for Bearing Cranberries in North America; Extension Service, Oregon State University: Corvallis, OR, USA, 2000. [Google Scholar]
  21. DeMoranville, C.J.; Ghantous, K. 2018–2020 Chart Book: Nutrition Management; University of Massachusetts, Amherst: Amherst, MA, USA, 2018. [Google Scholar]
  22. Roper, T.R. Mineral nutrition of cranberry: What we know and what we thought we knew. In Proceedings of the IX International Vaccinium Symposium, Corvallis, OR, USA, 14–18 July 2008; Volume 810, pp. 613–625. [Google Scholar]
  23. DeMoranville, C. Reducing phosphorus use in cranberry production: Horticultural and environmental implications. In Proceedings of the X International Symposium on Vaccinium and Other Superfruits, Maastricht, The Netherlands, 17–22 June 2012; VanKooten, O., Brouns, F., Eds.; Volume 1017, pp. 447–453. [Google Scholar]
  24. Parent, L.E.; Marchand, S. Response to phosphorus of cranberry on high phosphorus testing acid sandy soils. Soil Sci. Soc. Am. J. 2006, 70, 1914–1921. [Google Scholar] [CrossRef]
  25. Davenport, J.R.; Provost, J. Cranberry tissue nutrient levels as impacted by three levels of nitrogen fertilizer and their relationship to fruit yield and quality. J. Plant Nutr. 1994, 17, 1625–1634. [Google Scholar] [CrossRef]
  26. Eaton, G.W.; Meehan, C.N. Effects of N application and K application on leaf composition, yield, and fruit-quality of bearing Mcfarlin cranberries. Can. J. Plant Sci. 1976, 56, 107–110. [Google Scholar] [CrossRef]
  27. Aitchison, J. The Statistical Analysis of Compositional Data; Chapman and Hall Ltd.: New York, NY, USA, 1986; p. 416. [Google Scholar]
  28. Pawlowsky-Glahn, V.; Buccianti, A. Compositional Data Analysis: Theory and Applications; Wiley: Hoboken, NJ, USA, 2011. [Google Scholar]
  29. McCown, B.H.; Zeldin, E.L. ‘HyRed’, an early, high fruit color cranberry hybrid. Hortscience 2003, 38, 304–305. [Google Scholar] [CrossRef] [Green Version]
  30. National Climate Data and Information Archive of Environment. The Meteorological Service of Canada; Government of Canada: Ottawa, ON, Canada, 2021.
  31. Caron, J.; Pelletier, V.; Kennedy, C.D.; Gallichand, J.; Gumiere, S.; Bonin, S.; Bland, W.L.; Pepin, S. Guidelines of irrigation and drainage management strategies to enhance cranberry production and optimize water use in North America. Can. J. Soil Sci. 2017, 97, 82–91. [Google Scholar] [CrossRef] [Green Version]
  32. Kettler, T.A.; Doran, J.W.; Gilbert, T.L. Simplified method for soil particle-size determination to accompany soil-quality analyses. Soil Sci. Soc. Am. J. 2001, 65, 849–852. [Google Scholar] [CrossRef] [Green Version]
  33. Mehlich, A. Mehlich-3 soil test extractant a modification of Mehlich-2 extractant. Commun. Soil Sci. Plant Anal. 1984, 15, 1409–1416. [Google Scholar] [CrossRef]
  34. Kennedy, C.D.; Alverson, N.; Jeranyama, P.; DeMoranville, C. Seasonal dynamics of water and nutrient fluxes in an agricultural peatland. Hydrol. Process. 2018, 32, 698–712. [Google Scholar] [CrossRef]
  35. Fuleki, T.; Francis, F.J. Quantitative methods for Anthocyanins.1. Extraction and determination of total anthocyanin in cranberries. J. Food Sci. 1968, 33, 72–77. [Google Scholar] [CrossRef]
  36. Lamikanra, O.; Kueneman, D.; Ukuku, D.; Bett-Garber, K.L. Effect of processing under ultraviolet light on the shelf life of fresh-cut cantaloupe melon. J. Food Sci. 2005, 70, C534–C539. [Google Scholar] [CrossRef]
  37. R Development Core Team. R: A Language and Environment for Statistical Computing; R Foundation for Statistical Computing: Vienna, Austria, 2021. [Google Scholar]
  38. Wickham, H.; Averick, M.; Bryan, J.; Chang, W.; McGowan, L.D.A.; François, R.; Grolemund, G.; Hayes, A.; Henry, L.; Hester, J. Welcome to the Tidyverse. J. Open Source Softw. 2019, 4, 1686. [Google Scholar] [CrossRef]
  39. LaZerte, S.E.; Albers, S. Weathercan: Download and format weather data from Environment and Climate Change Canada. J. Open Source Softw. 2018, 3, 571. [Google Scholar] [CrossRef] [Green Version]
  40. Kahle, D.; Wickham, H.; Kahle, M.D. ggmap: Spatial Visualization with ggplot2. R J. 2013, 5, 144–161. [Google Scholar] [CrossRef] [Green Version]
  41. Pinheiro, J.; Bates, D.; DebRoy, S.; Sarkar, D.; R Core Team. nlme: Linear and Nonlinear Mixed Effects Models. R J. 2019, 3, 139. [Google Scholar]
  42. Clark-Carter, D. z Scores. In Wiley StatsRef: Statistics Reference Online; Wiley: Hoboken, NJ, USA, 2014. [Google Scholar] [CrossRef]
  43. Makowski, D.; Ben-Shachar, M.S.; Chen, S.H.A.; Lüdecke, D. Indices of effect existence and significance in the Bayesian framework. Front. Psychol. 2019, 10, 2767. [Google Scholar] [CrossRef] [PubMed]
  44. Amrhein, V.; Greenland, S.; McShane, B. Scientists rise up against statistical significance. Nature 2019, 567, 305–307. [Google Scholar] [CrossRef] [PubMed] [Green Version]
  45. Oksanen, J.; Blanchet, F.G.; Kindt, R.; Legendre, P.; Minchin, P.R.; O’hara, R.; Simpson, G.L.; Solymos, P.; Stevens, M.H.H.; Wagner, H. Package ‘vegan’. Community Ecol. Package Version 2013, 2, 1–295. [Google Scholar]
  46. Greenacre, M. Compositional data analysis. Annu. Rev. Stat. Appl. 2021, 8, 271–299. [Google Scholar] [CrossRef]
  47. Borcard, D.; Gillet, F.O.; Legen, P. Numerical Ecology with R, 2nd ed.; Springer: Cham, Switzerland, 2018. [Google Scholar] [CrossRef]
  48. Legendre, P.; Legendre, L. Numerical Ecology, 3rd ed.; Elsevier: Amsterdam, The Netherlands, 2012. [Google Scholar]
  49. Filzmoser, P.; Hron, K.; Reimann, C. Univariate statistical analysis of environmental (compositional) data: Problems and possibilities. Sci. Total Environ. 2009, 407, 6100–6108. [Google Scholar] [CrossRef]
  50. Roper, T. The Physiology of Cranberry Yield; Wisconsin Cranberry Crop Management Newsletter: Madison, WI, USA, 2006; p. 21. [Google Scholar]
  51. Parent, L.E.; Rozane, D.E.; de Deus, J.A.L.; Natale, W. Diagnosis of nutrient composition in fruit crops: Major developments. In Fruit Crops; Elsevier: Amsterdam, The Netherlands, 2020; pp. 145–156. [Google Scholar]
  52. Gallardo, R.K.; Klingthong, P.; Zhang, Q.; Polashock, J.; Atucha, A.; Zalapa, J.; Rodriguez-Saona, C.; Vorsa, N.; Iorizzo, M. Breeding trait priorities of the cranberry industry in the United States and Canada. HortScience 2018, 53, 1467–1474. [Google Scholar] [CrossRef] [Green Version]
  53. Stevens, N.E. Thickness of cuticle in cranberry fruits. Am. J. Bot. 1932, 19, 432–435. [Google Scholar] [CrossRef]
  54. Boucher, V. Effet des Doses de Fertilisant Azoté sur le Rendement et la Qualité des Fruits de Canneberge Produits au Québec; Université Laval: Quebec City, QC, Canada, 1999. [Google Scholar]
  55. Jamaly, R.; Marchand, S.; Parent, S.-E.; Gumiere, S.J.; Deland, J.-P.; Parent, L.-E. Impact of Fertilization on the Firmness of Cranberry (Vaccinium macrocarpon AIT). In Proceedings of the North American Cranberry Researcher and Extension Workers Conference, Plymouth, MA, USA, 27–30 August 2017. [Google Scholar]
  56. Davenport, J.R. The effect of nitrogen fertilizer rates and timing on cranberry yield and fruit quality. J. Am. Soc. Hortic. Sci. 1996, 121, 1089–1094. [Google Scholar] [CrossRef] [Green Version]
  57. Sapers, G.M.; Phillips, J.G.; Rudolf, H.M.; Divito, A.M. Cranberry quality selection procedures for breeding programs. J. Am. Soc. Hortic. Sci. 1983, 108, 241–246. [Google Scholar]
  58. Vorsa, N.; Welker, W.V. Relationship between fruit size and extractable anthocyanin content in cranberry. Hortscience 1985, 20, 402–403. [Google Scholar]
  59. Vorsa, N.; Johnson-Cicalese, J. American cranberry. In Fruit Breeding; Springer: Boston, MA, USA, 2012; Volume 8, pp. 191–223. [Google Scholar]
  60. Bourne, M.C. Texture of temperate fruits. J. Texture Stud. 1979, 10, 25–44. [Google Scholar] [CrossRef]
  61. Davenport, J.R.; Vorsa, N. Cultivar fruiting and vegetative response to nitrogen fertilizer in cranberry. J. Am. Soc. Hortic. Sci. JASHS 1999, 124, 90. [Google Scholar] [CrossRef] [Green Version]
  62. Brown, A.O.; McNeil, J.N. Fruit production in cranberry (Ericaceae: Vaccinium macrocarpon): A bet-hedging strategy to optimize reproductive effort. Am. J. Bot. 2006, 93, 910–916. [Google Scholar] [CrossRef]
  63. DeVetter, L.; Colquhoun, J.; Zalapa, J.; Harbut, R. Yield estimation in commercial cranberry systems using physiological, environmental, and genetic variables. Sci. Hortic. 2015, 190, 83–93. [Google Scholar] [CrossRef]
  64. Birrenkott, B.A.; Stang, E.J. Selective flower removal increases cranberry fruit set. HortScience 1990, 25, 1226–1228. [Google Scholar] [CrossRef] [Green Version]
  65. Roper, T.R.; Klueh, J.; Hagidimitriou, M. Shading, timing and intensity influences fruit-set and yield in cranberry. Hortscience 1995, 30, 525–527. [Google Scholar] [CrossRef] [Green Version]
  66. DeMoranville, C.J.; Davenport, J.R.; Patten, K.; Roper, T.R.; Strik, B.C.; Vorsa, N.; Poole, A.P. Fruit mass development in three cranberry cultivars and five production regions. J. Am. Soc. Hortic. Sci. 1996, 121, 680–685. [Google Scholar] [CrossRef] [Green Version]
  67. Burd, M. “Excess” flower production and selective fruit abortion: A model of potential benefits. Ecology 1998, 79, 2123–2132. [Google Scholar] [CrossRef]
  68. Degaetano, A.T.; Shulman, M.D. A statistical evaluation of the relationship between cranberry yield in New-Jersey and meteorological factors. Agric. For. Meteorol. 1987, 40, 323–342. [Google Scholar] [CrossRef]
  69. Franklin, H.J.; Stevens, N.E. Weather and Water as Factors in Cranberry Production; University of Massachusetts: Amherst, MA, USA, 1946. [Google Scholar]
  70. Reganold, J.P.; Wachter, J.M. Organic agriculture in the twenty-first century. Nat. Plants 2016, 2, 15221. [Google Scholar] [CrossRef]
  71. Ponti, D.T.; Rijk, H.C.A.; Ittersum, V.M.K. The crop yield gap between organic and conventional agriculture. Agric. Syst. 2012, 108, 1–9. [Google Scholar] [CrossRef]
  72. De Moranville, C.J. 2017 Chart Book: Nutrition Management; University of Massachusetts Amherst: Amherst, MA, USA, 2017; p. 15. [Google Scholar]
  73. B Bray, R.H. A nutrient mobility concept of soil-plant relationships. Soil Sci. 1954, 78, 9–22. [Google Scholar] [CrossRef]
  74. Bray, R.H. Soil-plant relations: I. The quantitative relation of exchangeable potassium to crop yields and to crop response to potash additions. Soil Sci. 1944, 58, 305–324. [Google Scholar] [CrossRef]
  75. Haynes, R.J.; Swift, R.S. Effect of soil amendments and sawdust mulching on growth, yield and leaf nutrient content of highbush blueberry plants. Sci. Hortic. 1986, 29, 229–238. [Google Scholar] [CrossRef]
  76. Phillips, I.; Burton, E. Nutrient leaching in undisturbed cores of an acidic sandy podosol following simultaneous potassium chloride and di-ammonium phosphate application. Nutr. Cycl. Agroecosyst. 2005, 73, 1–14. [Google Scholar] [CrossRef]
  77. Al-Kanani, T.; MacKenzie, A.; Ross, G. Mineralogy of surface soil samples of some Quebec soils with reference to K status. Can. J. Soil Sci. 1984, 64, 107–113. [Google Scholar] [CrossRef]
  78. Kodama, H. Clay minerals in Canadian soils their origin, distribution and alteration. Can. J. Soil Sci. 1979, 59, 37–58. [Google Scholar] [CrossRef]
  79. Simard, R.R.; Dekimpe, C.R.; Zizka, J. The kinetics of nonexchangeable potassium and magnesium release from Quebec soils. Can. J. Soil Sci. 1989, 69, 663–675. [Google Scholar] [CrossRef] [Green Version]
  80. Feigenbaum, S.; Edelstein, R.; Shainberg, I. Release rate of potassium and structural cations from micas to ion-exchangers in dilute-solutions. Soil Sci. Soc. Am. J. 1981, 45, 501–506. [Google Scholar] [CrossRef]
  81. Mc Lean, E.O.; Watson, M. Soil Measurements of Plant-Available Potassium. In Potassium in Agriculture; Rde, M., Ed.; ASA CSSA and SSSA: Madison, WI, USA, 1985; pp. 277–308. [Google Scholar] [CrossRef]
  82. Kuchenbuch, R.; Jungk, A. Influence of potassium supply on the availability of potassium in the rhizosphere of rape (Brassica-Napus). Z. Fur Pflanzenernahrung. Und Bodenkd. 1984, 147, 435–448. [Google Scholar] [CrossRef]
  83. Marchand, S.; Parent, S.E.; Deland, J.P.; Parent, L.E. Nutrient Signature of Québec (Canada) cranberry (Vaccinium macrocarpon AIT.). Rev. Bras. Frutic. 2013, 35, 292–304. [Google Scholar] [CrossRef] [Green Version]
  84. Parent, L.E.; Gagné, G. Guide de Référence en Fertilisation; Les Impressions STAMPA Inc.: Québec, QC, Canada, 2010; p. 473. [Google Scholar]
  85. Davenport, J.R.; DeMoranville, C.J.; Hart, J.; Kumidini, S.; Patten, K.; Poole, A.; Roper, T.R. Spatial and temporal variability of cranberry soil pH. Acta Hortic. 2003, 626, 315–327. [Google Scholar] [CrossRef]
  86. Parent, L.E.; Jamaly, R.; Atucha, A.; Parent, E.J.; Workmaster, B.A.; Ziadi, N.; Parent, S.-É. Current and next-year cranberry yields predicted from local features and carryover effects. PLoS ONE 2021, 16, e0250575. [Google Scholar] [CrossRef]
Figure 1. Map of the four study sites located on the south shore of the St. Lawrence River in Quebec, Canada.
Horticulturae 07 00191 g001
Figure 2. Coefficients of the linear mixed model on the x axes showing the effects on berry yield and quality of amino acids (8-0-0), sulfur-coated urea (24-5-11), and fish emulsions (6-1-1) compared to ammonium sulfate (21-0-0) (y axes). The in-box black line shows 95% confidence intervals. The on-line values are the mean and lower and upper limits for 95% confidence intervals.
Horticulturae 07 00191 g002
Figure 3. Response of cranberry yield components to added N, P, and K. The solid line represents the model fit with the slope and intercept of the line; the shaded area represents the 95% confidence interval.
Horticulturae 07 00191 g003
Figure 4. Response of berry yield, weight, and quality indices to added N, P, and K. The solid line represents the model fit with the slope and intercept of the line; the shaded area represents the 95% confidence interval.
Horticulturae 07 00191 g004
Figure 5. Matrix of correlations among yield components in the cranberry data set. The diagonal shows graphs of the original data after adjusting for all other variables. Upper: Pearson correlation. ** Correlation significant at the 0.05 level; *** Correlation significant at the 0.01 level.
Horticulturae 07 00191 g005
Figure 6. Redundancy analysis relating soil properties on the left to cranberry performance indices on the right. Distances were computed using the Euclidean distance.
Horticulturae 07 00191 g006
Table 1. Soil particle size distribution and mean and standard deviation (SD) of soil data at each experimental site across 144 plots in June 2014.
Site10459A9
g kg−1
Clay23262836
Silt40324136
Sand total937943932928
• 1–2 mm6.119.134.113.2
• 0.5–1.0 mm28.370.4161.572.1
• 0.25–0.5 mm332.9283.5405.3417.3
• 0.1–0.25 mm466.5478.5261.8380.7
• 0.25–0.01 mm103.291.569.244.7
mean ± standard deviation
pH (0.01 M CaCl2)4.24.3 ± 0.14.3 ± 0.14.1 ± 0.1
g kg−1 (mean ± standard deviation)
Total C3942 ± 66412,170 ± 421810,615 ± 187510,528 ± 1836
Total N162±88479 ± 182436 ± 173400 ± 183
Mehlich-3 analysismg kg−1 (mean ± standard deviation)
P63 ± 15100 ± 21164 ± 29.691 ± 19.2
K8.5 ± 1.526.1 ± 6.816.6 ± 2.810.7 ± 3.2
Ca31.6 ± 5.570.3 ± 24106.1 ± 24.814.7 ± 4.1
Mg10.7 ± 26.6 ± 2.69.8 ± 2.13.9 ± 1.3
Cu1.8 ± 0.61.1 ± 0.61.7 ± 0.50.9 ± 0.3
Zn0.6 ± 0.11.0 ± 0.22.0 ± 0.50.4 ± 0.1
Mn1.5 ± 0.30.7 ± 0.31.2 ± 0.50.4 ± 0.3
Fe177 ± 253043 ± 4282 ± 30239 ± 46
Al594 ± 1751240 ± 221510 ± 1751488 ± 114
Table 2. Fertilization treatments during the 2014–2016 period at conventional and organic sites.
201420152016
ConventionalConventionalConventionalOrganicConventionalOrganic
Nutrientkg element ha−1
N0, 15, 30. 45, 600, 15, 30. 45, 600, 15, 30. 45, 600, 15, 30, 45, 600, 15, 30. 45, 600, 15, 30. 45, 60
P0, 15, 300, 15, 300, 15, 300, 15, 301515
K0, 40, 80, 1200, 40, 80, 1200, 40, 80, 1200, 40, 80, 1200, 40, 80, 1200, 40, 80, 120
Mg0 or 120 or 120 or 120 or 121212
Cu0 or 20 or 20 or 20 or 222
B0 or 10 or 10 or 10 or 111
Publisher’s Note: MDPI stays neutral with regard to jurisdictional claims in published maps and institutional affiliations.

