Article

Estimation of Glucosinolates and Anthocyanins in Kale Leaves Grown in a Plant Factory Using Spectral Reflectance

1
Department of Agricultural Machinery Engineering, Graduate school, Chungnam National University, Daejeon 34134, Korea
2
Department of Smart Agricultural Systems, Graduate School, Chungnam National University, Daejeon 34134, Korea
3
Division of Computational Mechatronics, Institute for Computational Science, Ton Duc Thang University, Ho Chi Minh City 700000, Vietnam
4
Department of Crop Science, Graduate school, Chungnam National University, Daejeon 34134, Korea
*
Author to whom correspondence should be addressed.
Horticulturae 2021, 7(3), 56; https://doi.org/10.3390/horticulturae7030056
Submission received: 1 January 2021 / Revised: 7 March 2021 / Accepted: 18 March 2021 / Published: 21 March 2021

Abstract

:
The spectral reflectance technique for the quantification of the functional components was applied in different studies for different crops, but related research on kale leaves is limited. This study was conducted to estimate the glucosinolate and anthocyanin components of kale leaves cultivated in a plant factory based on diffuse reflectance spectroscopy through regression methods. Kale was grown in a plant factory under different treatments. After specific periods of transplantation, leaf samples were collected, and reflectance spectra were measured immediately from nine different points on each leaf. The same leaf samples were freeze-dried and stored for analysis of the functional components. Regression procedures, such as principal component regression (PCR), partial least squares regression (PLSR), and stepwise multiple linear regression (SMLR), were applied to relate the functional components with the spectral data. In the laboratory analysis, progoitrin and glucobrassicin, as well as cyanidin and malvidin, were found to be dominating components in glucosinolates and anthocyanins, respectively. From the overall analysis, the SMLR model showed better performance, and the identified wavelengths for estimating the glucosinolates and anthocyanins were in the early near-infrared (NIR) region. Specifically, reflectance at 742, 761, 787, 796, 805, 833, 855, 932, 947, and 1000 nm showed a strong correlation.

1. Introduction

Kale (Brassica oleracea var. alboglabra) is one of the major sources of phytonutrient components (e.g., glucosinolates, anthocyanins, carotenoids, amino acids, and sugars), from which glucosinolates and anthocyanins are well known for containing cancer-chemo preventive compounds. In basic terms, glucosinolates and anthocyanins are the combination of secondary metabolites, enriched with nitrogen and sulfur-containing glycosides, available in species of the Brassicaceae families [1]. In-vitro and in-vivo studies reported that glucosinolates and their breakdown components inhibited many cancer development steps, such as phase I and II modulation of detoxification enzymes [2]. Consumption of anthocyanins reduces the risk of cardiovascular problems, diabetes, and cancer due to their anti-inflammatory and antioxidant activities [3,4].
Quantification of functional components in vegetables and fruits is important to nutritionists and researchers but also essential to farmers for producing nutrient-rich crops. Usually, functional components are analyzed in the laboratory using different reagents, tools, and equipment, which is time-consuming and labor-intensive work and sometimes hazardous to humans. High-performance liquid chromatography (HPLC) analysis, commonly used in laboratories, is one of the popular methods for determining the level of functional components. This method requires specialized technicians, time, and usually involves high costs. The stability of results and the health of humans and the environment can be affected by the reagents used during the extraction steps and the HPLC analysis procedure [5,6,7,8]. Reflectance spectroscopic techniques could be considered as an alternative method due to their nondestructive and simple procedure, quick response characteristics, and the relatively small amount of samples required [9].
The spectral reflectance technique is applied to estimate the functional components and nutritional status of different vegetables, where significant differences in results were observed based on the vegetable species, cultivation methods, and environmental parameters [10,11,12,13,14]. The application of the reflectance spectroscopy technique was introduced in the early 20th century [15]. Results showed that the wavelengths in the infrared region were suitable for the rapid assessment of forage quality. Recently, researchers [9,16] applied and analyzed the reflectance spectra to estimate the nutritional and functional components in various leafy vegetables and medicinal plants. Generally, leaf reflectance spectra were low in the visible region (from 400 to 700 nm) due to light absorption by photosynthesis pigments (e.g., chlorophyll and carotenoids) [8], and sometimes physiological structure also affects the magnitude of reflectance [17]. Leaf pigments such as chlorophyll, carotenoids, and anthocyanins in higher plants could easily be detected in the reflectance range of 400 to 800 nm. More specifically, total chlorophyll content was identified either at 540 to 560 nm (green region) or 700 to 730 nm (red region) and also at 760 nm in beech leaves [18]; 540 to 560 nm and 700 to 705 nm, depending on detection point of lettuce; and 510 to 540 nm for spinach [19]. The carotenoid contents of maple, chestnut, and beech leaves were identified, and it was reported that 510 to 550 nm are closely related to total pigment content [20].
As the consumption of certain cruciferous vegetables (i.e., kale, cabbage) is more strongly related to health benefits, the estimation and study of health-promoting components, specifically glucosinolates and anthocyanins, through spectral reflectance are quite popular among researchers and growers [21,22,23,24]. The functional components of Chinese cabbage were estimated using diffuse reflectance spectroscopy, and the sugar, amino acid, glucosinolate and carotenoid contents were modelled using wavelengths of 317, 390, 888, 940 nm; 520, 960 nm; 385, 860, 945 nm; and 454, 472, 530 nm, respectively [9]. The effects of various fertilizer treatments and light intensity on functional components in white head cabbage and Chinese kale were also inspected, respectively [25,26]. A comparison was also carried out to show the similarities of wavelength ranges for estimating the functional components of kale and Chinese cabbage cultivated in plant factory and reported that leading wavelengths were found under 470~1050 nm and 317~960 nm, respectively [27].
Traditionally, kale is cultivated in the open fields using different bio-extracts or bio-decomposed matter with moderate fertilizer and pesticides to reduce impacts on soils. However, maintenance of quantity and nutrient contents cannot be ensured [28,29,30]. Kim and Chung [30] showed that plant growth and glucosinolate contents were greater in protected cultivation facilities, such as greenhouses and plant factories, than open field cultivation. Moreover, kale production using hydroponic systems has gained popularity in recent years due to uniform controlled environments, sustainable growth, efficient use of nutrients, lower rates of diseases, and year-round high-quality production with minimum influence of geological and climatic conditions [31,32,33]. Controlled environmental factors, namely temperature, humidity, carbon dioxide, light, and soil fertility, have significant effects on the concentration of health-promoting components, specifically glucosinolates in growing plants and distribution among plant organs. Determination of the effects of controlled environmental parameters and soil properties on the growth, formation, release, germination, yield, and quality of crops have been the focus of many studies worldwide [34,35,36]. Analysis of the functional components (e.g., glucosinolates, anthocyanins, carotenoids, amino acids, and sugars) is also essential for ensuring nutritional levels and determining proper harvesting schedules [9,37,38].
Although controlled-environment cultivation increases the concentration of the functional components of crops, the accumulation rate of every component is not the same. Quantification of the functional components of various vegetables using the spectral reflectance technique was reported in some studies, but significant differences in results were observed, even among species of the same crop family, due to cultivation methods and environmental parameters. As research related to the quantification of functional components on kale leaves is limited, the objective of this study was to estimate the contents of glucosinolates and anthocyanins in leaves of kale grown in a plant factory through UV/VIS/NIR-diffuse reflectance spectroscopy data.

2. Materials and Methods

2.1. Kale Cultivation in a Plant Factory

A plant factory is a closed crop cultivation facility used to grow high-value crops of a high quality throughout the year by utilizing artificially controlled environmental parameters. In this study, a plant factory was used to maintain the desired levels of the controlled environmental parameters precisely and evaluate their effect on the accumulation of the nutritional components of kale. For this purpose, three experiments for the ambient environmental factors (temperature, humidity, and carbon dioxide (CO2)), three experiments for the light conditions (light type, light intensity, and light photoperiod), and one experiment for the electrical conductivity (EC) were implemented. In each experiment, five different levels for each environmental factor were implemented. All the treatments were prepared following the guidelines of the horticultural crop cultivation process and summarized in Table 1. A wireless sensor and control networks were used for monitoring and controlling the ambient environmental conditions, as detailed by Chung et al. [39].
Kale was selected because it is a nutrient-dense vegetable and is considered a healthy and popular food in many countries for its powerful medicinal properties. A commercial kale variety with smooth, green leaves and a hard and fibred stem was cultivated in the plant factory. Kale seeds were sown in a hydroponic germination sponge, and three weeks after germination, healthy seedlings with true leaves were transplanted into the plant beds. Twenty-four plants were placed in each plant bed. Seedlings were grown using a recycle-type aeroponic nutrient management system over a period of about 40 to 50 days (Figure 1). Commercial nutrient solutions A and B (Daeyu Co., Ltd., Seoul, Korea) were used, and the target nutrient level was monitored and managed once a day using the electrical conduction (EC) and pH sensors. The nutrient solution was sprayed onto the plant root zone for two minutes at 15-min intervals. The unused solution was returned to the nutrient mixing tank, and filtration and sterilization were performed using a commercial UV-sterilizer and filter (HY-600F, Haiyang, China). Additional distilled water and stock solutions were added during nutrient replenishment to prepare the target nutrient solution.

2.2. Leaf Sample Collection

Two and four weeks after transplanting, leaf sample collection was performed in three steps. Mature and healthy leaf samples were visually selected and collected according to their color and size condition for spectral reflectance measurement and analysis of functional components. Three normal-sized, matured, and healthy leaves were harvested from each plant, and total nine leaves were collected from three plants in each plant bed. Three replications were applied. In total, 27 (3 leaves × 3 plants × 3 replications) kale leaves were harvested. The reflectance spectra were measured first, and the leaves were transferred to the chemical laboratory immediately (to minimize the degradation of nutrient contents) for functional component analyses using a commercial high-performance liquid chromatography (HPLC) machine (model: 1200 series, Agilent Technologies, Santa Clara, CA, USA). Figure 2 shows the different growth stages of kale after different periods of transplantation, a selected plant, and a harvested leaf sample for reflectance acquisition and functional components analysis. The measured reflectance spectra and functional components from 9 leaves were averaged to represent one data point. In total, 204 data points (34 treatments × 2 sampling time × 3 replications) for glucosinolates contents and 90 data points (15 treatments of temperature, humidity, and CO2 × 2 sampling time × 3 replications) for anthocyanins contents were obtained.

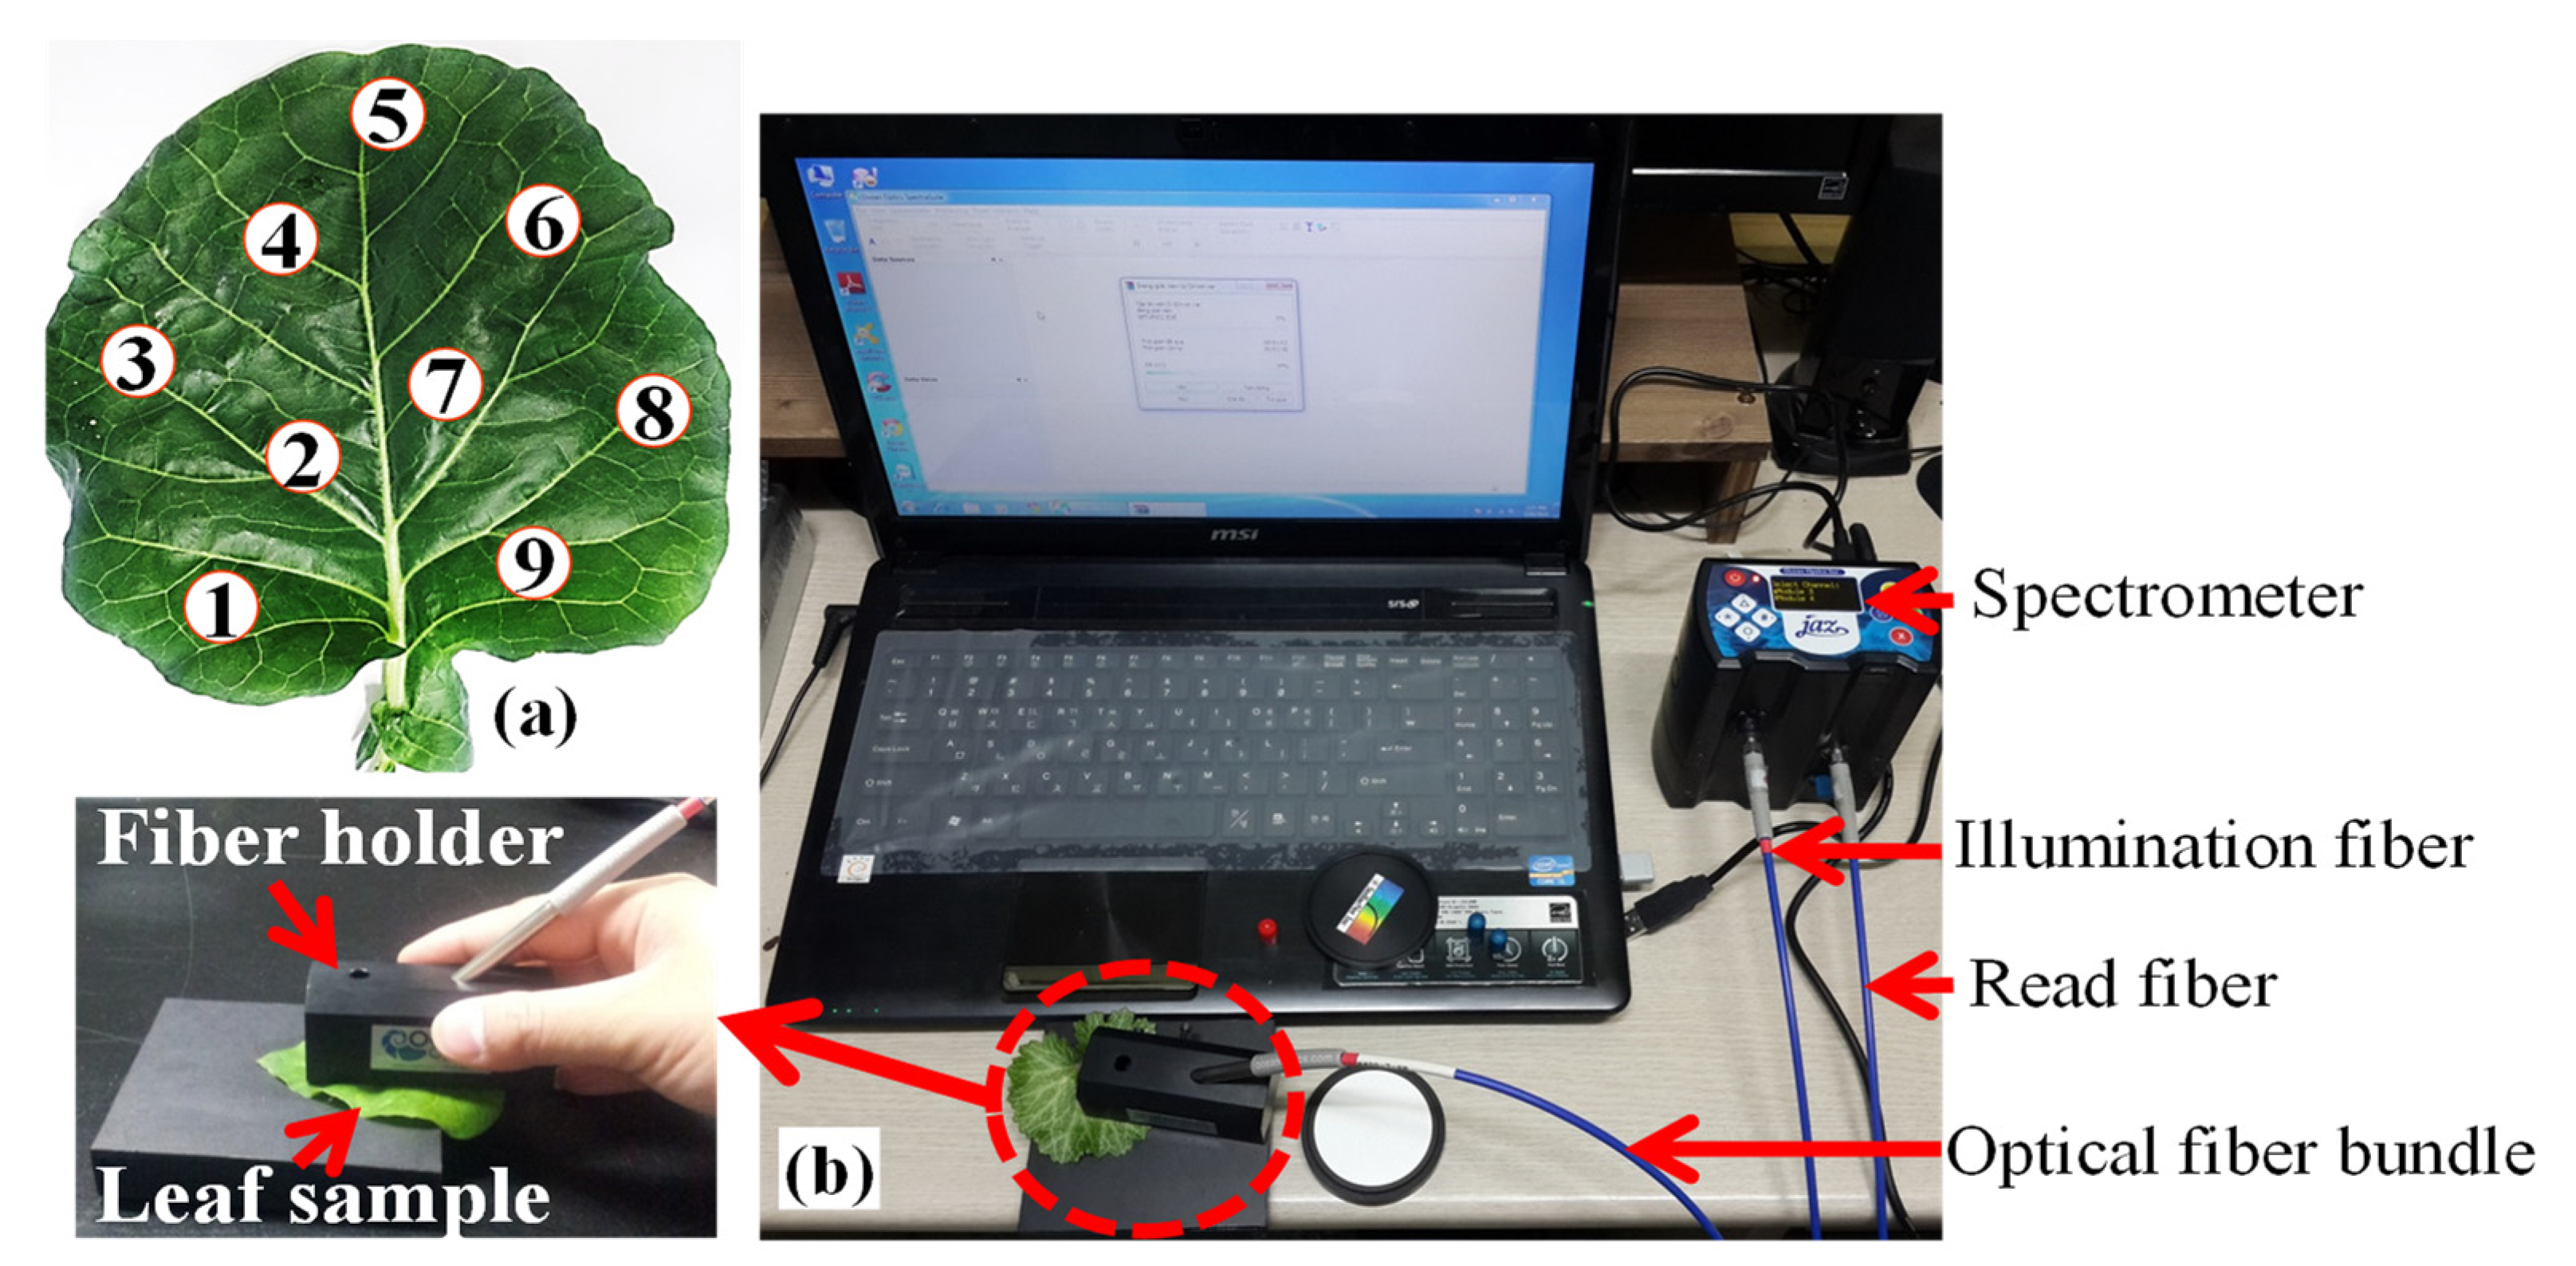
2.3. Reflectance Spectra Acquisition

Right after the leaf sample collection, the reflected spectra were measured from each sample leaf using a spectrometer (model: Jaz-Combo-2, Ocean Optics, FL, USA). The applied wavelength range was 190 to 1130 nm with an interval of 0.37 nm, where one detector device provided 190 to 890 nm (UV/VIS) and other detector devices provided 470 to 1130 nm (NIR). However, the wavelength range from 300 to 1050 nm was considered during analysis to avoid excessive noise at the edge of the wavelengths. The received spectra from the mentioned detectors were joined, centering at about 720 nm. The reflected spectra were collected in the dark to minimize the noise caused by background effects and other circumstances. The spectrometer was operated by software provided by the manufacturer. Following the methodology of the previous studies of [9,37,40], the spectral reflectance data were measured from 9 sampling points over the blade part of each sampling leaf, as shown in Figure 3.

2.4. Extraction of Glucosinolates and Anthocyanins

The freshly harvested leaf samples were freeze-dried using liquid nitrogen for 48 h and ground into a fine powder using a pestle and mortar. Part of the freeze-dried samples (100 mg) was separated, and the crude glucosinolates were extracted with 70% boiling methanol (4.5 mL). The diethyl-aminoethyl (DEAE) anion exchange columns were used to obtain delsulphated glucosinolates. Distilled water (1.5 mL) was used to eluate delsulphated glucosinolates. The prepared eluates were analyzed using an HPLC (model: 1200 series, Agilent Technologies, CA, USA) after filtering the delsulphated glucosinolates through a 0.45 µm polytetrafluoroethylene (PTFE) syringe filter. HPLC conditions were set as follows: a C18 column (150 × 3.0 mm, 3 µm, Inertsil ODS-3, GL Sciences, Tokyo, Japan) was used, the elution solution included ultra-pure water (solvent A) and 100% acetonitrile (solvent B), flow rate was 0.4 mL min−1, detector wavelength was set at 227 nm, and sinigrin was used as an external standard [41]. The results of glucosinolates are given as mmol g−1 dried weight of the samples.
The content of anthocyanin in the leaf samples was analyzed as mentioned by [42,43]. In brief, anthocyanins were extracted overnight at 22 °C. The freeze-dried products (8–10 mg) were extracted with 1 mL of solvent (MeOH:AcOH:H2O = 80:0.2:19.8). The extracts were filtered through a 0.45 µm filter before analysis with the HPLC system. HPLC conditions were set as follows: the normalized collision energy was set to 30%, a C18 column (150 × 2 m, Imtakt Corporation, Kyoto, Japan) was used, flow rate was 0.3 mL min−1, the elution solution included 0–100% solvent A (CH3CN:H2O:TFA = 7.5:92.5:0.1) and solvent B (CH3CN:H2O:TFA = 55:45:0.1) [44,45].

2.5. Statistical Analyses Procedures

A total of 2027 reflectance values (300 to 1050 nm with a 0.37 nm interval) were obtained from each sampling point by the detectors. Although excessive noise was omitted by considering 300 to 1050 nm reflectance spectra instead of 190 to 1130 nm (default range), smoothing (median filter with 21 smoothing points) and 1st derivative methods were additionally applied to remove outliers and reach the actual spectra, and for resolution enhancement, respectively. This combined application technique was applied following the reference [46]. After the preliminary processing, transformation of the raw reflectance value (Ref) was performed independently to check the non-linear correlation of reflectance spectra to the functional components. The used transformations of variables were squared power (Ref2), squared root (√Ref), logarithm (Ln(Ref)), exponent (eRef), and inversion (1/Ref) [47].
Due to the similarity of the wavebands, the diffuse reflectance spectra are highly correlated. To reduce the multicollinearity effects and overfitting, some reflectance values were removed using the default procedures of the software. Then, the relationship between reflectance spectra and the content of functional components was investigated using several regression procedures, namely principal component regression (PCR), partial least squares regression (PLSR), and stepwise multiple linear regression (SMLR), to reduce the multicollinearity effects through MATLAB software (version: vR2013b, The MathWorks Ins, Natick, MA, USA). A ten-fold cross-validation (CV) process was applied to optimize the regression results. A total of ten subsets were generated from the dataset. One subset was used as the testing set, and the rest were used for the training set. The models containing from one to ten variables were determined for the remaining observations. The prediction residuals were determined through comparison with the removed subset. This process was repeated 10 times, with each of the subsets used exactly once as the testing data. Then, the average performance across all 10 trials was combined to find the validation residual variance. The coefficient of determination (R2) and root mean square error (RMSE) were also calculated in order to select the proper regression model [9,48].
The PCR model is generally used for analyzing multiple regression data to avoid prediction instabilities caused by multicollinearity [49]. The general linear matrix form of the PCR model is shown in Equation (1) with usual notation.
Y ^ = X β ^
where Ŷ: dependent or response variable, X : independent or controlled variables, and β ^ : regression coefficient. In comparison with PCR, PLSR delivers a better predictive linear-relationship, and is computed using a selected number of the latent factors from both datasets [50]. The model is linear for each sample n, and the value Ynj is:
Y n j = Σ i = 0 k β i X i
where Yj: the p dependent variables, Xi: the k explanatory variables, and βi: the regression coefficient. Here, i indicates the number of variables. The basic model and notations of PCR and PLSR are similar, but the method of βi determination is different. In SMLR, a multivariate model is constructed for the dependent variable (Y) considering some selected descriptive parameters (independent variables) [51,52]. The model of SMLR can be expressed as Equation (3).
Y = β 0 +   β 1 X 1 +   β 2 X 2 +   + β i X i
where Y: dependent or response variable, X1~Xi: predictor variables (surface reflectance bands), β0: constant variable, and β1i: estimated weighted regression coefficient of X1~Xi, respectively. Additionally, the Pearson correlation coefficient was implemented to assess the relationship between the reflectance spectra and functional components. Standardized beta coefficient analysis was also performed by the PCR and PLSR models using the square power of the reflectance data.

3. Results

3.1. Glucosinolate and Anthocyanin Contents

The yield, total glucosinolates, and anthocyanins of kale under the different treatments of each experiment is summarized in Table 2. Besides this, the contents of each laboratory-analyzed glucosinolate and anthocyanin component are shown in Table 3. The number of samples were different, as some of the glucosinolate and anthocyanin components were not identified in all samples due to negligible (nearly zero) content. The quantity of some functional components was not satisfactory, and these were ignored. The minimum, maximum, and mean (non-normal distribution) concentration are also shown in Table 3. Depending on the leaf samples, five to eight components of glucosinolates and four components of anthocyanins were detected. From the results of HPLC analysis, we found that the highest proportion of glucosinolate content was represented by progoitrin (38.61 ± 46.46 µmol g−1 DW), and the most abundant glucosinolate component was neoglucobrassicin (0.40 ± 1.03 µmol g−1 DW). Similarly, cyanidin (134.10 ± 92.91 µg g−1) and pelargonidin (0.14 ± 0.11 µg g−1) represented the highest and lowest contents of anthocyanin, respectively. However, most of the glucosinolate and anthocyanin components were below 3 µmol g−1 DW.

3.2. Characteristics of Spectral Data

The pre-processed reflectance spectra of kale leaves showing low and high concentrations of glucosinolates and anthocyanins are presented in Figure 4. A median filter with 21 smoothing points along with a 1st derivative was applied to pre-process the reflectance spectral data. Data processing with a greater number of smoothing points reduces the noise of raw data, but valuable information that cannot be identified by visual inspection could be lost. As shown in Figure 4, peaks appeared at about 530–570 nm due to pigment variation [53], specifically foliar chlorophyll content [54], while no major difference was observed from 300 to 500 nm, but a significant difference was found among different concentrations of glucosinolates and anthocyanins from 700 to 1050 nm for strong absorption by carotenoids and chlorophylls. Overall, reflectance percentages were lower and almost similar in the visible region (except the peaks at 550 nm), but higher reflectance was obtained in the early NIR region (700 to 1050 nm), where low and high concentrations of glucosinolate and anthocyanins could be distinguished clearly.
Pearson correlation coefficients between reflectance and an example glucosinolate component (sinigrin) are shown in Figure 5. These correlation coefficients provide transparent views of the relationships between spectra and functional components. The absolute values of correlations were higher for some transformations (e.g., raw spectra, square root, square power, and logarithm) than for exponent and inversion in the near-infrared regions. Wavelengths above 700 nm were highly correlated (|r| ≥ 0.5) with the concentration of functional components as functional components were highly sensitive to spectra in the NIR regions [23,26].

3.3. Estimation Models of the Functional Components

3.3.1. Performance of PCR, PLSR, and SMLR Using Raw Data

A summary of the raw reflectance data analysis using the PCR, PLSR, and SMLR models over the wavelength region (from 300 to 1050 nm) is presented in Table 4. The performance of the PCR model was not satisfactory compared with the PLSR and SMLR models. The coefficients of determination (R2) of the PCR models were in the range of 0.4 to 0.5 for 4-methoxyglucobrassicin, neoglucobrassicin, malvidin, and pelargonidin, whereas the other components showed worse results using the PCR model (R2: < 0.4). Using the PLSR model, a strong correlation (R2: ≥ 0.90, RMSE: ≈1 μmol g−1 DW) was found for glucobrassicin and malvidin; a fair correlation (R2: ≥ 0.60, RMSE: < 0.5 μmol g−1 DW) was obtained for sinigrin, 4-methoxyglucobrassicin, neoglucobrassicin, and pelargonidin; and a poor correlation (R2: ≤ 0.60) was observed for gluconapin and cyanidin contents. The SMLR model performed well (R2: ≥ 0.80, RMSE: ≈1 μmol g−1 DW) for all glucosinolate components, whereas poor performance was shown for anthocyanins (R2: 0.14, RMSE: 60 μg g−1) and cyanidin, and fair performance (R2: 0.46, RMSE: 0.04 μg g−1) for pelargonidin and malvidin (R2: 0.67, RMSE: 2.09 μg g−1). Although good results were obtained for some specific functional components, the transformation of spectral reflectance data was used to include possible non-linear relationships.

3.3.2. Performance of PCR, PLSR, and SMLR Using Transformed Data

A summary of the transformed reflectance data analysis using the PCR, PLSR, and SMLR models over the wavelength region (from 300 to 1050 nm) is shown in Table 5. The proper model was identified based on the R2 and RMSE values of each transformation of variables, i.e., square (Ref2) square root (√Ref), exponent (eRef), inverse (1/Ref), and base 10 logarithmic scale (Ln(Ref)) of the reflectance data. For the PCR model, a poor performance was observed (R2: < 0.6) for the glucosinolate and anthocyanin components. The results ranged from 0.4 to 0.5 for some components such as sinigrin, neoglucobrassicin, and malvidin using the Ref2, eRef, and Ln(Ref) transformation and 4-methoxyglucobrassicin using the Ref2, √Ref, eRef, and Ln(Ref) transformation. However, the results of the PCR model were higher than 0.5 for gluconapin (R2: 0.50 using √Ref and R2: 0.51 using Ln(Ref) and pelargonidin (R2: 0.50 with √Ref).
During the glucosinolates analysis, good performance of the PLSR method was observed for glucobrassicin (R2: 0.96 using √Ref, R2: 0.86 using Ln(Ref)), 4-methoxyglucobrassicin (R2: 0.80 using Ln(Ref)) and gluconapin (R2: 0.86 using √Ref, R2: 0.88 with Ln(Ref)). Fair results for the PLSR models (0.60 ≤ R2 ≤ 0.79) were obtained for sinigrin (R2: 0.64 using Ref2, R2: 0.65 using √Ref), glucobrassicin (R2: 0.60 using eRef), 4-methoxyglucobrassicin (R2: 0.60, 0.65, and 0.62 using Ref2, √Ref, and eRef, respectively), neoglucobrassicin (R2: 0.62, 0.63, 0.62, and 0.77 using Ref2, √Ref, eRef, and Ln(Ref), respectively), and gluconapin (R2: 0.68 using Ref2, R2: 0.61 using eRef). Poor performance (R2: < 0.60) was observed for sinigrin using eRef, 1/Ref, and Ln(Ref); glucobrassicin using Ref2 and 1/Ref; and 4-methoxyglucobrassicin, neoglucobrassicin, and gluconapin using 1/Ref. For anthocyanins, good performance of the PLSR models (R2: ≥ 0.80) were obtained for malvidin (R2: 0.86, 0.96, and 0.97 using √Ref, eRef, and Ln(Ref)) and pelargonidin (R2: 0.91 using Ln(Ref)). Fair PLSR model results (0.60 ≤ R2 ≤ 0.79) were obtained for cyanidin (R2: 0.68 using Ln(Ref)) and pelargonidin (R2: 0.66 using eRef; R2: 0.69 using the √Ref).
The SMLR procedure showed very good performance (R2: ≥ 0.82) for estimating the glucosinolate components (e.g., sinigrin, glucobrassicin, 4-methoxyglucobrassicin, neoglucobrassicin, gluconapin) with Ref2, √Ref, 1/Ref, and Ln(Ref) transformation, whereas only the malvidin content of anthocyanins was estimated well by the SMLR model (R2: 0.71 using √Ref, and R2: 0.74 using Ln(Ref)), and poor performance was observed for the other components (0.09 ≤ R2 ≤ 0.48).
The B-coefficient values obtained from the PCR and PLSR models reveal important wavelengths for the quantification of functional components. Figure 6 shows the B-coefficient values using square reflectance data for the PCR and PLSR models for glucobrassicin calibration. Wavelengths at 761, 890, 933, and 1000 nm were identified by the PCR model, and the wavelengths determined by the PLSR model were 742, 761, 787, 796, 805, 833, 855, 932, 947, and 1000 nm. The peak in the VIS range at about 579 nm is associated with the green region due to electronic transition. Thus, the wavelength at 544 nm was assigned to chlorophyll, while the wavelengths at 742, 761, 787, 796, 805, 833, 855, 932, 947, and 1000 nm had a strong correlation with glucosinolate content.

4. Discussion

According to the laboratory (HPLC) analysis, progoitrin was the most dominant glucosinolate component in kale leaves, and the most abundant components were glucoalyssin, gluconasturtiin, and 4-methoxyglucobrassicin. On the other hand, cyanidin was the main component of anthocyanins followed by malvidin. The abundant components were pelargonidin and delphinidin. This variation in functional components depends on crop species, growth stage, cultivation methods, and ambient environment or climatic conditions [23,38,55,56,57,58]. For example, glucoiberin, glucoraphanin, and sinigrin were observed as dominating components, sequentially, in kale plants cultivated in a closed chamber and soil-based system [57]. Besides this, glucobrassicin and sinigrin were identified as dominating components in kale when cultivated in open-field conditions [55]. The authors of [44] found sinigrin to be a dominant component in green kale and progoitrin in red kale. A difference in concentrations was also observed among studies based on the cultivation period. However, most of the studies identified almost similar types of abundant components [5,43,44].
The reflected spectra from the kale leaf surface represent the status of leaf photochemical and morphological properties. Minimum reflectance indicates a higher concentration and maximum reflectance indicates a lower concentration of glucosinolates and anthocyanins. In this study, no meaningful variation was observed in the visible region, except the peak around 530 to 570 nm (Figure 4). This sudden higher reflectance (peak) was observed due to pigment variation [53], specifically in foliar chlorophyll content [54], which was very familiar in the species of Brassicaceae family and indicates a lower glucosinolate content level in that region. A significant difference in glucosinolate content was detected for the 700 to 1050 nm wavelengths. Reflectance variation or overlapping during functional components analysis could occur in different cultivation facilities (i.e., greenhouse, plant factory, or open field), covering material types, radiation intensities or artificial light types and even the color or pigment properties of crop species (i.e., red and green kale or lettuce) [59,60,61]. The reflectance variation might occur in the visible region or NIR region based on the cultivation method, such as hydroponic or organic systems. A strong correlation between the pigment contents of red and green lettuces under different light intensities was also observed by the authors of [59,60].
Besides this, preprocessing of the reflectance spectral is necessary to minimize unwanted background information, along with accentuating the absorption features of the spectra. It also helps to attain accurate models and reduces the number of latent variables [53]. Smoothing and 1st derivative methods were applied in this study. Neto et al. [53] also applied smoothing, as well as the 1st and 2nd derivatives, and observed that the 1st derivative was the best pretreatment process for predicting anthocyanin content. They also mentioned that this pretreatment removed the non-chemical effects, resolved the overlapped bands, and provided a better version of the target data. In addition, PCR, PLSR, and SMLR models were applied in this study, and a significant correlation between spectral reflectance and glucosinolate and anthocyanin concentrations was observed in the NIR region through the SMLR model and Pearson’s correlation coefficients test. A similar result was observed during functional components analysis on Chinese cabbage leaves in our previous study [9] and also in the literature [21,62].
Several studies were conducted to identify the variation of crops’ physical, chemical, and biological properties based on crop species, cultivation methods, environmental conditions, and fertilization [30,63]. Among these, effects of cultivation systems, such as plant factory, greenhouse, or open field, and cultivation methods, such as soil-based and hydroponics, play a vital role in the variation of the glucosinolate and anthocyanin contents of crops (Table 6). The authors of [30] compared the functional components of kale (Brassica oleracea var. alboglabra) grown in three different conditions and found glucobrassicin, sinigrin, neoglucobrassicin, and progoitrin to be dominant components, sequentially, and 4-methoxyglucobrassicin to be an abundant component. They reported that the functional components of kale were higher when grown in the plant factory than in the greenhouse and open field due to potential cultivation conditions. Glucoiberin, glucoraphanin, sinigrin, and glucobrassicin were detected as major components of kale (Brassica oleracea var. acephala) when cultivated using soil-based methods in a closed chamber and an open field, respectively [38,55,57].

5. Conclusions

This study focused on the determination of glucosinolate and anthocyanin contents in kale leaves using the diffuse reflectance spectroscopy technique, where kale plants were cultivated in a plant factory under different levels of environmental factors. The results showed that progoitrin and glucobrassicin, as well as cyanidin and malvidin, were found to be dominating components in glucosinolates and anthocyanins, respectively, in laboratory analysis. Among the applied regression methods, SMLR showed better performance compared with the PCR and PLSR models. Important wavelengths for estimating glucosinolates and anthocyanins were laid between 700 to 1050 nm. Although a similar methodology was applied in some studies on other crops, very little research has been conducted on kale plants. The components of glucosinolates and anthocyanins and their related reflectance spectrum vary based on the crop species, cultivation methods, and environmental parameters, so crop-specific accurate model development is essential. The findings of this study would be useful for designing or improving any multiple-wavelength property sensor applicable for on-site functional components determination of any crops.

Author Contributions

Conceptualization, S.-O.C. and M.C., V.-D.N.; methodology, S.-O.C.; software, V.-D.N.; validation, V.-D.N., M.C.; formal analysis, M.C., V.-D.N., M.N.I., M.A., S.I., K.R., S.-U.P. and S.-O.C.; investigation, S.-O.C. and S.-U.P.; resources, S.-O.C.; data curation, M.C., V.-D.N., M.N.I., M.A., S.I. and K.R.; writing—original draft preparation, M.C.; writing—review and editing, S.-O.C., and S.-U.P.; visualization, M.C., M.N.I., M.A., S.I. and K.R.; supervision, S.-O.C.; project administration, S.-O.C.; funding acquisition, S.-O.C. All authors have read and agreed to the published version of the manuscript.

Funding

This work was supported by the Korea Institute of Planning and Evaluation for Technology in Food, Agriculture and Forestry (IPET) through the Agriculture, Food and Rural Affairs Convergence Technologies Program for Educating Creative Global Leaders, funded by Ministry of Agriculture, Food and Rural Affairs (MAFRA) (project No. 320001-4), Korea.

Institutional Review Board Statement

Not applicable.

Informed Consent Statement

Not applicable.

Data Availability Statement

The data presented in this study are available within the article.

Conflicts of Interest

The authors declare no conflict of interest.

References

  1. Wu, X.; Sun, J.; Haytowitz, D.B.; Harnly, J.M.; Chen, P.; Pehrsson, P.R. Challenges of developing a valid dietary glucosin-olate database. J. Food Compos. Anal. 2017, 64, 78–84. [Google Scholar] [CrossRef]
  2. Esteve, M. Mechanisms Underlying Biological Effects of Cruciferous Glucosinolate-Derived Isothiocyanates/Indoles: A Focus on Metabolic Syndrome. Front. Nutr. 2020, 7, 111. [Google Scholar] [CrossRef] [PubMed]
  3. Block, G.; Patterson, B.; Subar, A. Fruit, vegetables, and cancer prevention: A review of the epidemiological evidence. Nutr. Cancer 1992, 18, 1–29. [Google Scholar] [CrossRef]
  4. Kassie, F.; Uhl, M.; Rabot, S.; Grasl-Kraupp, B.; Verkerk, R.; Kundi, M.; Chabicovsky, M.; Schulte-Hermann, R.; Knasmüller, S. Chemoprevention of 2-amino-3-methylimidazo[4,5-f]quinoline (IQ)-induced colonic and hepatic preneoplastic lesions in the F344 rat by cruciferous vegetables administered simultaneously with the carcinogen. Carcinogenesis 2003, 24, 255–261. [Google Scholar] [CrossRef] [PubMed] [Green Version]
  5. Sun, B.; Liu, N.; Zhao, Y.; Yan, H.; Wang, Q. Variation of glucosinolates in three edible parts of Chinese kale (Brassica alboglabra Bailey) varieties. Food Chem. 2011, 124, 941–947. [Google Scholar] [CrossRef]
  6. Vale, A.; Santos, J.; Brito, N.; Fernandes, D.; Rosa, E.; Oliveira, M.B.P. Evaluating the impact of sprouting conditions on the glucosinolate content of Brassica oleracea sprouts. Phytochemistry 2015, 115, 252–260. [Google Scholar] [CrossRef]
  7. Hahn, C.; Müller, A.; Kuhnert, N.; Albach, D. Diversity of Kale (Brassica oleraceavar.sabellica): Glucosinolate Content and Phylogenetic Relationships. J. Agric. Food Chem. 2016, 64, 3215–3225. [Google Scholar] [CrossRef]
  8. Yu, T.H.; Hsieh, S.P.; Su, C.M.; Huang, F.J.; Hung, C.C.; Yiin, L.M. Analysis of leafy vegetable nitrate using a modified spec-trometric method. Int. J. Anal. Chem. 2018, 2018, 1–6. [Google Scholar] [CrossRef]
  9. Ngo, V.-D.; Jang, B.-E.; Park, S.-U.; Kim, S.-J.; Kim, Y.-J.; Chung, S.-O. Estimation of functional components of Chinese cabbage leaves grown in a plant factory using diffuse reflectance spectroscopy. J. Sci. Food Agric. 2019, 99, 711–718. [Google Scholar] [CrossRef]
  10. Dechant, B.; Cuntz, M.; Vohland, M.; Schulz, E.; Doktor, D. Estimation of photosynthesis traits from leaf reflectance spectra: Correlation to nitrogen content as the dominant mechanism. Remote Sens. Environ. 2017, 196, 279–292. [Google Scholar] [CrossRef]
  11. Kataria, S.; Baghel, L.; Guruprasad, K.N. Alleviation of Adverse Effects of Ambient UV Stress on Growth and Some Potential Physiological Attributes in Soybean (Glycine max) by Seed Pre-treatment with Static Magnetic Field. J. Plant. Growth Regul. 2017, 36, 550–565. [Google Scholar] [CrossRef]
  12. Neto, A.J.S.; Lopes, D.C.; Toledo, J.V.; Zolnier, S.; Silva, T.G.F. Classification of sugarcane varieties using visible/near infrared spectral reflectance of stalks and multivariate methods. J. Agric. Sci. 2018, 156, 537–546. [Google Scholar] [CrossRef]
  13. Scotford, I.; Miller, P. Applications of Spectral Reflectance Techniques in Northern European Cereal Production: A Review. Biosyst. Eng. 2005, 90, 235–250. [Google Scholar] [CrossRef]
  14. García-Sánchez, F.; Galvez-Sola, L.; Martínez-Nicolás, J.J.; Muelas-Domingo, R.; Nieves, M. Using Near-Infrared Spectroscopy in Agricultural Systems. In Developments in Near-Infrared Spectroscopy; Konstantinos, G., Kyprianidis, Eds.; Intech: Janeza Trdine 9, Croatia, 2017; pp. 98–127. [Google Scholar]
  15. Norris, K.H.; Barnes, R.F.; Moore, J.E.; Shenk, J.S. Predicting Forage Quality by Infrared Replectance Spectroscopy. J. Anim. Sci. 1976, 43, 889–897. [Google Scholar] [CrossRef]
  16. Mawlong, I.; Kumar, M.S.; Gurung, B.; Singh, K.; Singh, D. A simple spectrophotometric method for estimating total glucosinolates in mustard de-oiled cake. Int. J. Food Prop. 2017, 20, 3274–3281. [Google Scholar] [CrossRef]
  17. Bowie, B.T.; Chase, D.B.; Griffiths, P.R.; Pont, D. Factors Affecting the Performance of Bench—Top Raman Spectrometers. Part II: Effect of Sample. Appl. Spectrosc. 2000, 54, 200A–207A. [Google Scholar] [CrossRef]
  18. Gitelson, A.A.; Keydan, G.P.; Merzlyak, M.N. Three-band model for noninvasive estimation of chlorophyll, carotenoids, and anthocyanin contents in higher plant leaves. Geophys. Res. Lett. 2006, 33. [Google Scholar] [CrossRef] [Green Version]
  19. Xue, L.; Yang, L. Deriving leaf chlorophyll content of green-leafy vegetables from hyperspectral reflectance. ISPRS J. Photogramm. Remote Sens. 2009, 64, 97–106. [Google Scholar] [CrossRef]
  20. Gitelson, A.A.; Zur, Y.; Chivkunova, O.B.; Merzlyak, M.N. Assessing Carotenoid Content in Plant Leaves with Reflectance Spectroscopy. Photochem. Photobiol. 2007, 75, 272–281. [Google Scholar] [CrossRef]
  21. Chen, X.; Wu, J.; Zhou, S.; Yang, Y.; Ni, X.; Yang, J.; Zhu, Z.; Shi, C. Application of near-infrared reflectance spectroscopy to evaluate the lutein and β-carotene in Chinese kale. J. Food Compos. Anal. 2009, 22, 148–153. [Google Scholar] [CrossRef]
  22. Chen, J.; Li, L.; Wang, S.; Tao, X.; Wang, Y.; Sun, A.; He, H. Assessment of Glucosinolates in Chinese Kale by Near-Infrared Spectroscopy. Int. J. Food Prop. 2014, 17, 1668–1679. [Google Scholar] [CrossRef]
  23. Kim, H.W.; Ko, H.C.; Baek, H.J.; Cho, S.M.; Jang, H.H.; Lee, Y.M.; Kim, J.B. Identification and quantification of glucosinolates in Korean leaf mustard germplasm (Brassica juncea var. integrifolia) by liquid chromatography–electrospray ionization/tandem mass spectrometry. Eur. Food Res. Technol. 2016, 242, 1479–1484. [Google Scholar] [CrossRef] [Green Version]
  24. Sahamishirazi, S.; Zikeli, S.; Fleck, M.; Claupein, W.; Graeff-Hoenninger, S. Development of a near-infrared spectroscopy method (NIRS) for fast analysis of total, indolic, aliphatic and individual glucosinolates in new bred open pollinating genotypes of broccoli (Brassica oleracea convar. botrytis var. italica). Food Chem. 2017, 232, 272–277. [Google Scholar] [CrossRef]
  25. Agati, G.; Tuccio, L.; Kusznierewicz, B.; Chmiel, T.; Bartoszek, A.; Kowalski, A.; Grzegorzewska, M.; Kosson, R.; Kaniszewski, S. Nondestructive Optical Sensing of Flavonols and Chlorophyll in White Head Cabbage (Brassica oleraceaL. var.capitatasubvar.alba) Grown under Different Nitrogen Regimens. J. Agric. Food Chem. 2016, 64, 85–94. [Google Scholar] [CrossRef]
  26. Lin, K.-H.; Shih, F.-C.; Huang, M.-Y.; Weng, J.-H. Physiological Characteristics of Photosynthesis in Yellow-Green, Green and Dark-Green Chinese Kale (Brassica oleracea L. var. alboglabra Musil.) under Varying Light Intensities. Plants 2020, 9, 960. [Google Scholar] [CrossRef]
  27. Chung, S.O.; Chowdhury, M.; Ngo, V.D.; Jang, B.E.; Han, M.W.; Ko, H.J. Comparing Models and Wavelength Bands for Es-Timation of Functional Components of Kale and Chinese Cabbage. Available online: https://www.researchgate.net/profile/Milon_Chowdhury2/publication/343704587_Comparing_models_and_wavelength_bands_for_estimation_of_functional_components_of_Kale_and_Chinese_cabbage/links/5f3b24c5299bf13404cd4863/Comparing-models-and-wavelength-bands-for-estimation-of-functional-components-of-Kale-and-Chinese-cabbage.pdf (accessed on 25 January 2021).
  28. Noisopa, C.; Prapagdee, B.; Navanugraha, C.; Hutacharoen, R. Effects of bio-extracts on the growth of chinese kale. Agric. Nat. Resour. 2010, 44, 808–815. [Google Scholar]
  29. Filho, A.B.C.; Bianco, M.S.; Tardivo, C.F.; Pugina, G.C. Agronomic viability of New Zealand spinach and kale intercropping. An. Acad. Bras. Ciências 2017, 89, 2975–2986. [Google Scholar] [CrossRef] [PubMed] [Green Version]
  30. Kim, K.H.; Chung, S.O. Comparison of plant growth and glucosinolates of Chinese cabbage and kale crops under three cul-tivation conditions. J. Biosyst. Eng. 2018, 43, 30–36. [Google Scholar] [CrossRef]
  31. Kozai, T. Smart Plant Factory: The Next Generation Indoor Vertical Farms; Springer: Berlin/Heidelberg, Germany, 2018. [Google Scholar]
  32. Chowdhury, M.; Jang, B.; Kabir, M.; Kim, Y.; Na, K.; Park, S.; Chung, S. Factors affecting the accuracy and precision of ion-selective electrodes for hydroponic nutrient supply systems. Acta Hortic. 2020, 997–1004. [Google Scholar] [CrossRef]
  33. Kozai, T.; Niu, G.; Takagaki, M. Plant Factory: An Indoor Vertical Farming System for Efficient Quality Food Production; Academic Press: San Diego, CA, USA, 2015. [Google Scholar]
  34. Yi, G.-E.; Robin, A.H.K.; Yang, K.; Park, J.-I.; Kang, J.-G.; Yang, T.-J.; Nou, I.-S. Identification and Expression Analysis of Glucosinolate Biosynthetic Genes and Estimation of Glucosinolate Contents in Edible Organs of Brassica oleracea Subspecies. Molecules 2015, 20, 13089–13111. [Google Scholar] [CrossRef]
  35. Yoon, H.I.; Kim, J.-S.; Kim, D.; Kim, C.Y.; Son, J.E. Harvest strategies to maximize the annual production of bioactive compounds, glucosinolates, and total antioxidant activities of kale in plant factories. Hortic. Environ. Biotechnol. 2019, 60, 883–894. [Google Scholar] [CrossRef]
  36. Carter, S.; Shackley, S.; Sohi, S.; Suy, T.B.; Haefele, S. The Impact of Biochar Application on Soil Properties and Plant Growth of Pot Grown Lettuce (Lactuca sativa) and Cabbage (Brassica chinensis). Agronomy 2013, 3, 404–418. [Google Scholar] [CrossRef] [Green Version]
  37. Ngo, V.-D.; Kang, S.-W.; Ryu, D.-K.; Chung, S.-O.; Park, S.-U.; Kim, S.-J.; Park, J.-T. Location of Sampling Points in Optical Reflectance Measurements of Chinese Cabbage and Kale Leaves. J. Biosyst. Eng. 2015, 40, 115–123. [Google Scholar] [CrossRef] [Green Version]
  38. Lefsrud, M.; Kopsell, D.; Wenzel, A.; Sheehan, J. Changes in kale (Brassica oleracea L. var. acephala) carotenoid and chlorophyll pigment concentrations during leaf ontogeny. Sci. Hortic. 2007, 112, 136–141. [Google Scholar] [CrossRef]
  39. Chung, S.-O.; Kang, S.-W.; Bae, K.-S.; Ryu, M.-J.; Kim, Y.-J. The potential of remote monitoring and control of protected crop production environment using mobile phone under 3G and Wi-Fi communication conditions. Eng. Agric. Environ. Food 2015, 8, 251–256. [Google Scholar] [CrossRef]
  40. Chung, S.-O.; Ngo, V.-D.; Kabir, S.N.; Hong, S.-J.; Park, S.-U.; Kim, S.-J.; Park, J.-T. Number of sampling leaves for reflectance measurement of Chinese cabbage and kale. Korean J. Agric. Sci. 2014, 41, 169–175. [Google Scholar] [CrossRef] [Green Version]
  41. Kim, S.-J.; Ishii, G. Glucosinolate profiles in the seeds, leaves and roots of rocket salad (Eruca sativaMill.) and anti-oxidative activities of intact plant powder and purified 4-methoxyglucobrassicin. Soil Sci. Plant. Nutr. 2006, 52, 394–400. [Google Scholar] [CrossRef]
  42. Park, N.I.; Li, X.; Suzuki, T.; Kim, S.-J.; Woo, S.-H.; Park, C.H.; Park, S.U. Differential Expression of Anthocyanin Biosynthetic Genes and Anthocyanin Accumulation in Tartary Buckwheat Cultivars ‘Hokkai T8’ and ‘Hokkai T10’. J. Agric. Food Chem. 2011, 59, 2356–2361. [Google Scholar] [CrossRef]
  43. Park, W.T.; Kim, J.K.; Park, S.; Lee, S.-W.; Li, X.; Kim, Y.B.; Uddin, R.; Park, N.I.; Kim, S.-J.; Park, S.U. Metabolic Profiling of Glucosinolates, Anthocyanins, Carotenoids, and Other Secondary Metabolites in Kohlrabi (Brassica oleraceavar.gongylodes). J. Agric. Food Chem. 2012, 60, 8111–8116. [Google Scholar] [CrossRef]
  44. Jeong, K.Y.; Kim, J.K.; Kim, H.; Kim, Y.J.; Park, Y.J.; Kim, S.J.; Kim, C.; Park, S.U. Transcriptome analysis and metabolic profiling of green and red kale (Brassica oleracea var. acephala) seedlings. Food Chem. 2018, 241, 7–13. [Google Scholar] [CrossRef]
  45. Brooks, M.S.L.; Celli, G.B. Anthocyanins From Natural Sources: Exploiting Targeted Delivery for Improved Health; Royal Society of Chemistry: London, UK, 2019; Volume 12. [Google Scholar]
  46. Luthria, D.L.; Mukhopadhyay, S.; Lin, L.-Z.; Harnly, J.M. A Comparison of Analytical and Data Preprocessing Methods for Spectral Fingerprinting. Appl. Spectrosc. 2011, 65, 250–259. [Google Scholar] [CrossRef] [Green Version]
  47. Osborne, J.W. Improving your data transformations: Applying the Box-Cox transformation. Pract. Assess. Res. Eval. 2010, 15, 1–9. [Google Scholar]
  48. Kawamura, K.; Tsujimoto, Y.; Rabenarivo, M.; Asai, H.; Andriamananjara, A.; Rakotoson, T. Vis-NIR Spectroscopy and PLS Regression with Waveband Selection for Estimating the Total C and N of Paddy Soils in Madagascar. Remote Sens. 2017, 9, 1081. [Google Scholar] [CrossRef] [Green Version]
  49. Mahesh, S.; Jayas, D.S.; Paliwal, J.; White, N.D.G. Comparison of Partial Least Squares Regression (PLSR) and Principal Components Regression (PCR) Methods for Protein and Hardness Predictions using the Near-Infrared (NIR) Hyperspectral Images of Bulk Samples of Canadian Wheat. Food Bioprocess. Technol. 2015, 8, 31–40. [Google Scholar] [CrossRef]
  50. Yaroshchyk, P.; Death, D.L.; Spencer, S.J. Comparison of principal components regression, partial least squares regression, multi-block partial least squares regression, and serial partial least squares regression algorithms for the analysis of Fe in iron ore using LIBS. J. Anal. At. Spectrom. 2012, 27, 92–98. [Google Scholar] [CrossRef]
  51. Ghani, I.M.M.; Ahmad, S. Stepwise Multiple Regression Method to Forecast Fish Landing. Procedia-Soc. Behav. Sci. 2010, 8, 549–554. [Google Scholar] [CrossRef] [Green Version]
  52. Zhan, X.; Liang, X.; Xu, G.; Zhou, L. Influence of plant root morphology and tissue composition on phenanthrene uptake: Stepwise multiple linear regression analysis. Environ. Pollut. 2013, 179, 294–300. [Google Scholar] [CrossRef]
  53. Neto, A.J.S.; Moura, L.D.O.; Lopes, D.D.C.; Carlos, L.D.A.; Martins, L.M.; Ferraz, L.D.C.L. Non-destructive prediction of pigment content in lettuce based on visible-NIR spectroscopy. J. Sci. Food Agric. 2016, 97, 2015–2022. [Google Scholar] [CrossRef]
  54. Kira, O.; Linker, R.; Gitelson, A. Non-destructive estimation of foliar chlorophyll and carotenoid contents: Focus on informative spectral bands. Int. J. Appl. Earth Obs. Geoinf. 2015, 38, 251–260. [Google Scholar] [CrossRef]
  55. Velasco, P.; Cartea, M.E.; González, M.E.C.; Vilar, M.; Ordás, A. Factors Affecting the Glucosinolate Content of Kale (Brassica oleraceaacephala Group). J. Agric. Food Chem. 2007, 55, 955–962. [Google Scholar] [CrossRef]
  56. Toledo-Martín, E.M.; Font, R.; Obregón-Cano, S.; De Haro-Bailón, A.; Villatoro-Pulido, M.; Del Río-Celestino, M. Rapid and Cost-Effective Quantification of Glucosinolates and Total Phenolic Content in Rocket Leaves by Visible/Near-Infrared Spectroscopy. Molecules 2017, 22, 851. [Google Scholar] [CrossRef] [Green Version]
  57. Steindal, A.L.H.; Rødven, R.; Hansen, E.; Mølmann, J. Effects of photoperiod, growth temperature and cold acclimatisation on glucosinolates, sugars and fatty acids in kale. Food Chem. 2015, 174, 44–51. [Google Scholar] [CrossRef]
  58. Dou, H.; Niu, G.; Gu, M.; Masabni, J. Morphological and Physiological Responses in Basil and Brassica Species to Different Proportions of Red, Blue, and Green Wavelengths in Indoor Vertical Farming. J. Am. Soc. Hortic. Sci. 2020, 145, 267–278. [Google Scholar] [CrossRef]
  59. Pérez-López, U.; Miranda-Apodaca, J.; Muñoz-Rueda, A.; Mena-Petite, A. Interacting effects of high light and elevated CO2 on the nutraceutical quality of two differently pigmented Lactuca sativa cultivars (Blonde of Paris Batavia and Oak Leaf). Sci. Hortic. 2015, 191, 38–48. [Google Scholar] [CrossRef]
  60. Marin, A.; Ferreres, F.; Barberá, G.G.; Gil, M.I. Weather Variability Influences Color and Phenolic Content of Pigmented Baby Leaf Lettuces throughout the Season. J. Agric. Food Chem. 2015, 63, 1673–1681. [Google Scholar] [CrossRef] [PubMed]
  61. Alrifai, O.; Hao, X.; Marcone, M.F.; Tsao, R. Current Review of the Modulatory Effects of LED Lights on Photosynthesis of Secondary Metabolites and Future Perspectives of Microgreen Vegetables. J. Agric. Food Chem. 2019, 67, 6075–6090. [Google Scholar] [CrossRef]
  62. Nosenko, T.; Hutsalo, I.; Nosenko, V.; Levchuk, I.; Litvynchuk, S. Analysis of near infrared reflectance spectrum of rape seed with different content of erucic acid. Ukr. J. Food Sci. 2013, 94–99. [Google Scholar]
  63. Challinor, A.J.; Parkes, B.; Ramírez-Villegas, J. Crop yield response to climate change varies with cropping intensity. Glob. Chang. Biol. 2015, 21, 1679–1688. [Google Scholar] [CrossRef] [PubMed] [Green Version]
Figure 1. (a) Photo of the experimental plant factory and (b) ambient environment monitoring and control system.
Horticulturae 07 00056 g001
Figure 2. Kale growth after different periods of transplantation for (a) 0 day, (b) 2 weeks, and (c) 4 weeks after transplantation. (d) Selected plant for sampling and (e) harvested leaf sample for reflectance acquisition and functional components analysis.
Horticulturae 07 00056 g002
Figure 3. Reflectance spectra acquisition: (a) locations of spectral reflectance measurement and (b) spectral data acquisition system.
Horticulturae 07 00056 g003
Figure 4. Reflectance spectra for low and high glucosinolates and anthocyanins contents in the kale leaves.
Horticulturae 07 00056 g004
Figure 5. Representation of the correlation coefficients between the spectral reflectance and sinigrin content over the entire wavelength range.
Horticulturae 07 00056 g005
Figure 6. B-coefficient analysis performed by the PCR (top) and PLSR (bottom) models using square power of reflectance data for glucobrassicin.
Horticulturae 07 00056 g006
Table 1. Summary of the target and obtained levels of each treatment along with the specification of sensors used during the cultivation period of kale plants in the plant factory.
Environmental FactorsExperimental Treatments Specification of the Used Sensors
Target LevelsObtained Levels
Temperature (°C)14 ± 1
17 ± 1
20 ± 1
23 ± 1
25 ± 1
14.58 ± 0.74
17.34 ± 1.8
20.25 ± 0.69
23.26 ± 0.52
25.97 ± 1.64
Model: ETH-01DV
Range: −40~125 ℃
Resolution: 14 bit
Accuracy: ± 1.3 ℃
Humidity (%)45 ± 5
55 ± 5
65 ± 5
75 ± 5
85 ± 5
45.78 ± 6.23
58.06 ± 4.35
67.66 ± 4.67
72.66 ± 4.49
83.85 ± 4.65
Model: ETH-01DV
Range: 0~100%
Resolution: 14bit
Accuracy: ± 4.5%
CO2 (ppm)400 ± 100
700 ± 100
1000 ± 100
1300 ± 100
1600 ± 100
475.62 ± 106.3
723.9 ± 140.6
1008.75 ± 175.36
1375.5 ± 125.11
1693.21 ± 137.2
Model: SH-300-DX
Range: 0 ~ 5000 ppm
Response time: < 30 s
Accuracy: ± 2%
Light source (light emitting diode color ratio)1 R:B:W, R:B, R:W, Fluorescent--
Photosynthetic photon flux density (µmol m−2s−1)100, 130, 160, 190, 220-Model: GY-30
Range: 1–65,535 lux
Resolution: 16-bit
Accuracy: ± 3%
Photoperiod (day/night hours)12/12, 14/10, 16/8, 18/6, 20/4-Time switch: MaxiRex 5QT
Prds rating: AC 230 V, 60 Hz Load capacity: 16 A
Electrical conduction (µS cm−1)0.80 ± 0.2
1.00 ± 0.2
1.20 ± 0.2
1.40 ± 0.2
1.60 ± 0.2
0.86 ± 0.3
1.02 ± 0.34
1.28 ± 0.22
1.39 ± 0.24
1.63 ± 0.25
Model: conductivity probe
Range: 2~20,000 μScm−1
Resolution: 10 μScm−1
Accuracy: ± 4%
1 R, red; B, blue; W, white.
Table 2. Content summary of the glucosinolate and anthocyanin components of the kale sample leaves analyzed in the laboratory using high-performance liquid chromatography (HPLC).
FactorsTreatments
2nd Week after Transplantation4th Week after Transplantation
Temperature (°C)14172023261417202326
Yield (mg)11.91 ± 1.212.59 ± 0.313.31 ± 0.213.02 ± 0.313.24 ± 0.321.30 ± 4.123.64 ± 6.228.29 ± 4.325.38 ± 3.222.15 ± 4.8
Total GLSs 1 (μmol g−1 DW) 186.21 ± 5.965.24 ± 13.446.32 ± 19.229.75 ± 14.113.81 ± 7.737.12 ± 17.433.80 ± 5.123.94 ± 5.522.42 ± 20.112.42 ± 0.5
ATCs2 (µg g−1)8.9 ± 6.247.9 ± 4.365.4 ± 2.5100.5 ± 8.490.8 ± 18.229.2 ± 23.451.1 ± 48.1126.4 ± 110.9180.5 ± 57.4133.6 ± 56.7
Humidity (%)45556575854555657585
Yield (mg)5.5 ± 0.18.22 ± 1.26.33 ± 1.47.76 ± 1.18.89 ± 1.523.42 ± 9.229.39 ± 3.533.01 ± 4.925.67 ± 0.934.76 ± 6.8
Total GLSs (μmol g−1 DW) 11.54 ± 1.541.62 ± 1.61.17 ± 1.21.18 ± 1.21.17 ± 1.20.86 ± 0.30.99 ± 0.21.12 ± 0.30.88 ± 0.10.87 ± 0.2
ATCs (µg g−1)97.1 ± 37.4116.9 ± 47.2164.8 ± 40.7107.1 ± 89.9146.1 ± 29.675.9 ± 67.085.7 ± 23.9174 ± 17.5133.6 ± 115.7117 ± 105.9
CO2 (ppm)400700100013001600400700100013001600
Yield (mg)10.01 ± 1.811.33 ± 1.710.38 ± 1.48.91 ± 0.47.49 ± 0.622.15 ± 4.828.38 ± 3.218.29 ± 4.323.64 ± 6.225.30 ± 4.1
Total GLSs (μmol g−1 DW) 13.06 ± 0.32.37 ± 0.43.71 ± 0.88.08 ± 4.13.87 ± 0.83.64 ± 1.52.42 ± 0.92.20 ± 0.35.08 ± 0.84.48 ± 2.5
ATCs (µg g−1)258.5 ± 96.9285.7 ± 74.7249.4 ± 24.4279.4 ± 124.2220.1 ± 19.9224.2 ± 79.8287.8 ± 18.0313.16 ± 112.1322.70 ± 45.1171.5 ± 47.70
Light source 3R:B:WR:BR:WF
-
R:B:WR:BR:WF
-
Yield (mg)12.7 ± 0.3914.1 ± 0.7711.9 ± 0.1610.3 ± 0.27
-
23 ± 1.721.9 ± 1.720.7± 2.417.3 ± 2.3
-
Total GLSs (μmol g−1 DW) 149.33 ± 66.8014.27 ± 5.3115.42 ± 13.3063.38 ± 68.02
-
79.05 ± 25.37118.51 ± 16.3399.04 ± 63.11103.14 ± 13.42
-
Intensity (µmol m−2s−1)100130160190220100130160190220
Yield (mg)9.45 ± 0.828.37 ± 0.216.23 ± 0.3612.72 ± 0.278.3 ± 0.2517.24 ± 2.318.5 ± 1.7424.48 ± 1.627.57 ± 0.7418.07 ± 0.66
Total GLSs (μmol g−1 DW) 19.08 ± 6.815.18 ± 0.611.16 ± 5.810.81 ± 5.110.93 ± 7.733.39 ± 2.2293.17 ± 0.911.21 ± 3.720.54 ± 12.124.75 ± 14.9
Photoperiod (h)12/1214/1016/818/620/412/1214/1016/818/620/4
Yield (mg)9.5 ± 0.918.6 ±0.4012.23 ± 0.3610.21 ± 0.477.6 ± 0.528.45 ± 2.1818.71 ± 0.4824.48 ± 1.5819.21 ± 0.4917.75 ± 0.53
Total GLSs (μmol g−1 DW) 19.22 ± 4.89.01 ± 4.011.16 ± 5.821.21 ± 2.76.50 ± 0.919.35 ± 9.928.23 ± 16.911.21 ± 3.713.78 ± 12.15.46 ± 2.1
EC (µS cm−1)0.801.001.201.401.600.801.001.201.401.60
Yield (mg)14.0 ±0.916.8 ±1.517.4 ± 0.315.4 ± 1.614.4 ± 1.133.0 ± 2.245.6 ± 1.534.9 ± 0.424.0 ± 1.230.3 ± 1.8
Total GLSs (μmol g−1 DW) 191.50 ± 30.7782.89 ± 52.70166.93 ± 23.9892.75 ± 11.08169.99 ± 14.5988.01 ± 33.4042.59 ± 23.7076.03 ± 12.98 96.15 ± 27.3592.41 ± 33.37
1 GLSc, glucosinolates, 2 ATCs, anthocyanins, 3 R, red; B, blue; W, white.
Table 3. Content summary of the glucosinolate and anthocyanin components of the kale sample leaves analyzed in the laboratory using HPLC.
ComponentNo. of SamplesMinMaxMean ± STD
Glucosinolates (μmol g−1 DW) 1Progoitrin551.4396.3264.57 ± 44.06
Sinigrin1570.0514.526.62 ± 9.19
Glucoalyssin220.746.032.77 ± 4.49
Glucobrassicanapin71.854.232.52 ± 1.20
Glucobrassicin1870.0516.778.29 ± 12.63
4-methoxyglucobrassicin1490.022.581.06 ± 1.72
Gluconasturtiin231.263.350.75 ± 1.05
Neoglucobrassicin1460.031.560.81 ± 1.06
Glucoraphanin390.295.23.25 ± 5.51
Gluconapin860.131.690.78 ± 0.90
Anthocyanins (µg g−1)Cyanidin720.02217.56135.98 ± 93.91
Pelargonidin710.020.250.13 ± 0.11
Delphinidin330.030.220.07 ± 0.10
Malvidin680.0711.827.39 ± 4.83
1 DW: dry weight.
Table 4. Summary of raw reflectance data analysis using PCR, PLSR, and SMLR models over the wavelength region (from 300 to 1050 nm).
ComponentsPCRPLSRSMLR
R2RMSER2RMSER2RMSE
Glucosinolates (μmol g−1 DW)Sinigrin0.383.020.632.330.841.44
Glucobrassicin0.233.690.901.300.920.90
4-methoxyglucobrassicin0.440.490.620.410.840.24
Neoglucobrassicin0.460.250.610.210.850.12
Gluconapin0.350.350.530.290.890.12
Anthocyanins (µg g−1)Cyanidin0.2854.630.5642.540.1460.37
Malvidin0.442.550.911.040.672.09
Pelargonidin0.420.040.740.030.460.04
Table 5. Summary of transformed reflectance data analysis using PCR, PLSR, and SMLR models over the wavelength region from 300 to 1050 nm.
ComponentsTransformationPCRPLSRSMLR
R2RMSER2RMSER2RMSE
Glucosinolate (μmol g−1 DW)SinigrinRef20.353.110.642.300.841.41
√Ref 0.412.950.652.270.851.56
eRef0.402.970.502.720.841.43
1/Ref0.013.820.093.660.851.36
Ln(Ref)0.412.960.592.450.861.32
GlucobrassicinRef20.293.550.353.380.911.04
√Ref 0.233.690.960.780.911.06
eRef0.283.560.602.670.881.30
1/Ref0.024.180.0024.210.920.88
Ln(Ref)0.243.670.861.570.920.88
4-ethoxyglucobrassicinRef20.400.510.600.410.830.25
√Ref 0.460.480.650.390.860.22
eRef0.420.500.620.400.820.26
1/Ref0.040.650.040.650.870.21
Ln(Ref)0.440.490.800.290.860.23
NeoglucobrassicinRef20.380.270.620.210.860.12
√Ref 0.420.260.630.200.850.12
eRef0.430.250.620.210.820.14
1/Ref0.060.330.100.320.860.12
Ln(Ref)0.420.260.770.160.870.11
GluconapinRef20.200.380.680.240.880.12
√Ref 0.500.300.860.160.890.12
eRef0.370.340.610.270.890.12
1/Ref0.140.400.200.390.880.13
Ln(Ref)0.510.300.880.150.890.12
Anthocyanins (µg g−1)CyanidinRef20.0264.380.00464.260.1660
√Ref 0.2456.180.5045.540.1460.58
eRef0.2754.860.4647.290.1460.78
1/Ref0.0164.150.0164.090.1261.29
Ln(Ref)0.2057.390.6836.590.1360.81
MalvidinRef20.033.410.362.730.223.08
√Ref 0.422.600.960.630.711.97
eRef0.422.600.861.300.123.28
1/Ref0.023.410.023.380.482.55
Ln(Ref)0.412.620.970.610.741.90
PelargonidinRef20.010.060.0020.060.400.04
√Ref 0.500.040.690.030.450.04
eRef0.360.040.660.030.080.05
1/Ref0.020.060.030.060.090.05
Ln(Ref)0.360.040.910.020.380.04
Table 6. Dominating glucosinolate components of different plants cultivated under different conditions and analyzed by HPLC and reflectance spectroscopy methods.
PlantCultivation MethodDominating Component (Analyzed by HPLC)Dominating Component (Analyzed by Spectroscopy)Wavelengths (nm)
KaleAeroponic (Plant factory)Progoitrin, SinigrinSinigrin, Glucobrassicin742, 761, 787, 796, 805, 833, 855, 932, 947, 1000
KaleSoil-based
(Closed-chamber)
Glucoiberin, Glucoraphanin, Sinigrin--
KaleOpen fieldGlucobrassicin, Sinigrin--
Chinese cabbageAeroponic (Plant factory)Neoglucobrassicin, 4-methoxyglucobrassicinGlucobrassicin, 4-methoxyglucobrassicin365, 388, 440, 545, 607, 651, 798, 838, 860, 870, 932, 950
Mustard leafOpen fieldSinigrin, Glucoiberverin, Gluconasturtiin--
Rocket
Leaf
Soil-based
(Greenhouse)
-Glucoerucin, Gluconasturtiin,4-hydroxyglucobrassicin548, 610, 680, 1432, 1696, 1730, 1920, 2054
Publisher’s Note: MDPI stays neutral with regard to jurisdictional claims in published maps and institutional affiliations.

