Article

Effects of Fertigation Management on the Quality of Organic Legumes Grown in Protected Cultivation

by
María del Carmen García-García
1,*,
Rafael Font
2,
Pedro Gómez
1,
Juan Luis Valenzuela
3,
Juan A. Fernández
4 and
Mercedes Del Río-Celestino
2
1
Department of Agro-Food Engineering and Technology, IFAPA Centro La Mojonera, CAGPDS, 04745 Almería, Spain
2
Agri-Food Laboratory, CAGPDS, Avda, Menéndez Pidal, s/n, 14080 Córdoba, Spain
3
Department of Biology and Geology, Higher Engineering School, University of Almería, 04120 Almería, Spain
4
Department of Agronomical Engineering, Technical University of Cartagena, 30203 Murcia, Spain
*
Author to whom correspondence should be addressed.
Horticulturae 2021, 7(2), 28; https://doi.org/10.3390/horticulturae7020028
Submission received: 24 December 2020 / Revised: 2 February 2021 / Accepted: 4 February 2021 / Published: 7 February 2021

Abstract

:
Appropriate fertigation management plays an important role in increasing crop quality and economizing water. The objective of the study was to determine the effects of two fertigation treatments, normal (T100) and 50% sustained deficit (T50), on the physico-chemical quality of legumes. The determinations were performed on the edible parts of peas, French beans and mangetout. The trials were conducted in a protected cultivation certified organic farm. The response of legumes to the treatments varied between the cultivars tested. The fertigation treatments had a significant effect on the morphometric traits (width for mangetout and French bean; fresh weight for French bean; seed height for Pea cv. Lincoln). The total soluble solids and citric acid content have been shown to be increased by low soil water availability (T50) for mangetout. Fertigation treatments did not significantly affect the antioxidant compounds (total phenolic and ascorbic acid), minerals and protein fraction contents of legumes studied. Regarding legume health benefits, the most prominent cultivars were BC-033620 pea and French bean because of their high total phenolic (65 mg gallic acid equivalent 100 g−1 fresh weight) and ascorbic acid content (55 mg ascorbic acid 100 g−1 fresh weight), respectively. The results expand our knowledge concerning the nutraceutical quality and appropriate cultivation methods of legumes in order to make the system more sustainable and to encourage their consumption.

1. Introduction

The production of greenhouse crops in Almería (Southeast Spain) accounts for 3.3 million tons, with a surface of 30,000 ha and a value of €1782.4 million. In terms of organic production, Almería ranks first among all Spanish provinces, with more than 3000 ha of greenhouses [1]. Since legumes for consumption of pods and fresh grain are not major crops in the greenhouses of Spain, they can be considered an important alternative, providing diversification in the organic cultivation of legumes under greenhouse conditions. The most economically important legumes consumed as vegetables are green pods of cowpea, snow pea (mangetout), common bean, faba bean, and green pea seeds.
Legumes constitute one of the most important botanical families (Papilionaceae or Fabaceae) from a socioeconomic point of view, with significant implications for agriculture, the environment and food. They are a valuable source of proteins for both animal and human food [2], with known health benefits [3,4], being one of the basic pillars of the Mediterranean diet. Numerous studies show the beneficial role of the consumption of legumes for health, including blood pressure and cholesterol levels [5]; high soluble fibre and oligosaccharide content has been associated with an improvement in gastrointestinal health [6,7], and these can also play an important role in diabetes prevention and treatment [8].
Among the different legumes, the most widely eaten in the Mediterranean diet are French beans (Phaseolus vulgaris) and peas (Pisum ssp.) (Figure 1). Peas can be cultivated with the aim of obtaining dry and fresh peas (P. sativum L.) but also as P. sativum L. ssp. arvense, which are absent parchment pods, sweet, crisp and colloquially known as tirabeque or mangetout.
In recent decades, many studies have been conducted to optimize the nutrient and water supply for maximizing crop yield and quality as well as minimizing leaching below the rooting volume according to crop requirements e.g., [9,10]. However, the scarcity of water in some intensive horticultural areas like Almería has resulted in the implementation of new sustainable technological adaptations based on improvements in water use efficiency through automated fertigation, localized irrigation systems and the use of tensiometers [11]. Nowadays, most greenhouses in the region have automated fertigation systems, allowing farmers to have greater control of irrigation parameters [12].
Nevertheless, published research results regarding the impact of fertigation on quality characteristics of green pods are scarce. Thus, previous studies have found significantly different effects on quality parameters such as length, width, number of seeds per pod, fresh fruit weight and pod colour (L* and a* parameters) in French bean (Phaseolus vulgaris L.) pods under both fertigation levels and frequencies [13]. Indeed, as reported by the above-mentioned authors, large fertigation intervals reduced the colour brightness (L* parameter) and increased the pod greenness (a* parameter) in French bean pods. Moreover, irrigation management could influence green pod quality. Thus, the application volume of irrigation water based on replacing 80% of evapotranspiration improved the pod parameters and nutritional composition of green beans [14]. Furthermore, inadequate supply of irrigation water to French beans may also increase the fibre content in pods, as indicated by the results of Singer et al. [15] obtained after a reduction in the water supply from 100% to 75% or 50% of the field capacity.
Since the fundamental principles of organic farming are the preservation of natural resources and the increase in biodiversity, the objective of this work was to study the effect of reducing the dose of fertigation and, consequently, the dose of irrigation on the physico-chemical quality of different legume cultivars (French beans, mangetout and peas) under protected organic conditions.

2. Materials and Methods

2.1. Experimental Framework, Plant Species and Applied Treatments

Four legume cultivars were used: French bean “Helda” (Phaseolus vulgaris L.), mangetout “Tirabí” (Pisum sativum L. ssp. arvense), pea cv. BGE-033620 (Pisum sativum L.) from: Spanish germplasm bank of the Centro de Recursos Fitogenéticos-INIA (Instituto Nacional de Investigación y Tecnología Agraria y Alimentaria and a commercial pea cv. Lincoln (Pisum sativum L.).
The experimental trial was carried out in the Ifapa Center La Mojonera, in the province of Almería, South-East Spain. The crops were grown in a greenhouse of 1600 m2. The type of greenhouse was a symmetrical multi-tunnel, without active climate control, although equipped with temperature and humidity meters, fertigation system and officially certified as organic by an accredited company within the previous 15 years. The minimum, average and maximum relative humidity were 35.8, 74.3, and 98.1%, respectively. The minimum, average and maximum air temperature were 12.2, 17.2, and 26.2 °C, respectively. Pests and diseases were monitored weekly and biological control was applied as the main control method.
Sheep manure was applied to the soil at a dose of 0.7 kg m−2 and with a percentage composition of dry matter corresponding to 45.6%; 17.7 g kg−1 total nitrogen; 520.0 mg kg−1 nitrate; 2.2 g kg−1 phosphorus; 16.5 g kg−1 potassium; 889.0 mg kg−1 ammonium; 100.9 g kg−1 calcium. All fertilizers are listed in Annex I of the EU Regulation (Commission Regulation (EC) No. 889/2008). The legumes were transplanted in October 2016, with a density of 2 plants m−2.
Fertigation was applied by a controller, via drip fertigation and a nutrient solution prepared with groundwater pH 7.3, regulated to 6.5 by acetic acid. The fertigation controller was composed of a programmer with venturis injectors and four fertilizer tanks with the following solutions: tank A: chelated calcium (MgO 0.5% + CaO 15%) and microelements; tank B: humic and fulvic acids (total humic extract 26% w/w; humic acids 10% w/w + fulvic acids 16% w/w); tank C: potassium sulphate (K2O 52% + SO3 45%); tank D (injectors): amino acids (free amino acids 24% w/w + total nitrogen 3.3% w/w, organic nitrogen 3% w/w and ammonia nitrogen 0.3% w/w). A final electric conductivity (EC) of 2.4 dS m−1 was reached.
Two treatments, T100 and T50, were arranged in a randomized complete design. T100 consisted of water and fertilizer provided according to fertigation management. This programming was carried out through the use of 3 tensiometers installed at a depth of 15 centimetres, randomly allocated in the 100% treatment plots. The command used was to fertigate when the average of the tensiometers located only in the plot of T100 was 22 cb, matric potential usually applied in horticultural greenhouses in Almeria [16]. T50 consisted of the water supply corresponding to half the fertigation time compared to T100. The concentration of the nutrient solution provided in each treatment was the same, therefore, T100 consists of double the amount of water and fertilizer as T50. Fertigation times of the two treatments were varied throughout the cultivation. During the period of maximum crop growth, it was fertigated for 30 min for T100 and half of that time (15 min) for T50. At the end of the trial, the total water volume applied in T100 was 60 L m−2 and 30 L m−2 for T50.
The soil texture was sandy clay loam, determined by Bouyoucos-hydrometer analysis [17]; pH and electrical conductivity (EC) were determined in the saturated extract by pHmeter (model MicropH 2002 Crison) and conductivity meter (model GLP31 Crison); Chemical elements were determined in the water extract from saturated soil paste. Organic matter was determined using the Walkley–Black method [18]. A soil analysis was carried out before planting and after harvesting of T100 and T50 treatments.
A total of 35 legume plants were grown per cultivar (BGE-033620, Lincoln, Helda, Tirabí), per replicate and for each treatment (T100 and T50). Legume-pod samples were taken from 10 randomly distributed plants in each replicate during the maximum production period. The samples for chemical analysis consisted of pods of French-bean and mangetout and pea grains, consistent with the edible format for each legume. Then, vegetal material was packaged in polypropylene plastic containers and sent to the laboratory for analysis.

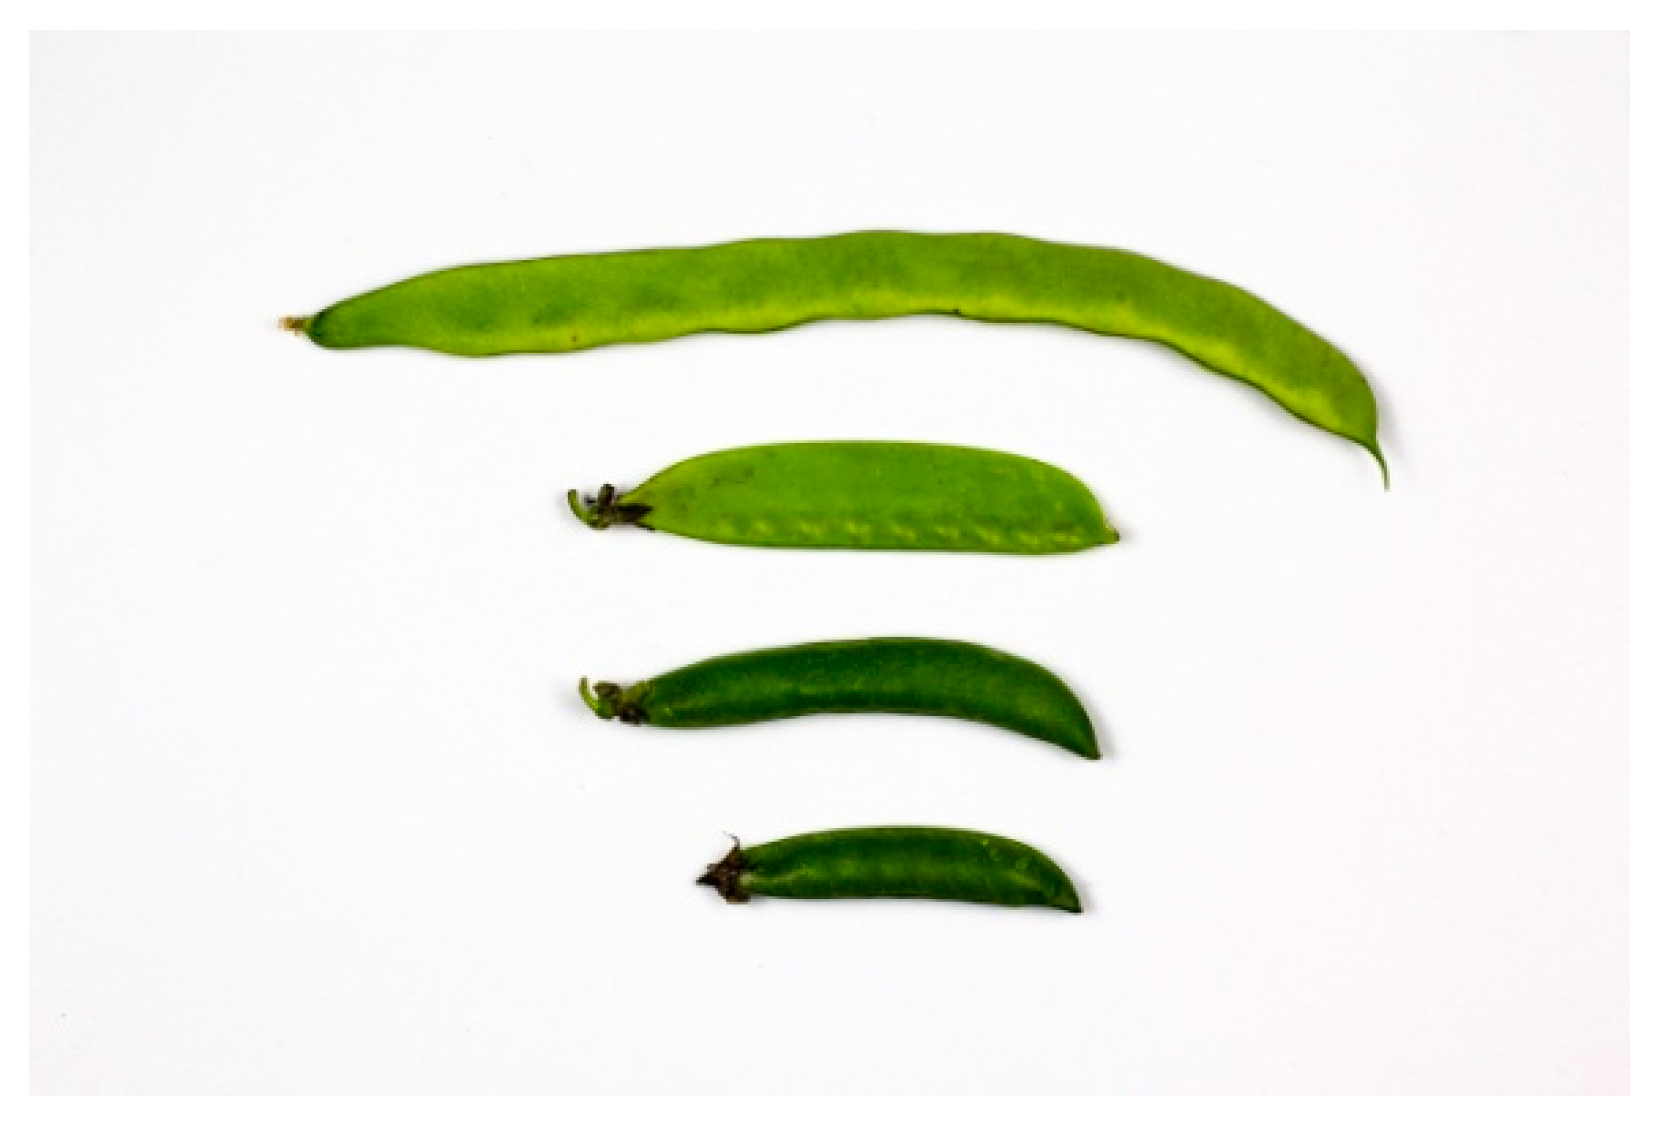
2.2. Physical Traits

The morphometry was determined by measuring the length, width and height of the pods (French bean and mangetout) and maximum and minimum diameter in peas with digital calibre Laser 4263.
The determination of fresh weight was measured with a precision digital balance Mettler Toledo XPE1203S. For the moisture determination, dry weight of the samples was calculated drying in a Memmert UF110 stove at 45 °C for 72 h. All determinations were carried out on pods. To determine fruit firmness, a texturometer was used on pods (Texture Analyzer TA.XT Plus, Stable Micro Systems Texture Analyzer, Surrey, UK) equipped with a fine-cut probe at a speed of 1 mm s−1, for 5 s. The colour was determined by a CM-700d portable colorimeter (Konica Minolta Sensing Americas, Inc. Ramsey, NJ, USA). The determinations of the Hue and Chroma colour parameters were made in two different external points of the pod’s equatorial plane with a colorimeter (model CR-200, Minolta, Ahrensburg, Germany).

2.3. Chemical Traits

All parameters were measured for the edible part of each legume: seeds for peas and pods for mangetout and French bean.
The juice was extracted from the fruits for the determination of the soluble solid content by means of a digital refractometer (Smart-1, Atago, Japan). Titratable acidity was measured by titrating 10 mL of juice with NaOH 0.1 N up to pH 8.2 using an automatic titrator (Metrohm 862 Compact. Titrosampler, Herisau, Suiza). Legume fruit acidity was reported as the percentage of citric acid. The pH value of the sample was determined using a digital pH meter (WTW pH 330; WTW; Weilheim, Germany) equipped with an electrode (Sen Tix 41; WTW, Weilheim, Germany).
Legumes (10 g) were mixed in a blender a stirred with 10 mL methanol. The mixture was homogenised (Polytron PT3100; Kinematica AG, Littau, Switzerland) and centrifuged at 4 °C (Beckman J2-21M/E; Beckman Instruments Inc., Fullerton, CA, USA) for 10 min. The supernatant was decanted into a 25 mL measuring flask. The pellet was resuspended in 10 mL 70% methanol in water (v/v), followed by centrifugation. The combined supernatants were diluted to 25 mL with 70% methanol. The extracts were frozen in small tubes at −80 °C until further analysis. The solution was diluted to volume (25 mL) with distilled deionised water. The solution was incubated at room temperature in the dark for 90 min, and the absorbance was read at 750 nm against a blank solution. Finally, results were reported in gallic acid equivalents (mg g−1 DW).
Total polyphenol content was determined according to the Folin–Ciocalteu procedure [19]. To the diluted methanol extract (200 µL), in a cuvette, 1 mL of Folin–Ciocalteu solution (diluted 1:10 in water) was added. After 2 min, 800 µL Na2CO3 (7.5%) was added, mixed for 5 s on a whirl mixer and incubated in the dark at room temperature for 60 min. The absorbance was measured at 765 nm with a ThermoSpectronic UV–visible Spectrometer (Thermo Fisher Scientific, Waltham, MA, USA). Gallic acid was used as standard and total phenolics were expressed as mg gallic acid equivalent (GAE) 100 g−1 fresh weight.
The reference values for Ascorbic Acid (AA) were obtained using an automatic titration (Metrohm, 862 Compact Titrosampler, Metrohm, Riverview, FL, USA) by the iodine titration method with minor modification [20]. Thus, 5 g of sample juice was mixed with distilled deioniser water until final weight of 50 g and treated with 2 mL glyoxal solution (40%), stirred briefly and allowed to stand for 5 min. After the addition of 5 mL sulphuric acid (25%), it was titrated with iodine (0.01 mol L−1) up to the endpoint (EP1). The linearity of the method was determined using AA as an external standard. Finally, the ascorbic acid content was expressed as mg g−1 fresh weight (FW).
For mineral composition determination of the legume cultivars, the dry mineralization method was used [21]. Dried samples in a furnace at 100 °C to constant weight were homogenized and then weighed into porcelain crucibles. Later, they were incinerated in a muffle furnace at 460 °C for 15 h. The ash was bleached after cooling by adding 2 mL of 2 mol L−1 nitric acid, then drying it on thermostatic hotplates and finally maintaining it in a muffle furnace at 460 °C for 1 h. Ash recovery was performed with 5 mL of 2 mol L−1 Suprapur nitric acid, making up to 15 mL with 0.1 mol L−1 Suprapur nitric acid. The determinations were carried out by flame atomic absorption spectrophotometry, except for Na and K, which were analysed by flame atomic emission. Elemental analyses were performed with a PerkinElmer (Waltham, MA, USA) model 2100 atomic absorption spectrophotometer equipped with a PerkinElmer AS-50 autosampler, standard air–acetylene flame and single-element hollow cathode lamps and background correction with deuterium lamp for Mn. The nitrogen (N) content was determined according to the Kjeldahl method [22] and the protein content was calculated (N × 6.25).
The quantification of the protein fraction content was determined in fresh pea grain (Lincoln and BGE-033620 cultivars). To obtain soluble protein 10 mg of pea flour was weighed and 1 M NaOH was added. The protein fractions were obtained based on the methods postulated by Hu and Esen [23] and Knabe et al. [24]. The protein fractionation of the legumes was performed with 4 different solvents: H2O, NaCl 0.5 M, 2-propanol (IPA) 70% and glacial acetic acid 50% for determining the albumin, globulin, prolamin and glutelin content, respectively. The supernatant absorbances were measured at 595 nm with a ThermoSpectronic UV–visible Spectrometer (Thermo Fisher Scientific, Waltham, MA, USA). A bovine serum albumin (BSA) dilution curve was used as standard [25]. The results were expressed in mg protein fraction per 100 g dry weight (DW).

2.4. Statistical Analyses

Physico-chemical data were subject to one-way analysis of variance (ANOVA), and Tukey’s multiple range test was used in cases where significance at p < 0.05 variance was found among treatments (T50 and T100) per each cultivar. Statistical analyses were performed using SPSS 13.0 (SPSS Inc., Chicago, IL, USA).

3. Results and Discussion

3.1. Soil Analysis

The saturated extract soil indicates what plants can take from soil when irrigation water and solubilized and minerals are applied. The EC of the samples collected from the T50 (2.79 dS·m−1) after harvesting were higher compared to the T100 treatment (4.45 dS·m−1) (Table 1). Soil EC is affected by cropping, irrigation, land use, and application of fertilizer. The higher EC in T100 could be due to a higher salt accumulation in the soil since irrigation by means of tensiometers at the above-mentioned matric potential considerably reduces the quantities of leaching. The activation of fertigation with a threshold value of soil matric tension −22 kPa allows no drainage, as shown by the research carried out in our cultivation area [26,27]. EC of saturated extract of soil obtained in T50 (2.79 dS·m−1), being similar to the electric conductivity (EC) of the nutritive solution used (2.40 dS·m−1), which indicates an optimal use of the nutrients provided in T50.
The increase in NO3 and K in the analysis after harvest is due to the continuous supply of N (via aminoacids and humic and fulvic acids) and K (potassium sulphate) through the nutrient solution. Higher supply in the case of T100 treatment implied higher NO3 and K content in the soil. Regarding nitrate, the used N fertilizers are normally retained in the soil and slowly mineralized. Thus, the nitrate is slowly released, and, asfar as nitrate leaching is reduced, its content in the soil is increased. Furthermore, the soil sampling was carried out after a few days of irrigation events, which would explain the high amount of nitrate released by mineralization at the end of the cycle. In addition, plant root uptake of NO3 could be negatively influenced by the external supply of amino acids [28,29]; in particular, the supplying of amino acids to roots could reduce NO3 uptake [30], resulting in hardly any differences in produced biomass and tissues analysed between treatments. In relation to K, its concentration tended to increase in soil saturation extract with increasing salt concentration because of the release of absorbed K [31]. Additionally, at the pH of 9 in soil (Table 1), potassium phosphates would not be produced, since phosphorus would precipitate as calcium and ferric phosphates, among others. In any case, if potassium phosphates were formed, this compound would be soluble, and, in the saturation extract, it would be redissolved (which would not occur in calcium and ferric phosphates, which are insoluble). Furthermore, the availability of this element in the soil is affected by moisture levels; more moisture makes more K available, this fact being more frequent in T100 than in T50, and in Almería greenhouse cultivation conditions [32,33].

3.2. Physical Parameters

The most important physical traits used to assess the external quality of green pods consumed as legumes are, among others: length, width and height of the pod, the individual pod weight, the firmness of the pod, and the colour of the pod when harvested. With respect to green seeds, the criteria used to assess their external quality are mainly the texture, the shape (round, oval, etc.) and the individual seed weight. The texture of pea green seeds is considered one of the most important quality attributes for consumers [34].
Table 2 shows the physical parameters for the different cultivars tested grown under two fertigation regimes. In relation to length, width and height of the pod, significant differences were found between treatments for fresh pod width in mangetout and French beans and also for grain height in peas cv. Lincoln (17 mm and 15 mm in T50 and T100, respectively).
When analyzing the impact of fertigation on the fresh weight in the legume plants, significant differences between treatments were found for French bean pods with 15.0 ± 0.8 g and 20.1 ± 1.8 g fruit−1 in T50 and T100, respectively.
The comparison of the yield of the diverse species and varieties, in response to fertigation deficit, evidenced that only French bean plants significantly decreased in their productivity under 50% fertigation conditions. In this regard, the commercial production of French beans under control conditions (full fertigation), 1.60 kg m−2, decreased by 32.5%, until reaching 1.08 kg m−2, when exposed to 50% fertigation. The sensitivity of French beans to water shortage, especially during flowering initiation and development, is well demonstrated; this directly affects the final yield [35]. Our results are in agreement with those of Martelo-Nuñez et al. [36] who demonstrated that the fertigation regime was especially relevant for the production of French beans, which were more sensitive than other legume crops to water stress.
In addition, the fertilizer requirements in legumes are low, particularly nitrogen fertilization, which is not generally required or is required in small amounts, although the application of “starter” nitrogen fertilization at a low dose rate seems to enhance the nodulation process and onset of nitrogen fixation in most of the legume crops [37], including peas [38] and French beans [39]. Thus, normally, peas grown in fertile soils are not very dependent on fertilization, particularly on N doses, except during the initial stage of development [40], while in French bean an increase in fertilization, up to a threshold, significantly augmented green pod yield [41]. Therefore, the differences in yield responses between species to different fertilizer amounts applied could be due to higher fertilizer requirements of French beans with respect to pea varieties.
In relation to moisture (%), the analysis of variance indicated no significant differences between treatments for any legume cultivars (Table 2). The percentages of dry matter were lower in grain (75–79.7%) than in pods (85–91.1%).
Regarding the firmness parameters, significant differences were not found between treatments (T100 and T50) except for the BGE cultivar with 21 N and 16 N, respectively (Table 2). Currently, published research results relevant to the impact of fertigation on quality traits like texture legumes are scarce.
Color is one of the main external characteristics that determine the acceptance of the product by the consumer. The mean values for the C* chromatic parameter varied from 27 to 59 (French bean and pea cv. BGE-033620, respectively) and the h* parameter varying from 105 to 111 (BGE-033620 and French bean, respectively), which exhibited green surface. Significant differences were not found between the fertigation treatments tested for any chromatic parameter. Previous work reported by Sezen et al. (2008) [42] showed that large fertigation intervals reduced the color brightness (L* parameter) and increased the pod greenness (a* parameter) in snap bean pods.
The total soluble solids (TSS) content ranged from 5.82 (French bean) to 11.29 °Brix (mangetout) (Figure 2). Previous results are in agreement with those obtained in this study for °Brix of French bean (5.0–5.7 °Brix) grown under protected crop conditions [43]. Mangetout pods are rich in TSS content in comparison with other legume pods, thus cowpea accessions from Spain, Greece and Portugal have shown low TSS contents (5.07–7.57) in previous studies [44]. Pea cultivars also displayed a high TSS content (8.54–10.83) in consonance with values obtained by Mera et al. [45], for open air spring pea crops (11 °Brix). Green peas of high quality should be tender enough, but with a high sugar content [34]. Significant differences were found between fertigation treatments for mangetout, reaching higher TSS contents at T50 (11.3 °Brix) compared to T100 (9.1 °Brix). No significant differences were found between treatments for French beans or for the two pea cultivars.
Figure 3 shows the pH of the different legume cultivars tested under protected cultivation conditions. The pH ranged from 6.1 to 6.9, which is in agreement with previous studies on legumes [43,46,47,48]. Significant differences were not found between fertigation treatments.
The titratable acidity of the different legume cultivars tested, expressed as percentage of citric acid (major organic acid in legumes) is shown in Figure 3. The citric acid content varied from 0.11 (French bean) to 0.29% (pea cv. Lincoln). Previous studies have found citric acid values similar for French beans (0.10–0.18% citric acid) [49]. The data on citric acid content of the pods/seeds indicated a significant increment under drought by mangetout (0.23) and Lincoln pea (0.32) compared to T100 treatment (0.19 and 0.14, respectively).
Although numerous studies are available on the effects of either salinity or drought/deficit fertigation on plant growth and yield of grain and vegetable legumes, only a few of them also address pod and/or immature seed quality parameters.
Soils from T100 treatment had greater salt content (4.45 dS m−1) compared to T50 treatment, as indicated the highest EC value observed (Table 1). Further studies are required to confirm these results by molecular evidence. The tolerant genotypes could be utilized for further breeding programmes to evolve new legume genotypes for better salt stress tolerance with higher quality.
Previous studies on cucumber, melon, tomato and pepper fruits displayed similar results; thus, the salinity of the nutrient solution did not increase the TSS levels [50]. On the other hand, reduced watering application in faba beans increases the carbohydrate concentrations in seeds [51].

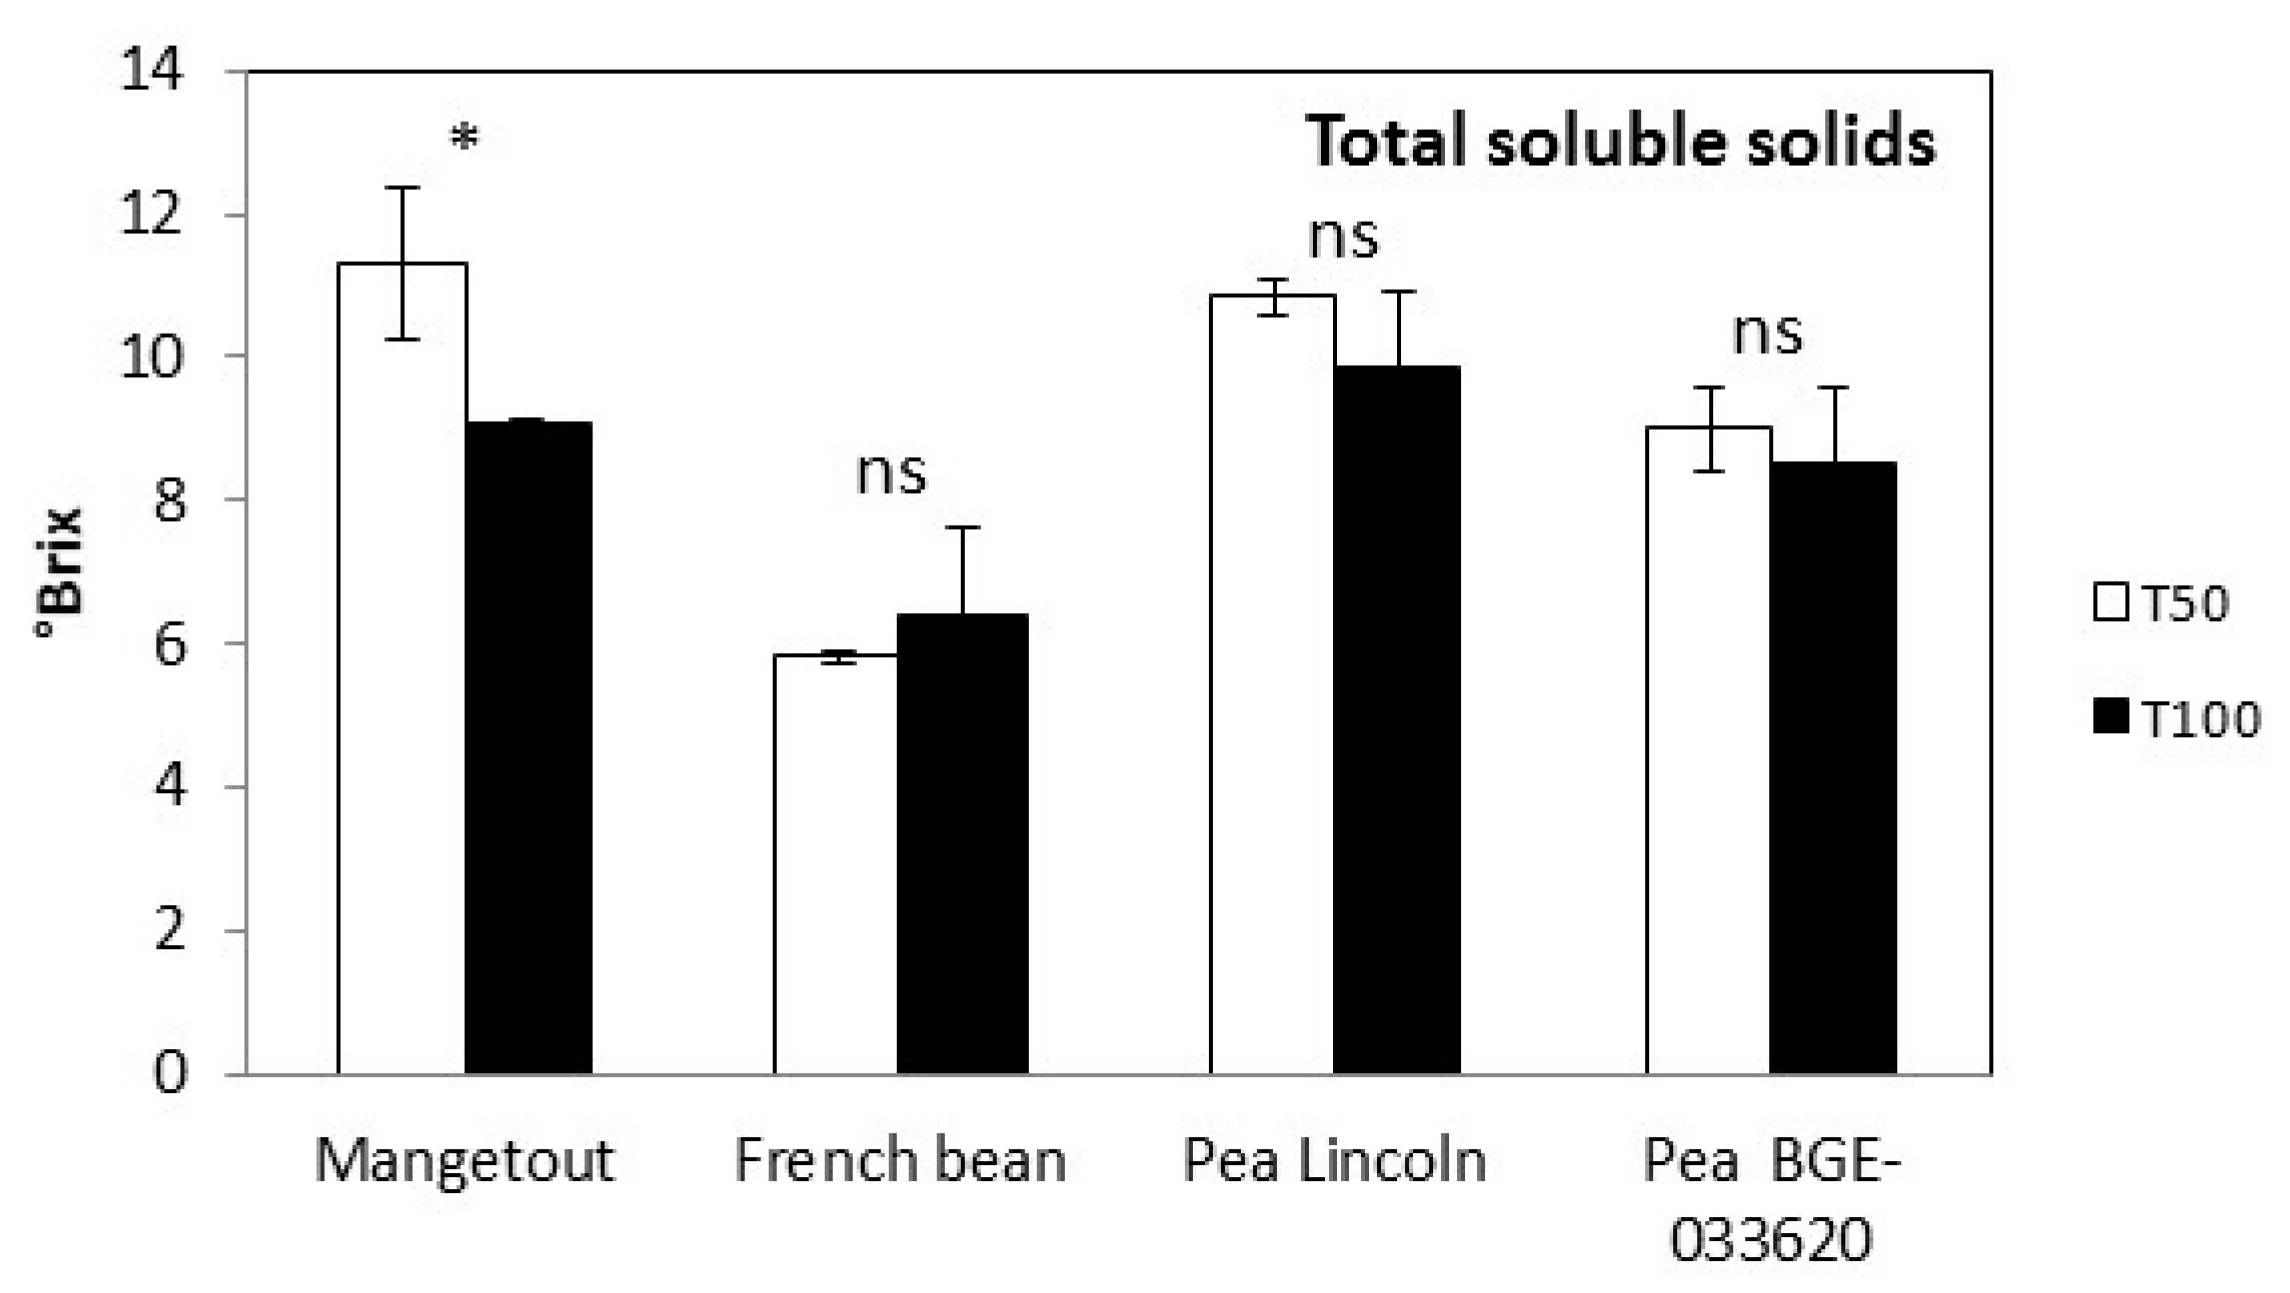
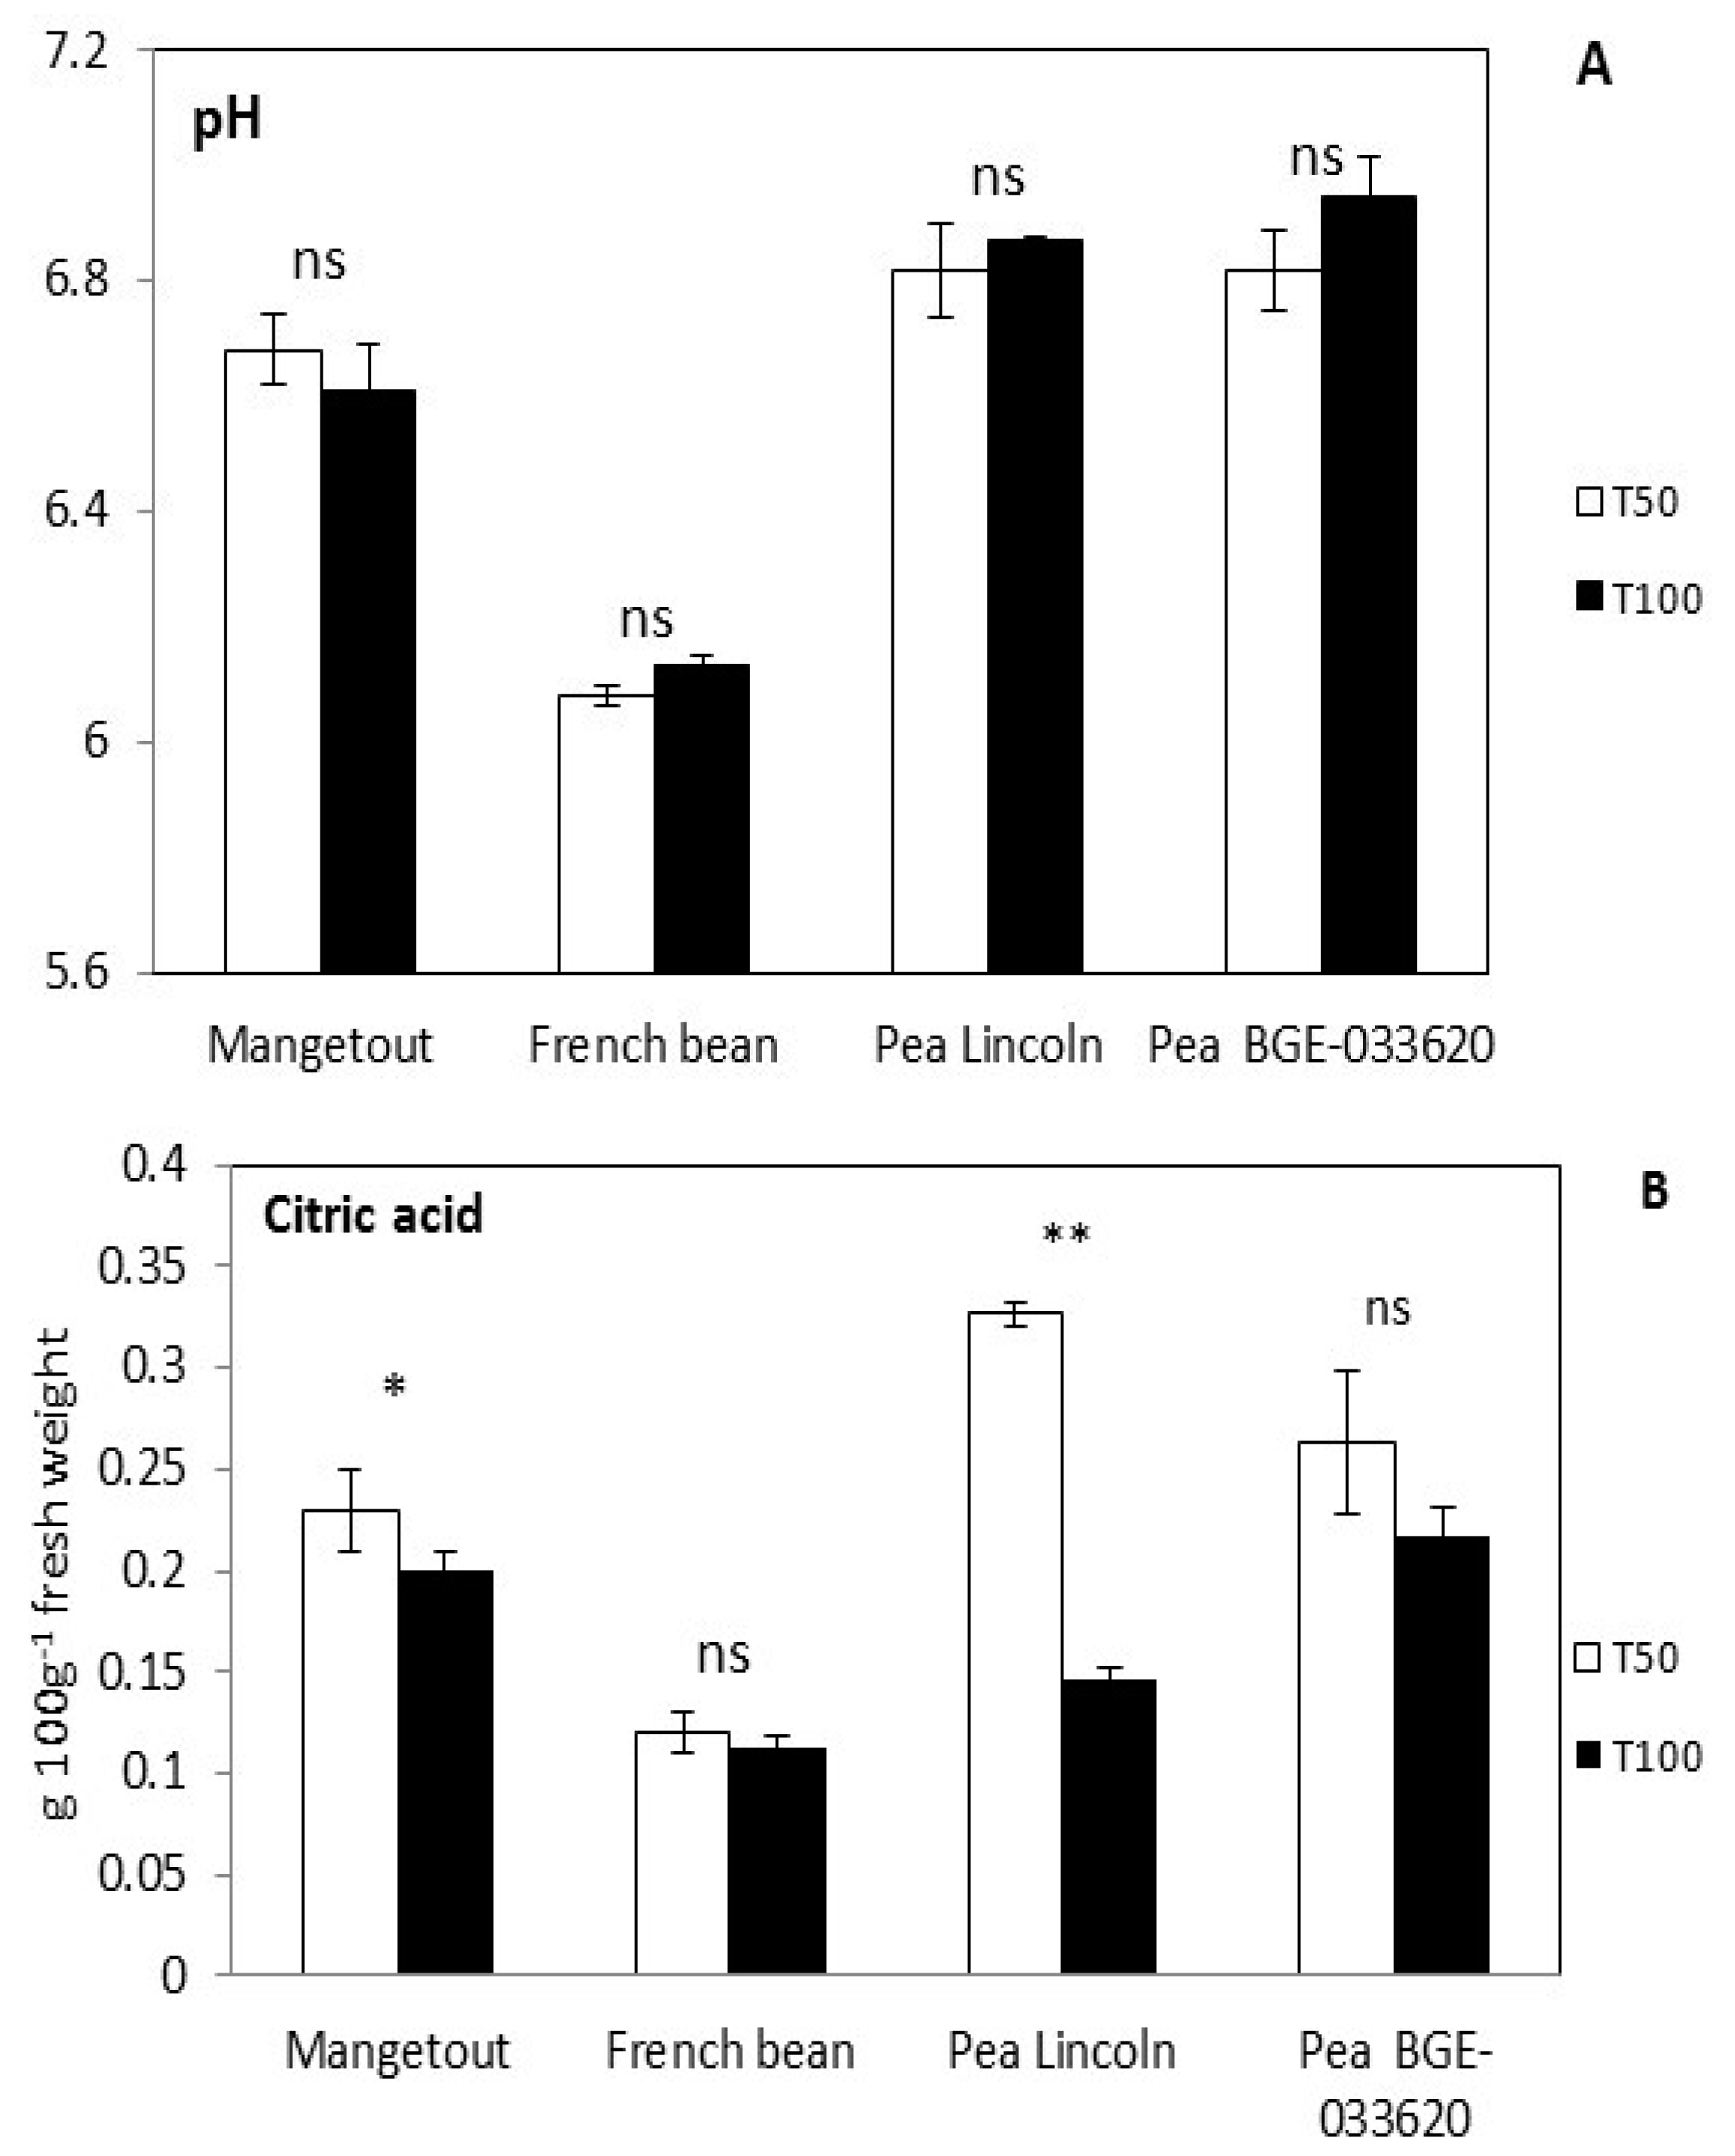
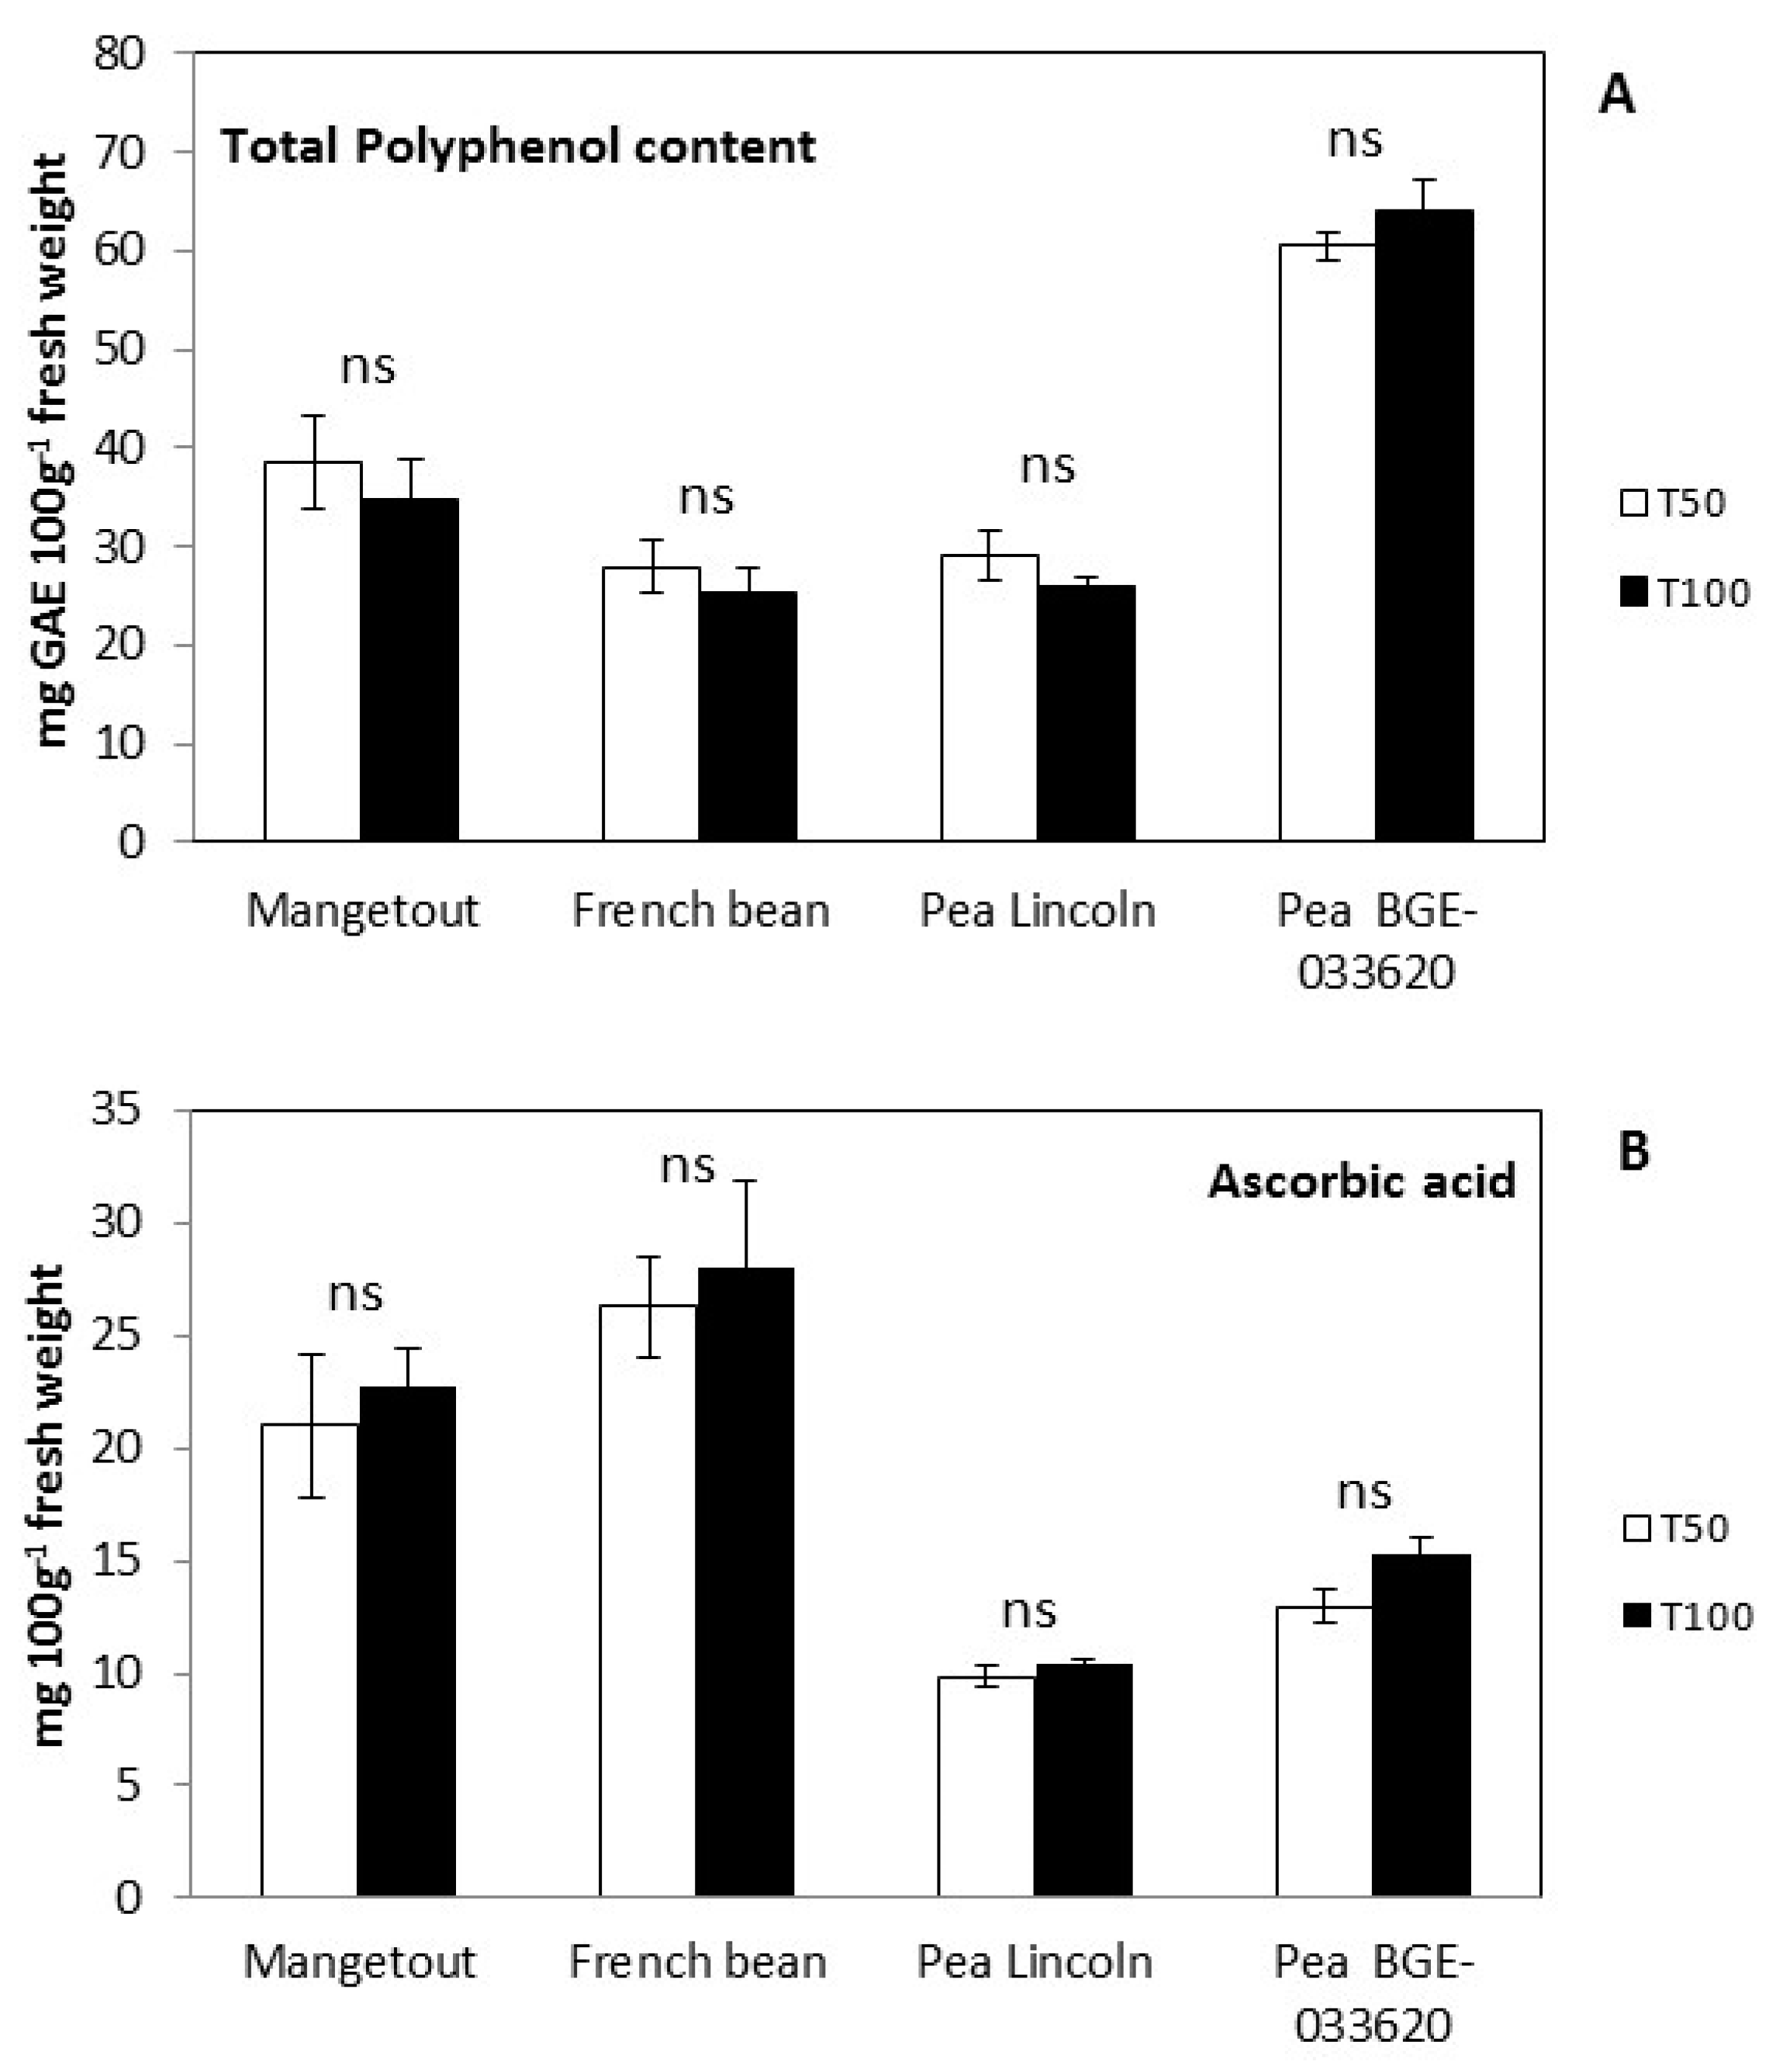
3.3. Nutritional Parameters

Vegetable legumes contain less proteins and more water than those consumed as dry pulses. In addition, they are richer sources of antioxidants, such as phenolics and vitamin C among other compounds [52]. Therefore, their consumption is intended to provide a balanced nutritional source full of healthy promoting compounds rather than to serve as a primary protein source.
Figure 4 shows the mean total phenol content of the different cultivars of legumes tested under organic farming, expressed as mg GAE 100 g−1 of fresh weight. Significant differences were not observed between the normal and restricted fertigation treatments; therefore, a deficit at 50% fertigation did not affect the total phenol content. The lower values were found in French bean and pea cv. Lincoln (20–30 mg GAE 100 g−1 FW). The BGE-033620 pea cultivar showed the highest total phenolic content, with 60–65 mg GAE 100 g−1 FW. These results are in consonance with those reported for the seeds of cultivars of Lupinus albus, L. luteus, and L. angustifolius with total phenol contents varying from 212 to 317 mg 100 g−1 DM (approximately 43–64 mg 100 g−1 FW) [53].
According to the European Food Information Council [54], there is no official dietary recommendation for the consumption of phenolic compounds. However, some studies are being carried out to determine consumption recommendations for different adult population groups, such as that of Ovaskainen et al. [55], which proposed Recommended Dietary Allowances (RDA) for the intake of total phenolic content (461–1377 mg day−1 for men and 449–1185 mg day−1 for women). According to our data, the intake of a 200 g ration of Fresh bean, mangetout and pea cv. Lincoln would provide 5–13% of the RDA for adults. Pea cv. BGE-033620 would provide up to 9–26% of the RDA for adults.
Figure 4 shows the mean ascorbic acid content of the different legumes tested under greenhouse cultivation. No significant differences were observed between the normal and restricted fertigation treatments. The ascorbic acid content ranged from 10–15 mg 100 g−1 FW (pea cultivars) to 26.32 mg 100 g−1 FW for French beans (Figure 4). Previous studies reported lower concentrations for French beans with 16.7 mg 100 g−1 FW [56].
Vitamin C is found naturally as L-ascorbic acid, being widely distributed in fresh plant foods, among which, citrus fruits, kiwi, strawberry and melon are the largest source of vitamin C [57]. Other vegetables like tomato also contain high vitamin C content, varying from 2 to 21 mg 100 g−1 FW [58]. According our data, Fresh beans and mangetout could be considered rich sources of vitamin C. According to the RDA (Recommended Dietary Allowances) for the Spanish population [59], the daily intake of vitamin C for adult men and women is 60 mg day−1. According to our data, a portion size of approximately 200 g FW of French beans and mangetout would provide 83 and 70%, respectively, of the recommended daily intake.
Table 3 shows the mean protein and mineral contents (dry weight) for each legume cultivar. The analyses statistically showed non-significant differences for the protein and mineral contents except for Mn in the BGE-033620 cultivar.
The minimum and maximum mean mineral content (dry weight) in each cultivar were: 2.5 (French bean) and 4.5 g 100 g−1 (pea cv. Lincoln) of N; 1.4 (peas) and 2.3 g 100 g−1 of (French bean) K; 0.1 (pea cv. Lincoln) and 0.5 g 100 g−1 (French bean) of Ca; 0.1 (pea cv. Lincoln) and 0.3 g 100 g−1 (French bean) of Mg; 0.01 (French bean and pea cv. Lincoln) and 0.05 g 100 g−1 (mangetout) of Na; 44 (French bean) and 54 (pea cv. Lincoln) mg kg−1 of Fe; 26.8 (French bean) and 49 (pea cv. Lincoln) mg kg−1 of Zn; 2 (pea cv. BGE-033620) and 5.5 (pea cv. Lincoln) mg kg−1 of Cu; 7.5 (pea cv. Lincoln) and 17.8 mg kg−1 (French bean) of Mn. Minerals in diets are required for metabolic reactions, transmission of nerve impulses, rigid bone formation and regulation of water and salt balance [60]. The daily requirements of an adult person are as follows (mg d−1): 9–18 Fe, 1.1 Cu, 3100 K, 7–9.5 Zn, 1300–1500 Na, 300–350 Mg, 1.8–2.3 Mn, 900–1000 Ca and 41–56 g protein [61]. According to our data, supposing that a person consumes a course of legumes of approximately 200 g d−1 (and taking into account a mean moisture content of 80%), the calculated content for all the minerals is below the recommended values (2.16 Fe, 0.22 Cu, 920 K, 1.96 Zn, 16 Na, 120 Mg, 0.72 Mn, 200 Ca, expressed in mg and 11.2 g protein). The highest contents were observed for K, Mg and protein. Therefore, consumption of 200 g of legumes can provide 24% Fe, 20% Cu, 1.22% Na, 22.22% Ca, 40.66% Mn, 28% Zn, 29.66% K, 40% Mg and 27.30% protein of the recommended intake. The low Na content (<2%) and the high K concentration recommend the use of these legumes in an antihypertensive diet. Thus, K from vegetables and fruits can reduce blood pressure [62].
Figure 5 shows the mean protein fraction content in edible parts of peas, French beans and mangetout grown under two different fertigation treatments.
The protein fractions analysed were: glutelins which are only produced in plant material, and are mostly found in cereals and legume grains; globulins are present in numerous seeds and in legumes; albumins are proteins that are found in blood plasma and are necessary for the correct distribution of body fluids; and prolamins, contained in legumes and that neutralize the anticoagulant effect of heparin [63].
Significant differences were not found between T50 and T100 for protein fractions (glutelins, globulins, albumins and prolamines). The highest protein fraction content was globulin (Lincoln: 8.9 and 8.8 mg 100 g−1 dry weight for T50 and T100, respectively, BGE: 6.8 and 7.0 mg·100 g−1 dry weight for T50 and T100, respectively). Previous studies [64,65], indicated that most of the protein fractions of legume seeds contained globulins and albumins and, in some cases, prolamins and glutelins. Therefore, it should be noted that legume seeds do not show a specific soluble fraction profile, in comparison to cereals [23].
Paredes et al. [66] agree with our findings; in fact, they indicated that the globulin fraction in legumes was the highest (60–90%), followed by prolamins and glutelins (Figure 5). The peas studied can be considered as a rich source of proteins, an alternative to the protein from cereals and animals.
In summary, the results, under the controlled system of the presented study using two fertigation treatments, supported the hypothesis that physical and chemical traits varied between varieties and species in different ways. Our results are in accordance with the findings of Saleh et al., 2018 [14], El-Noemani et al., 2010 [67], and Shalaby et al., 2016 [68], having showed a wide variation among legume cultivars in terms of their performance and response to water stress.

4. Conclusions

This work describes, firstly, the different responses to abiotic stress (fertigation deficit) in terms of the physico-chemical quality of peas, mangetout and French beans; this information contributes to rational decisions regarding the agronomical management of such crops.
The response of legumes to the treatments varied between the cultivars tested. The fertigation treatments had significant effects on the morphometric traits (width for mangetout and French bean; fresh weight for French bean; seed height for Pea cv. Lincoln). Furthermore, only French bean plants significantly lowered productivity under 50% fertigation conditions
Interestingly, from the present study, mangetout came out as the highest source of total soluble solids, reaching higher content at 50% fertigation treatment. It was found that fertigation treatments did not significantly affect the antioxidant compounds (total polyphenols and ascorbic acid), minerals and protein fraction contents of the legumes studied. According to our data, French beans and mangetout are a rich source of vitamin C.
This study also reflects the importance of legumes in the contribution of mineral content, especially in the contribution of K, Mg and protein to the human diet.
On the other hand, the landraces seemed to be an interesting genetic material. Thus, the BGE-033620 landrace showed the highest total polyphenol content.
This study has shown that these legume species have relevant interest and benefits, at both the agronomic and nutritional levels, and open good perspectives for the improvement of cropping systems and the creation of innovative food products. The available biodiversity and the identified large variation in quality between cultivars and species of legumes is an underutilized resource, still requiring further studies to expand our knowledge about the quality and uses of landraces for consumption, either as fresh vegetables, or after canning or freezing.

Author Contributions

M.d.C.G.-G. wrote this manuscript and performed the crop assay; M.d.C.G.-G., R.F. and P.G., performed nutritional analysis; M.d.C.G.-G. and J.L.V. performed physical and chemical analysis; M.d.C.G.-G. and J.A.F. reviewed the manuscript; M.D.R.-C. designed this study and revised the manuscript. All authors have read and agreed to the published version of the manuscript.

Funding

The authors wish to express their thanks to the Projects (PP.AVA.AVA201601.7 and PP.TRA.TRA201600.9) and FEDER for the funding of this research.

Institutional Review Board Statement

Not applicable.

Informed Consent Statement

Not applicable.

Conflicts of Interest

The authors declare no conflict of interest.

References

  1. CAPDER. Informe de Estadísticas de La Producción Ecológica a 31/12/16; Junta de Andalucía: Sevilla, Spain, 2017.
  2. Rubio, L.A.; Molina, E. Las leguminosas en alimentación animal. Arbor 2016, 192, 315. [Google Scholar] [CrossRef] [Green Version]
  3. Arnoldi, A.; Zanoni, C.; Lammi, C.; Boschin, G. The role of grain legumes in the prevention of hypercholesterolemia and hypertension. Crit. Rev. Plant Sci. 2015, 34, 144–168. [Google Scholar] [CrossRef]
  4. Delgado-Andrade, C.; Olías, R.; Jiménez-López, J.; Clemente, A. Aspectos de las legumbres nutricionales y beneficiosos para la salud humana. Arbor 2016, 192, 313. [Google Scholar]
  5. Bazzano, L.A.; Thompson, A.M.; Tees, M.T.; Nguyen, C.H.; Winham, D.M. Non-soy legume consumption lowers cholesterol level: A meta-analysis of randomized controlled trials. Nutr. Metab. Cardiovasc. Dis. 2011, 21, 94–103. [Google Scholar] [CrossRef] [Green Version]
  6. Fernández, J.; Redondo-Blanco, S.; Villar, C.; Clemente, A.; Lombó, F. Healthy effects of prebiotics and their metabolites against intestinal diseases and colorectal cancer. AIMS Microbiol. 2015, 1, 48–71. [Google Scholar] [CrossRef] [Green Version]
  7. Simpson, H.L.; Campbell, B.J. Dietary fibre-microbiota interactions. Aliment. Pharmacol. Ther. 2015, 42, 158–179. [Google Scholar] [CrossRef] [Green Version]
  8. Jenkins, D.J.A.; Kendall, C.W.C.; Augustin, L.S.A.; Mitchell, S.; Sahye-Pudaruth, S.; Blanco Mejia, S.; Chiavaroli, L.; Mirrahimi, A.; Ireland, C.; Bashyam, B.; et al. Effect of legumes as part of a low glycemic index diet on glycemic control and cardiovascular risk factors in type 2 diabetes mellitus: A randomized controlled trial. Arch. Intern. Med. 2012, 172, 1653–1660. [Google Scholar] [CrossRef] [Green Version]
  9. Kumar, M.; Rajput, T.B.S.; Kumar, R.; Patel, N. Water and nitrate dynamics in baby corn (Zea mays L.) under different fertigation frequencies and operating pressures in semi-arid region of India. Agric. Water Manag. 2016, 163, 263–274. [Google Scholar] [CrossRef]
  10. Granados, M.R.; Thompson, R.B.; Fernandez, M.D.; Martinez-Gaitan, C.; Gallardo, M. Prescriptive corrective nitrogen and irrigation management of fertigated and drip-irrigated vegetable crops using modelling and monitoring approaches. Agric. Water Manag. 2013, 119, 121–134. [Google Scholar] [CrossRef]
  11. Garcia-Caparros, P.; Contreras, J.I.; Baeza, R.; Segura, M.L.; Lao, M.T. Integral Management of Irrigation Water in Intensive Horticultural Systems of Almería. Sustainability 2017, 9, 2271. [Google Scholar] [CrossRef] [Green Version]
  12. García-García, M.C.; Céspedes, A.J.; Lorenzo, P.; Pérez-Parra, J.J.; Escudero, M.C.; Sánchez-Guerrero, M.C.; Medrano, E.; Baeza, E.; López, J.C.; Magán, J.J.; et al. El Sistema de Producción Hortícola de La Provincia de Almería; IFAPA (Instituto de Formación Agraria y Pesquera de Andalucía): Huelva, Spain, 2016; p. 179. [Google Scholar]
  13. Sezen, S.M.; Yazar, A.; Canbolat, M.; Eker, S.; Celikel, G. Effect of drip irrigation management on yield and quality of field grown green beans. Agric. Water Manag. 2005, 71, 243–255. [Google Scholar] [CrossRef]
  14. Saleh, S.; Liu, G.; Liu, M.; Ji, Y.; He, H.; Gruda, N. Effect of irrigation on growth, yield, and chemical composition of two green bean cultivars. Horticulturae 2018, 4, 3. [Google Scholar] [CrossRef] [Green Version]
  15. Singer, S.M.; Helmy, Y.I.; Karas, A.N.; Abou-Hadid, A.F. Influences of different water-stress treatments on growth, development and production of snap bean (Phaseolus vulgaris L.). Acta Hort. 2003, 614, 605–611. [Google Scholar] [CrossRef]
  16. Bonachela, S.; González, A.M.; Fernández, M.D. Irrigation scheduling of plastic greenhouse vegetable crops based on historical weather data. Irrig. Sci. 2006, 25, 53–62. [Google Scholar] [CrossRef]
  17. Bouyoucos, G.J. Hydrometer method improved for making particle size analyses of soils. Agron. J. 1962, 54, 464–465. [Google Scholar] [CrossRef]
  18. Black, C.A. Methods of Soils Analysis, Part II: Chemical and Microbiological Properties; American Society of Agronomy: Madison, WI, USA, 1965. [Google Scholar]
  19. Kähkönen, M.P.; Hopia, A.I.; Vuorela, H.J.; Rauha, J.P.; Pihlaja, K.; Kujala, T.S. Antioxidant activity of plant extracts containing phenolic compounds. J. Agric. Food Chem. 1999, 47, 3954–3962. [Google Scholar] [CrossRef] [PubMed]
  20. Suntornsuk, L.; Gritsanapun, W.; Nilkamhank, S.; Paochom, A. Quantitation of vitamin C content in herbal juice using direct titration. J. Pharm. Biomed. Anal. 2002, 28, 849–855. [Google Scholar] [CrossRef]
  21. Moreno-Rojas, R.; Sánchez-Segarra, P.J.; García-Martínez, M.; Gordillo-Otero, M.J.; Amaro López, M.A. Mineral composition of skimmed milk fruit-added yoghurts, nutritional assessment. Milchwissenschaft 2000, 55, 510–512. [Google Scholar]
  22. AOAC. Official Methods of Analysis; Association of Official Analytical Chemists: Arlington, VA, USA, 1990. [Google Scholar]
  23. Hu, B.; Esen, B. Heterogeneity of soybean and proteins: One dimensional electrophoretic profiles of six different solubility fractions. J. Agric. Food Chem. 1981, 29, 297–501. [Google Scholar] [CrossRef]
  24. Knabe, D.; Laure, D.; Gregg, E.; Martínez, G.; Tankley, T. Apparent digestibility of nitrogen and amino acids in protein feed stuffs by growing pigs. J. Anim. Sci. 1989, 67, 441–458. [Google Scholar] [CrossRef]
  25. Bradford, M. Arapid and sensitive method for the quantification of microgram quantities of protein utilizing the principle of protein-dye banding. Anal. Biochem. 1976, 72, 248–259. [Google Scholar] [CrossRef]
  26. Contreras, J.I.; Baeza, R.; López, J.G.; Cánovas, G.; Alonso, F. Management of Fertigation in Horticultural Crops through Automation with Electrotensiometers: Effect on the Productivity of Water and Nutrients. Sensors 2021, 21, 190. [Google Scholar] [CrossRef]
  27. Contreras, J.I.; Alonso, F.; Cánovas, G.; Baeza, R. Irrigation management of greenhouse zucchini with different soil matric potential level. Agronomic and environmental effects. Agric. Water Manag. 2017, 183, 26–34. [Google Scholar] [CrossRef]
  28. Lee, R.B.; Purves, J.V.; Ratcliffe, R.G.; Saker, L.R. Nitrogen assimilation and the control of ammonium and nitrate absorption by maize roots. J. Exp. Bot. 1992, 43, 1385–1396. [Google Scholar] [CrossRef]
  29. Muller, B.; Tilliard, P.; Touraine, B. Nitrate fluxes in soybean seedling roots and their response to amino acids: An approach using 15N. Plant Cell Environ. 1995, 18, 1267–1279. [Google Scholar] [CrossRef]
  30. Dluzniewska, P.; Gessler, A.; Kopriva, S.; Strand, M.; Novak, O.; Dietrich, H.; Rennenberg, H. Exogenous supply of glutamine and active cytokinin to the roots reduces NO3 uptake rates in poplar. Plant Cell Environ. 2006, 29, 1284–1297. [Google Scholar] [CrossRef] [PubMed] [Green Version]
  31. Oanzen, H.H.; Chang, C. Cation concentrations in the saturation extract and soil solution extract of soil salinized with various sulfate salts. Soil Sci. Plant Anal. 1988, 19, 405–430. [Google Scholar] [CrossRef]
  32. Contreras, J.I. Optimización de Las Estrategias de Fertirrigación de Cultivos Hortícolas en Invernadero Utilizando Aguas de Baja Calidad (Agua Salina y Agua Regenerada) en Condiciones Del Litoral de Andalucía. Ph.D. Thesis, Universidad de Almería, Almería, Spain, 2014. [Google Scholar]
  33. Segura, M.L.; Contreras París, J.I.; Plaza, B.M.; Lao, M.T. Assessment of the Nitrogen and Potassium Fertilizer in Green Bean Irrigated with Disinfected Urban Wastewater. Soil Sci. Plant Anal. 2012, 43, 426–433. [Google Scholar] [CrossRef]
  34. Edelenbos, M.; Thybo, A.; Errichsen, L.; Wienberg, L.; Andersen, L. Relevant measurements of green pea texture. J. Food Qual. 2001, 24, 91–110. [Google Scholar] [CrossRef]
  35. Lizana, C.; Wentworth, M.; Martinez, J.P.; Villegas, D.; Meneses, R.; Murchie, E.H.; Pastenes, C.; Lercari, B.; Vernieri, P.; Horton, P.; et al. Differential adaptation of two varieties of common bean to abiotic stress: I. Effects of drought on yield and photosynthesis. J. Exp. Bot. 2006, 57, 685. [Google Scholar] [CrossRef] [Green Version]
  36. Martelo-Nuñez, J.M.; Ruiz-Nogueira, B.; Sau-Sau, F. Prácticas de cultivo de la judía grano. Agricultura 1996, 767, 493–495. [Google Scholar]
  37. Droga, R.C.; Dudeja, S.S. Fertilizer N and Nitrogen Fixation in legume—Rhizobium Symbiosis. Ann. Biol. 1993, 9, 149–164. [Google Scholar]
  38. Clayton, G.; Rice, W.; Blade, S.; Grant, C.; Harker, N.; Johnston, A.; Lafond, G.; Lupwayi, N. Minimizing Risk and Increasing Yield Stability in Field Pea Production. In Proceedings of the 10th Annual Meeting, Conference and Trade Show of the Saskatchewan Soil Conservation Association, Regina, SK, Canada, 11–12 February 1998. [Google Scholar]
  39. Kontopoulou, C.K.; Giagkou, S.; Stathi, E.; Savvas, D.; Iannetta, P.P.M. Responses of hydroponically grown common bean fed with nitrogen-free nutrient solution to root inoculation with N-2-fixing bacteria. Hortscience 2015, 50, 597–602. [Google Scholar] [CrossRef]
  40. Macák, M.; Candráková, E.; Đalović, I.; Prasad, P.V.V.; Farooq, M.; Korczyk-Szabó, J.; Kováčik, P.; Šimanský, V. The Influence of Different Fertilization Strategies on the Grain Yield of Field Peas (Pisum sativum L.) under Conventional and Conservation Tillage. Agronomy 2020, 10, 1728. [Google Scholar] [CrossRef]
  41. Sen, R.; Rahman, M.A.; Hoque, A.K.M.S.; Zaman, S.; Noor, S. Response of Different Levels of Nitrogen and Phosphorus on the Growth and Yield of French Bean. Bangladesh J. Sci. Ind. Res. 2010, 45, 169–172. [Google Scholar] [CrossRef] [Green Version]
  42. Sezen, S.M.; Yazar, A.; Akyildiz, A.; Dasgan, H.Y.; Gencel, B. Yield and quality response of drip irrigated green beans under full and deficit irrigation. Sci. Hortic. 2008, 117, 95–102. [Google Scholar] [CrossRef]
  43. Segura, M.L.; Contreras, J.I.; García, I.I.; García, M.C.; Cuadrado, I.M. Fertilización nitrogenada de judía verde bajo invernadero con criterios agroecológicos. In VII Congreso SEAE Zaragoza; Sociedad Española de Agricultura Ecológica: Catarroja, Spain, 2006. [Google Scholar]
  44. Ntatsi, G.; Gutiérrez-Cortines, M.E.; Karapanos, I.; Barros, A.; Weiss, J.; Balliu, A.; Savvas, D. The quality of leguminous vegetables as influenced by preharvest factors. Sci. Hortic. 2018, 232, 191–205. [Google Scholar] [CrossRef]
  45. Mera, M.; Kehr, E.; Mejías, J.; Ihl, M.; Bifani, V. Arvejas (Pisum sativum) de Vaina Comestible Sugar Snap: Antecedentes y Comportamiento en el Sur de Chile. Agric. Tec. 2007, 67, 343–352. [Google Scholar] [CrossRef] [Green Version]
  46. Fernández, N.E.P.; López, G.P.; Domínguez, C.R.; Peñuelas, V.M.L.; Izaguirre, S.C.O. Composición química, características funcionales y capacidad antioxidante de formulaciones de garbanzo (“Cicer arietinum” L.) Blanco Sinaloa 92. Agrociencia 2019, 53, 35–44. [Google Scholar]
  47. Khah, M.E.; Arvanitoyannis, S.I. Yield, nutrient content and physico-chemical and organoleptic properties en green bean are affected by N:K ratios. Food Agric. Environ. 2003, 1, 17–26. [Google Scholar]
  48. Dawo, M.; Wilkindon, J.M.; Sanders, F.; Pilbean, D.J. The yield and quality of fresh and ensiled plant material from intercropped maize (Zea mays) and beans (Phaseolus vulgaris). J. Sci. Food Agric. 2007, 87, 1391–1399. [Google Scholar] [CrossRef]
  49. Martínez, C.; Ros, G.; Periago, M.J.; López, G.; Ortuño, J. Physico-chemical and sensory quality criteria of green beans. Lebensm. Wiss. Technol. 1995, 28, 515–520. [Google Scholar] [CrossRef]
  50. Navarro, J.M.; Garrido, C.; Flores, P.; Martínez, V. The effect of salinity on yield and fruit quality of pepper grown in perlite. Span. J. Agric. Res. 2010, 8, 142–150. [Google Scholar] [CrossRef] [Green Version]
  51. Al-Suhaibani, N.A. Influence of early water deficit on seed yield and quality of faba bean under arid environment of Saudi Arabia. Am. Eurasian J. Agric. Environ. Sci. 2009, 5, 649–654. [Google Scholar]
  52. Bhattacharya, S.; Malleshi, N.G. Physical, chemical and nutritional characteristic of premature-processed and matured green legumes. J. Food Sci. Technol. 2012, 49, 459–466. [Google Scholar] [CrossRef] [PubMed]
  53. Siger, A.L.; Czubinski, J.; Kachlicki, P.; Dwiecki, K.; Lampart-Szczapa, E.; Nogala-Kalucka, M. Antioxidant activity and phenolic content in three Lupin species. J. Food Compos. Anal. 2012, 25, 190–197. [Google Scholar] [CrossRef]
  54. European Food Information Council. Nutrition information & food labelling-results of the EUFIC consumer research conducted in May-June 2004. EUFIC Forum 2005, 2, 1–6. [Google Scholar]
  55. Ovaskainen, M.L.; Torronen, R.; Koponen, J.M.; Sinkko, H.; Hellstrom, J.; Reinivuo, H.; Mattila, P. Dietary intake and major food sources of polyphenols in finnish adults. J. Nutr. 2008, 138, 562–566. [Google Scholar] [CrossRef]
  56. Tee, E.S.; Young, S.I.; Ho, S.K.; Mizura, S.S. Determination of vitamin C in fresh fruits and vegetables using the dye-titration and microfluorometric methods. Pertanika 1988, 11, 39–44. [Google Scholar]
  57. Rekha, C.; Poornima, G.; Manasa, M.; Abhipsa, V.; Devi, J.P.; Kumar, V.H.T.; Kekuda, T.R.P. Ascorbic acid, total phenol content and antioxidant activity of fresh juices of four ripe and unripe citrus fruits. Chem. Sci. Trans. 2012, 1, 303–310. [Google Scholar] [CrossRef]
  58. Frusciante, L.; Carli, P.; Ercolano, M.R.; Pernice, R.; Di Mateo, A.; Fogliano, V.; Pellegrini, N. Antioxidant nutritional quality of tomato. Mol. Nutr. Food Res. 2007, 51, 609–617. [Google Scholar] [CrossRef]
  59. Moreiras, O.; Carbajal, A.; Cabrera, L.; Cuadrado, C. Ingestas Recomendadas de energía y nutrientes (Revisadas 2002). In Tablas de Composición de Alimentos; Ediciones Pirámide: Madrid, Spain, 2004; pp. 127–131. [Google Scholar]
  60. Kalac, P.; Svoboda, L. A review of trace element concentrations in edible mushrooms. Food Chem. 2000, 69, 273–281. [Google Scholar] [CrossRef]
  61. Cuervo, M.; Abete, I.; Baladia, E.; Corbalán, M.; Manera, M.; Basulto, J. Ingestas Dietéticas de Referencia (IDR) para la Población Española; Ediciones Universidad de Navarra; Federación Española de Sociedades de Nutrición, Alimentación y Dietética (FESNAD): Madrid, Spain, 2010. [Google Scholar]
  62. Genccelep, H.; Uzun, Y.; Tunctürk, Y.; Demirel, K. Determination of mineral contents of wild-grown edible mushrooms. Food Chem. 2009, 113, 1033–1036. [Google Scholar] [CrossRef]
  63. Serratos-Arévalo, J.C. Aislamiento y Caracterización de Proteínas de Las Semillas Maduras de Enterolobium Cyclocarpium Para Su Aprovechamiento Alimenticio. Ph.D. Thesis, Universidad de Colima, Colima, Mexico, 2000. [Google Scholar]
  64. Casey, R.; Domoney, C. The protein composition of legume seeds its variability and potential. In Proceedings of the Ire Conference Europeenne sur les Proteagineux, Angers, France, 1–3 June 1992; pp. 381–386. [Google Scholar]
  65. Jambunathan, R.; Singh, U.; Subramanian, V. Grain quality of sorghum, pearl millet, pigeon-pea, and chick-pea. In Proceedings of the Workshop on Interfaces between Agriculture, Nutrition, and Food Science, Hyderabad, India, 10–12 November 1981. [Google Scholar]
  66. Paredes, L.; Ordorica, F.; Guevara, L.; Covarrubias, A. Las proteínas vegetales. Presente y futuro de la alimentación. In Prospectiva de la Biotecnología en México; Quintero, R., Ed.; CONACYT: México, Mexico, 1985; pp. 331–349.
  67. El-Noemani, A.; El-Zeiny, H.; El-Gindy, A.; El-Sahhar, E.A.; El-Shawadfy, M. Performance of some bean (Phaseolus vulgaris L.) varieties under different irrigation systems and regimes. Aust. J. Basic Appl. Sci. 2010, 4, 6185–6196. [Google Scholar]
  68. Shalaby, M.A.; Ibrahim, S.K.; Zaki, E.M.; Abou-Sedera, F.A.; Abdallah, A.S. Effect of sowing dates and plant cultivar on growth, development and pod production of snap bean (Phaseolus vulgaris L.) during summerseason. Int. J. Pharm. Tech. Res. 2016, 9, 231–242. [Google Scholar]
Figure 1. Plant material tested (from top to bottom): French bean “Helda” (Phaseolus vulgaris L.), mangetout “Tirabí” (Pisum sativum L. ssp. arvense), pea cv. Lincoln (Pisum sativum L.) and pea cv. BGE*-033620 (Pisum sativum L.). * BGE: Spanish germplasm bank.
Horticulturae 07 00028 g001
Figure 2. Total soluble solids (expressed as °Brix) in edible parts of mangetout, French beans and peas grown under normal (T100) and sustained deficit (T50) fertigation tested under protected cultivation conditions. * and “ns” indicate significant differences at p < 0.05, and non-significant differences between treatments (T50 and T100) for each cultivar, respectively (ANOVA followed by Tukey’s multiple range test).
Horticulturae 07 00028 g002
Figure 3. pH (A) and titratable acidity (B) (expressed as g of citric acid 100 g−1 fresh weight) in edible parts of mangetout, French beans and peas grown under normal (T100) and sustained deficit (T50) fertigation tested under protected cultivation conditions. *, ** and “ns” indicate significant differences at p < 0.05, p < 0.01 and non-significant differences between treatments (T50 and T100) for each cultivar, respectively (ANOVA followed by Tukey’s multiple range test).
Horticulturae 07 00028 g003
Figure 4. Antioxidant compound content (Total polyphenol (A) and ascorbic acid content (B)) in edible parts of mangetout, French beans and peas grown under normal (T100) and sustained deficit (T50) fertigation tested under protected cultivation conditions. “ns” indicates non-significant differences between treatments for each cultivar (ANOVA followed by Tukey’s multiple range test).
Horticulturae 07 00028 g004
Figure 5. Protein fractions in edible parts of Lincoln and BGE-033620 peas grown under normal (T100) and sustained deficit (T50) fertigation tested under protected cultivation conditions. “ns” indicates non-significant differences between treatments (T50 and T100) for each cultivar (ANOVA followed by Tukey’s multiple range test).
Horticulturae 07 00028 g005
Table 1. Saturated extract soil analysis.
SoilECpHOrganicTotalNO3PK
(dS m−1)Matter (%)N (%)(meq·L−1)(meq·L−1)(meq·L−1)
Before planting1.319.21.60.0511.3111.5
After harvesting (T100)4.459.31.30.0519.312.48.7
After harvesting (T50)2.799.11.20.053.7124.6
Table 2. Physical parameters of pea, French beans and mangetout grown under normal (T100) and sustained deficit (T50) fertigation tested under protected cultivation conditions. Data are displayed as mean ± standard deviation.
CultivarTreatmentLength (mm) aWidth (mm) aHeight (mm) aFW (g) bMoisture (%) bFirmness (N) bC* bHue b
MangetoutT50102.3 ± 0.423 ± 1.05.8 ± 0.55.8 ± 0.385.2 ± 0.356.0 ± 3.033.0 ± 0.9107.0 ± 0.6
T100104.7 ± 0.721.0 ± 1.0 *c5.7 ± 0.56.3 ± 0.884.2 ± 0.763.0 ± 7.332.0 ± 1.9108.0 ± 0.2
French beanT50210.5 ± 0.218.6 ± 0.46.7 ± 0.315.0 ± 0.891.1 ± 0.755.0 ± 3.527.0 ± 0.3111.0 ± 0.1
T100229.7 ± 0.516.0 ± 1.8 *c5.9 ± 0.220.1 ± 1.8 *c91.2 ± 1.756.0 ± 11.129.0 ± 2.8111.0 ± 1.7
Pea LincolnT50 10.9 ± 0.417.0 ± 0.84.7 ± 0.224.4 ± 2.075.7 ± 2.133.0 ± 1.0109.0 ± 0.5
T100 12.0 ± 0.815.0 ± 0.6 *c4.7 ± 0.224.2 ± 1.475.5 ± 1.534.0 ± 0.7 *c108.0 ± 0.4
BGE-033620T50 9.9 ± 0.512 ± 0.52.4 ± 0.320.2 ± 0.977.1 ± 0.839.0 ± 1.3105.0 ± 0.5
T100 9.9 ± 0.412 ± 0.42.4 ± 0.422.9 ± 1.179.7 ± 1.9 *c39.0 ± 1.9105.0 ± 0.2
a Length, width and height measured in mangetout and French bean pods, and in pea seeds. b Fresh weight, moisture, C* and Hue parameters measured in mangetout, French bean and pea pods. c * p < 0.05 denote a statistically significant difference between treatments (T50 and T100) for each cultivar (ANOVA followed by Tukey’s multiple range test).
Table 3. Protein and mineralcontents (dry weight) in legume cultivars grown under normal (T100) and sustained deficit (T50) fertigation tested under protected cultivation conditions. Data are displayed as mean ± standard deviation.
Cultivar g 100g−1mg kg−1
TreatmentProteinNKCaMgNaFeZnCuMn
MangetoutT5020.0 ± 2.73.2 ± 0.41.9 ± 0.20.4 ± 0.00.2 ± 0.10.05 ± 0.044.6 ± 8.744.8 ± 6.53.7 ± 2.49.1 ± 1.6
T10021.1 ± 2.43.4 ± 0.41.9 ± 0.20.4 ± 0.10.2 ± 0.00.05 ± 0.044.5 ± 7.038.8 ± 1.93.2 ± 2.49.8 ± 0.8
French beanT5015.5 ± 1.32.5 ± 0.22.3 ± 0.20.5 ± 0.00.3 ± 0.00.01 ± 0.047.3 ± 6.326.8 ± 2.04.7 ± 1.317.8 ± 0.6
T10018.6 ± 1.63.0 ± 0.32.2 ± 0.10.4 ± 0.10.3 ± 0.00.01 ± 0.044.0 ± 2,826.8 ± 1.25.0 ± 1.018.3 ± 2.5
Pea LincolnT5025.6 ± 2.44.1 ± 0.81.4 ± 0.20.1 ± 0.00.1 ± 0.00.01 ± 0.052.5 ± 5.345.0 ± 3.05.0 ± 1.18.5 ± 0.9
T10027.8 ± 2.54.5 ± 0.41.6 ± 0.10.1 ± 0.00.1 ± 0.00.01 ± 0.054.0 ± 2.549.0 ± 2.45.5 ± 0.87.5 ± 0.9
BGE-033620T5024.7 ± 4.44.0 ± 0.71.4 ± 0.10.2 ± 0.10.2 ± 0.10.04 ± 0.054.5 ± 15.739.0 ± 10.82.8 ± 2.014.0 ± 0.5 *a
T10023.8 ± 3.73.8 ± 0.61.4 ± 0.10.2 ± 0.20.2 ± 0.00.03 ± 0.047.1 ± 6.839.1 ± 8.82.0 ± 0.312.5 ± 0.4
a * p < 0.05 denote a statistically significant difference between treatments within the same cultivar (ANOVA followed by Tukey’s multiple range test).
Publisher’s Note: MDPI stays neutral with regard to jurisdictional claims in published maps and institutional affiliations.

