Article

Identification of the Loci Associated with Resistance to Banana Xanthomonas Wilt (Xanthomonas vasicola pv. musacearum) Using DArTSeq Markers and Continuous Mapping

1
International Institute of Tropical Agriculture, Kampala P.O. Box 7878, Uganda
2
Gnomixx B.V., Boterbloemstraat 26, 9090 Melle, Belgium
3
Department of Biosystems, Katholieke Universiteit Leuven, Willem De Croylaan 42, 3001 Heverlee, Belgium
4
International Institute of Tropical Agriculture, c/o ILRI, Nairobi P.O. Box 30709-00100, Kenya
*
Author to whom correspondence should be addressed.
Horticulturae 2024, 10(1), 87; https://doi.org/10.3390/horticulturae10010087
Submission received: 17 November 2023 / Revised: 5 January 2024 / Accepted: 13 January 2024 / Published: 16 January 2024
(This article belongs to the Special Issue Developments in the Genetics and Breeding of Banana Species)

Abstract

:
Banana Xanthomonas wilt, caused by Xanthomonas vasicola pv. musacearum (Xvm), is a devastating disease that results in total yield loss of affected plants. Resistance to the disease is limited in Musa acuminata, but it has been identified so far in the zebrina subspecies. This study identified markers associated with tolerance to Xvm in Monyet, a tetraploid banana from the zebrina subspecies which was identified to be partially resistant to the bacterium. We used a triploid progeny of 135 F1 hybrids resulting from a cross between Monyet (Xvm partially resistant) and Kokopo (diploid and Xvm susceptible). The F1 hybrids were screened in pots for resistance to Xvm. The population was genotyped using the genotyping-by-sequencing platform of Diversity Array Technology (DArTSeq). The adjusted means of the phenotypic data were combined with the allele frequencies of the genotypic data in continuous mapping. We identified 25 SNPs associated with resistance to Xvm, and these were grouped into five quantitative traits loci (QTL) on chromosomes 2, 3, 6, and 7. For each marker, we identified the favorable allele and the additive effect of replacing the reference allele with the alternative allele. The comparison between weevil borer (Cosmopolites sordidus (Germar)) and Xvm QTL revealed one QTL shared between the two biotic stresses at the distal end of chromosome 6 but with a repulsion linkage. This linkage should be broken down by generating more recombinants in the region. We also identified 18 putative alleles in the vicinity of the SNPs associated with resistance to Xvm. Among the 18 putative genes, two particularly putative genes, namely, Ma06_g13550 and Ma06_g36840, are most likely linked to disease resistance. This study is a basis for marker-assisted selection to improve banana resistance to banana Xanthomonas wilt, especially in East and Central Africa where the disease is still devastating the crop.

1. Introduction

Banana Xanthomonas wilt (BXW) is one of the devastating diseases of bananas (Musa spp.). The disease is caused by the bacterium Xanthomonas vasicola pv. musacearum (Xvm, formerly known as Xanthomonas campestris pv. musacearum), and results in yield losses of up to 80 to 100% [1]. The disease was first reported in Ethiopia in the 1960s, on ensete, a close relative of bananas [2]. It was first reported outside Ethiopia in Uganda in 2001 [3]. Since then, it has spread to the rest of the Great Lakes Region of East and Central Africa and is now a banana production constraint in Uganda, the eastern Democratic Republic of Congo, western Kenya, northwest and western Tanzania, and the whole of Rwanda and Burundi [4,5,6]. Since its first occurrence, the disease has swiftly and negatively impacted the livelihoods of the people in the region, in terms of income and food security [7,8].
The Gram-negative bacterium enters the plant through flower scars and especially contaminated cutting tools used in field management. The first symptoms of the disease include yellowing and wilting of plants, discoloration at the tip of the flower, withering of the flower bracts, premature ripening and rotting of the fruits, and a distinctive yellowish liquid that oozes out of the pseudostem upon cutting [9,10,11]. The plant dies within a month from the first appearance of the symptoms [12].
There are no known chemical or biological control measures for BXW [11,13]. Cultural management is based on minimizing the spread of the disease. It includes the destruction of affected plants within a mat, disinfection of the tools used in the plantation, the use of clean planting materials, early removal of male buds, and quarantine measures [9,13,14]. With proper deployment, these methods can significantly reduce the incidence of the disease, as exemplified in Uganda [8,15]. However, their sustainability requires keeping awareness high and active, and it comes with a sizable financial investment [16,17]. Therefore, complete eradication of the disease cannot be achieved as the disease keeps reoccurring and spreading anew.
Resistance to BXW is limited in bananas. All the banana cultivars in the Great Lakes region of East and Central Africa are susceptible [8,10]. These include the East African highland cooking banana (EAHB-AAAh, 2n = 3x = 33 and EAHB-AA (2n = 2x = 22), a main source of livelihood for smallholder farmers in the region. When no resistance is identified in cultivars, crop improvement turns to the wild relatives of the species to identify resistant genotypes and use them to develop resistant varieties. So far, wild banana, Musa balbisiana, one of the two progenitors of cultivated bananas, has been found to be resistant [10,18]. However, its use in cross-breeding as a source of resistance is restricted due to the endogenous Banana Streak Virus (eBSV) [19]. M. acuminata, the second progenitor of cultivated bananas, is widely used in crossbreeding as a source of resistance to pests and diseases in bananas [20]. However, Xvm resistance in M. acuminata is limited. A recent study [18] identified and confirmed partial resistance in M. acuminata ssp. zebrina, in the genotypes ITC1179 Monyet, ITC1178 Buitenzorg, ITC1177 Zebrina, and ITC0728 Maia Oa. Partial resistance was also identified in ITC1224 Kikundi and ITC0019 I.C.2, while many other M. acuminata genotypes were susceptible, including ITC1233 Kokopo. Beyond crossbreeding, resistant genotypes have been successfully developed with genetic engineering using Hrap and Pflp genes from sweet pepper and Xa2 from rice that confer resistance to BXW [21,22,23]. Although their adoption rate by end-users is potentially high, as estimated by Ainembabazi, et al. [24] in an ex-ante study, the release of the resistant genotypes from genetic engineering is still hampered by the lack of a regulation system for genetically modified organisms in most of sub-Saharan Africa. Gene editing has also given promising results, by targeting the Musa ortholog genes already known to confer susceptibility to bacterial diseases [25].
We build on a study that screened 72 Musa accessions for resistance to Xvm [18] to identify loci associated with resistance to BXW using F1 progenies from a cross between Monyet, a BXW partially resistant genotype, and Kokopo, a highly susceptible genotype. We used the continuous mapping method. This method uses allele-frequency estimates instead of genotype calls to counter the low sequencing depth of genotype by sequencing data, which results in miscalls, especially in polyploid populations [26,27].

2. Materials and Methods

2.1. Plant Material

This study used F1 progeny from a cross between Monyet (ITC1179) and Kokopo (ITC1233) [28]. The female parent, Monyet, a tetraploid (2n = 4x = 44) genotype of the zebrina subspecies that is also resistant to weevils (Cosmopolites sordidus (Germar)) and fusarium wilt race 1 [28,29], was one of the few M. acuminata genotypes identified as mildly resistant to BXW [18]. Monyet is recorded in the Musa International Transit Center as a diploid (https://www.crop-diversity.org/mgis/accession/01BEL0841179 (accessed on 6 November 2023)), but the ploidy analysis of the Monyet plants at the International Institute of Tropical Agriculture (IITA) in Uganda found the plants to be tetraploid (4x) [28,29]. Kokopo (ITC1233), a diploid (2n = 2x = 22) M. acuminata ssp. banksii genotype, which is highly susceptible to BXW [18], was used as the male parent for this population. We attempted a reciprocal cross of the two parents with Monyet as the male parent and Kokopo as the female parent. The cross did not produce any seeds because of the low pollen count of Monyet. The ploidy level of the progeny was confirmed as 3x for 94.3% of the population, with the rest being 2x (2.58%) and 4x (3.09%) [28]. This study used only the 3x progeny from the population.

2.2. Phenotyping

Phenotyping was carried out at IITA, Sendusu station in Uganda (0°31′30″ N; 32°36′54″ E, 1260 m above sea level), in a confined pot trial. Because of the low suckering behavior of the population, which resulted in a limited availability of the planting material at a given time, phenotyping was carried out in three separate experiments, where each experiment was laid out as a completely randomized block design with three blocks. Each block contained four plants per genotype. The parental genotypes were repeated in each experiment as controls and seven F1 hybrids were repeated in two experiments. The first experiment had 122 F1 hybrids and was evaluated from April to July 2019. The second experiment had 26 F1 hybrids and was evaluated from September to December 2020, and the third experiment had 41 F1 hybrids and was evaluated from October 2021 to February 2022. For each genotype, 12 plants were raised from healthy disease-free corms that were pared and treated with Dursban (chlorpyrifos, belonging to the phosphonothioate group of organophosphorus pesticides, Dow AgroSciences LLC) for 20 min to eliminate nematodes and weevils prior to planting. The plants were established in 13 L containers containing sterilized top forest soil, manure, and sawdust at a ratio of 3:1:1. In total, 182 F1 hybrids were screened, together with the two parents.
The plants were inoculated three months after planting. Screening was performed using U40L2, the Xanthomonas vasicola pv. musacearum (Xvm) isolate from Uganda. The isolate was confirmed to be Xvm using Xvm-specific primers [30] and characterized as sublineage II [31,32]. To prepare the inoculum, U40L2 isolate previously stored at −80 °C was multiplied in a Yeast Peptone Dextrose (YPD) broth medium and incubated at 28 °C for 48 h. The inoculum was adjusted to 1 × 10⁸ colony forming units per mL (~0.5 OD600) using a spectrophotometer (Thermo Fisher Scientific Inc., Pittsburgh, PA, USA) before inoculation. Nine of the twelve plants for each genotype, or three plants per genotype per block per batch, were inoculated with Xvm [18]. The remaining three plants served as controls and were inoculated with sterile distilled water without Xvm.
Data were collected weekly for 105 days from the day of inoculation (dpi). The parameters were the number of functional leaves, the number of leaves wilting, and the death of the entire plant. The time interval between inoculation and the appearance of disease symptoms and complete wilting (as dpi) was computed by counting the number of days from inoculation to symptom development. The time to complete wilting of the plant was computed by counting the number of days from inoculation to the death of the entire plant. A disease severity scale of 1 to 3 was used to compute the disease index using Equation (1).
DI = (((1 × A) + (2 × B) + (3 × C))/total number of plants) × 100
where DI = disease index;
A = number of plants with an inoculated leaf showing symptoms;
B = number of plants with uninoculated leaves showing symptoms;
C = number of wilted (dead) plants [18].
Average data for each weekly score per hybrid was used to compute the area under the disease progress curve (AUDPC) to quantitatively summarize disease intensity over time and to analyze differences among hybrids. The calculation was performed using Equation (2) by Ceballos, et al. [33] and Forbes, et al. [34]:
f A U D P C = i = 1 N i 1 ( Y i + Y i + 1 2 ) ( t i + 1 + t i )
where t = time in weeks of each reading;
Y = percentage of affected plants at each reading;
N = number of observations;
i = reading.

2.3. Analysis of the Phenotypic Data

An exponential model relating AUDPC to dpi for each individual plant was fitted using exponential or asymptotic regression as implemented in Genstat 22nd Edition [35]. The model is:
AUDPC = A + B × RX,
which represents a curve rising to a plateau or asymptote at the value defined by the parameter A (=maxAUDPC). The direction of the response was selected as “right”, corresponding to a value of R greater than 0 but less than 1. Parameter B represents the growth rate.
In the next step, two linear mixed models (Equations (4) and (5), where the random terms are underlined) were fitted to the individual maxAUDPC values as follows:
y i j k = u 0 + E x p k + E x p · B l o c k j ( k ) _ + H y b r i d s i _ + P a r e n t s i + e r r o r i j k
y i j k = u 0 + E x p k + E x p · B l o c k j ( k ) _ + H y b r i d s i + P a r e n t s i + e r r o r i j k
Both models are similar with fixed experiment and parent effects and random block effects nested within experiment. The only difference between models 4 and 5 is that in model 4, the F1 hybrids were modeled as random effects to allow the estimation of the genetic variance component and heritability according to Cullis et al. [36], and in model 5, the F1 hybrids were modeled as fixed effects to produce adjusted means (Best Linear Unbiased Estimates, BLUEs), which were used in the subsequent mapping. The fitting of both models was performed using the preliminary single environment analysis menu, selected from the Stats > QTLs (linkage/association) > Phenotypic Analysis menu in Genstat. The homogeneity in the residual variance and the normality of the residuals were checked visually using residual plots.

2.4. Genotyping

The genotyping procedure and the genotypic data for this population are described in Uwimana, Mwanje, Batte, Akech, Shah, Vuylsteke, and Swennen [28]. Briefly, genomic DNA was extracted from cigar leaves using the CTAB method as described by Das, et al. [37]. The DNA concentration was estimated using a NanoDropTM 2000 spectrometer (ThermoFisher Scientific), and 50 µL per sample at a concentration of 75 ng/µL was sent to Biosciences Eastern and Central Africa–International Livestock Research Institute (BecA–ILRI) for genotyping using DArTSeq under the Integrated Genotyping Service and Support (IGSS). Genome complexity reduction was performed using the enzyme PstI for library preparation. The data were received as fastq files. After trimming the adapters using the FASTX-Toolkit version 0.0.132, the sequences in the fastq files were aligned to the sequence of the second version of the double haploid (DH) Pahang banana reference genome [38] using Bowtie2 version 2.3.4.1 [39]. The data were filtered for a minor allele frequency of 0.02. This genotyping resulted in 18,009 segregating SNPs, with 14,254 SNPs segregating in Kokopo only, 3067 SNPs segregating in Monyet only, and 688 SNPs segregating in both parents [28].

2.5. Continuous Mapping

Continuous mapping was performed in 135 F1 hybrids that were genotyped and phenotyped. Because of the limited resources to construct linkage maps and perform QTL analyses in odd ploidy levels such as triploids, and the low sequencing depth associated with DArTSeq, which is often associated with genotype miscalling in polyploids, genotype calling was not carried out for the F1 hybrids. Instead, continuous mapping [27,28] was performed by regressing the adjusted means of maxAUDPC on the allele frequencies per SNP marker locus, followed by calculating p-values to assess the significance of the phenotype-SNP association and the estimation of the additive effects. The allele frequency bias was corrected using the formula in Equation (6).
Correction   factor = 1 1 + 2 S T
where ST represents the average sequencing depth across all samples [27,28].
Because continuous mapping involves conducting multiple significance tests along the genome, it needs adjustment for multiple comparisons. Assuming an independent test at every marker is a very conservative assumption, particularly when large LD blocks are present, as is the case in an F1 mapping population in general. We assumed, therefore, that the number of LD blocks = 50 and calculated the threshold as −log10(α/#LD blocks) = 3, where the parameter α is the genome-wide Type I error rate (default 0.05).

2.6. Identification of Putative Genes Linked with the Resistance Loci

The genes in the vicinity (≤2.5 Mbp) of the identified loci linked with Xvm were identified using the annotated file of the DH Pahang reference genome version 2 [38]. ClosestBed function of bedtools (v2.29.0) was used to query the annotation file based on the physical positions of the SNPs [40]. The attributes of the identified putative genes were searched in the gene list of the protein analysis using evolutionary relationships gene ontology (PANTHER 18.0) with the M. acuminata spp. malaccensis database as the reference [41].

3. Results

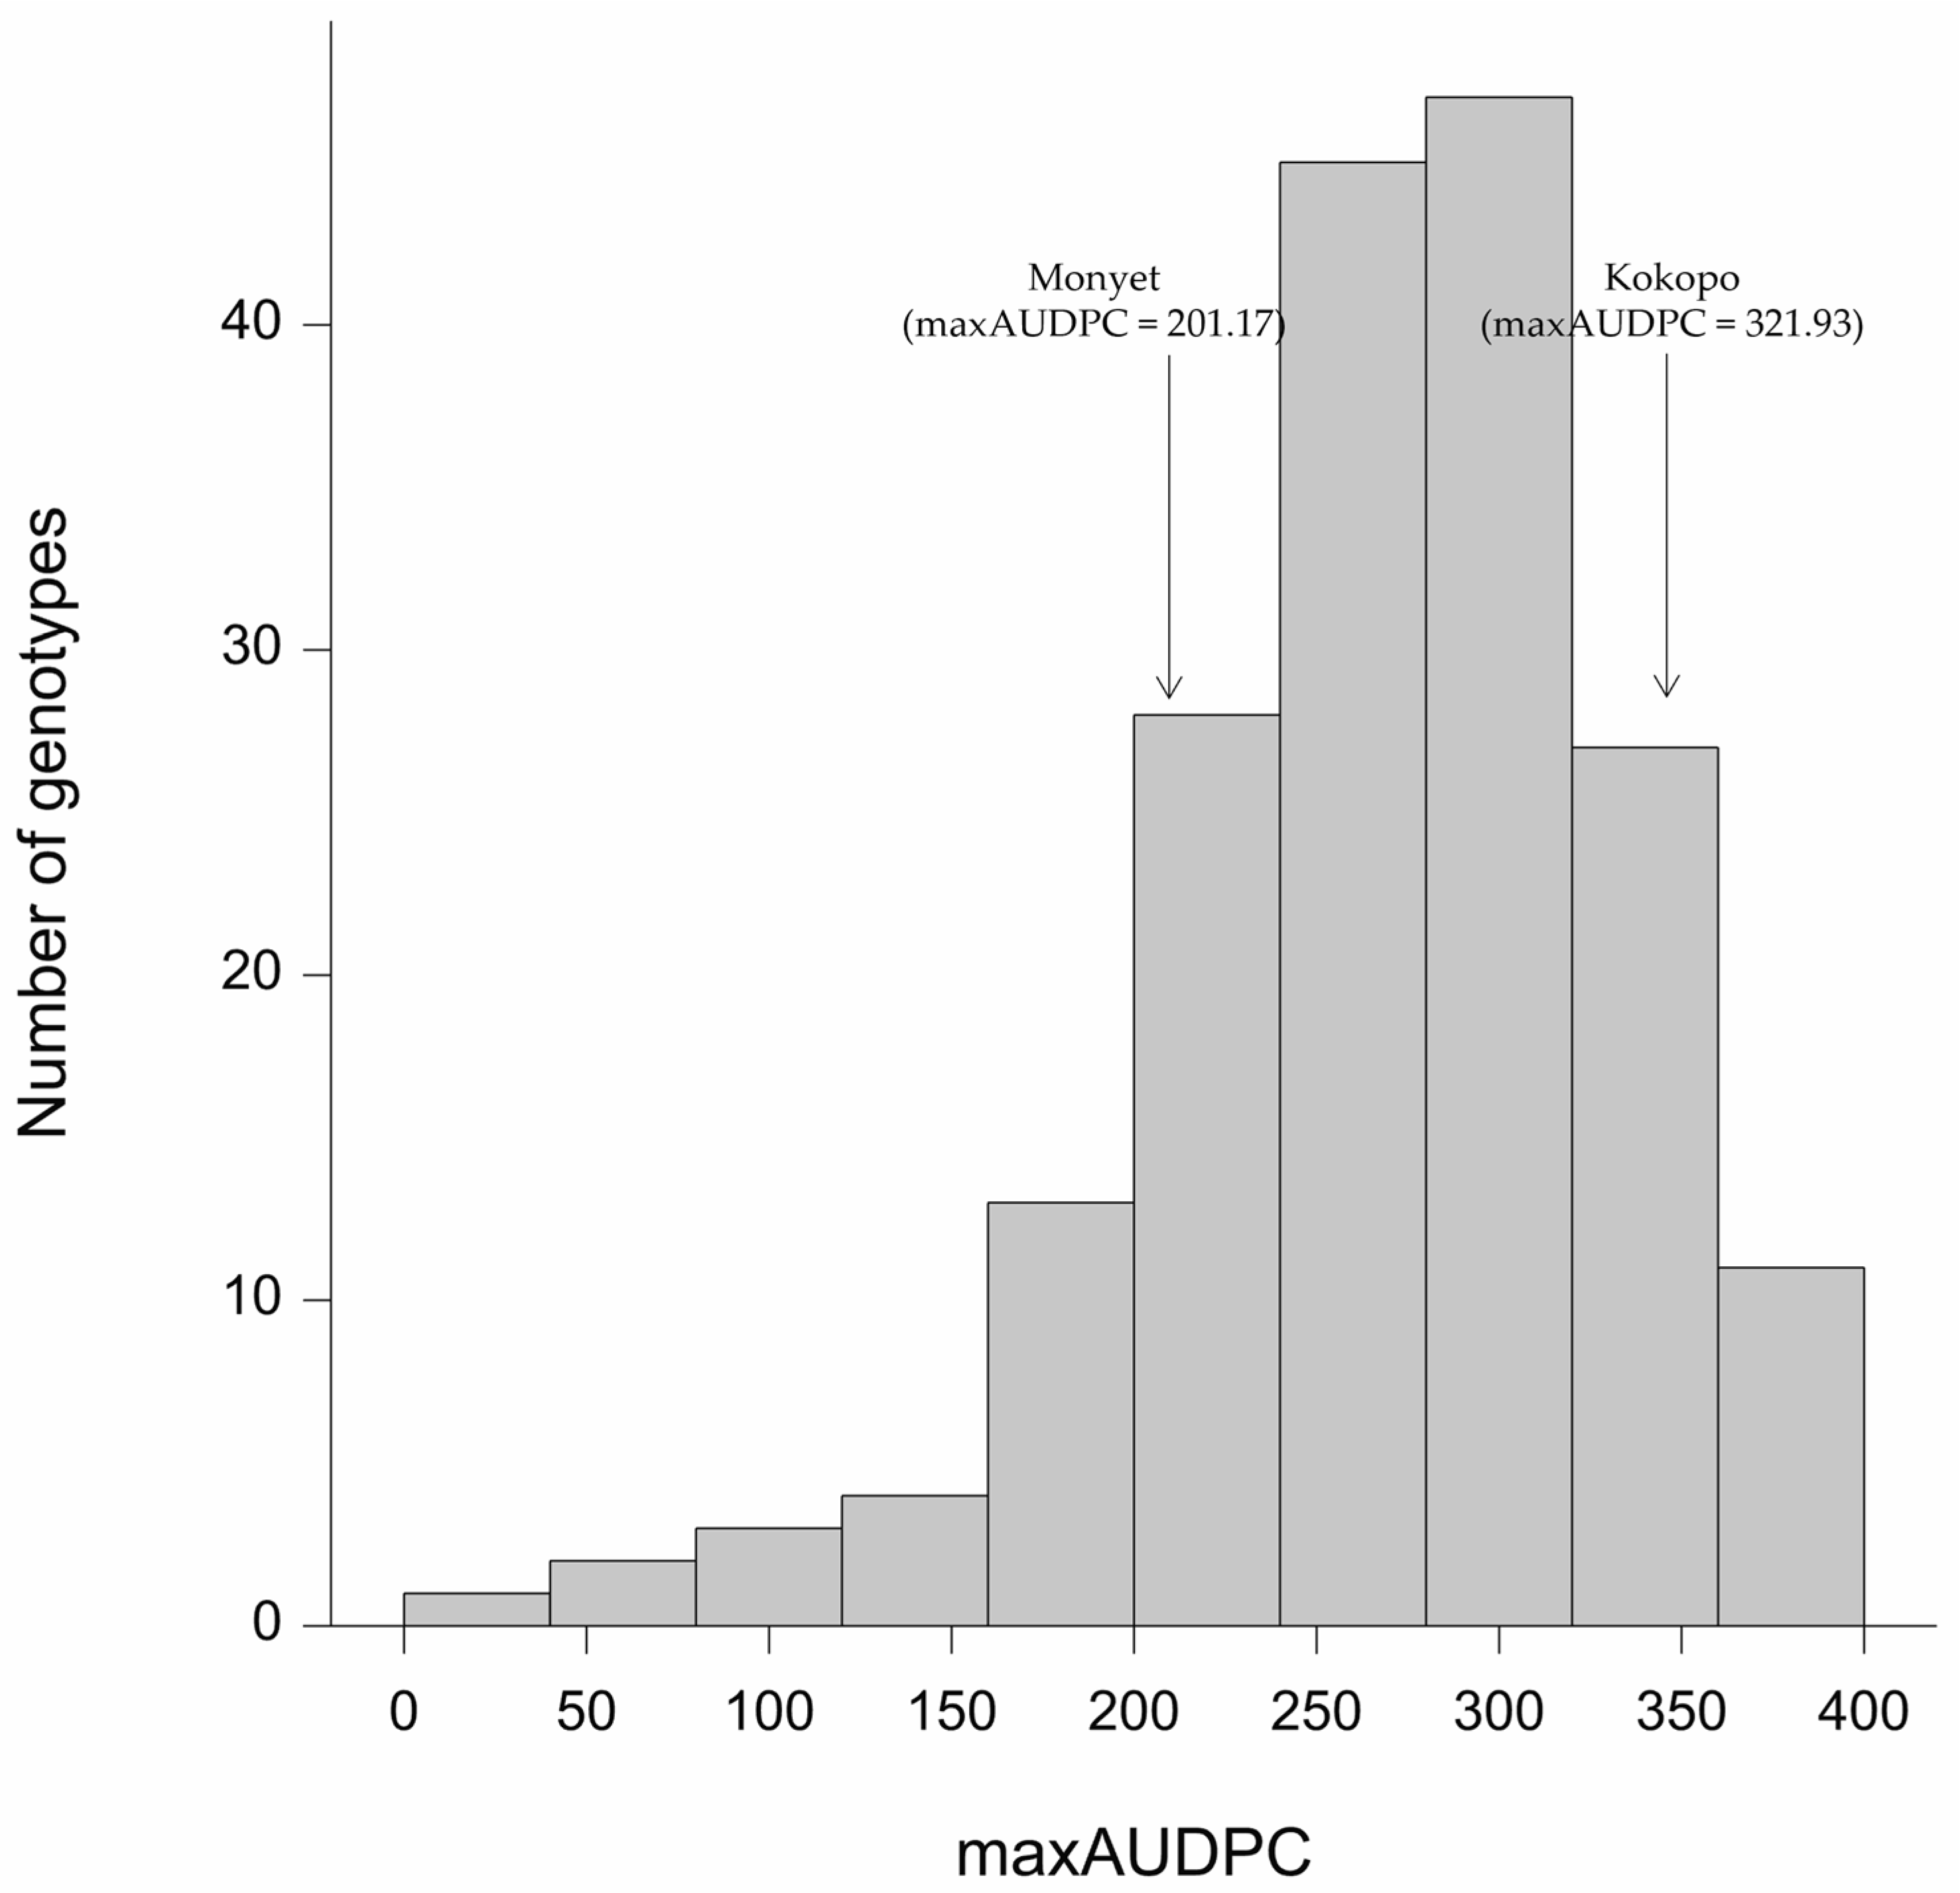
3.1. Phenotypic Variation and Heritability

Symptoms started to appear in the inoculated susceptible parent Kokopo as early as 21 days post-inoculation (dpi), with progressive yellowing and wilting of the inoculated leaves. The uninoculated leaves of Kokopo started showing symptoms at 35 dpi, indicating a fast progression of the disease within the plant. By 42 dpi, all nine Xvm-inoculated plants of Kokopo were dead. In Monyet, symptoms on inoculated leaves were first observed at 28 dpi. Uninoculated leaves of this genotype started showing symptoms by 58 dpi. In contrast to Kokopo, none of the Monyet plants died. At the end of the experiment (105 dpi), Monyet was significantly more resistant than Kokopo, having a maxAUDPC of 201.17 compared with 321.93 (Figure 1).
The F1 hybrids started showing symptoms in the uninoculated leaves as early as 7 dpi in the most susceptible genotype and at 63 dpi in the most resistant genotype. Fitting model 1 showed a relatively large genetic variance component in comparison with the other sources of random variation, resulting in a broad sense heritability of 0.62 for maxAUDPC. Fitting model 2 produced the adjusted means for each of the F1 hybrids. For both models, residuals were consistent with an independent sample from a normal distribution with constant variance. The histogram of residuals was reasonably symmetrical, and there was no evidence of variance changing in relation to the fitted values. The normal plots were reasonably close to a straight line, giving no evidence of departure from the model assumptions of normality and constant variance. The adjusted maxAUDPC means for the F1 hybrids ranged from 14.59, for genotype F1MK-108, to 394.52, for genotype F1MK-144. The population showed transgressive segregation, with 17 F1 hybrids being more resistant than Monyet and 9 F1 hybrids being more susceptible than Kokopo.

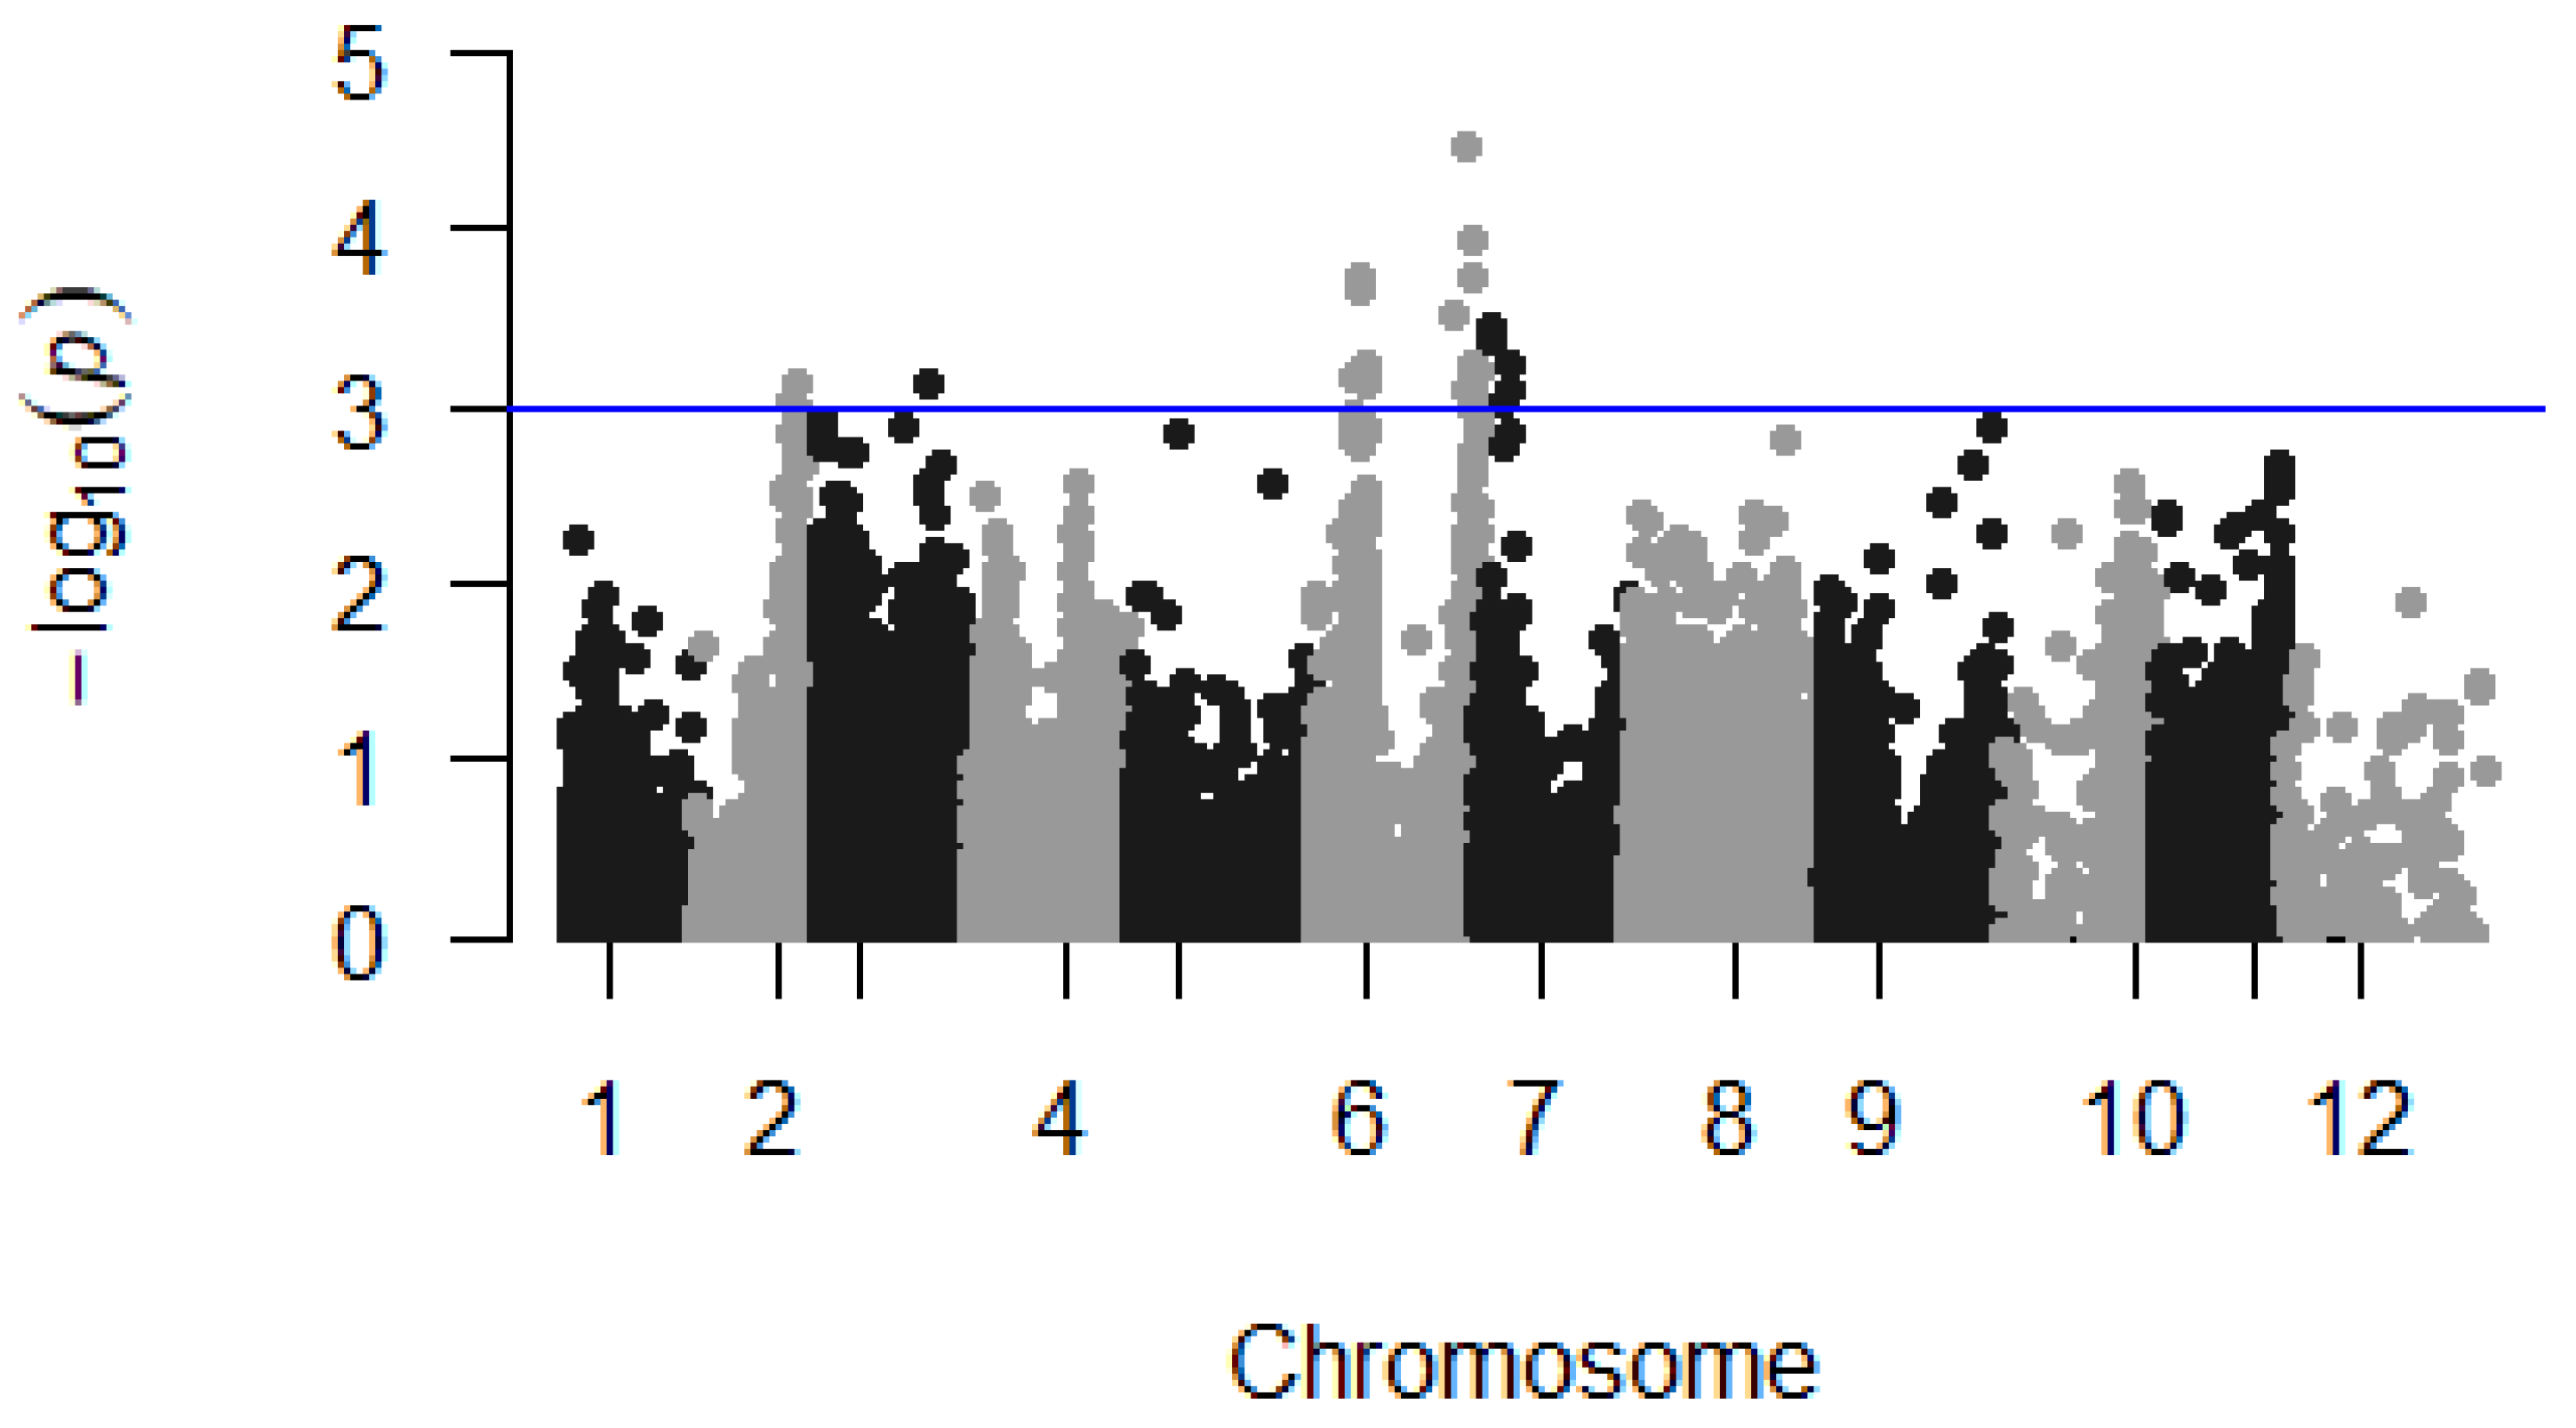
3.2. Continuous Mapping

Continuous QTL mapping identified 25 markers significantly (p ≤ 0.001, equivalent to −log(p) ≥ 3) associated with resistance to Xvm (Table 1, Figure 2). Sixteen markers (64%) were located on chromosome 6 where they clustered into two distinct QTL at the two distal ends of the chromosome (Figure 2). Chromosome 7 also had a QTL that contained six markers that were significantly associated with the trait. The remaining markers were located on chromosomes 2 (two markers) and 3 (one marker) (Table 1, Figure 2). Considering the five QTLs (Figure 2), the additive explained variance sums up to 44.5% (Table 1), with every QTL represented by the most significant marker. Continuous mapping also estimated the effect of replacing the reference allele with the alternative allele at each locus (Table 1). The reference allele was linked to a positive effect for 15 markers, meaning that whenever the reference allele was replaced with the alternative allele, maxAUDPC (susceptibility) increased (Table 1). For the remaining 11 markers, the favorable allele was the alternative allele (negative effect, Table 1). At every marker, Monyet had two to four counts of the favorable allele, resulting in 87.5% frequency for the favorable alleles. Kokopo, the susceptible parent also carried favorable alleles, mostly in a heterozygous state, for 20 out of 26 markers, resulting in a frequency of the favorable alleles of 54% (Table 1).

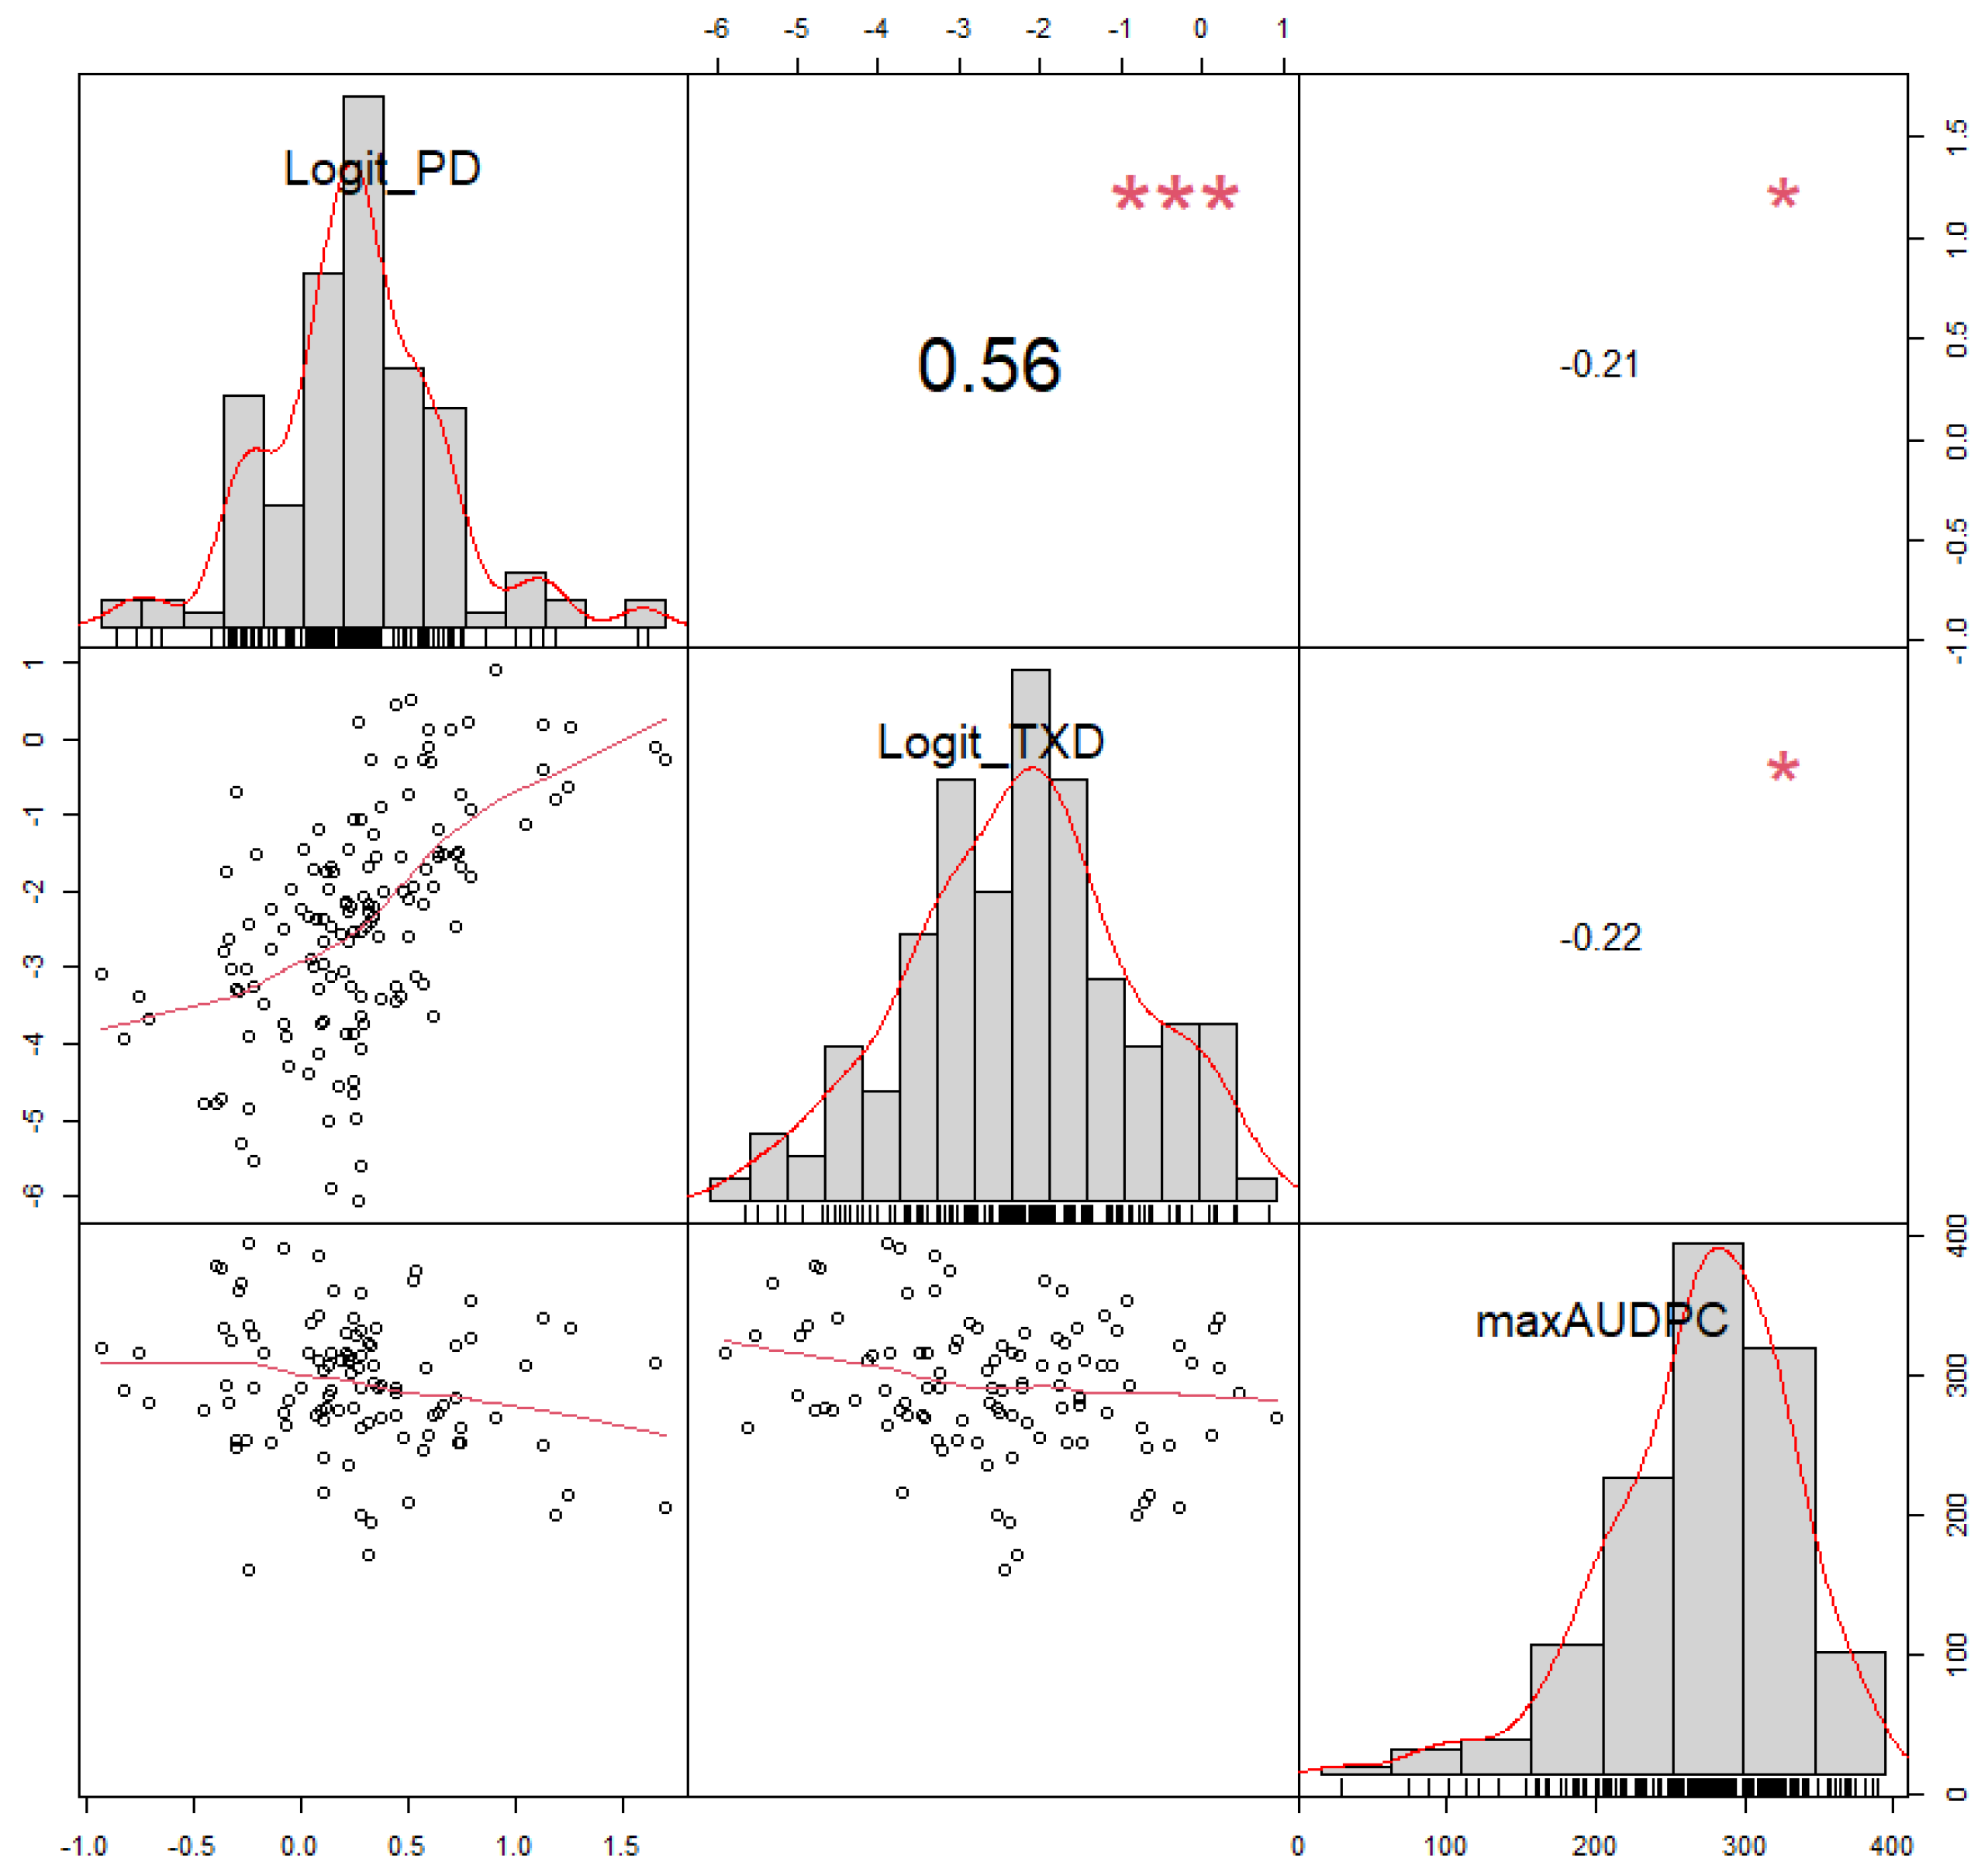
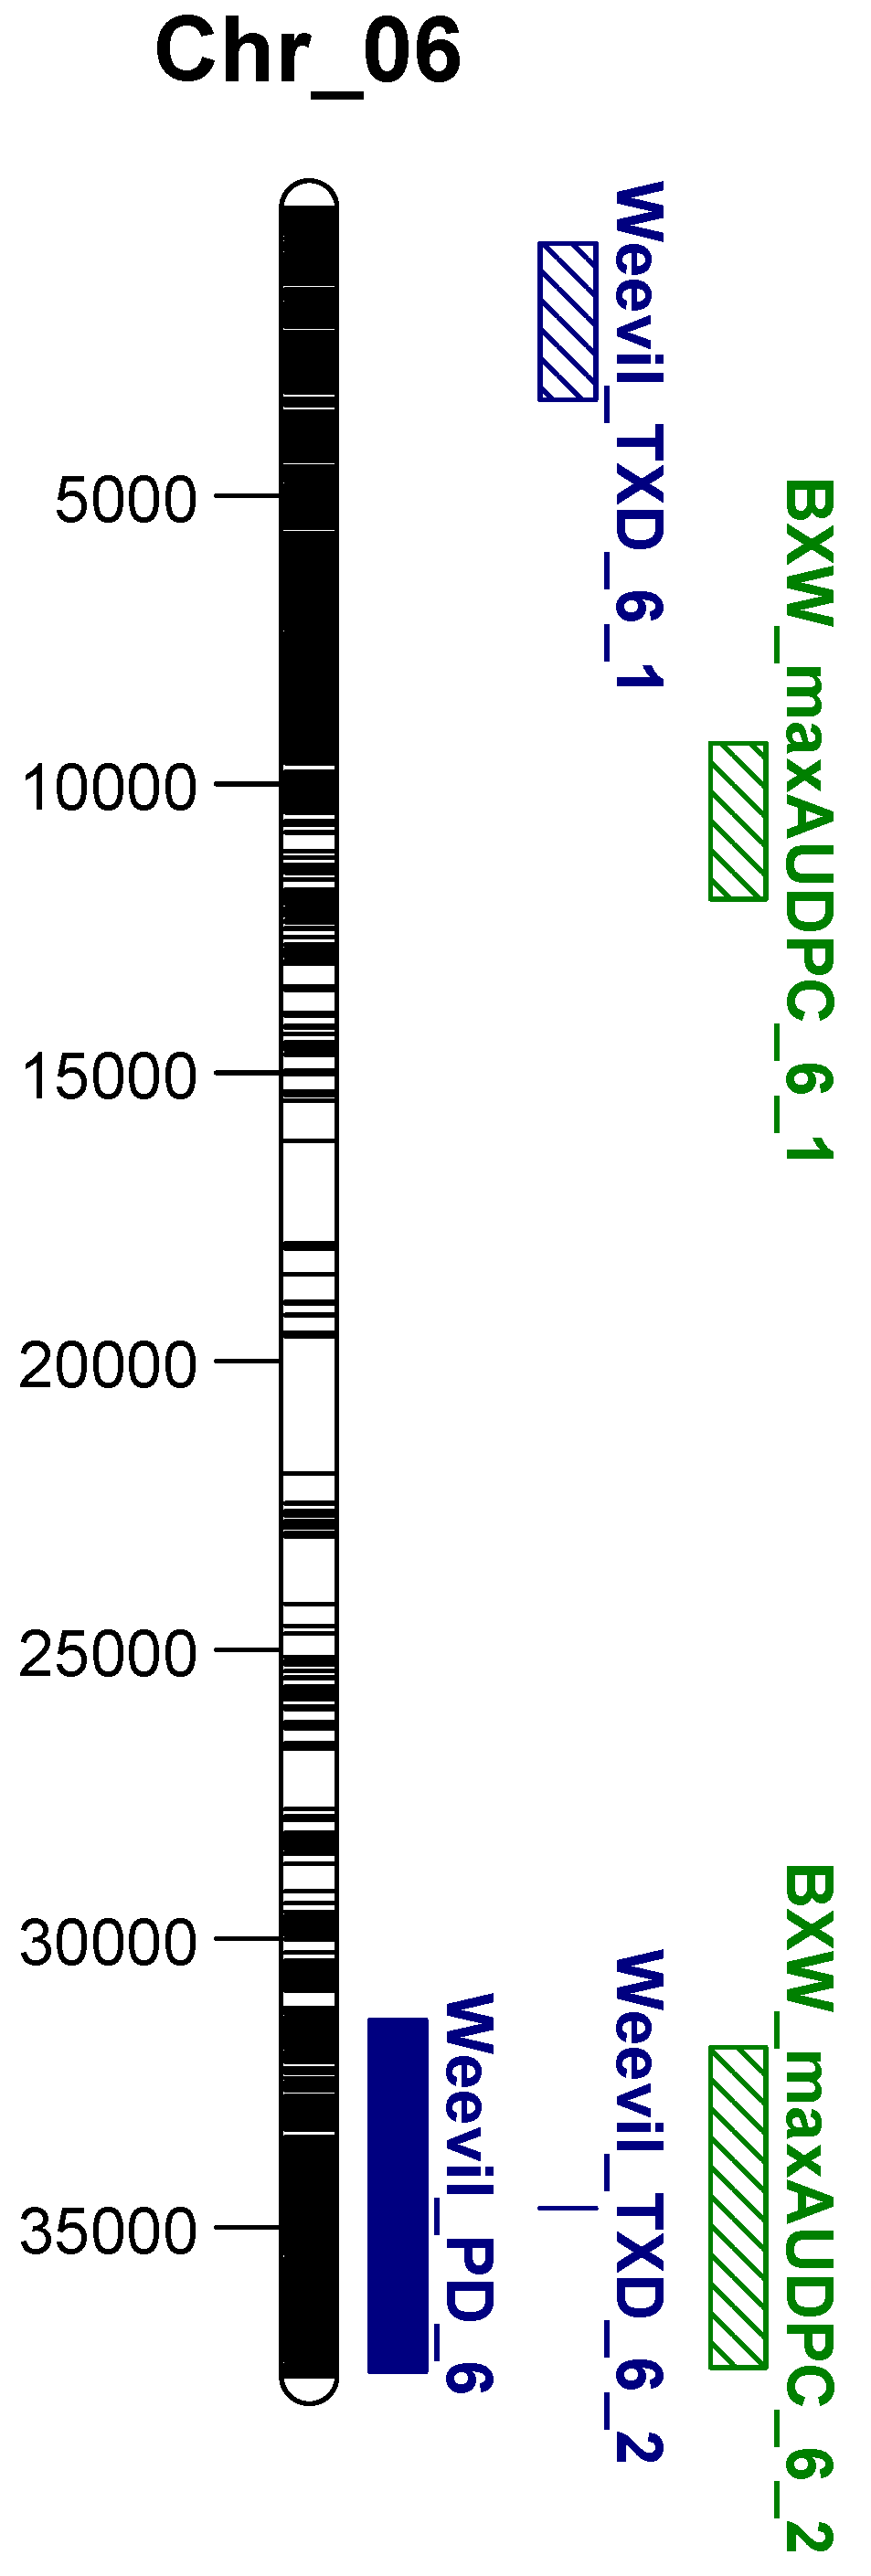
3.3. Comparison between Weevil and BXW Resistance

As mentioned above, the same Monyet × Kokopo population was used to identify the loci associated with weevil (Cosmopolites sordidus (Germar)) resistance (Section 2.1) using peripheral damage (PD) and total cross-section damage (TXD) of the corm as traits [28]. The correlation analysis of adjusted F1 means showed a low negative but significant correlation between the two weevil resistance traits (PD and TXD) with maxAUDPC (r = −0.21 and −0.22 and p ≤ 0.05, respectively, Figure 3). We also compared the positions and allelic effect of the loci identified for resistance to Xvm with those associated with weevil resistance based on the physical map of the DH Pahang reference genome version 2 using MapChart 2.32 [42]. There were three QTLs unique to banana resistance to weevils on chromosomes (two for peripheral damage on chromosomes 5 and 8, and one for total cross-section damage at the beginning of chromosome 6) and four QTLs unique to banana resistance to Xvm. One QTL was shared between weevil and Xvm resistance at the distal end of chromosome 6 (Figure 4). While PD and maxAUDPC had many shared markers, which allowed us to compare the two, TXD had only one marker in the region. The allelic effects of the shared markers and those in the vicinity between peripheral damage and maxAUDPC show an antagonistic effect (repulsion linkage) between the two traits, with Monyet carrying four copies (homozygous) of the favorable alleles for resistance to Xvm but the same alleles being unfavorable for resistance to weevil damage as peripheral damage. In contrast, Kokopo is heterozygous for the favorable and unfavorable alleles.

3.4. Putative Genes

The search for the putative genes returned 18 genes in the vicinity of the markers associated with resistance to Xvm with one to three markers per gene (Table 2). Ten of the genes had significant SNPs within the gene sequences, while the remaining eight were located at a maximum distance of 2.2 kbp. The PANTHER analysis returned 25 biological processes for the 18 putative genes. Thirteen of the processes fell under the unclassified category, while twelve were classified into six functional categories (Figure 5). Among the seven biological processes, three are most likely associated with disease resistance, namely, the biological process involved in interspecies interaction between organisms (GO:0044419), the immune system process (GO:0002376), and the response to stimulus (GO:0050896). Two putative genes were involved in the three above-mentioned biological functions, namely, Ma06_g13550 (biological process involved in the interspecies interaction between organisms, the immune system, and the response to stimulus) and Ma06_g36840 (the response to stimulus). The two putative genes were annotated as MACPF domain-containing protein At4g24290-like and transmembrane protein adipocyte-associated 1-like, respectively (Table 2). We also obtained the list of 1851 putative genes found in the four QTL regions but not in the vicinity of the significant SNPs (those with more than one significant marker). The list is provided as Supplementary Table S1.

4. Discussion

Banana production is handicapped by many biotic and abiotic stresses that reduce yield. The particularity of X. vasicola pv. musacearum is that affected plants produce non-edible fruits, hence causing high yield and economic losses [1,7,8]. The screening of 72 accessions from the banana collection in Sendusu revealed limited resistance to the disease in Musa acuminata, mostly identified in the subspecies zebrina [18]. This study evaluated the response of triploid banana hybrids from a bi-parental population of 182 hybrids generated by crossing mildly resistant Monyet (4x) with highly susceptible Kokopo (2x).
The parents behaved as expected, with Kokopo being identified as highly susceptible and Monyet as moderately resistant [18]. The cross between the two parents produced highly resistant genotypes through transgressive segregation [43]. Although Kokopo is the susceptible genotype, it also carries alleles associated with resistance at a rate of 54% in a heterozygous state. Therefore, transgressive segregation could be a result of the dispersion of favorable alleles from the two parents [44]. Alternatively, the observed transgressive segregation could be a result of heterosis through hybrid vigor, as often observed among polyploid hybrids [45]. These hybrids constitute, so far, the most Xvm-resistant genotypes known from the Musa acuminata genome and are valuable in breeding for resistance to the disease. Given their triploid level [28], their resistance should be transferred into a diploid background to increase the seed set and the ease of crossing for an improvement in the parents. However, if the observed transgressive segregation is from heterosis, its exploitation might be difficult as hybrid vigor disappears with increased homozygosity and may result in inbreeding depression through introgression, especially in a cross-pollinated crop such as banana [46].
A number of studies have applied the continuous mapping method in genetic and genomic analyses with low sequencing depth data to counter the effect of low-sequencing depth on genotype calling in polyploids [26,28,47]. The major drawback of continuous mapping is that its results do not give any information about the genetic inheritance pattern of the trait, such as the effect of dominance, epistasis, and linkage disequilibrium as a result of linkage [28], which is not the case for genomic selection. The major strengths of continuous mapping, however, are its simple technique (i.e., simple linear regression), which achieves fast QTL results without a heavy computational load, and its ability to circumvent the accurate calling of the allele dosage genotypes and the lack of resources to construct linkage maps and perform QTL analyses in odd ploidy levels [48]. Continuous mapping identified 25 markers significantly associated with resistance to Xvm. The markers clustered into five main QTLs, which were in line with the medium broad-sense heritability of 0.62. The additive effect of replacing the reference allele with the alternative allele was determined at each marker point. This study complements the recent marker–trait association studies for pests and diseases in bananas for fusarium wilt caused by Fusarium oxysporum f. sp. cubense [49,50,51] and weevils or Cosmopolites sordidus (Germar) [28]. We did not find any common loci between resistance to fusarium wilt and resistance to Xvm, neither due to the differences in the pathogens nor because the studies were performed in different genetic backgrounds (M. acuminata spp. malaccensis for fusarium wilt vs. Musa acuminata spp. banksii and zebrina in this study). We compared the results of resistance to weevils and resistance to Xvm since the two were performed in the same population. There were three QTLs unique to banana resistance to weevil and four QTLs unique to banana resistance to Xvm. We identified a common locus between the two biotic stresses at the distal end of chromosome 6 for the traits maxAUDPC (Xvm), peripheral damage (resistance to weevil), and total cross-section damage (resistance to weevil). The allelic effects suggest a repulsion linkage phase between the weevil (peripheral damage) and Xvm traits, which was corroborated by the negative correlation between the weevil and BXW traits. Repulsion linkage between traits is undesirable as it complicates selection. More recombinants in the region are needed to estimate the intensity and, if possible, to break down this antagonistic linkage [52,53,54].
We identified 18 putative genes in the vicinity of the markers associated with resistance to BXW. Thirteen out of twenty-five biological processes of the identified putative genes were unclassified. The two genes of interest, Ma06_g13550 and Ma06_g36840, have been associated with resistance. Ma06_g13550 belongs to the membrane attack complex component/perforin (MACPF) domain-containing protein CAD1 (constitutively activated cell death 1) family, a domain operating at the plasma membrane level and involved in resistance through cellular response to stress, programmed cell death, and the innate immune system. In a model organism, Arabidopsis thaliana, At4g24290 and CAD1 from the same family and the closest orthologs to Ma06_g13550 confer resistance to bacterial pathogens [55,56]. The gene is a close ortholog of Zm00001eb241040 (protein C0PFJ5) in maize [57] and Os02g0475300 (protein Q6K741) in rice [58], with speculated similar functions. Ma06_g36840 belongs to the transmembrane protein adipocyte-associated 1 (PTHR15876) family and operates at the plasma membrane level. It is involved in the G protein-coupled receptor signaling pathway and plays a role in plant–microbe interactions [59]. Among the monocot crops, it is closest to Zm00001eb214610 (protein B6T9J0) [57] and TraesCS5A02G393300 (protein A0A3B6KPS1) in wheat [60].
Zebrina is one of the three M. acuminata subspecies that are the main contributors to edible bananas, together with banksii, and malaccensis [61,62,63,64]. In the evaluation of various accessions for their response to Xvm, zebrina was found to be partially resistant, while banksii and malaccensis were found to be highly susceptible [18]. That study screened 72 wild and cultivated Musa spp., and so far, it is the most extensive evaluation of banana germplasm for Xvm resistance. There is a need to expand the search for resistance to Xvm in bananas by screening wild genotypes. The markers associated with resistance to Xvm, as identified in this study, will enable a fast genotyping-based screening of wild diploid accessions closely related to Monyet or belonging to the zebrina subspecies [63]. These, in contrast to 4x Monyet, will be readily usable for introgression in the improvement of diploid parents. They will also help to establish whether the other genotypes that are resistant or partially resistant to Xvm, namely, the M. acuminata spp. zebrina genotypes (ITC0728 Maia Oa, ITC1177 Zebrina, and ITC1178 Buitenzorg), the non-zebrina M. acuminata genotypes (ITC1224 Kikundi and ITC0019 I.C.2), and those containing the B-genome (MMC 192 M. balbisiana, ITC0116 Saba, ITC1120 Tani, ITC0396 Pelipita, ITC0246 Cameroun, and ITC0243 Pisang Raja) [18], share the same resistance alleles as Monyet or constitute other sources of resistance to Xvm.

Supplementary Materials

The following supporting information can be downloaded at: https://www.mdpi.com/article/10.3390/horticulturae10010087/s1, Table S1: List of all the genes in the QTL regions (chromosomes 2, 6 and 7) associated with resistance to banana Xanthomonas wilt based on the DH Pahang reference genome version 2.

Author Contributions

Conceptualization, B.U., G.S.M. and R.S.; methodology, B.U., G.V.N., G.S.M., M.V. and T.S.; formal analysis, B.U., M.V. and T.S.; investigation, G.V.N., B.U., R.K., C.N., G.M. and V.A.; resources, G.V.N., B.U., R.K., C.N., G.M. and V.A.; data curation, G.V.N., R.K. and G.M.; writing—original draft preparation, B.U.; writing—review and editing, G.V.N., M.V. and T.S.; visualization and supervision, B.U.; funding acquisition, B.U. and R.S. All authors have read and agreed to the published version of the manuscript.

Funding

This study was financially supported by the Bill and Melinda Gates Foundation under grant number OPP1213871.

Data Availability Statement

The raw phenotypic and genotypic data (as CSV and fastq files) are publicly available on https://doi.org/10.5281/zenodo.10457997 (accessed on 5 January 2024).

Conflicts of Interest

Author Dr. Marnik Vuylsteke was employed by the company Gnomixx B.V. The remaining authors declare that this research was conducted in the absence of any commercial or financial relationships that could be construed as a potential conflict of interest.

References

  1. Geberewold, A.Z. Review on impact of banana bacterial wilt (Xhantomonas campestris pv. Musacerum) in East and Central Africa. Cogent Food Agric. 2019, 5, 1586075. [Google Scholar] [CrossRef]
  2. Yirgou, D.; Bradbury, J. Bacterial wilt of enset (Ensete ventricosum) incited by Xanthomonas musacearum sp. n. Phytopathology 1968, 58, 111–112. [Google Scholar]
  3. Tushemereirwe, W.; Kangire, A.; Ssekiwoko, F.; Offord, L.; Crozier, J.; Boa, E.; Rutherford, M.; Smith, J. First report of Xanthomonas campestris pv. musacearum on banana in Uganda. Plant Pathol. 2004, 53, 802. [Google Scholar] [CrossRef]
  4. Reeder, R.; Muhinyuza, J.; Opolot, O.; Aritua, V.; Crozier, J.; Smith, J. Presence of banana bacterial wilt (Xanthomonas campestris pv. musacearum) in Rwanda. Plant Pathol. 2007, 56, 1038. [Google Scholar] [CrossRef]
  5. Carter, B.A.; Reeder, R.; Mgenzi, S.; Mwangi, M.; Aritua, V.; Smith, J.; Beed, F.D.; Kinyua, Z.; Nakato, V.; Miller, S. Identification of Xanthomonas vasicola (formerly X. campestris pv. musacearum), causative organism of banana xanthomonas wilt, in Tanzania, Kenya and Burundi. Plant Pathol. 2010, 59, 403. [Google Scholar] [CrossRef]
  6. Ndungo, V.; Eden-Green, S.; Blomme, G.; Crozier, J.; Smith, J. Presence of banana Xanthomonas wilt (Xanthomonas campestris pv. musacearum) in the Democratic Republic of Congo (DRC). Plant Pathol. 2006, 55, 294. [Google Scholar] [CrossRef]
  7. Nkuba, J.; Tinzaara, W.; Night, G.; Niko, N.; Jogo, W.; Ndyetabula, I.; Mukandala, L.; Ndayihazamaso, P.; Niyongere, C.; Gaidashova, S.; et al. Adverse impact of Banana Xanthomonas Wilt on farmers’ livelihoods in Eastern and Central Africa. Afr. J. Plant Sci. 2015, 9, 279–286. [Google Scholar] [CrossRef]
  8. Karamura, E.; Kayobyo, G.; Tushemereirwe, W.; Benin, S.; Blomme, G.; Green, S.E.; Markham, R. Assessing the impacts of banana bacterial wilt disease on banana (Musa spp.) productivity and livelihoods of Ugandan farm households. In Proceedings of the IV International Symposium on Banana: International Conference on Banana and Plantain in Africa: Harnessing International 879, Mombasa, Kenya, 5 October 2008; pp. 749–755. [Google Scholar]
  9. Tinzaara, W.; Karamura, E.; Kubiriba, J.; Ochola, D.; Ocimati, W.; Blomme, G.; Ssekiwoko, F. The banana Xanthomonas wilt epidemic in east and central Africa: Current research and development efforts. In Proceedings of the XXIX International Horticultural Congress on Horticulture: Sustaining Lives, Livelihoods and Landscapes (IHC2014): IX 1114, Brisbane, Australia, 17 August 2014; pp. 267–274. [Google Scholar]
  10. Tripathi, L.; Tripathi, J. Relative susceptibility of banana cultivars to Xanthomonas campestris pv. musacearum. Afr. J. Biotechnol. 2009, 8, 5343–5350. [Google Scholar]
  11. Tripathi, L.; Mwangi, M.; Abele, S.; Aritua, V.; Tushemereirwe, W.K.; Bandyopadhyay, R. Xanthomonas wilt: A threat to banana production in East and Central Africa. Plant Dis. 2009, 93, 440–451. [Google Scholar] [CrossRef]
  12. Tripathi, L.; Tripathi, J.N.; Tushemereirwe, W. Strategies for resistance to bacterial wilt disease of bananas through genetic engineering. Afr. J. Biotechnol. 2004, 3, 688–692. [Google Scholar]
  13. Biruma, M.; Pillay, M.; Tripathi, L.; Blomme, G.; Abele, S.; Mwangi, M.; Bandyopadhyay, R.; Muchunguzi, P.; Kassim, S.; Nyine, M. Banana Xanthomonas wilt: A review of the disease, management strategies and future research directions. Afr. J. Biotechnol. 2007, 6, 953–962. [Google Scholar]
  14. Blomme, G.; Jacobsen, K.; Ocimati, W.; Beed, F.; Ntamwira, J.; Sivirihauma, C.; Ssekiwoko, F.; Nakato, V.; Kubiriba, J.; Tripathi, L. Fine-tuning banana Xanthomonas wilt control options over the past decade in East and Central Africa. Eur. J. Plant Pathol. 2014, 139, 271–287. [Google Scholar] [CrossRef]
  15. Kubiriba, J.; Karamura, E.B.; Jogo, W.; Tushemereirwe, W.K.; Tinzaara, W. Community mobilization: A key to effective control of banana xanthomonas wilt. J. Dev. Agric. Econ. 2012, 4, 125–131. [Google Scholar] [CrossRef]
  16. Mwangi, M.; Nakato, V. Key factors responsible for the xanthomonas wilt epidemic on banana in East and Central Africa. In Proceedings of the III International Symposium on Banana: ISHS-ProMusa Symposium on Recent Advances in Banana Crop Protection for Sustainable 828, White River, South Africa, 10–14 September 2007; pp. 395–404. [Google Scholar]
  17. Tinzaara, W.; Karamura, E.B.; Blomme, G.; Jogo, W.; Ocimati, W.; Rietveld, A.; Kubiriba, J.; Opio, F. Why sustainable management of Xanthomonas wilt of banana in east and central Africa has been elusive. In Proceedings of the VII International Symposium on Banana: ISHS-ProMusa Symposium on Bananas and Plantains: Towards Sustainable Global Production 986, Salvador, Brazil, 10–14 October 2011; pp. 157–164. [Google Scholar]
  18. Nakato, G.V.; Christelová, P.; Were, E.; Nyine, M.; Coutinho, T.A.; Doležel, J.; Uwimana, B.; Swennen, R.; Mahuku, G. Sources of resistance in Musa to Xanthomonas campestris pv. musacearum, the causal agent of banana xanthomonas wilt. Plant Pathol. 2019, 68, 49–59. [Google Scholar] [CrossRef]
  19. Gayral, P.; Noa-Carrazana, J.-C.; Lescot, M.; Lheureux, F.; Lockhart, B.E.L.; Matsumoto, T.; Piffanelli, P.; Iskra-Caruana, M.-L. A single banana streak virus integration event in the banana genome as the origin of infectious endogenous pararetrovirus. J. Virol. 2008, 82, 6697–6710. [Google Scholar] [CrossRef] [PubMed]
  20. Batte, M.; Swennen, R.; Uwimana, B.; Akech, V.; Brown, A.; Tumuhimbise, R.; Hovmalm, H.P.; Geleta, M.; Ortiz, R. Crossbreeding East African Highland Bananas: Lessons learnt relevant to the botany of the crop after 21 years of genetic enhancement. Front. Plant Sci. 2019, 10, 81. [Google Scholar] [CrossRef] [PubMed]
  21. Tripathi, L.; Tripathi, J.N.; Kiggundu, A.; Korie, S.; Shotkoski, F.; Tushemereirwe, W.K. Field trial of Xanthomonas wilt disease-resistant bananas in East Africa. Nat. Biotechnol. 2014, 32, 868–870. [Google Scholar] [CrossRef]
  22. Tripathi, L.; Atkinson, H.; Roderick, H.; Kubiriba, J.; Tripathi, J.N. Genetically engineered bananas resistant to Xanthomonas wilt disease and nematodes. Food Energy Secur. 2017, 6, 37–47. [Google Scholar] [CrossRef] [PubMed]
  23. Tripathi, J.N.; Lorenzen, J.; Bahar, O.; Ronald, P.; Tripathi, L. Transgenic expression of the rice Xa21 pattern-recognition receptor in banana (Musa sp.) confers resistance to Xanthomonas campestris pv. musacearum. Plant Biotechnol. J. 2014, 12, 663–673. [Google Scholar] [CrossRef]
  24. Ainembabazi, J.H.; Tripathi, L.; Rusike, J.; Abdoulaye, T.; Manyong, V. Ex-ante economic impact assessment of genetically modified banana resistant to Xanthomonas wilt in the Great Lakes region of Africa. PLoS ONE 2015, 10, e0138998. [Google Scholar] [CrossRef] [PubMed]
  25. Tripathi, J.N.; Ntui, V.O.; Shah, T.; Tripathi, L. CRISPR/Cas9-mediated editing of DMR6 orthologue in banana (Musa spp.) confers enhanced resistance to bacterial disease. Plant Biotechnol. J. 2021, 19, 1291–1293. [Google Scholar] [CrossRef] [PubMed]
  26. Avalos, A.; Fang, M.; Pan, H.; Lluch, A.R.; Lipka, A.E.; Zhao, S.D.; Giray, T.; Robinson, G.E.; Hudson, M.E. Genomic regions influencing aggressive behavior in honey bees are defined by colony allele frequencies. Proc. Natl. Acad. Sci. USA 2020, 117, 17135–17141. [Google Scholar] [CrossRef] [PubMed]
  27. Ashraf, B.H.; Jensen, J.; Asp, T.; Janss, L.L. Association studies using family pools of outcrossing crops based on allele-frequency estimates from DNA sequencing. Theor. Appl. Genet. 2014, 127, 1331–1341. [Google Scholar] [CrossRef] [PubMed]
  28. Uwimana, B.; Mwanje, G.; Batte, M.; Akech, V.; Shah, T.; Vuylsteke, M.; Swennen, R. Continuous mapping identifies loci associated with weevil resistance [Cosmopolites sordidus (Germar)] in a triploid banana population. Front. Plant Sci. 2021, 12, 2520. [Google Scholar] [CrossRef] [PubMed]
  29. Arinaitwe, I.K.; Teo, C.H.; Kayat, F.; Tumuhimbise, R.; Uwimana, B.; Kubiriba, J.; Swennen, R.; Harikrishna, J.A.; Othman, R.Y. Evaluation of banana germplasm and genetic analysis of an F1 population for resistance to Fusarium oxysporum f. sp. cubense race 1. Euphytica 2019, 215, 175–186. [Google Scholar] [CrossRef] [PubMed]
  30. Adriko, J.; Aritua, V.; Mortensen, C.N.; Tushemereirwe, W.K.; Kubiriba, J.; Lund, O.S. Multiplex PCR for specific and robust detection of Xanthomonas campestris pv. musacearum in pure culture and infected plant material. Plant Pathol. 2012, 61, 489–497. [Google Scholar] [CrossRef]
  31. Wasukira, A.; Tayebwa, J.; Thwaites, R.; Paszkiewicz, K.; Aritua, V.; Kubiriba, J.; Smith, J.; Grant, M.; Studholme, D.J. Genome-wide sequencing reveals two major sub-lineages in the genetically monomorphic pathogen Xanthomonas campestris pathovar musacearum. Genes 2012, 3, 361–377. [Google Scholar] [CrossRef]
  32. Nakato, G.V.; Fuentes Rojas, J.L.; Verniere, C.; Blondin, L.; Coutinho, T.; Mahuku, G.; Wicker, E. A new multi locus variable number of tandem repeat analysis scheme for epidemiological surveillance of Xanthomonas vasicola pv. musacearum, the plant pathogen causing bacterial wilt on banana and enset. PLoS ONE 2019, 14, e0215090. [Google Scholar] [CrossRef] [PubMed]
  33. Ceballos, H.; Deutsch, J.A.; Gutiérrez, H. Recurrent selection for resistance to Exserohilum turcicum in eight subtropical maize populations. Crop Sci. 1991, 31, 964–971. [Google Scholar] [CrossRef]
  34. Forbes, G.; Trillos, O.; Turkensteen, L.; Hidalgo, O. Field inoculation of potatoes with Phytophthora infestans and its effect on the efficiency of selection for quantitative resistance in the plants. Fitopatología 1993, 28, 117–120. [Google Scholar]
  35. VSN International. Genstat for Windows, 22nd ed.; VSN International: Hemel Hempstead, UK, 2022. [Google Scholar]
  36. Cullis, B.R.; Smith, A.B.; Coombes, N.E. On the design of early generation variety trials with correlated data. J. Agric. Biol. Environ. Stat. 2006, 11, 381–393. [Google Scholar] [CrossRef]
  37. Das, B.; Jena, R.; Samal, K. Optimization of DNA isolation and PCR protocol for RAPD analysis of banana/plantain (Musa spp.). Int. J. Agric. Sci. 2009, 1, 21. [Google Scholar]
  38. Martin, G.; Baurens, F.-C.; Droc, G.; Rouard, M.; Cenci, A.; Kilian, A.; Hastie, A.; Doležel, J.; Aury, J.-M.; Alberti, A.; et al. Improvement of the banana “Musa acuminata” reference sequence using NGS data and semi-automated bioinformatics methods. BMC Genomics 2016, 17, 243. [Google Scholar] [CrossRef] [PubMed]
  39. Langmead, B.; Salzberg, S.L. Fast gapped-read alignment with Bowtie 2. Nat. Methods 2012, 9, 357–359. [Google Scholar] [CrossRef] [PubMed]
  40. Quinlan, A.R.; Hall, I.M. BEDTools: A flexible suite of utilities for comparing genomic features. Bioinformatics 2010, 26, 841–842. [Google Scholar] [CrossRef] [PubMed]
  41. Thomas, P.D.; Ebert, D.; Muruganujan, A.; Mushayahama, T.; Albou, L.-P.; Mi, H. PANTHER: Making genome-scale phylogenetics accessible to all. Protein Sci. 2022, 31, 8–22. [Google Scholar] [CrossRef]
  42. Voorrips, R.E. MapChart: Software for the graphical presentation of linkage maps and QTLs. J. Hered. 2002, 93, 77–78. [Google Scholar] [CrossRef]
  43. de Vicente, M.; Tanksley, S. QTL analysis of transgressive segregation in an interspecific tomato cross. Genetics 1993, 134, 585–596. [Google Scholar] [CrossRef]
  44. Mackay, I.J.; Cockram, J.; Howell, P.; Powell, W. Understanding the classics: The unifying concepts of transgressive segregation, inbreeding depression and heterosis and their central relevance for crop breeding. Plant Biotechnol. J. 2021, 19, 26–34. [Google Scholar] [CrossRef]
  45. Comai, L. The advantages and disadvantages of being polyploid. Nat. Rev. Genet. 2005, 6, 836–846. [Google Scholar] [CrossRef] [PubMed]
  46. Charlesworth, D.; Willis, J.H. The genetics of inbreeding depression. Nat. Rev. Genet. 2009, 10, 783–796. [Google Scholar] [CrossRef]
  47. Sverrisdóttir, E.; Byrne, S.; Sundmark, E.H.R.; Johnsen, H.Ø.; Kirk, H.G.; Asp, T.; Janss, L.; Nielsen, K.L. Genomic prediction of starch content and chipping quality in tetraploid potato using genotyping-by-sequencing. Theor. Appl. Genet. 2017, 130, 2091–2108. [Google Scholar] [CrossRef] [PubMed]
  48. Jighly, A. When do autopolyploids need poly-sequencing data? Mol. Ecol. 2022, 31, 1021–1027. [Google Scholar] [CrossRef]
  49. Ahmad, F.; Martawi, N.M.; Poerba, Y.S.; de Jong, H.; Schouten, H.; Kema, G.H.J. Genetic mapping of Fusarium wilt resistance in a wild banana Musa acuminata ssp. malaccensis accession. Theor. Appl. Genet. 2020, 133, 3409–3418. [Google Scholar] [CrossRef] [PubMed]
  50. Chen, A.; Sun, J.; Martin, G.; Gray, L.-A.; Hřibová, E.; Christelová, P.; Yahiaoui, N.; Rounsley, S.; Lyons, R.; Batley, J.; et al. Identification of a major QTL controlling resistance to the subtropical race 4 of Fusarium oxysporum f. sp. cubense in Musa acuminata ssp. malaccensis. Pathogens 2023, 12, 289. [Google Scholar] [CrossRef] [PubMed]
  51. Chen, A.; Sun, J.; Viljoen, A.; Mostert, D.; Xie, Y.; Mangila, L.; Bothma, S.; Lyons, R.; Hřibová, E.; Christelová, P.; et al. Genetic mapping, candidate gene identification and marker validation for host plant resistance to the race 4 of Fusarium oxysporum f. sp. cubense using Musa acuminata ssp. malaccensis. Pathogens 2023, 12, 820. [Google Scholar] [CrossRef] [PubMed]
  52. Chen, H.-M.; Ku, H.-M.; Schafleitner, R.; Bains, T.S.; George Kuo, C.; Liu, C.-A.; Nair, R.M. The major quantitative trait locus for mungbean yellow mosaic Indian virus resistance is tightly linked in repulsion phase to the major bruchid resistance locus in a cross between mungbean [Vigna radiata (L.) Wilczek] and its wild relative Vigna radiata ssp. sublobata. Euphytica 2013, 192, 205–216. [Google Scholar] [CrossRef]
  53. Guo, L.; Wang, K.; Chen, J.; Huang, D.; Fan, Y.; Zhuang, J. Dissection of two quantitative trait loci for grain weight linked in repulsion on the long arm of chromosome 1 of rice (Oryza sativa L.). Crop J. 2013, 1, 70–76. [Google Scholar] [CrossRef]
  54. Bernstein, M.R.; Zdraljevic, S.; Andersen, E.C.; Rockman, M.V. Tightly linked antagonistic-effect loci underlie polygenic phenotypic variation in C. elegans. Evol. Lett. 2019, 3, 462–473. [Google Scholar] [CrossRef]
  55. Zhang, X.; Dai, Y.-S.; Wang, Y.-X.; Su, Z.-Z.; Yu, L.-J.; Zhang, Z.-F.; Xiao, S.; Chen, Q.-F. Overexpression of the arabidopsis MACPF Protein AtMACP2 promotes pathogen resistance by activating SA signaling. Int. J. Mol. Sci. 2022, 23, 8784. [Google Scholar] [CrossRef]
  56. Morita-Yamamuro, C.; Tsutsui, T.; Sato, M.; Yoshioka, H.; Tamaoki, M.; Ogawa, D.; Matsuura, H.; Yoshihara, T.; Ikeda, A.; Uyeda, I.; et al. The Arabidopsis gene CAD1 controls programmed cell death in the plant immune system and encodes a protein containing a MACPF domain. Plant Cell Physiol. 2005, 46, 902–912. [Google Scholar] [CrossRef] [PubMed]
  57. Soderlund, C.; Descour, A.; Kudrna, D.; Bomhoff, M.; Boyd, L.; Currie, J.; Angelova, A.; Collura, K.; Wissotski, M.; Ashley, E.; et al. Sequencing, mapping, and analysis of 27,455 maize full-length cDNAs. PLoS Genet. 2009, 5, e1000740. [Google Scholar] [CrossRef]
  58. Kawahara, Y.; de la Bastide, M.; Hamilton, J.P.; Kanamori, H.; McCombie, W.R.; Ouyang, S.; Schwartz, D.C.; Tanaka, T.; Wu, J.; Zhou, S.; et al. Improvement of the Oryza sativa Nipponbare reference genome using next generation sequence and optical map data. Rice 2013, 6, 4. [Google Scholar] [CrossRef] [PubMed]
  59. Gookin, T.E.; Kim, J.; Assmann, S.M. Whole proteome identification of plant candidate G-protein coupled receptors in Arabidopsis, rice, and poplar: Computational prediction and in-vivo protein coupling. Genome Biol. 2008, 9, R120. [Google Scholar] [CrossRef] [PubMed]
  60. Zimin, A.V.; Puiu, D.; Hall, R.; Kingan, S.; Clavijo, B.J.; Salzberg, S.L. The first near-complete assembly of the hexaploid bread wheat genome, Triticum aestivum. GigaScience 2017, 6, gix097. [Google Scholar] [CrossRef] [PubMed]
  61. Perrier, X.; Bakry, F.; Carreel, F.; Jenny, C.; Horry, J.-P.; Lebot, V.; Hippolyte, I. Combining biological approaches to shed light on the evolution of edible bananas. Ethnobot. Res. Appl. 2009, 7, 199–216. [Google Scholar] [CrossRef]
  62. Němečková, A.; Christelová, P.; Čížková, J.; Nyine, M.; Van den houwe, I.; Svačina, R.; Uwimana, B.; Swennen, R.; Doležel, J.; Hřibová, E. Molecular and cytogenetic study of East African highland banana. Front. Plant Sci. 2018, 9, 1371. [Google Scholar] [CrossRef]
  63. Christelová, P.; De Langhe, E.; Hřibová, E.; Čížková, J.; Sardos, J.; Hušáková, M.; Van den houwe, I.; Sutanto, A.; Kepler, A.K.; Swennen, R.; et al. Molecular and cytological characterization of the global Musa germplasm collection provides insights into the treasure of banana diversity. Biodivers. Conserv. 2016, 26, 801–824. [Google Scholar] [CrossRef]
  64. Li, X.; Yu, S.; Cheng, Z.; Chang, X.; Yun, Y.; Jiang, M.; Chen, X.; Wen, X.; Li, H.; Zhu, W.; et al. Origin and evolution of the triploid cultivated banana genome. Nat. Genet. 2024, 56, 136–142. [Google Scholar] [CrossRef]
Figure 1. Distribution of the adjusted means of maxAUDPC for 182 F1 hybrids and the parents at 105 dpi. The positions of the parents (Monyet and Kokopo) are indicated in the figure.
Horticulturae 10 00087 g001
Figure 2. Manhattan plot showing the significance of the association between Xvm resistance (measured as maxAUDPC) and 18,009 DArTSeq SNPs, identified with the continuous mapping method using 135 F1 progeny from the Monyet × Kokopo mapping population. Chromosome 12 represents the unanchored contigs of the DH Pahang reference genome.
Horticulturae 10 00087 g002
Figure 3. Pearson’s correlation between the F1 adjusted means of the weevil traits (logit_PD and logit_TXD [28]) and the Xvm trait (maxAUDPC). *** p ≤ 0.001, * p ≤ 0.05.
Horticulturae 10 00087 g003
Figure 4. Chromosome 6 of the markers in the Monyet × Kokopo population based on the physical map of DH Pahang reference genome version 2 showing the QTL for resistance to weevils (blue) and BXW (green) on the right side of the bar. The beginning and the end of each QTL are represented by the first and the last significant marker position on the chromosome. Full QTL bar = Kokopo as the main source of resistance, barred bar = Monyet as the source of resistance. The left side of the bar shows the physical position of the markers in Mbp. PD = peripheral damage of the corm; TXD = total cross-section damage of the corm.
Horticulturae 10 00087 g004
Figure 5. PANTHER GO-slim biological processes of the 18 putative genes returned 33 hits (https://pantherdb.org, (accessed on 9 November 2023)).
Horticulturae 10 00087 g005
Table 1. SNP markers associated with resistance to Xvm using maxAUDPC as the trait in the Monyet × Kokopo F1 population.
snSNP IDChrom iPosition i−LOG(p)Genotype of the ParentsEffect iiR iiiA iiiexpl_var. iv
MonyetKokopo
1chr02_2326854523,268,5453.04RRAARR−29.88GA7.22
2chr02_2389461223,894,6123.14RRAARR−30.89AG7.53
3chr03_2522825135,228,2513.15AAAARA−37.80AG7.54
4chr06_928727769,287,2773.16AAAARA−40.01AG7.58
5chr06_10081954610,081,9543.66RRRRRA36.90TA9.18
6chr06_10081996610,081,9963.72RRRRRA37.22GT9.36
7chr06_11466145611,466,1453.25RRRRRA34.98AG8.20
8chr06_11997622611,997,6223.12RRRRRA40.21GT7.52
9chr06_31895299631,895,2993.53RRAARR30.47GT8.66
10chr06_35307807635,307,8074.49RRRRRA41.98TC11.55
11chr06_35399010635,399,0103.08AAAARA−33.41AT7.35
12chr06_35734979635,734,9793.96AAAARA−35.05GA10.00
13chr06_35735014635,735,0143.74RRRRRA33.67AG9.36
14chr06_35773242635,773,2423.11RRRRRA38.85GC7.53
15chr06_36095415636,095,4153.13RRRRRA43.69TC7.47
16chr06_36497284636,497,2843.24AAAARA−38.84GT8.18
17chr06_36497290636,497,2903.22AAAARA−38.89GT8.17
18chr06_36497314636,497,3143.24RRRRRA41.56TC8.15
19chr06_37429651637,429,6513.22AAAARA−38.61AG7.86
20chr07_283811672,838,1163.38RRRARR42.82CT8.21
21chr07_283813572,838,1353.47RRRARR43.45GC8.49
22chr07_283816272,838,1623.45RRRARR43.26TA8.43
23chr07_596237475,962,3743.02AAAARA−39.48AG7.42
24chr07_686339176,863,3913.11RRRRRA45.63CA7.49
25chr07_686341676,863,4163.25RRRRRA46.44AC7.90
i Chromosome and position in bp for the markers significantly associated with maxAUDPC based on the physical map of the DH Pahang reference genome version 2; ii additive effects of replacing the reference allele with the alternative allele at each locus; iii R: reference allele, A: alternative allele, positive for the trait at each marker is in bold, based on the additive effect of replacing the reference allele with the alternative allele; iv percentage of the phenotype explained by the marker. The grey and white colors indicate different QTLs.
Table 2. Putative genes in the vicinity of the loci that are associated with resistance to Xvm.
sn Gene_ID Chrom Gene Position (bp) Strand Linked Marker Distance (bp) Annotation
1Ma02_g15610chr0223,270,730–23,272,339+chr02_232685452185Remorin_C domain-containing protein
2Ma02_g16600chr0223,890,072–23,894,146+chr02_23894612466Lipoyl synthase, mitochondrial
3Ma03_g19990chr0325,228,695–25,230,557+chr03_25228251444Abscisic stress-ripening protein 5
4Ma06_g13550chr069,286,287–9,294,510chr06_9287277 0MACPF domain-containing protein At4g24290-like
5Ma06_g14760chr0610,081,045–10,082,123+chr06_10081954 and chr06_100819960Conserved hypothetical protein
6Ma06_g16910chr0611,467,120–11,467,747chr06_11466145975Zinc finger protein ZAT12-like
7Ma06_g17690chr0611,985,303–12,004,743+chr06_119976220HUA2-like protein 2
8Ma06_g30680chr0631,884,480–31,898,896+chr06_318952990Non-lysosomal glucosylceramidase-like
9Ma06_g35490chr0635,304,891–35,315,265+chr06_353078070Amino-acid N-acetyltransferase
10Ma06_g35620chr0635,399,155–35,400,631+chr06_35399010145Transcription factor MYB44
11Ma06_g36200chr0635,734,408–35,738,511chr06_35734979 and chr06_357350140RRM domain-containing protein
12Ma06_g36300chr0635,774,897–357,76,327+chr06_357732421655HMA domain-containing protein
13Ma06_g36840chr0636,091,779–36,096,147+chr06_360954150Transmembrane protein adipocyte-associated 1-like
14Ma06_g37450chr0636,492,067–36,495,406chr06_36497284, chr06_36497290, and chr06_364973141878Clp R domain-containing protein
15Ma06_g38780chr0637,415,987–37,427,552chr06_374296512099Oxysterol-binding protein-related protein 2A
16Ma07_g03700chr072,836,251–2,840,247+chr07_2838116, chr07_2838135, and chr07_28381620M20_dimer domain-containing protein
17Ma07_g08000chr075,961,864–5,962,783+chr07_59623740CASP-like protein
18Ma07_g09140chr076,857,345–6,870,535chr07_6863391 and chr07_68634160Na_H_Exchanger domain-containing protein
Disclaimer/Publisher’s Note: The statements, opinions and data contained in all publications are solely those of the individual author(s) and contributor(s) and not of MDPI and/or the editor(s). MDPI and/or the editor(s) disclaim responsibility for any injury to people or property resulting from any ideas, methods, instructions or products referred to in the content.

