
Enhancing Methane Production through Anaerobic Co-Digestion of Sewage Sludge: A Modified ADM1 Model Approach


Abstract
:1. Introduction
2. Materials and Methods
2.1. Substrate and Inoculum
2.2. Batch and Semi-Continuous Tests
2.3. Analytical Method
2.4. Mathematical Model Development
2.4.1. Model Structure Philosophy
2.4.2. Mathematical Equations
Gas Calculations
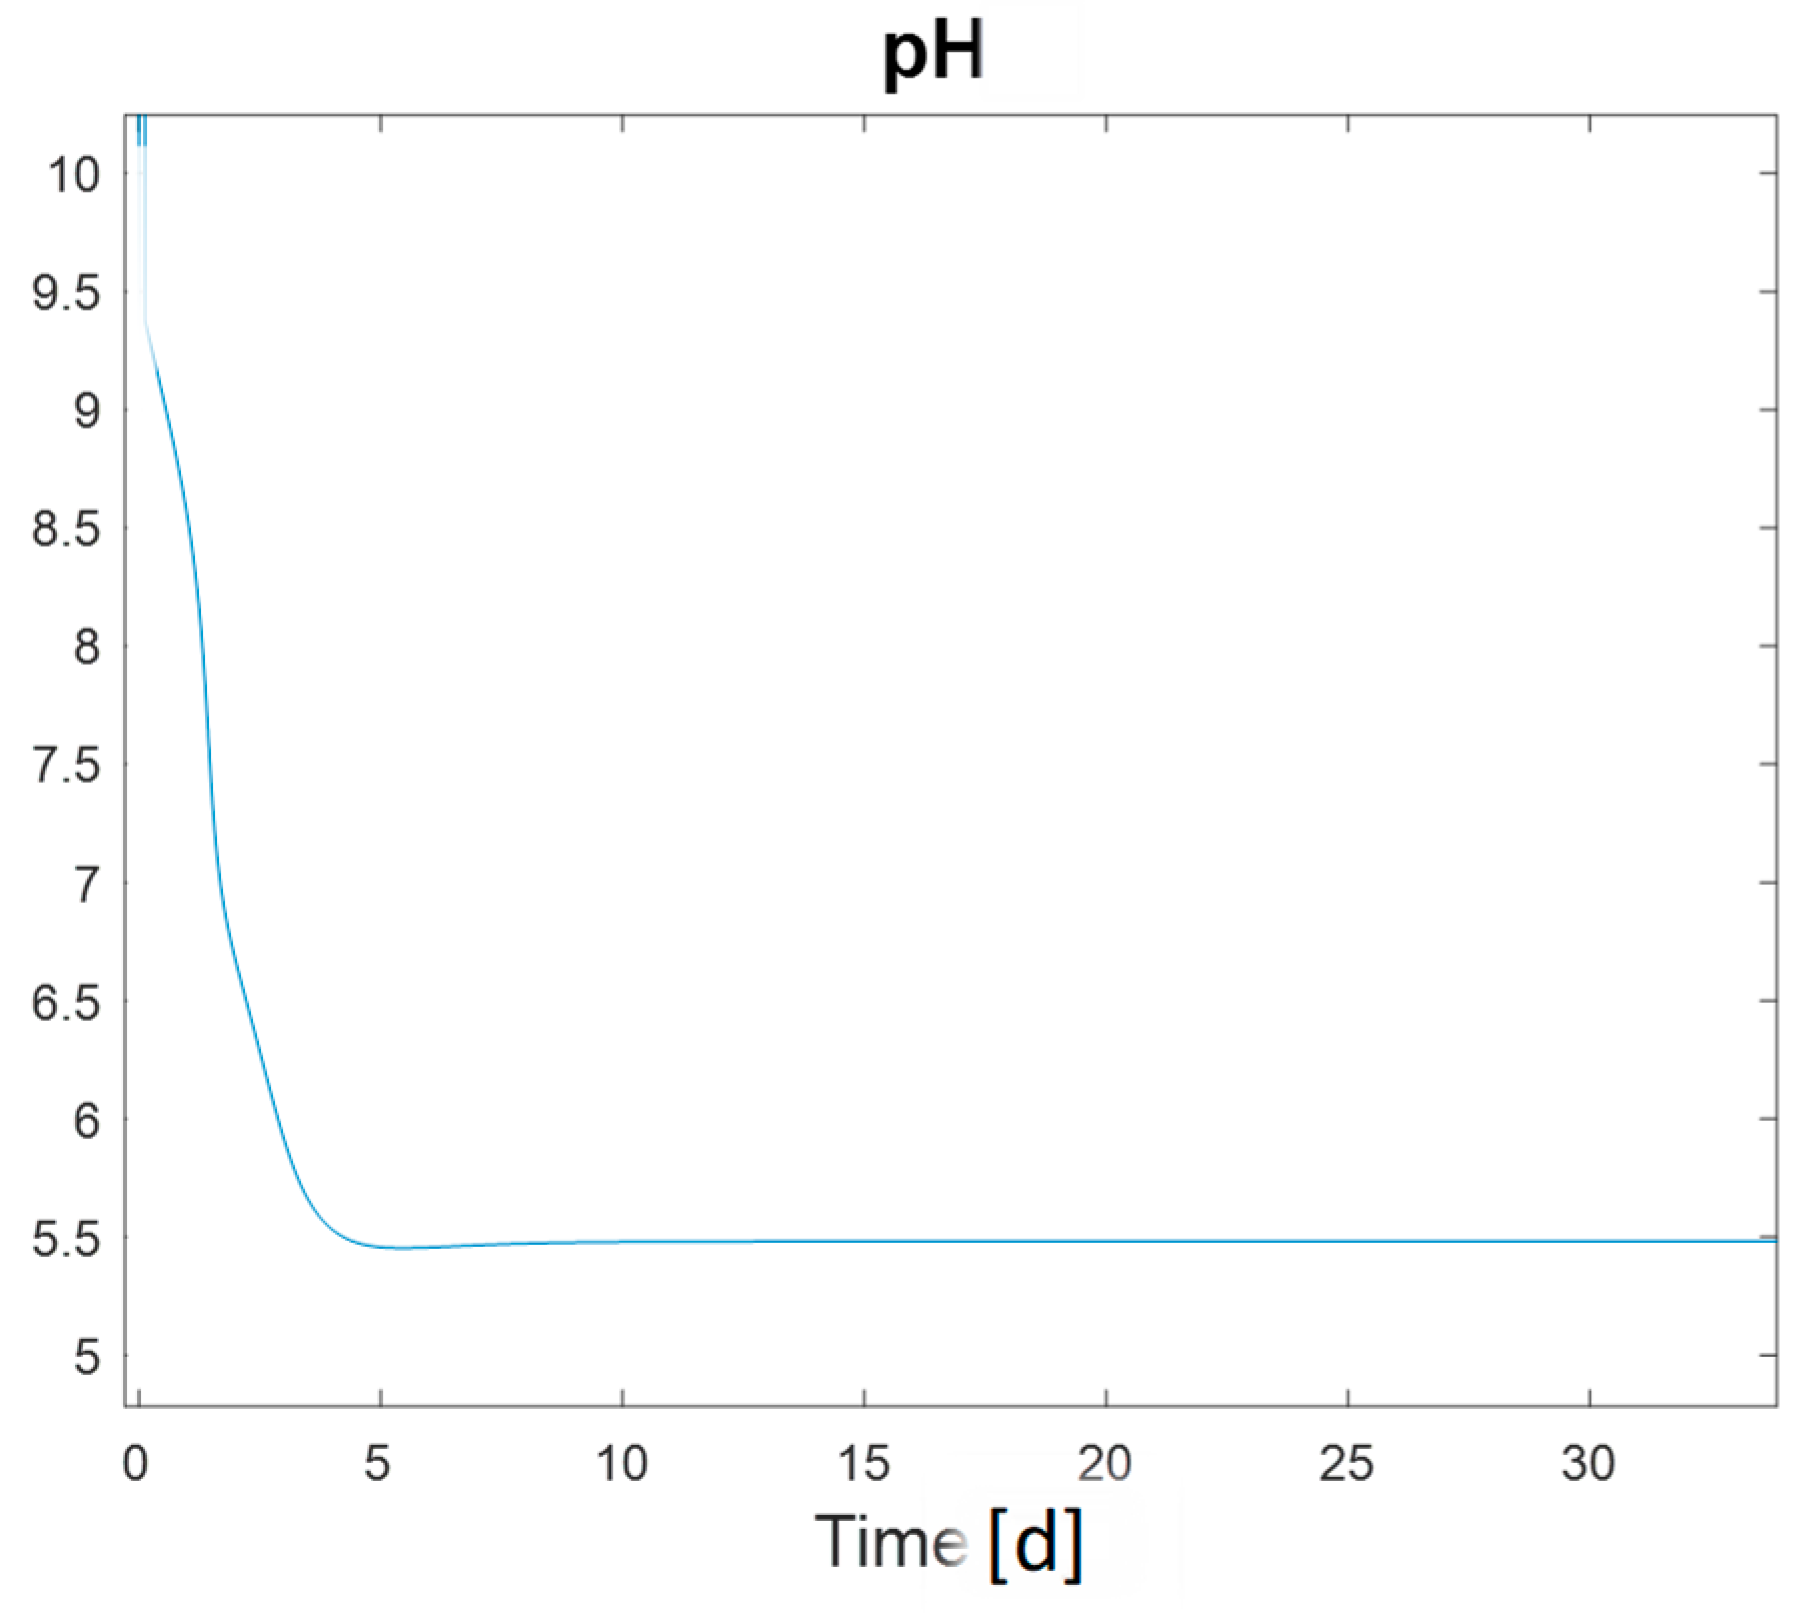
pH Calculations
Inhibition
2.4.3. Model Assumptions
2.5. Sensitivity Analysis
Sensitivity Analysis and Variable Dependence of Parameters
3. Results and Discussion
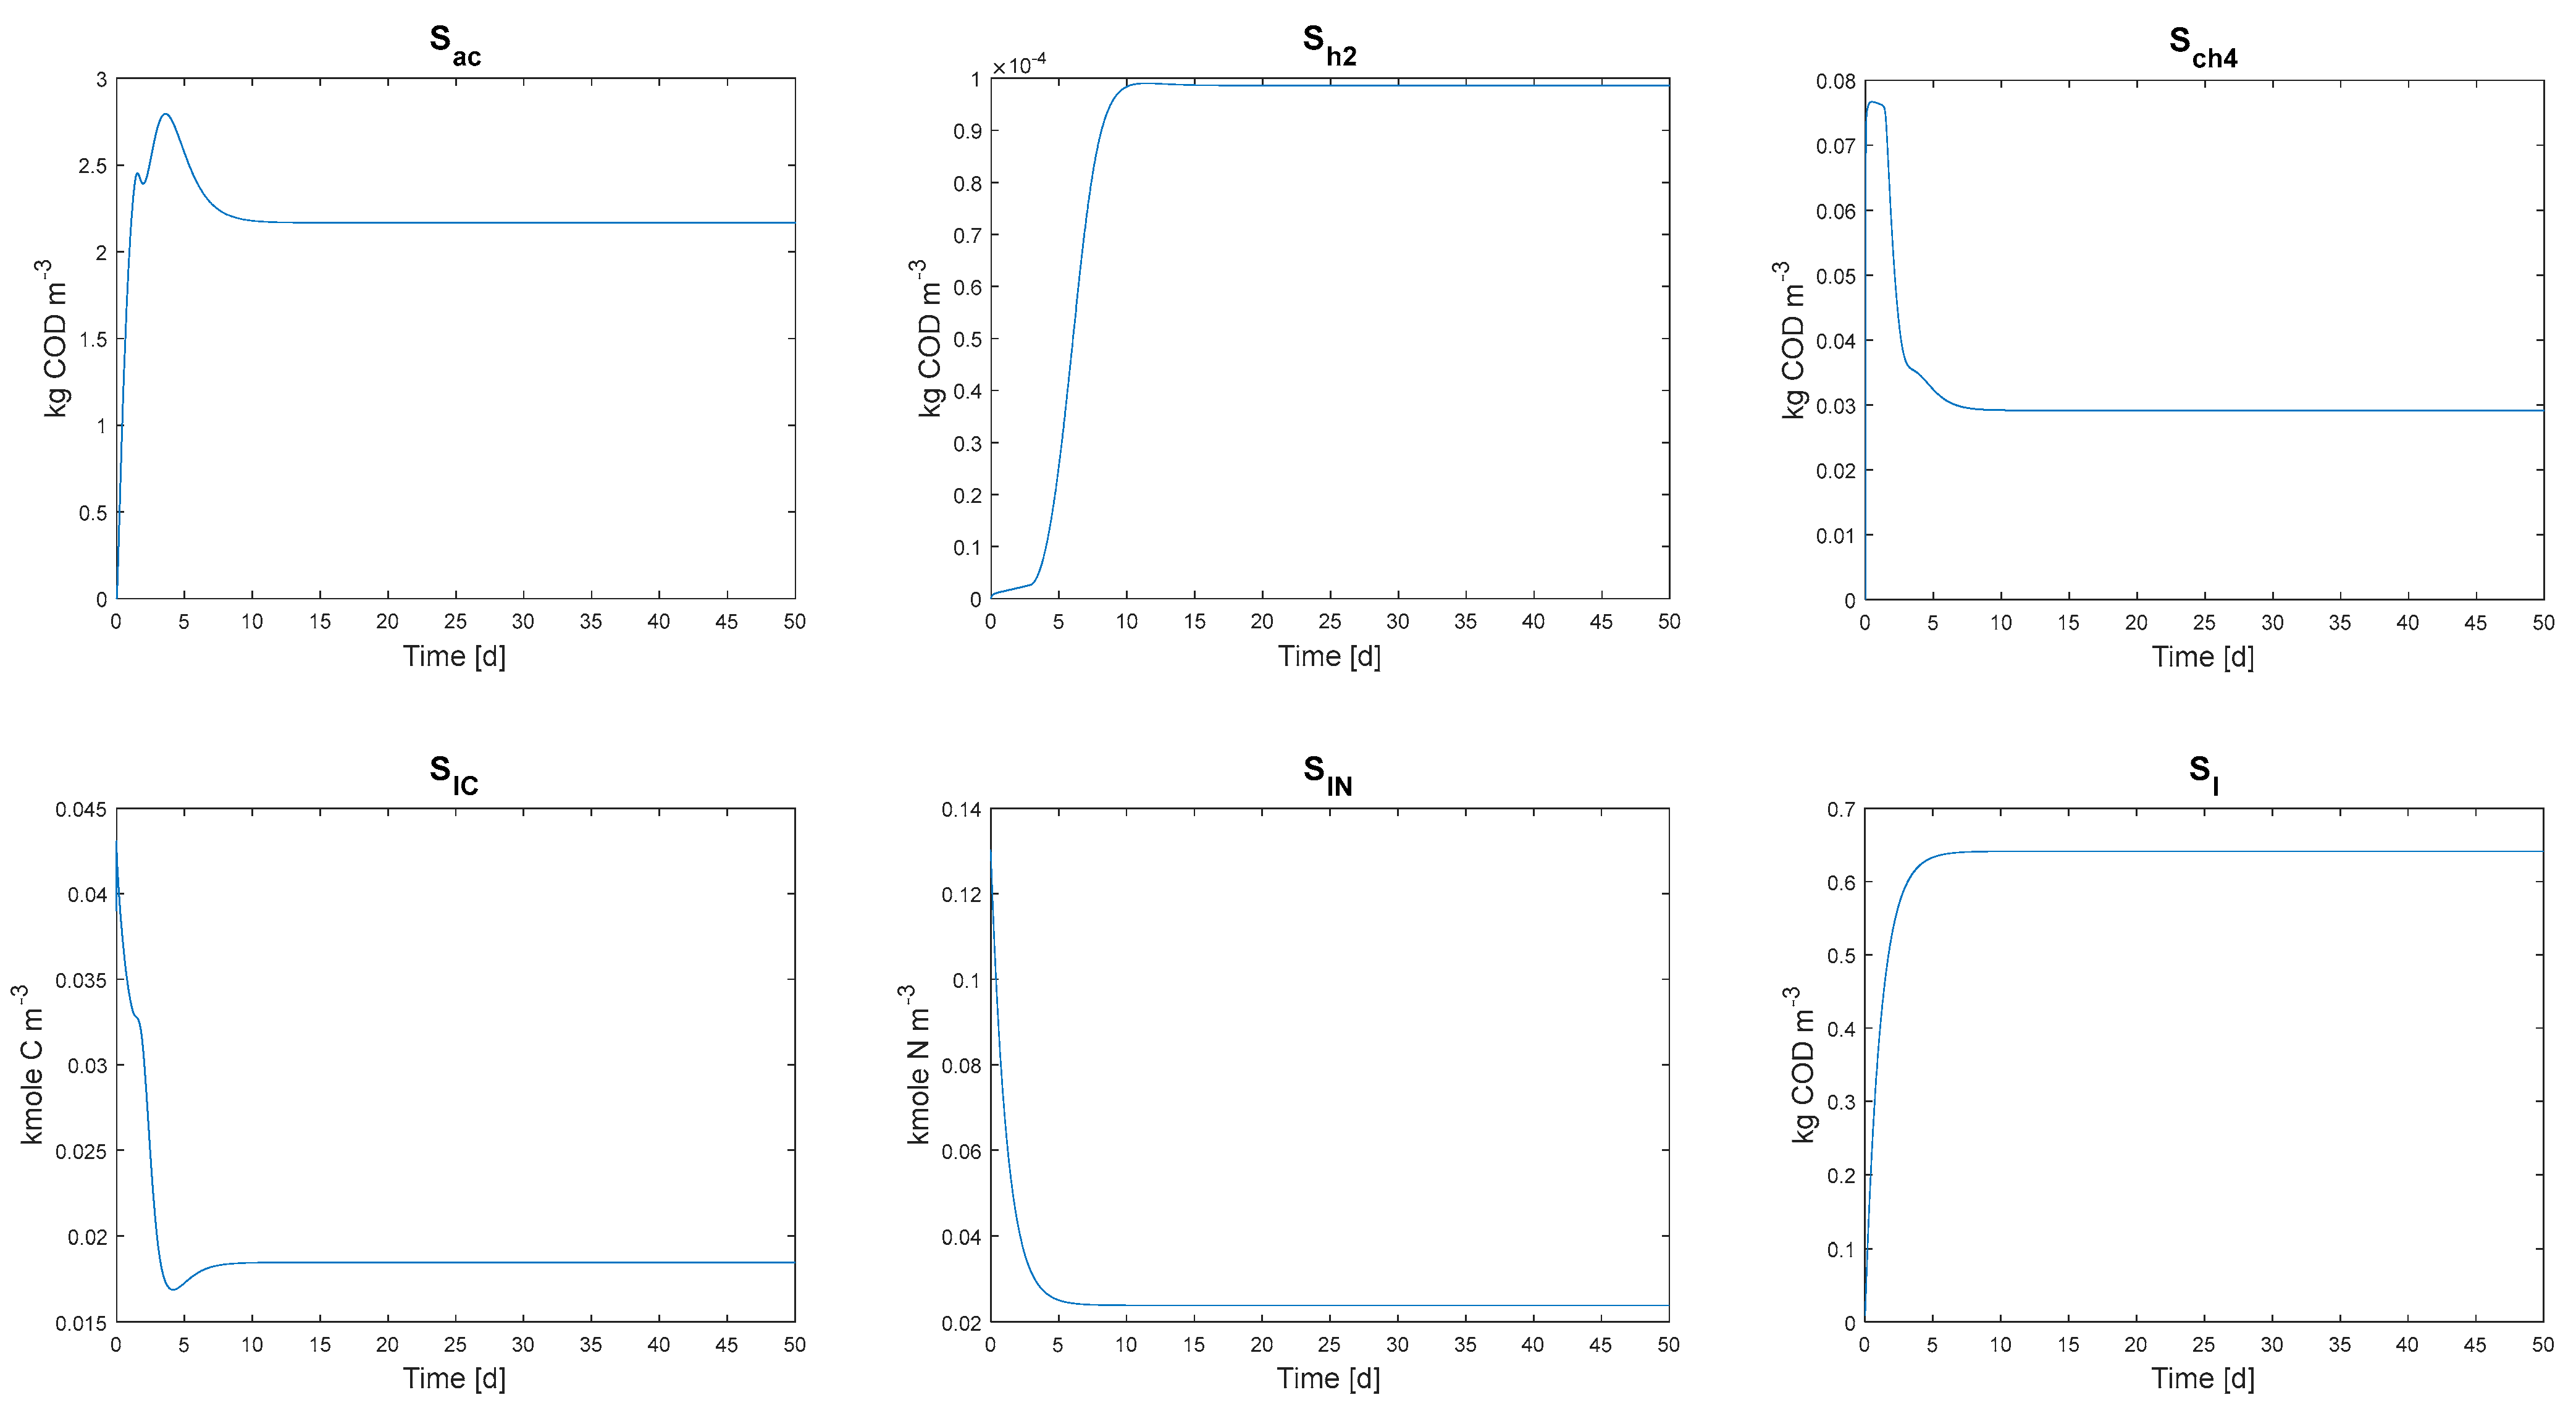
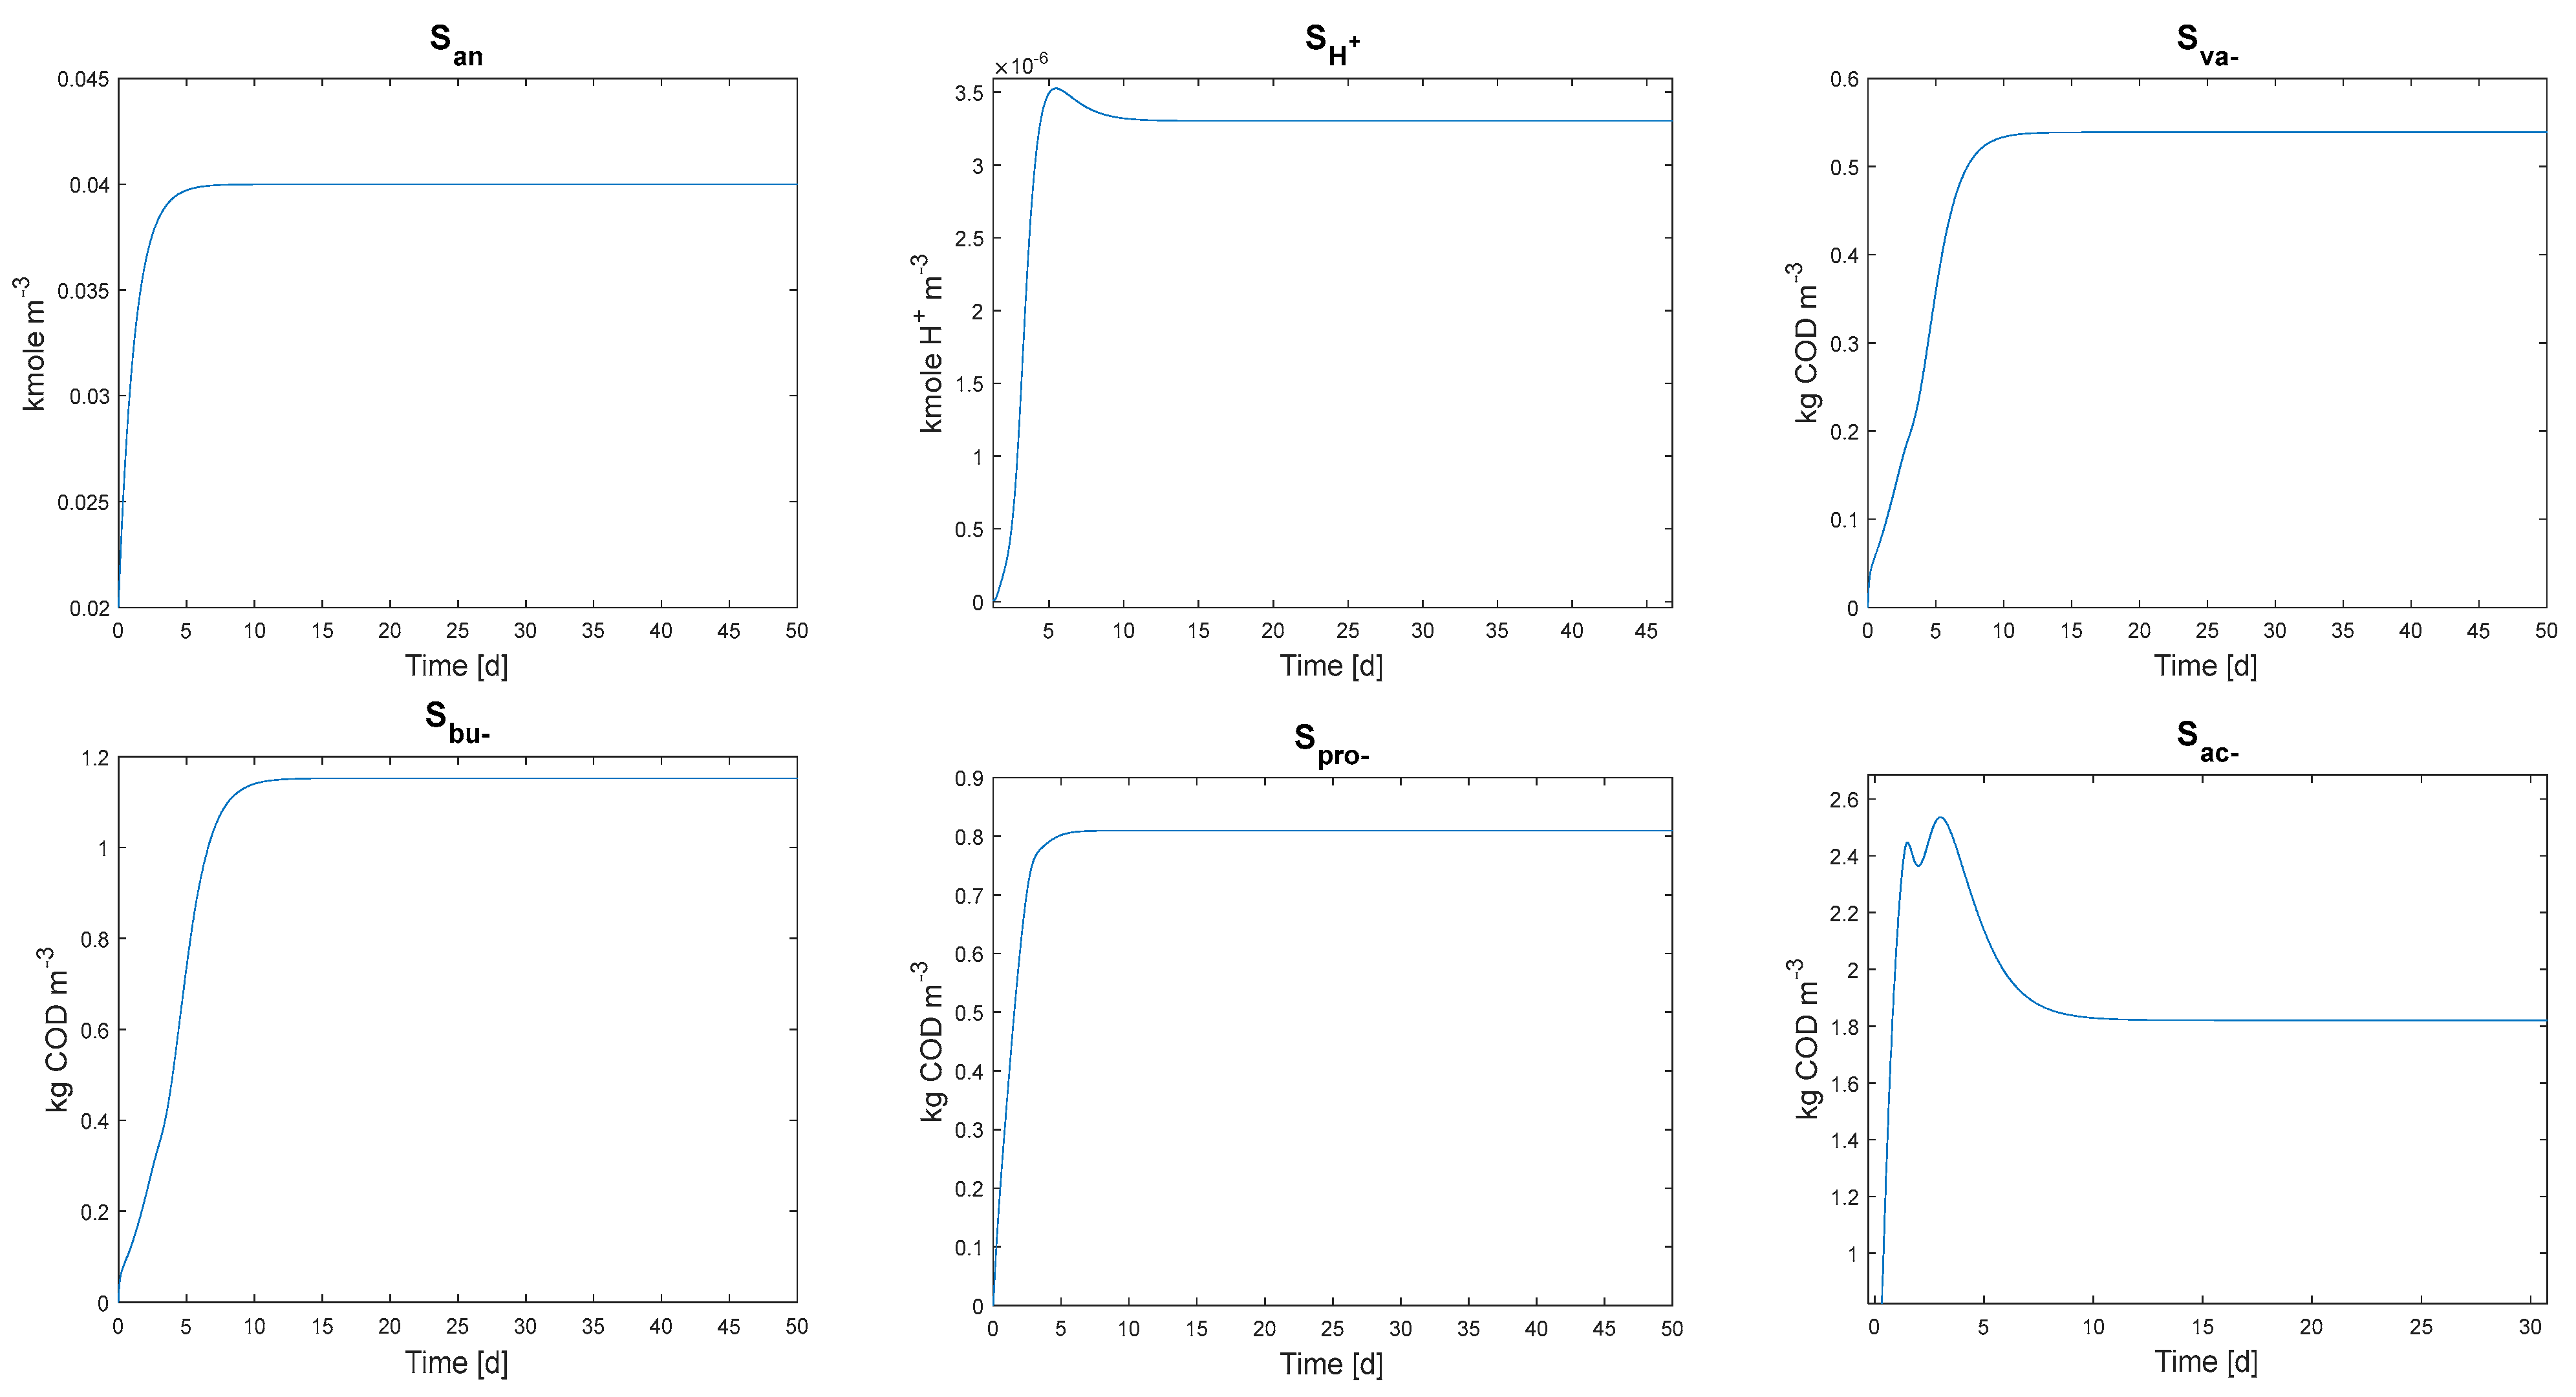
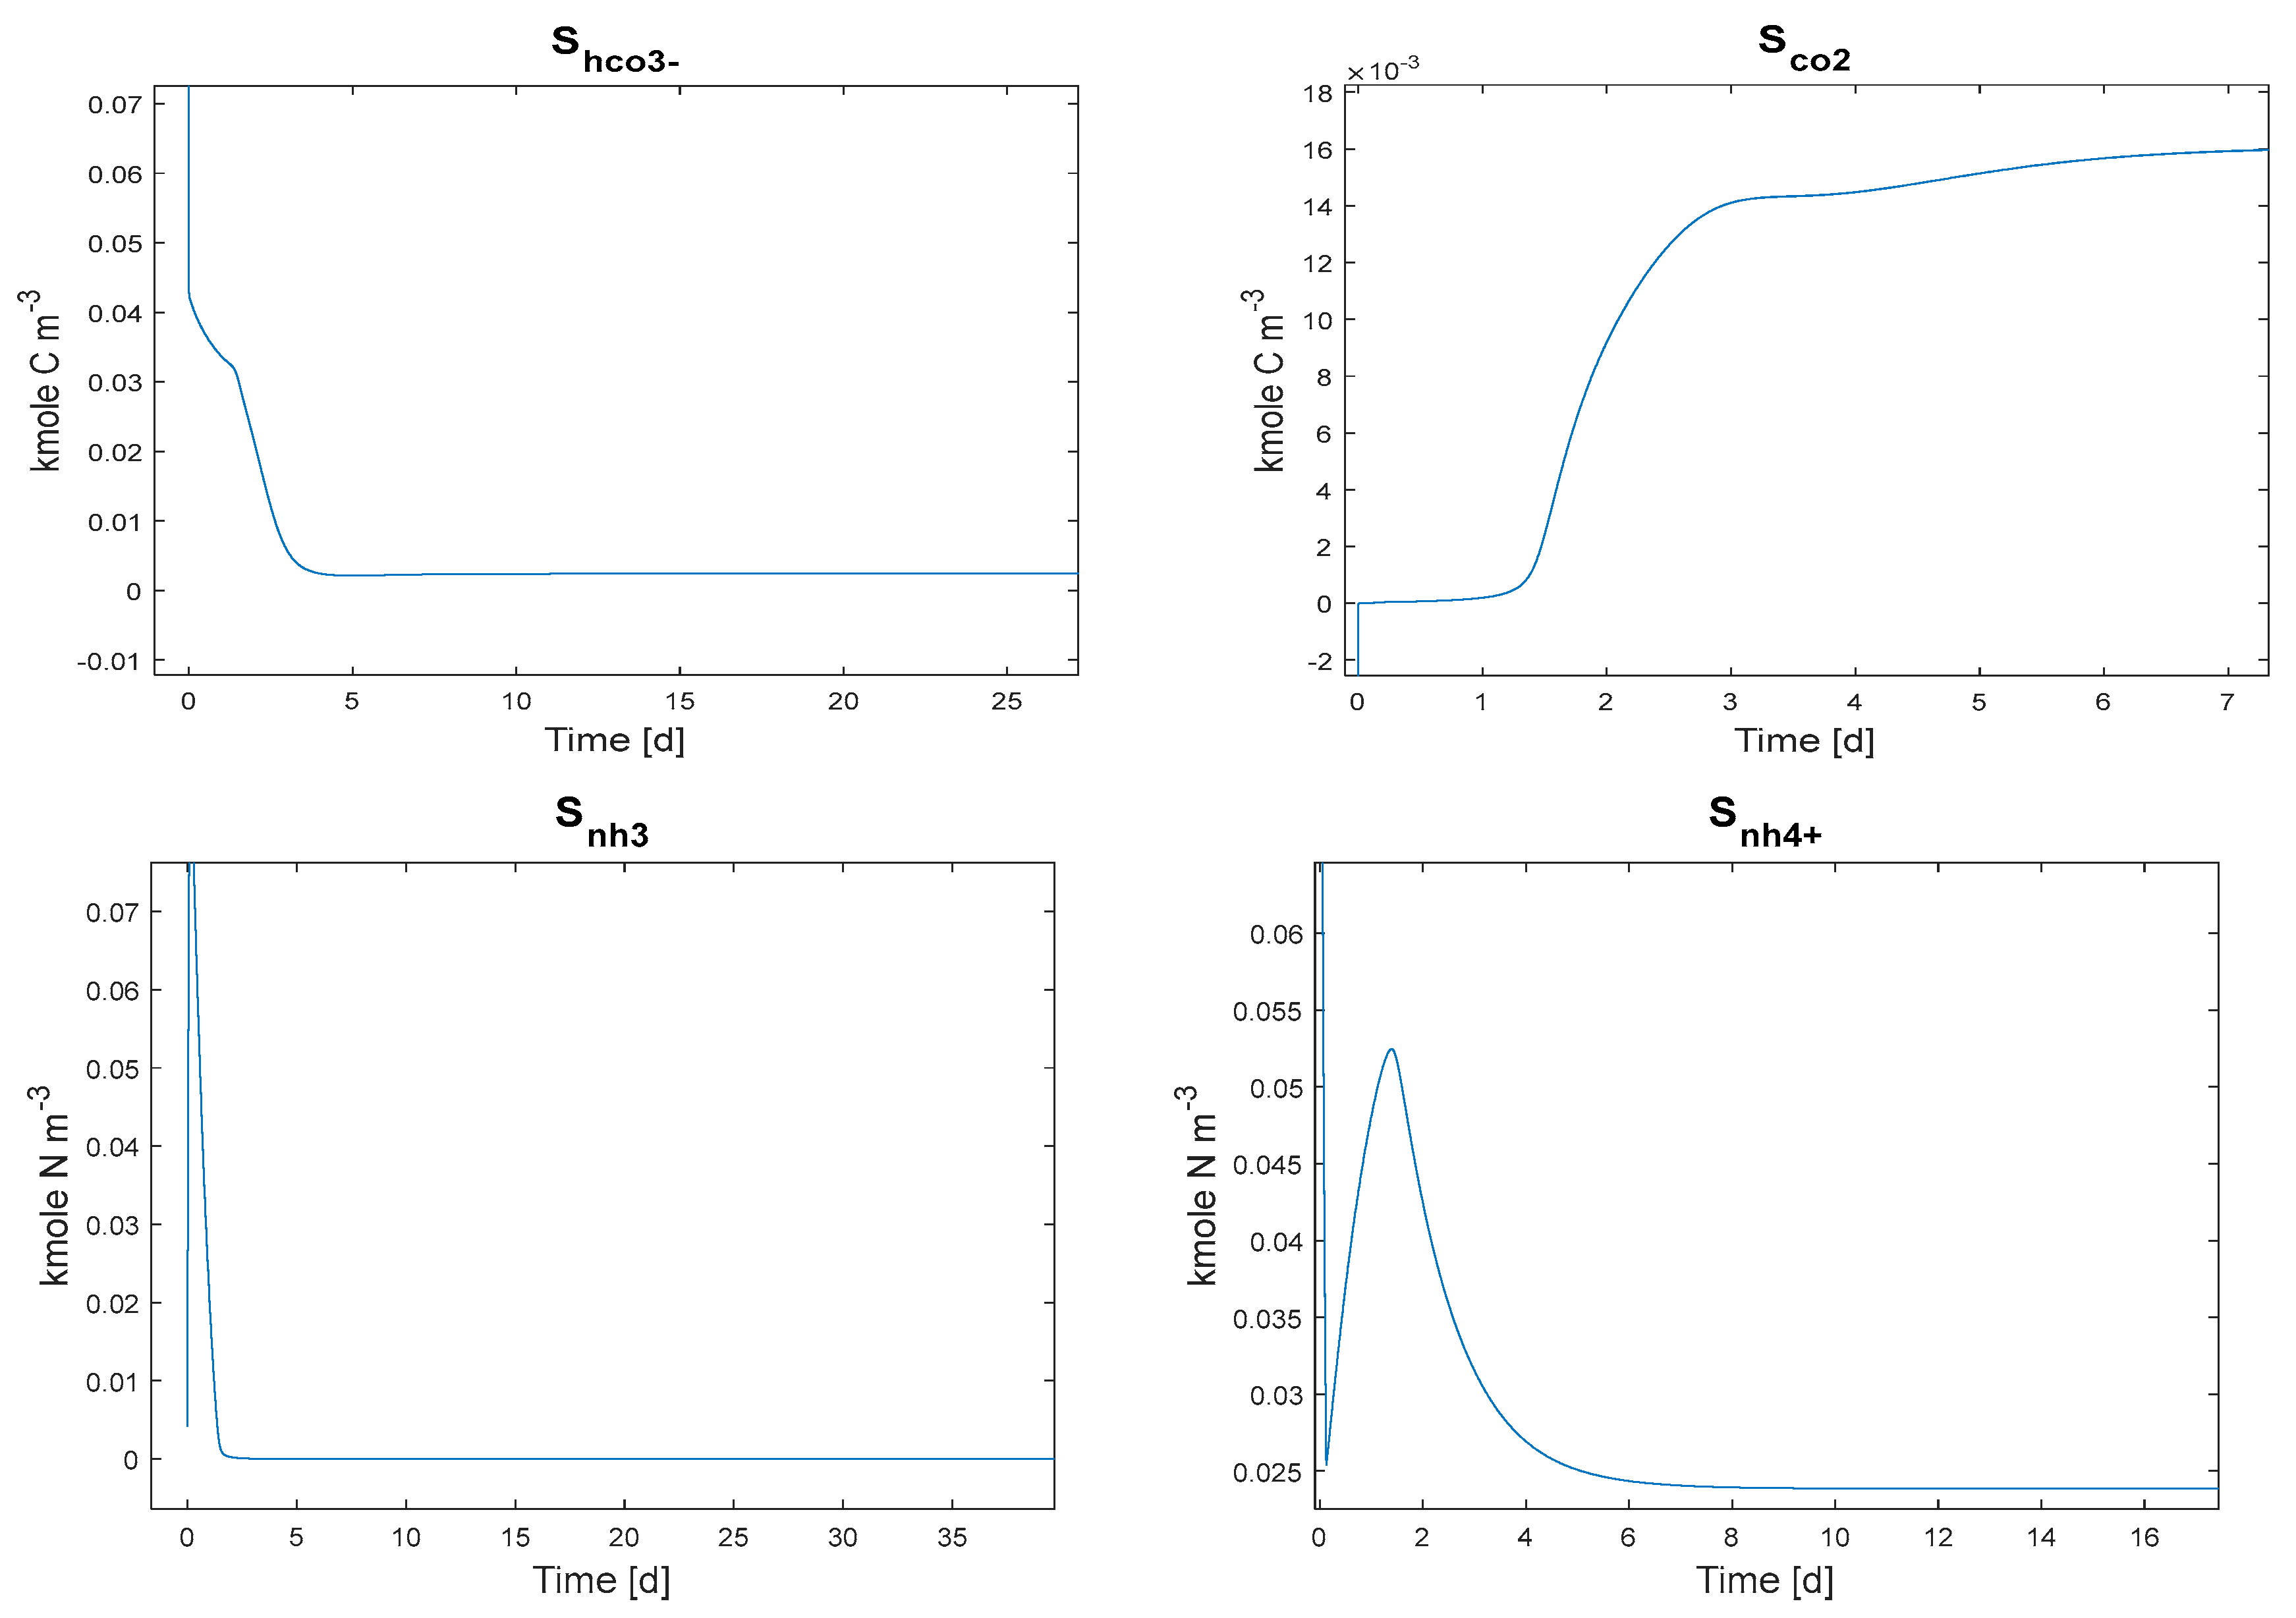
3.1. ADM1 Simulation Using Measure Parameters
3.2. Model Calibration and Validation
Sensitivity Analysis Results
4. Conclusions
- Simulating the interactions between substrates, microbial communities, and environmental factors.
- The model accurately represents the dynamics of acidogenesis, acetogenesis, and methanogenesis stages, identifying potential bottlenecks and opportunities for enhancing methane production efficiency.
- It contributes to a deeper understanding of factors influencing digester performance, such as pH, temperature, organic loading rate, and substrate composition. This understanding enables operators to fine-tune operating conditions for optimal methane yield and digester stability.
- The model can facilitate the assessment of the feasibility and economic viability of anaerobic co-digestion projects, guiding investments and resource allocation.
- However, challenges remain in accurate calibration and validation for specific co-digestion systems due to the complexity of microbial interactions and parameter estimation. Further research is needed to refine and expand the model’s applicability to various waste streams and co-substrate combinations.
Author Contributions
Funding
Institutional Review Board Statement
Informed Consent Statement
Data Availability Statement
Acknowledgments
Conflicts of Interest
References
- Barrera, E.L.; Spanjers, H.; Solon, K.; Amerlinck, Y.; Nopens, I.; Dewulf, J. Modeling the anaerobic digestion of cane-molasses vinasse: Extension of the Anaerobic Digestion Model No. 1 (ADM1) with sulfate reduction for a very high strength and sulfate rich wastewater. Water Res. 2015, 71, 42–54. [Google Scholar] [CrossRef] [PubMed]
- Blumensaat, F.; Keller, J. Modelling of two-stage anaerobic digestion using the IWA Anaerobic Digestion Model No. 1 (ADM1). Water Res. 2005, 39, 171–183. [Google Scholar] [CrossRef] [PubMed]
- Fouad, H.A.; Aboulfotoh, A.M.; El-hefny, R.; Marie, A.I. Anaerobic Co-Digestion of Sewage Sludge and Waste—A Review with a Focus on the Mixing Ratios, Pre-Treatment, and Challenges. Int. Res. J. Eng. Tech. 2022, 9, 282–290. [Google Scholar]
- Mudzanani, K.; van Heerden, E.; Mbhele, R.; Daramola, M.O. Enhancement of Biogas Production via Co-Digestion of Wastewater Treatment Sewage Sludge and Brewery Spent Grain: Physicochemical Characterization and Microbial Community. Sustainability 2021, 13, 8225. [Google Scholar] [CrossRef]
- Dupont, G.K.; Oliveira, M.M.; Clerici, N.J.; Serafini, C.G.; Daroit, D.J.; Wenzel, B.M. Kinetic modelling and improvement of methane production from the anaerobic co-digestion of swine manure and cassava bagasse. Biomass Bioenergy 2023, 176, 106900. [Google Scholar] [CrossRef]
- Xu, Z. ADM1 Parameter Calibration Method Based on Partial Least Squares Regression Framework for Industrial-Scale Anaerobic Digestion Modelling. Master’s Dissertation, Stellenbosch University, Stellenbosch, South Africa, 2019. Available online: http://scholar.sun.ac.za (accessed on 23 May 2021).
- Batstone, D.J. Modelling and control in anaerobic digestion: Achievements and challenges. In Proceedings of the 13th World Congress on Anaerobic Digestion, Santiago de Compostela, Spain, 25–28 June 2013. [Google Scholar]
- Astals, S.; Batstone, D.J.; Mata-Alvarez, J.; Jensen, P.D. Identification of synergistic impacts during anaerobic co-digestion of organic wastes. Bioresour. Technol. 2014, 169, 421–427. [Google Scholar] [CrossRef]
- Li, P.; Pei, Z.; Liu, D.; Shi, F.; Wang, S.; Li, W.; Sun, Y.; Liu, J.; Gao, Y.; Yu, Q. Application of Anaerobic Digestion Model No. 1 for modeling anaerobic digestion of vegetable crop residues: Fractionation of crystalline cellulose. J. Clean. Prod. 2021, 285, 124865. [Google Scholar] [CrossRef]
- Mendes, C.; Esquerre, K.; Queiroz, L.M. Application of Anaerobic Digestion Model No. 1 for simulating anaerobic mesophilic sludge digestion. Waste Manag. 2015, 35, 89–95. [Google Scholar] [CrossRef]
- Fezzani, B.; Ben Cheikh, R. Implementation of IWA anaerobic digestion model No. 1 (ADM1) for simulating the thermophilic anaerobic co-digestion of olive mill wastewater with olive mill solid waste in a semi-continuous tubular digester. Chem. Eng. J. 2008, 141, 75–88. [Google Scholar] [CrossRef]
- Kainthola, J.; Kalamdhad, A.S.; Goud, V.V. A review on enhanced biogas production from anaerobic digestion of lignocellulosic biomass by different enhancement techniques. Process. Biochem. 2019, 84, 81–90. [Google Scholar] [CrossRef]
- Fezzani, B.; Ben Cheikh, R. Extension of the anaerobic digestion model No. 1 (ADM1) to include phenolic compounds biodegradation processes for the simulation of anaerobic co-digestion of olive mill wastes at thermophilic temperature. J. Hazard. Mater. 2009, 162, 1563–1570. [Google Scholar] [CrossRef] [PubMed]
- Khan, M.; Chuenchart, W.; Surendra, K.; Khanal, S.K. Applications of artificial intelligence in anaerobic co-digestion: Recent advances and prospects. Bioresour. Technol. 2023, 370, 128501. [Google Scholar] [CrossRef] [PubMed]
- Derbal, K.; Bencheikh-Lehocine, M.; Cecchi, F.; Meniai, A.-H.; Pavan, P. Application of the IWA ADM1 model to simulate anaerobic co-digestion of organic waste with waste activated sludge in mesophilic condition. Bioresour. Technol. 2009, 100, 1539–1543. [Google Scholar] [CrossRef] [PubMed]
- Flatabø, G.Ø.; Bergland, W.H. Anaerobic Co-Digestion of Products from Biosolids Pyrolysis–Implementation in ADM1. In Proceedings of the 63rd International Conference of Scandinavian Simulation Society, SIMS 2022, Trondheim, Norway, 20–21 September 2022; pp. 413–420. [Google Scholar]
- Razaviarani, V.; Buchanan, I.D. Calibration of the Anaerobic Digestion Model No. 1 (ADM1) for steady-state anaerobic co-digestion of municipal wastewater sludge with restaurant grease trap waste. Chem. Eng. J. 2015, 266, 91–99. [Google Scholar] [CrossRef]
- Hagos, K.; Zong, J.; Li, D.; Liu, C.; Lu, X. Anaerobic co-digestion process for biogas production: Progress, challenges and perspectives. Renew. Sustain. Energy Rev. 2017, 76, 1485–1496. [Google Scholar] [CrossRef]
- Shi, X.-S.; Yuan, X.-Z.; Wang, Y.-P.; Zeng, S.-J.; Qiu, Y.-L.; Guo, R.-B.; Wang, L.-S. Modeling of the methane production and pH value during the anaerobic co-digestion of dairy manure and spent mushroom substrate. Chem. Eng. J. 2014, 244, 258–263. [Google Scholar] [CrossRef]
- Arnell, M.; Astals, S.; Åmand, L.; Batstone, D.J.; Jensen, P.D.; Jeppsson, U. Modelling anaerobic co-digestion in Benchmark Simulation Model No. 2: Parameter estimation, substrate characterization and plant-wide integration. Water Res. 2016, 98, 138–146. [Google Scholar] [CrossRef]
- Esposito, G.; Frunzo, L.; Panico, A.; Pirozzi, F. Modelling the effect of the OLR and OFMSW particle size on the performances of an anaerobic co-digestion reactor. Process Biochem. 2011, 46, 557–565. [Google Scholar] [CrossRef]
- Bedoić, R.; Špehar, A.; Puljko, J.; Čuček, L.; Ćosić, B.; Pukšec, T.; Duić, N. Opportunities and challenges: Experimental and kinetic analysis of anaerobic co-digestion of food waste and rendering industry streams for biogas production. Renew. Sustain. Energy Rev. 2020, 130, 109951. [Google Scholar] [CrossRef]
- Pettigrew, L.; Gutbrod, A.; Domes, H.; Groß, F.; Méndez-Contreras, J.M.; Delgado, A. Modified ADM1 for high-rate anaerobic co-digestion of thermally pre-treated brewery surplus yeast wastewater. Water Sci. Technol. 2017, 76, 542–554. [Google Scholar] [CrossRef]
- Montecchio, D.; Astals, S.; Di Castro, V.; Gallipoli, A.; Gianico, A.; Pagliaccia, P.; Piemonte, V.; Rossetti, S.; Tonanzi, B.; Braguglia, C.M. Anaerobic co-digestion of food waste and waste activated sludge: ADM1 modelling and microbial analysis to gain insights into the two substrates’ synergistic effects. Waste Manag. 2019, 97, 27–37. [Google Scholar] [CrossRef]
- Zhou, H.; Ying, Z.; Cao, Z.; Liu, Z.; Zhang, Z.; Liu, W. Feeding control of anaerobic co-digestion of waste activated sludge and corn silage performed by rule-based PID control with ADM1. Waste Manag. 2020, 103, 22–31. [Google Scholar] [CrossRef]
- Daiem, M.M.A.; Hatata, A.; Galal, O.H.; Said, N.; Ahmed, D. Prediction of biogas production from anaerobic co-digestion of waste activated sludge and wheat straw using two-dimensional mathematical models and an artificial neural network. Renew. Energy 2021, 178, 226–240. [Google Scholar] [CrossRef]
- Sun, Y.; Wang, D.; Qiao, W.; Wang, W.; Zhu, T. Anaerobic co-digestion of municipal biomass wastes and waste activated sludge: Dynamic model and material balances. J. Environ. Sci. 2013, 25, 2112–2122. [Google Scholar] [CrossRef] [PubMed]
- Li, P.; Wei, X.; Wang, M.; Liu, D.; Liu, J.; Pei, Z.; Shi, F.; Wang, S.; Zuo, X.; Li, D.; et al. Simulation of anaerobic co-digestion of steam explosion pulping wastewater with cattle manure: Focusing on degradation and inhibition of furfural. Bioresour. Technol. 2023, 380, 129086. [Google Scholar] [CrossRef] [PubMed]
- Wang, Y.; Zhang, S.; Song, J.; Sheng, C.; Shang, Z.; Wang, R.; Wang, X.; Yang, G.; Feng, Y.; Ren, G. Strategies to improve the production of biomethane from organic wastes with anaerobic co-digestion: A systematic review. Biofuels Bioprod. Biorefining 2022, 16, 1388–1411. [Google Scholar] [CrossRef]
- Azeez, S.A.; Gwandangaji, D.B. Modeling Anaerobic Co-Digestion of Food Wastes and Cattle Manure in an Industrial Plant: A System Dynamic Approach. Preprint (Version 2) Available at Research Square. 6 June 2022. Available online: https://www.researchsquare.com/article/rs-1167800/v2 (accessed on 23 December 2022). [CrossRef]
- Ndeba-Nganongo, L.A.N.; Ntwampe, S.K.O.; Szabolcs, S.; Itomba-Tombo, E.F. The Application of ADM/ASM Interface in Sumo Wide Plant Model. In Proceedings of the 10th International Conference on Advances in Science, Engineering, Technology & Healthcare (ASETH-18), Cape Town, South Africa, 19–20 November 2018. [Google Scholar] [CrossRef]
- Catenacci, A.; Grana, M.; Malpei, F.; Ficara, E. Optimizing ADM1 Calibration and Input Characterization for Effective Co-Digestion Modelling. Water 2021, 13, 3100. [Google Scholar] [CrossRef]
- Yu, L.; Wensel, P.C.; Ma, J.; Chen, S. Mathematical Modeling in Anaerobic Digestion (AD). J. Bioremediat. Biodegrad. 2013, S4, 3. [Google Scholar] [CrossRef]
- Rosen, C.; Jeppsson, U. Aspects on ADM1 Implementation within the BSM2 Framework; Technical Report No: LUTEDX/(TEIE-7224)/1-35/(2006); Department of Industrial Electrical Engineering and Automation, Lund University: Lund, Sweden, 2006. [Google Scholar]
- Mo, R.; Guo, W.; Batstone, D.; Makinia, J.; Li, Y. Modifications to the Anaerobic Digestion Model No. 1 (ADM1) for Enhanced Understanding and Application of the Anaerobic Treatment Processes—A Comprehensive Review. Water Res. 2023, 244, 120504. [Google Scholar] [CrossRef]
- Perendeci, N.A.; Tanyolaç, A.; Çelebi, S.S. A simplified kinetic model for a full scale anaerobic wastewater treatment plant of a sugar factory under unsteady conditions. Desalination Water Treat. 2012, 40, 118–128. [Google Scholar] [CrossRef]
- Ngila, J.; Matheri, A.; Muckoya, V.; Ngigi, E.; Ntuli, F.; Seodigeng, T.; Zvinowanda, C. Mathematical Modelling for Biological Wastewater Treatment Plants Gauteng, South Africa. WRC Report No: 2563/1/19. 2020. Available online: https://wrc.org.za/?mdocs-file=60075 (accessed on 25 April 2021).
- Danielsson, O. Modeling and Simulation of Anaerobic Manure Digestion into Biogas. Master’s Thesis, Chalmers University of Technology, Gothenburg, Sweden, 2014. Available online: http://publications.lib.chalmers.se/records/fulltext/211706/211706.pdf (accessed on 25 April 2021).
- Shi, E.; Li, J.; Zhang, M. Application of IWA Anaerobic Digestion Model No. 1 to simulate butyric acid, propionic acid, mixed acid, and ethanol type fermentative systems using a variable acidogenic stoichiometric approach. Water Res. 2019, 161, 242–250. [Google Scholar] [CrossRef] [PubMed]
- Parra-Orobio, B.A.; Donoso-Bravo, A.; Torres-Lozada, P. Energy balance and carbon dioxide emissions comparison through modified anaerobic digestion model No 1 for single-stage and two-stage anaerobic digestion of food waste. Biomass Bioenergy 2020, 142, 105814. [Google Scholar] [CrossRef]
- Rivera-Salvador, V.; López-Cruz, I.L.; Espinosa-Solares, T.; Aranda-Barradas, J.S.; Huber, D.H.; Sharma, D.; Toledo, J.U. Application of Anaerobic Digestion Model No. 1 to describe the syntrophic acetate oxidation of poultry litter in thermophilic anaerobic digestion. Bioresour. Technol. 2014, 167, 495–502. [Google Scholar] [CrossRef]
- Dereli, R.K.; Ersahin, M.E.; Ozgun, H.; Ozturk, I.; Aydin, A.F. Applicability of Anaerobic Digestion Model No. 1 (ADM1) for a specific industrial wastewater: Opium alkaloid effluents. Chem. Eng. J. 2010, 165, 89–94. [Google Scholar] [CrossRef]
- Rozzi, A.; Remigi, E. Methods of assessing microbial activity and inhibition under anaerobic conditions: A literature review. Rev. Environ. Sci. Bio/Technol. 2004, 3, 93–115. [Google Scholar] [CrossRef]
- Silva, F.; Nadais, H.; Prates, A.; Arroja, L.; Capela, I. Modelling of anaerobic treatment of evaporator condensate (EC) from a sulphite pulp mill using the IWA anaerobic digestion model no. 1 (ADM1). Chem. Eng. J. 2009, 148, 319–326. [Google Scholar] [CrossRef]
- Zhao, X.; Li, L.; Wu, D.; Xiao, T.; Ma, Y.; Peng, X. Modified Anaerobic Digestion Model No. 1 for modeling methane production from food waste in batch and semi-continuous anaerobic digestions. Bioresour. Technol. 2018, 271, 109–117. [Google Scholar] [CrossRef]
- Li, D.; Lee, I.; Kim, H. Application of the linearized ADM1 (LADM) to lab-scale anaerobic digestion system. J. Environ. Chem. Eng. 2021, 9, 105193. [Google Scholar] [CrossRef]
- Vega De Lille, M.I. Modeling, Simulation and Control of Biotechnological Processes in Decentralized Anaerobic Treatment of Domestic Wastewater. Ph.D. Thesis, Friedrich-Alexander-Universität Erlangen-Nürnberg, Erlangen, Germany, 2015. [Google Scholar]


| Component | Description | Min | Max | Average |
|---|---|---|---|---|
| Flow (m³/day) | Influent Flow | 165 | 170 | 167.5 |
| pH | 5.1 | 7 | 6.05 | |
| Temperature (°C) | 31 | 37 | 34 | |
| TCOD (mg/L) | Total COD | 7940 | 10,500 | 9220 |
| SCOD (mg/L) | Soluble COD | 5342 | 8500 | 6921 |
| PCOD (mg/L) | Particulate COD | 2598 | 1000 | 1799 |
| TSS (mg/L) | Total Suspended Solids | 603.44 | 750.03 | 676.735 |
| VSS (mg/L) | Volatile Suspended Solids | 573.268 | 609.23 | 591.249 |
| VFA (meq/L) | Volatile Fatty Acids | 721.3 | 821.56 | 771.43 |
| Total Alkalinity | as CaCO3 | 584 | 589 | 586.5 |
| TOC | Total Organic Carbon | 25 | 31 | 28 |
| TKN (mg N/L) | Total Kjeldahl Nitrogen | 925 | 946.3 | 935.65 |
| NH4-N (mg N/L) | Ammonium Nitrogen | 127 | 129 | 128 |
| NO2-N (mg N/L) | Nitrate | 54 | 54.3 | 54.15 |
| NO3-N (mg N/L) | Nitrite | 190 | 197 | 193.5 |
| Total-P (mg P/L) | Total Phosphorus | 3.69 | 6 | 4.845 |
| PO4-P (mg P/L) | Orthophosphates | 0.1 | 0.12 | 0.11 |
| Ca (mg/L) | Calcium | 5.4 | 5.4 | 5.4 |
| Mg (mg/L) | Magnesium | 0.87 | 0.87 | 0.87 |
| SO4 (mg/L) | Sulphates | 0.32 | 0.45 | 0.385 |
| CH4 content (%) | Methane % | 65 | 71 | 68 |
| CO2 content (%) | Carbon dioxide | 31 | 32 | 31.5 |
| Type of Inhibition | Description | Equation | Affected Process |
|---|---|---|---|
| pH Inhibition | pH inhibition at both low & high pH | All substrate uptake | |
| pH inhibition at low pH only | |||
| Competitive Inhibition | Valerate & Butyrate competes for C4 | Butyrate, valerate, C4 uptake | |
| Non-competitive Inhibition | Hydrogen and free ammonia inhibition | LCFA, Acetate, Butyrate, valerate, propionate uptake | |
| Secondary substrate | Inhibition due to limited inorganic nitrogen | All substrate uptake |
Disclaimer/Publisher’s Note: The statements, opinions and data contained in all publications are solely those of the individual author(s) and contributor(s) and not of MDPI and/or the editor(s). MDPI and/or the editor(s) disclaim responsibility for any injury to people or property resulting from any ideas, methods, instructions or products referred to in the content. |
© 2023 by the authors. Licensee MDPI, Basel, Switzerland. This article is an open access article distributed under the terms and conditions of the Creative Commons Attribution (CC BY) license (https://creativecommons.org/licenses/by/4.0/).
Share and Cite
Mudzanani, K.E.; Phadi, T.T.; Iyuke, S.E.; Daramola, M.O. Enhancing Methane Production through Anaerobic Co-Digestion of Sewage Sludge: A Modified ADM1 Model Approach. Fermentation 2023, 9, 833. https://doi.org/10.3390/fermentation9090833
Mudzanani KE, Phadi TT, Iyuke SE, Daramola MO. Enhancing Methane Production through Anaerobic Co-Digestion of Sewage Sludge: A Modified ADM1 Model Approach. Fermentation. 2023; 9(9):833. https://doi.org/10.3390/fermentation9090833
Chicago/Turabian StyleMudzanani, Khuthadzo E., Terence T. Phadi, Sunny E. Iyuke, and Michael O. Daramola. 2023. "Enhancing Methane Production through Anaerobic Co-Digestion of Sewage Sludge: A Modified ADM1 Model Approach" Fermentation 9, no. 9: 833. https://doi.org/10.3390/fermentation9090833