Article

Recovery of Energy and Carbon Dioxide from Craft Brewery Wastes for Onsite Use

1
Department of Civil & Environmental Engineering, University of South Florida, Tampa, FL 33620, USA
2
Department of Integrative Biology, University of South Florida, Sarasota, FL 34243, USA
*
Author to whom correspondence should be addressed.
Fermentation 2023, 9(9), 831; https://doi.org/10.3390/fermentation9090831
Submission received: 1 August 2023 / Revised: 8 September 2023 / Accepted: 9 September 2023 / Published: 12 September 2023
(This article belongs to the Special Issue Sustainable Development of Food Waste Biorefineries)

Abstract

:
Interest in craft beers is increasing worldwide due to their flavor and variety. However, craft breweries have high water, energy, and carbon dioxide (CO2) demands and generate large quantities of high-strength waste and greenhouse gases. While many large breweries recover energy using anaerobic digestion (AD) and recapture CO2 from beer fermentation, little is known about the economic feasibility of applying these technologies at the scale of small craft breweries. In addition, compounds in hops (Humulus lupulus), which are commonly added to craft beer to provide a bitter or “hoppy” flavor, have been shown to adversely affect anaerobic microbes in ruminant studies. In this study, biochemical methane potential (BMP) assays and anaerobic sequencing batch reactor (ASBR) studies were used to investigate biomethane production from high-strength craft brewery waste, with and without hop addition. A spreadsheet tool was developed to evaluate the economic feasibility of bioenergy and CO2 recovery depending on the brewery’s location, production volume, waste management, CO2 requirement, energy costs, and hop waste addition. The results showed that co-digestion of yeast waste with 20% hops (based on chemical oxygen demand (COD)) resulted in slightly lower methane yields compared with mono-digestion of yeast; however, it did not significantly impact the economic feasibility of AD in craft breweries. The use of AD and CO2 recovery was found to be economically feasible if the brewery’s annual beer production is >50,000 barrels/year.

Graphical Abstract

1. Introduction

Interest in craft beers is increasing worldwide due to their flavor, variety, and artisanal approach to brewing. Craft breweries are typically defined as those with an annual production of 0.7 million m3 (6 million barrels) of beer or less [1,2]. Craft breweries have high water, energy and carbon dioxide (CO2) demands, and generate large quantities of solid and liquid wastes and greenhouse gases. Spent grains account for up to 85% of the solid waste generated in craft breweries [3] and are typically sent to farmers for use as animal feed. Beer brewing requires 4 to 20 m3 of water to produce each m3 of beer. Wastewater is generated from various processes, including low-strength wastewater from cleaning operations and high-strength wastewater, including trub, spent yeast, and hops. Spent yeast, which makes up the largest fraction of high-strength liquid waste, has high chemical oxygen demand (COD) concentrations ranging from 100,000 to 300,000 mg/L [4]. While some of the yeast can be recycled within the brewery or directed for use as animal feed, most craft breweries direct this wastewater to local treatment plants, which often impose high waste surcharges [5,6]. Craft beer brewing is also energy intensive, with approximately 240 to 280 kWh of thermal energy and 75 to 138 kWh of electrical energy consumed per m3 of beer produced [7,8].
Anaerobic digestion (AD) is a biological process that converts organic wastes into biogas, which is a mixture of methane (CH4) and CO2. Biogas can be further processed into renewable natural gas (RNG) and used onsite to meet a brewery’s thermal energy needs or processed into compressed natural gas (CNG) and liquefied natural gas (LNG) for offsite use. Alternatively, it can be utilized for generating electricity and heat through combined heat and power (CHP) systems to offset a brewery’s electrical and thermal demand [9]. Many large breweries employ AD for both wastewater treatment and energy cost reduction [10]. For example, Sierra Nevada Brewing Company (Chico, CA, USA) reported annual energy and waste management savings of >USD 500,000 after implementing AD [11].
Beers containing large quantities of hops (Humulus lupulus), such as India Pale Ales (IPAs), are a trademark of craft brewing. Spent hops have a bitter flavor and a lower nutritional value than spent grain. Hence, only a small portion of hop waste can be directed to animal feed [4]. In addition, hop metabolites include alpha acids, beta acids, and Xanthohumol, which have antimicrobial properties that aid in beer preservation [12,13]. These compounds have been shown to inhibit CH4 production in ruminant animals, which has been proposed as a way to increase the nutritive value of feeds while reducing greenhouse gas emissions from cattle [14,15,16]. Two mechanisms have been identified for CH4 inhibition in ruminants: (a) inhibition of Gram-positive bacteria in the acetogenic and acidogenic stage [17,18] and (b) inhibition of methanogenic archaea [16].
Although it is evident that hop metabolites inhibit CH4 production in cattle, the effect of hop metabolites on the AD of brewery waste has not previously been investigated. Sosa-Hernandez and colleagues conducted biomethane potential (BMP) assays with spent yeast from different sources and reported low CH4 yields from hoppy beers (28 mLCH4/gCOD) compared with less hoppy beers (42 and 68 mLCH4/gCOD), suggesting potential inhibition by hop metabolites [19].
Carbon dioxide (CO2) is a by-product of beer fermentation and is also used in the brewing process for bottling, flushing, and carbonation. Prior studies have shown that CO2 can be recovered from fermentation, scrubbed, and compressed for in-process recycling and reducing costs and greenhouse gas emissions [20]. CO2 that is recovered from fermenters is also a high-quality product without industrial contaminants that may be present when by-product CO2 is purchased from ammonia and urea facilities. Recovered CO2 can be further processed into dry ice and compressed or liquefied CO2 for offsite applications. CO2 recovery units are available as modular skid-mounted systems [21]. Considering its economic and environmental benefits, CO2 recovery could improve the sustainability of small craft breweries.
Several spreadsheet tools have been developed to aid in the economic and environmental assessment of AD systems. However, most of these tools focus on livestock manure as the primary AD substrate. For example, the US Environmental Protection Agency (US EPA) has developed a Co-Digestion Economic Analysis Tool (CoEAT) to evaluate the economic feasibility of AD co-digestion of manure with food waste, fats, oils, and grease [22]. Astill and colleagues developed a tool to aid farmers in AD adoption decision-making. The tool is designed to assess the economic feasibility of AD using farm-derived feedstocks, including manure and crop residues [23]. Therefore, the existing tools are not directly applicable to craft brewery waste. Furthermore, no prior study examines the economic tradeoffs of CO2 recovery systems for small craft breweries.
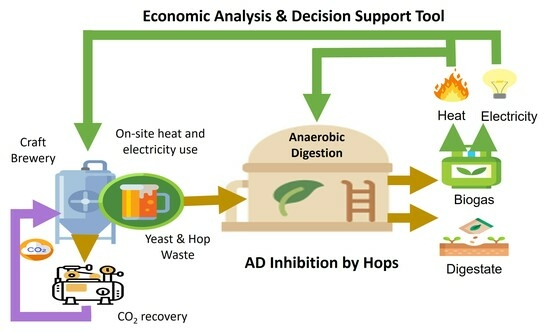
The overall goal of this study was to improve the environmental and economic sustainability of small craft breweries by recovering bioenergy and CO2 for onsite use. The specific objectives were to: (1) investigate the effect of hops on spent yeast waste AD through BMP assays, (2) conduct bench-scale anaerobic sequencing batch reactor (ASBR) studies without and with hops addition to provide data for full-scale economic analysis, and (3) develop a tool to evaluate the feasibility of bioenergy and CO2 recovery at craft breweries depending on factors such as production volume, location, waste surcharges, CO2 costs, energy costs, and hop waste addition.

2. Materials and Methods

2.1. Bench Scale Experiments

2.1.1. Materials

Characteristics of spent yeast, hops, and inoculum are shown in Table 1. Spent yeast was obtained from a small craft brewery in Sarasota, FL, USA. Hops, with an alpha acid content of 7.3%, were obtained from Yakima Chief Hops HBC 692 (Yakima, WA, USA). AD inoculum was obtained from a mesophilic AD that was used to process waste-activated sludge at the South Cross Bayou Advanced Wastewater Treatment Facility in Pinellas County, FL, USA. Fresh AD inoculum was obtained for each phase of the study. Magnesium Carbonate (MgCO3), which was used as an alkalinity source, was obtained from Thermo-Scientific (Haverhill, MA, USA). Note that MgCO3 was used instead of NaHCO3 due to the high Na+ concentration of spent yeast, which can be toxic to anaerobic microbes [24,25,26]. Well water was sourced from Botanical Gardens located at the University of South Florida.

2.1.2. Biomethane Potential Assays (BMPs)

Mesophilic (35 °C) BMP assays were conducted in two phases (Table 2). BMPs were set up in 200 mL glass serum bottles with crimp caps and septum seals. In Phase I, the substrate to inoculum ratio (S/I) was set at 2.5 g COD/g VSS based on prior studies [19,27,28]. The yeast-only system in Phase 1 soured due to volatile fatty acid (VFA) accumulation. Hence, based on the results from Phase 1, another round of BMPs (Phase 2) was conducted at a lower S/I ratio of 1.7, a higher initial alkalinity, and with fresh inoculum. In both phases, digestion sets were set up with hop concentrations of 0% hops (yeast only), 20% hops, and 40% hops (based on total COD supplied by the substrate). These hop percentages were based on estimates of relative hop and yeast waste production rates at the craft breweries we partnered with in Sarasota and Tampa (FL, USA). Additional digestion sets were used as inoculum-only controls in both phases. Biogas and methane contents were determined on duplicate bottles. Duplicate bottles were sacrificed for chemical analysis (described below) on days 0, 42, and 58 during Phase I and days 0, 38, and 60 during Phase II. Additional details can be found in [29].

2.1.3. Anaerobic Sequencing Batch Reactor (ASBR) Studies

Two bench-scale ASBRs were created from glass bottles (1.6 L working volume) with screw caps drilled with three holes for tubing reaching the: (a) head space, which was connected to a biogas collection system; (b) supernatant, for feeding the reactor and wasting effluent; and (c) settled solids, for solids wasting. Preliminary studies were carried out in duplicate mesophilic ASBRs for 2 months with yeast waste only at varying hydraulic residence times (HRTs), organic loading rates (OLRs), solids residence times (SRTs), and MgCO3 dosing to determine optimal ASBR operating conditions [29]. Subsequently, one of the duplicate ASBRs continued to be fed with yeast waste only (Y), and the second ASBR was set up with 80% yeast waste and 20% hops based on COD (YH). The OLR and HRT were maintained at 720 mg COD/L/day and 20 days, respectively, by wasting 240 mL of supernatant every 3 days and feeding fresh influent diluted with well water. The SRT was maintained at 190 days by wasting settled solids every 6 days. In addition, 0.25 g MgCO3 was added as an alkalinity source on sludge-wasting days.

2.1.4. Analytical Methods

In the BMP assays, biogas volume was measured using a frictionless syringe (Cadence Inc., Staunton, VA, USA). In the ASBR studies, biogas flowrate was measured using a gas flow meter (Wet Tip Gas Meter, Nashville, TN, USA). Methane content of the biogas was measured using a Gas Chromatograph (GOW MAC, Bethlehem, PA, USA) equipped with a Hay Sep Column and Thermal Conductivity Detector. The detector, column, and injector temperatures were 100 °C, 60 °C, and 100 °C, respectively. A current of 200 mV and high-purity helium (Airgas, Inc., Radnor, PA, USA) at a flow rate of 32 mL/min were used. All chemical characteristics were measured using Standard Methods [30] for pH (4500), alkalinity (2320), volatile suspended solids (VSS; 1648), COD (5220), and VFA (5560). Test kits were used to measure VFAs (Hach, Loveland, CO, USA) and COD (Lovibond, Sarasota, FL, USA) concentrations. Ammonium concentrations were measured using a Timberline TL-2800 Ammonia Analyzer (Timberline Instrument, Boulder, CO, USA).

2.1.5. Data Analysis

Gas volumes were adjusted to standard temperature (273 °C) and pressure (1 atm) using the ideal gas law. Paired T-tests with a p-value of 0.05 were used to evaluate statistical significance between chemical characteristics data for BMP assays and ASBR studies. The Modified Gompertz Equation (Equation (1); [31]) was used to determine the methane rate constant for the BMP assays. Excel was used to minimize the sum of absolute errors between experimental and model methane volumes.
M P =   P M · e x p { e x p [ R e x p P M ( X O X ) + 1 ] }
where:
Mp = cumulative methane production at time X (mL);
P M = methane production potential (mL);
Rexp = maximum methane production rate (mL/day);
X O = lag period (days);
X = time (days).

2.2. Decision Support Tool

A custom Excel spreadsheet tool was created specifically for craft brewers to analyze the cost and benefits of incorporating AD and CO2 recovery systems at varying scales of craft breweries. Figure 1 illustrates the system boundary of the tool, covering inputs, analysis, and outputs. The tool’s input interface includes essential details about the brewery, waste generation and management, energy consumption, and CO2 consumption. General information includes location, beer production rate, and available space. Waste generation and management are determined either through user input or calculations based on annual production, considering factors such as waste characteristics, transportation distance, and existing waste disposal methods. Similarly, energy consumption is obtained either through user input or by performing calculations based on the annual production rate, which includes factors such as electricity and/or natural gas consumption. The tool’s output interface provided AD plant sizing, predicted biogas production, capital and operation and maintenance (O&M) costs, CO2 offset potential, and economic performance (net present value (NPV) and payback period).

2.2.1. Anaerobic Digester Sizing

The tool employs user inputs and assumed constants to estimate an AD plant and determine the suitable size of the AD reactor for processing the high-strength fraction of the brewery wastewater. The digester size is a function of the flow rate, influent substrate concentration, and OLR. In addition, a safety factor of 20% was applied to the digester’s headspace to account for gas storage and variations in wastewater characteristics [32,33]. This safety factor is flexible and can be adapted to the unique annual production of each brewery. The optimal size of the digester could be determined using Equation (2):
V D = Q × C 0 , C O D O L R × ( 1 + H D )  
where:
  • Q = feedstock flowrate (m3/s);
  • C0,COD = influent substrate concentration (kg/m3);
  • OLR = COD loading rate (kg/m3/s);
  • HD = head space of the digester (%);
  • VD = volume of the AD (m3).

2.2.2. Biogas Production and Utilization

The amount of methane produced (m3/d) was estimated using Equation (3).
  M e t h a n e   p r o d u c t i o n   r a t e = ( C O D T o t a l   × α )    
where:
  • CODTotal = COD of waste generated (kg/day);
  • α = the methane yield (m3 CH4/kg COD).
Note that the methane yield used in the model was based on the experimental data from the ASBR studies of 0.3 m3 CH4/kg COD for yeast waste alone and 0.23 m3 CH4/kg COD for co-digestion of yeast waste with 20% hops.
Based on discussions with our collaborating breweries, two different onsite uses for biogas were considered: CHP and RNG. Each method involves slightly different processes and equipment. CHP produces heat and power by combustion of biogas generated during AD. The most common application of biogas in AD facilities is for generating electricity and heat [34]. The CHP process includes gas cleaning, combustion, generator driving, and heat exchange. On the other hand, RNG systems purify the biogas by removing nearly all non-methane components, making it meet natural gas standards and suitable for use in conventional natural gas applications. In this study, the biogas would be upgraded to meet the natural gas quality for onsite utilization within the craft brewery.

2.2.3. Carbon Offset Potential

By capturing and reusing by-product CO2 from beer fermentation, breweries can reduce their environmental impact, save money, and contribute to a more sustainable future. Typically, during beer production, approximately 1–1.5 kg CO2/hL of beer is utilized for bottling and pre-pressurizing tanks. At current levels of recovery technology, it is possible to recover up to 2 kg CO2 per hectoliter (hL) of fermented beer. However, it is important to note that any excess CO2 generated during the pressurization of filtered beer tanks is reclaimed and reintroduced into the CO2 recovery system [35]. Since this study focused on the onsite use of recovered CO2, other potential products from CO2, such as dry ice, were not considered.

2.2.4. Economic Analysis

A customized economic analysis tool was created to evaluate the viability of bioenergy and CO2 recovery in craft breweries. This tool allows for the assessment of plant revenues, expenditures, and economic indicators such as the payback period and NPV. The economic factors influencing bioenergy and CO2 recovery systems encompass capital costs, O&M costs, the benefits derived from the produced biogas, income from the digestate, and savings from avoided waste disposal costs. These costs depend on local costs as well as the region’s political and economic policies.
The cost associated with AD depends on the facility’s processes, design, and size (Table S1). In this study, the capital costs of biogas facilities were obtained from the EPA CoEAT model [22]. In order to validate the feasibility of using the EPA CoEAT model to estimate the installation costs of AD plants in craft breweries, the capital costs obtained from the model were compared with several real case studies (Table S2) [36,37,38,39].
Currently, there is a lack of available data on the O&M costs of AD plants. In this study, the average O&M costs of AD plants were estimated to be $10/m3 of AD plant capacity [23]. O&M costs of RNG, CHP, and CO2 recovery systems were calculated based on 3%, 1.5%, and 1% of capital costs, respectively [23].
The revenue generated by the AD plant is obtained through the sale of the liquid digestate, which serves as a fertilizer. This liquid digestate contains a substantial concentration of nitrogen and phosphorus, comparable to that found in industrial fertilizers. Other savings include avoided electricity costs, natural gas costs, and CO2 costs, depending on the alternative chosen. The economic analysis conducted by the tool excluded tax credits as these factors are contingent upon the particular region or country in which the craft brewery is located.
The tool incorporates various economic indicators to enable users to effectively evaluate the economic feasibility of their chosen alternative, including the payback period and NPV, as described in Equations (4) and (5). Alternatives with a shorter payback period and a positive NPV are preferred.
Payback   period = I n i t a l   i n v e s t m e n t C a s h   f l o w
N P V = C F n ( 1 + R ) n I 0
where:
  • n = the period which takes values from 0 to the nth period till the cash flow ending period;
  • CFn = the cash flow in the nth period (USD);
  • R = the discount rate;
  • I0 = the initial investment (USD).

3. Results

3.1. Bench Scale Experiments

3.1.1. Biomethane Potential Assays (BMPs)

Methane production data for Phase I BMPs are shown in Figure 2. During Phase I, yeast waste-only BMPs produced almost no methane, while BMPs with added hops had maximum methane yields of 0.10 mL CH4/mg COD for 20% hops and 0.076 mL CH4/mg COD for 40% hops (Table 3). VFA concentrations during the second sacrifice on day 42 (Table 4) were much higher in the yeast-only system (7500 mg/L) compared with the 20% hops (300 mg/L) and 40% hops (600 mg/L). The sudden release of VFAs in the yeast-only system consumed available alkalinity, resulting in the pH dropping below the conducive range for anaerobic digestion [40], which soured the system, resulting in little to no methane generation. While alkalinity concentrations in the yeast-only system dropped below the conducive limit of 2000 mg/L [41], the 20% hops and 40% hops BMPs had adequate alkalinity. Hops have a high crude fiber content [4], which is not readily bioavailable for anaerobic microbes; therefore, hop addition may have prevented souring due to the more distributed release of VFAs during fermentation. The higher bioavailability of yeast is further evident as the yeast-only system had the highest COD degradation compared to the 20% and 40% hops assays (Table 3).
During Phase II, the S/I was decreased from 2.4 to 1.7 g COD/gVS, and the initial alkalinity was increased to prevent souring observed in Phase I. Maximum methane yields of 0.17, 0.15, and 0.11 mL CH4/mg COD were observed for yeast waste alone, 20% hops, and 40% hops, respectively (Figure 3). Methane yields obtained during Phase II were similar to values reported in the prior literature of 0.025–0.24 mL CH4/mg COD [19,42], indicating that a lower S/I ratio and the addition of alkalinity avoided VFA accumulation, reactor souring and methanogenesis inhibition, as shown in Table 3. Similar to Phase I, for the BMPs with added hops, the lower hop percentage resulted in a higher methane yield, suggesting that hop dosage affects their inhibitory effects. Methane yield was significantly lower for 40% hops compared with yeast only or 20% hops; however, differences between yeast only and 20% hops were not significant. Similar to Phase I, assays with higher hop concentrations had lower COD degradation during Phase II (Table 3).
As shown in Table 4 and Table 5, ammonium concentrations increased over time, with the yeast-only system having the highest concentrations on days 58 and 60 during Phases I and II, respectively. This was likely due to high protein compositions typically found in spent yeast [4]. VSS concentrations decreased after the first sacrifice in both phases as the volatile solids were consumed over time. The increase in VSS between the second and third sacrifices in the yeast only and 20% hops assays could have been due to the growth of microbial biomass.
Gompertz analysis of the BMP data (Table 3) shows that a greater hop content in the feed led to lower methane yields in both BMP Phases. The results are consistent with AD studies by Sosa-Hernandez et al. [19], who found that spent yeast from hoppy beers had lower methane yields than less hoppy beers. As mentioned previously, prior studies with ruminant microbial communities showed that hop metabolites have antimicrobial properties that inhibit methanogenesis [16,17,18]. Concentrations of VFAs during the second and third sacrifices of both BMP phases were higher, with 40% hops compared with 20% hops (Table 4 and Table 5). This suggests that VFAs produced during fermentation in high hop dosage assays were consumed by methanogens at a slower rate compared to lower dosages. This is further supported by the Gompertz rate constants (Table 3), which showed lower methane production rates at higher hop dosages. Surprisingly, the lag period for the yeast-only BMP in Phase II was longer than for the digesters containing hops in both Phases (Table 3). This may have been due to initial reactor souring followed by recovery in the yeast waste-only BMPs; however, chemical analysis was not conducted until day 38.

3.1.2. Anaerobic Sequencing Batch Reactors (ASBRs)

Bench-scale ASBRs were set up with yeast waste alone and with 20% hops (based on COD) and operated at an OLR of 720 mg COD/L/day, an HRT of 20 days, and an SRT of 190 days. Biogas and methane yields in the yeast-only ASBR were similar to results from the preliminary 2-month study performed with duplicate ASBRs operated with yeast waste alone [29]. In both ASBRs, methane yields (Figure 4) were comparable to those reported for co-digestion of spent yeast with brewery wastewater, which ranges 0.20–0.35 mL CH4/mg COD [42,43,44,45].
Consistent with Phase II BMPs, the mono-digestion of yeast resulted in higher methane yields than the co-digestion of yeast and hops (Figure 4). Inhibition increased over approximately one HRT as hops from the feed accumulated in the system. Hop addition resulted in both lower biogas production and lower biogas methane content (Table 6); however, the lower methane yields in the ASBR with hops were largely a result of lower biogas production. Lower methane yield in the ASBR with hops may have been due to: (1) direct inhibition of methanogenesis due to the accumulation of hop metabolites, such as alpha and beta acids, and/or (2) slower VFA release during fermentation since hops are more difficult to break down by hydrolytic bacteria. COD degradation in the ASBR with hops was lower than in the ASBR without hops (Table 6), which is similar to results found in the BMP studies (Table 3). The mean alkalinity concentration in the Y digester was higher than the YH digester. Although the VFA concentrations were not measured during the ASBR studies, lower alkalinity concentrations might suggest VFA accumulation due to methanogenesis inhibition by hops in the YH digester, which likely consumed the alkalinity. The mean ammonium concentrations in digester Y were lower than the YH digester.
Due to the short operating time of the ASBR studies (25 days), steady-state operations were not established, which is a limitation of this study. In a prior study, Blaxland et al. [16] observed acclimation of the microbial community against inhibitory hop substances over time. Therefore, longer studies should be carried out to determine whether acclimation of microbial communities to hops might result in increased methane yields.

3.2. Economic Analysis

This study examined potential biogas production for craft breweries, considering various annual production levels: 50,000, 500,000, 1 million, 2 million, 4 million, and 6 million barrels, based on typical production rates for U.S. craft breweries [2]. AD capital costs, with additional investments required for RNG or CHP with and without CO2 recovery, are shown in Figure 5. AD capital costs included tanks, mixers, inlet and outlet pumps, and piping (listed in Table S2). Small-scale systems that can recover CO2 from beer fermentation gases are generally affordable, with a current capital cost of approximately USD 150,000 [46].
When evaluating total capacity costs, the combination of AD with RNG results in AD accounting for >90% of the total capital cost. The relative percentage of AD cost increases as the annual production increases (Figure 6). However, in the combination of AD with a CHP system, the relative percentage of AD capital cost decreases as annual production increases, indicating that AD + CHP is more economically viable for large-scale breweries, which have more organic matter available for CH4 production. When considering an annual production of 50,000 barrels using an AD with RNG, the capital cost of CO2 recovery accounts for up to 5.7%. As the annual production increases, the difference between options with and without CO2 recovery is negligible.
Annual income primarily comes from cost savings on natural gas, electricity, and CO2, as well as tax credits (see Table S3 for details). Figure 7 illustrates the payback period for different options. For an annual production of 50,000 barrels, the payback period is 43.0 years for AD with RNG and 45.4 years for AD with CHP. However, when considering the implementation of a CO2 recovery system, the payback period significantly decreases to 3.5 years for the combination of AD and RNG and 3.7 years for the combination of AD and CHP. Without CO2 recovery, both AD + RNG and AD + CHP become economically feasible for craft breweries with annual production >500,000 barrels, with a payback period of <10 years.
Implementing a CO2 recovery system can significantly reduce the payback period for both the AD + RNG option and the AD + CHP option. Without the CO2 recovery system, the payback periods for both options are quite long, indicating a slower return on investment. However, when the CO2 recovery system is included, the payback periods decrease significantly, making both alternatives economically feasible. This is because recovered CO2 is a high-value product compared with electricity and natural gas. Overall, the information emphasizes the potential economic benefits of implementing AD and RNG or AD and CHP systems, especially when coupled with CO2 recovery, and provides valuable insights for decision making in the context of craft breweries.
The co-digestion of yeast waste with 20% hops decreased methane yield from 0.3 m3 CH4/kg COD to 0.23 m3 CH4/kg COD. Despite this reduction, adding 20% of hops waste had minimal impact on the payback period. Across various scenarios with annual production levels ranging from 50,000 to 6,000,000 barrels, the payback period decreased by 0–4.2% (as shown in Table S4). The results of this study highlight the potential benefits of co-digestion with 20% of hops waste, not only from an environmental perspective but also from an economic standpoint.

4. Conclusions

This study evaluated the effects of AD of spent brewery yeast, co-digestion of spent yeast with hops, and the economic feasibility of AD and CO2 recovery systems at craft breweries. Bench-scale experiments showed that the AD of yeast alone requires dilution with lower-strength waste, such as wastewater from cleaning operations, to avoid reactor overload since yeast has an acidic pH and high concentrations of readily bioavailable COD. During co-digestion, a 20% hop dosage resulted in little to no inhibition of methanogenesis, whereas a 40% hop dosage led to significantly lower methane yields. Future studies should consider pilot-scale AD studies with varying hop dosages.
An economic analysis tool was used to evaluate the feasibility of bioenergy and CO2 recovery at craft breweries. The findings indicated that AD and CO2 recovery were economically viable for breweries producing over 50,000 barrels annually. The analysis demonstrated that the AD + RNG option is more financially viable than the AD + CHP option. Implementation of CO2 recovery significantly reduced payback periods for AD plants. Although co-digestion with 20% hops waste led to a slight decrease in methane yield, it did not significantly impact the economic feasibility of the AD plant. Future studies should explore the economics of other pathways for resource recovery from craft breweries, including CO2 recovery from biogas and production of compressed natural gas (CNG), liquefied natural gas (LNG), dry ice, and compressed or liquefied CO2. In addition, the Excel tool should be compared with results from real-world breweries at different scales to enhance its usability.

Supplementary Materials

The following supporting information can be downloaded at: https://www.mdpi.com/article/10.3390/fermentation9090831/s1, Table S1. Capital costs for AD plant. Table S2. Comparison of capital costs using the CoEAT model and the actual construction costs from real case studies. Table S3. Annual income and avoided costs for varying production levels. Table S4. Comparison of payback period with 20% hops waste and without hops.

Author Contributions

Conceptualization, S.J.E., Q.Z. and P.K.; methodology, D.R. and Y.Z.; software, Q.Z. and Y.Z.; validation, Y.Z. and D.R.; formal analysis, Y.Z. and D.R.; investigation, Y.Z., D.R. and S.W.; resources, S.J.E., P.K. and Q.Z.; data curation, Y.Z. and D.R.; writing—original draft preparation, Y.Z. and D.R.; writing—review and editing, S.J.E., Q.Z., P.K. and S.W.; visualization, Y.Z. and D.R.; supervision, S.J.E., Q.Z. and P.K.; project administration, S.J.E.; funding acquisition, S.J.E., Q.Z. and P.K. All authors have read and agreed to the published version of the manuscript.

Funding

This research is based upon work supported by the University of South Florida Interdisciplinary Research Grant program and by the US National Science Foundation under Grant No. 1930451. Dhanashree Rawalgaonkar was partially supported by the USF Trailblazers Scholarship program.

Institutional Review Board Statement

Not applicable.

Informed Consent Statement

Not applicable.

Data Availability Statement

The data presented in this study are available on request from the corresponding author (Sarina J. Ergas: sergas@usf.edu).

Acknowledgments

The authors would like to thank the breweries who collaborated with us on this research, including Motorworks Brewery (Bradenton, FL, USA), Calusa Brewery (Sarasota, FL, USA), and Cigar City Brewery (Tampa, FL, USA). Many thanks to Xia Yang for her mentorship and guidance throughout the project. We would also like to thank Yaritza Vargas and Dahlia Martinez for their help with preliminary experiments.

Conflicts of Interest

The authors declare no conflict of interest.

References

  1. Brewers Association. Craft Brewery Definition. Available online: https://www.brewersassociation.org/statistics-and-data/craft-brewer-definition/ (accessed on 31 July 2023).
  2. Brewers Association. State Craft Beer Sales & Production Statistics. Available online: https://www.brewersassociation.org/statistics-and-data/state-craft-beer-stats/ (accessed on 31 July 2023).
  3. Swart, L.J.; Bedzo, O.K.K.; van Rensburg, E.; Görgens, J.F. Pilot-Scale Xylooligosaccharide Production through Steam Explosion of Screw Press–Dried Brewers’ Spent Grains. Biomass Convers. Biorefin. 2020, 12, 1295–1309. [Google Scholar] [CrossRef]
  4. Karlović, A.; Jurić, A.; Ćorić, N.; Habschied, K.; Krstanović, V.; Mastanjević, K. By-Products in the Malting and Brewing Industries—Re-Usage Possibilities. Fermentation 2020, 6, 82. [Google Scholar] [CrossRef]
  5. Kerby, C.; Vriesekoop, F. An Overview of the Utilisation of Brewery By-Products as Generated by British Craft Breweries. Beverages 2017, 3, 24. [Google Scholar] [CrossRef]
  6. Walker, M.; Kruger, P.; Mercer, J.; Webster, T.; Swersey, C.; Skypeck, C. Wastewater Management Guidance Manual; Brewers Association: Boulder, CO, USA, 2015; Available online: https://www.brewersassociation.org/educational-publications/wastewater-management-guidance-manual/ (accessed on 31 July 2023).
  7. Brewers Association. Brewers Association Energy Usage, GHG Reduction, Efficiency and Load Management Manual; Brewers Association: Boulder, CO, USA, 2014; Available online: https://www.brewersassociation.org/educational-publications/energy-sustainability-manual/ (accessed on 31 July 2023).
  8. Olajire, A.A. The Brewing Industry and Environmental Challenges. J. Clean. Prod. 2012, 256, 102817. [Google Scholar] [CrossRef]
  9. Baiano, A. Craft Beer: An Overview. Comp. Rev. Food Sci. Food Saf. 2020, 20, 1829–1856. [Google Scholar] [CrossRef] [PubMed]
  10. Mainardis, M.; Buttazzoni, M.; Gievers, F.; Vance, C.; Magnolo, F.; Murphy, F.; Goi, D. Life Cycle Assessment of Sewage Sludge Pretreatment for Biogas Production: From Laboratory Tests to Full-Scale Applicability. J. Clean. Prod. 2021, 322, 129056. [Google Scholar] [CrossRef]
  11. Reid, N.; Gatrell, J. Brewing Growth Regional Craft Breweries and Emerging Economic Development Opportunities. Econ. Dev. J. 2015, 14, 5–12. [Google Scholar]
  12. Steenackers, B.; De Cooman, L.; De Vos, D. Chemical Transformations of Characteristic Hop Secondary Metabolites in Relation to Beer Properties and the Brewing Process: A Review. Food Chem. 2015, 172, 742–756. [Google Scholar] [CrossRef]
  13. Preedy, V.R.; Watson, R.R. The Mediterranean Diet: An Evidence-Based Approach; Academic Press: Cambridge, MA, USA, 2020. [Google Scholar]
  14. Bryant, R.W.; Burns, E.E.R.; Feidler-Cree, C.; Carlton, D.; Flythe, M.D.; Martin, L.J. Spent Craft Brewer’s Yeast Reduces Production of Methane and Ammonia by Bovine Rumen Microbes. Front. Animal Sci. 2021, 2, 720646. [Google Scholar] [CrossRef]
  15. Bryant, R.W.; Cohen, S.D. Characterization of Hop Acids in Spent Brewer’s Yeast from Craft and Multinational Sources. J. Am. Soc. Brew. Chem. 2015, 73, 159–164. [Google Scholar] [CrossRef]
  16. Blaxland, J.A.; Watkins, A.J.; Baillie, L.W.J. The Ability of Hop Extracts to Reduce the Methane Production of Methanobrevibacter Ruminantium. Archaea 2021, 2021, 5510063. [Google Scholar] [CrossRef] [PubMed]
  17. Flythe, M.D.; Aiken, G.E. Effects of Hops (Humulus lupulus L.) Extract on Volatile Fatty Acid Production by Rumen Bacteria. J. Appl. Microbiol. 2010, 109, 1169–1176. [Google Scholar] [CrossRef] [PubMed]
  18. Pszczolkowski, V.L.; Bryant, R.W.; Harlow, B.E.; Aiken, G.E.; Martin, L.J.; Flythe, M.D. Effects of Spent Craft Brewers’ Yeast on Fermentation and Methane Production by Rumen Microorganisms. Adv. Microbiol. 2016, 6, 716–723. [Google Scholar] [CrossRef]
  19. Sosa-Hernández, O.; Parameswaran, P.; Alemán-Nava, G.S.; Torres, C.I.; Parra-Saldívar, R. Evaluating Biochemical Methane Production from Brewer’s Spent Yeast. J. Ind. Microbiol. Biotechnol. 2016, 43, 1195–1204. [Google Scholar] [CrossRef] [PubMed]
  20. Copco, A. CO2 Recovery from Fermentation in Breweries. Available online: https://www.atlascopco.com/en-us/compressors/industry-solutions/brewery-air-compressor/co2-recovery-brewery (accessed on 31 July 2023).
  21. Gribbins, K. The CO2 Shortage: Pros and Cons of Craft Brewery CO2 Recapture. Available online: https://www.craftbrewingbusiness.com/ingredients/the-co2-shortage-brewers-can-produce-carbon-dioxide-onsite-with-a-co2-recapture-unit/ (accessed on 28 April 2023).
  22. United States Environmental Protection Agency (USEPA). User’s Manual: Co-Digestion Economic Analysis Tool. Available online: https://www.epa.gov/sites/default/files/2017-09/documents/co-eat_users_manual_fin_sept_2017.pdf (accessed on 20 May 2022).
  23. Astill, J.; Dara, R.A.; Fraser, E.D.G.; Roberts, B.; Sharif, S. Smart Poultry Management: Smart Sensors, Big Data, and the Internet of Things. Comput. Electron. Agric. 2020, 170, 105291. [Google Scholar] [CrossRef]
  24. Rakowska; Sadowska, A.; Dybkowska, E.; Swiderski, F. Spent Yeast as Natural Source of Functional Food Additives. Rocz. Państwowego Zakładu Hig. 2017, 68, 115–121. [Google Scholar]
  25. Matin, A.; Bashir, B.H. Sodium Toxicity Control by the Use of Magnesium in an Anaerobic Reactor. J. Appl. Sci. Environ. Manag. 2005, 8, 17–21. [Google Scholar] [CrossRef]
  26. Jaeger, A.; Arendt, E.K.; Zannini, E.; Sahin, A.W. Brewer’s Spent Yeast (BSY), an Underutilized Brewing By-Product. Fermentation 2020, 6, 123. [Google Scholar] [CrossRef]
  27. Ahnert, M.; Schalk, T.; Brückner, H.; Effenberger, J.; Kuehn, V.; Krebs, P. Organic Matter Parameters in WWTP—A Critical Review and Recommendations for Application in Activated Sludge Modelling. Water Sci. Technol. 2021, 84, 2093–2112. [Google Scholar] [CrossRef]
  28. Holliger, C.; Astals, S.; de Laclos, H.F.; Hafner, S.D.; Koch, K.; Weinrich, S. Towards a Standardization of Biomethane Potential Tests: A Commentary. Water Sci. Technol. 2020, 83, 247–250. [Google Scholar] [CrossRef]
  29. Rawalgaonkar, D. Anaerobic Digestion of Brewery Waste Including Spent Yeast and Hops. Master’s Thesis, Department of Civil & Environmental Engineering, University of South Florida, Tampa, FL, USA, 2023. [Google Scholar]
  30. American Public Health Association; American Water Works Association; Water Environment Federation. Standard Methods for Examination of Water and Wastewater 2012; Rice, E.W., Baird, R.B., Eaton, A.D., Clesceri, L.S., Eds.; American Public Health Assn: Washington, DC, USA, 2012. [Google Scholar]
  31. Etuwe, C.N.; Momoh, Y.O.L.; Iyagba, E.T. Development of Mathematical Models and Application of the Modified Gompertz Model for Designing Batch Biogas Reactors. Waste Biomass Valorization 2016, 7, 543–550. [Google Scholar] [CrossRef]
  32. Singh, A.K.; Kaushal, R.K. Design of small scale anaerobic digester for application in Indian village: A review. Int. J. Eng. Appl. Sci. 2016, 3, 257612. [Google Scholar]
  33. Sheffler, K. Anaerobic Digestion and Biogas Production Feasibility Study. Master’s Thesis, University of Idaho, Moscow, ID, USA, 23 April 2018. [Google Scholar]
  34. Huttunen, S.; Manninen, K.; Leskinen, P. Combining Biogas LCA Reviews with Stakeholder Interviews to Analyse Life Cycle Impacts at a Practical Level. J. Clean. Prod. 2014, 80, 5–16. [Google Scholar] [CrossRef]
  35. Titu, A.M.; Simonffy, A. Contributions Regarding the Reduction of Production Costs for Brewing by Recovering and Reusing the Carbon Dioxide. Procedia Econ. Financ. 2014, 16, 141–148. [Google Scholar] [CrossRef]
  36. Christiansen, R. Barrels of Biogas. Available online: https://biomassmagazine.com/articles/2540/barrels-of-biogas/#:~:text=Blossman%20says%20the%20anaerobic%20digester (accessed on 22 May 2022).
  37. Crubaugh, L. Brewery’s Anaerobic Digester System Reduces Loading to Municipal Wastewater. Available online: https://www.tpomag.com/online_exclusives/2013/02/brewerys_anaerobic_digester_system_reduces_loading_to_municipal_wastewater (accessed on 2 November 2022).
  38. Tucker, M. Digester in Magic Hat’s Sustainability Mix—BioCycle. Available online: https://www.biocycle.net/digester-in-magic-hats-sustainability-mix/ (accessed on 15 October 2022).
  39. Nagelkirk, J. Bell’s Brewery Gives Tour Highlighting Benefits of Advanced Energy, Energy Efficiency. Available online: https://mieibc.org/bells-brewery-gives-tour-highlighting-benefits-of-advanced-energy-energy-efficiency/ (accessed on 28 October 2022).
  40. Gerardi, M.H. The Microbiology of Anaerobic Digesters; John Wiley: Hoboken, NJ, USA, 2003. [Google Scholar]
  41. Speece, R.E. Anaerobic Biotechnology for Industrial Wastewaters; ACS Press: Nashville, TN, USA, 1996. [Google Scholar]
  42. Zupančič, G.D.; Škrjanec, I.; Marinšek Logar, R. Anaerobic Co-Digestion of Excess Brewery Yeast in a Granular Biomass Reactor to Enhance the Production of Biomethane. Bioresour. Technol. 2012, 124, 328–337. [Google Scholar] [CrossRef]
  43. Zupančič, G.D.; Panjičko, M.; Zelić, B. Biogas Production from Brewer’s Yeast Using an Anaerobic Sequencing Batch Reactor. Food Technol. Biotechnol. 2017, 55, 187–196. [Google Scholar] [CrossRef] [PubMed]
  44. Neira, K.; Jeison, D. Anaerobic Co-Digestion of Surplus Yeast and Wastewater to Increase Energy Recovery in Breweries. Water Sci. Technol. 2010, 61, 1129–1135. [Google Scholar] [CrossRef]
  45. Connaughton, S.; Collins, G.; O’Flaherty, V. Psychrophilic and Mesophilic Anaerobic Digestion of Brewery Effluent: A Comparative Study. Water Res. 2006, 40, 2503–2510. [Google Scholar] [CrossRef]
  46. Verive, J. Recapturing CO2: It’s a Gas. Brewing Industry Guide. Available online: https://brewingindustryguide.com/recapturing-co2-its-a-gas (accessed on 12 February 2022).
Figure 1. Decision support tool diagram with inputs, analysis, and outputs.
Fermentation 09 00831 g001
Figure 2. Cumulative methane volumes and Modified Gompertz model fit for Phase I (error bars show standard deviations between duplicate BMPs).
Fermentation 09 00831 g002
Figure 3. Cumulative methane volumes and Modified Gompertz model fit for Phase II (error bars show standard deviations between duplicate BMPs).
Fermentation 09 00831 g003
Figure 4. Methane yield for ASBR study. Y = yeast only, YH = yeast + hops.
Fermentation 09 00831 g004
Figure 5. Capital cost for different options and annual production levels. Data from EPA CoEAT model (additional details are provided in Table S2).
Fermentation 09 00831 g005
Figure 6. Relative percentage of total capital cost for different annual production levels (a) 50,000, (b) 500,000, (c) 1 million, (d) 2 million, (e) 4 million, and (f) 6 million barrels.
Fermentation 09 00831 g006
Figure 7. Payback period in terms of different annual production without hops.
Fermentation 09 00831 g007
Table 1. Average characteristics of spent yeast, hops, and inoculum used in this study.
YeastHopsInoculum
pH4.54.6 *8
Alkalinity (mg/L)NA45 *5900
VSS (mg/L)46,497 21,000
COD (mg/L)231,2801 **38,215
* Hop alkalinity and pH were measured on stock solutions prepared with 1 g dry hops in 15 mL DI. ** Units of mg COD/mg hops.
Table 2. Summary of conditions for BMP phases.
BMP Phase 1BMP Phase 2
S/I (mg COD/mg VSS) *2.51.7
Substrates usedSpent yeast, HopsSpent Yeast, Hops
Hop Dosages (g-hopCOD/g-totalCOD)0, 20%, 40%0, 20%, 40%
Alkalinity Addition (mg/L as CaCO3)10001500
* mg of COD in substrate/mg VSS in inoculum.
Table 3. Summary of methane data obtained from BMPs and Gompertz analysis.
BMP Phase IBMP Phase II
Yeast20% Hops40% HopsYeast20% Hops40% Hops
Methane yield (mL CH4/mg COD)NA *0.100.0760.170.150.11
Cumulative methane (mL)4.0269216338309227
Lag period (days)NA *99171111
Rmax (mL CH4/day)NA *181027288
COD degradation (%)585137534436
* Yield, lag period, and Rmax values for yeast are not reported during Phase I due to souring.
Table 4. Summary of chemical analysis from BMPs during Phase I (standard deviations shown in parentheses).
Yeast20% Hops40% Hops
Day 0Day 42Day 58Day 0Day 42Day 58Day 0Day 42Day 58
VFA (mg/L)216(8)7500(181)3423(1)236(8)287(145)134(11)264(7)584(367)170(1)
Alkalinity ** (mg/L)2167(28)1659(141)NA *2017(104)4100(141)4275(35)2200(343)3275(388)3850(40)
Ammonium (mg/L)236(15)720(80)624(17)217(2)633(12)654(8)252(21)549(12)570(42)
VSS7722(308)5495(321)5760(56)7713(245)5390(181)6036(90)8762(439)7221(240)6939(196)
* Value not reported due to the yeast-only assay souring during Phase I, ** as CaCO3.
Table 5. Summary of chemical analysis from BMPs during Phase II (standard deviations shown in parentheses).
Yeast20% Hops40% Hops
Day 0Day 38Day 60Day 0Day 38Day 60Day 0Day 38Day 60
VFA (mg/L)138(3)254(23)90(9)194(4)118(2.8)120(56)229(7)589(148)177(4.20)
Alkalinity * (mg/L)2725(35)3775(35)4075(35)2650(70)3850(70)4175(35)3050(280)3500(70)3875(176)
Ammonium (mg/L)114(4)461(1)516(8)114(8)432(16)498(8)114(4)384(6)462(8)
VSS (mg/L)6880(170)5430(183)5265(487)7590(70)5812(34)5297(349)7500(340)3534(190)6971(72)
* as CaCO3.
Table 6. Mean values for ASBR performance (standard deviations shown in parentheses).
Digester YDigester YH
Biogas volume (mL/d)538 (44)466 (36)
Biogas methane content (%)76 (3.3)73 (5.4)
Methane volume (mL/d)330 (35)256 (47)
COD degradation (%)96 (2.1)93 (1.5)
Alkalinity (mg/L) *1918 (94)1878 (157)
Ammonium (mg/L)438 (6)470 (7)
Note: Biogas and methane volumes adjusted to STP. Data averaged over the final HRT. * as CaCO3.
Disclaimer/Publisher’s Note: The statements, opinions and data contained in all publications are solely those of the individual author(s) and contributor(s) and not of MDPI and/or the editor(s). MDPI and/or the editor(s) disclaim responsibility for any injury to people or property resulting from any ideas, methods, instructions or products referred to in the content.

