
Kinetics of Formation of Butyric and Pyroglutamic Acid during the Shelf Life of Probiotic, Prebiotic and Synbiotic Yoghurt
 , ,
, ,  , ,
, ,
Abstract
:1. Introduction
2. Materials and Methods
2.1. Yogurt Production
2.2. Fatty Acid Determination
2.3. Free Butyric Acid Determination
2.4. Pyroglutamic and Lactic Acid Determination
2.5. Statistical Analysis
3. Results and Discussion
3.1. pH Determination
3.2. Lactic Acid Content
3.3. Fatty Acid Profile
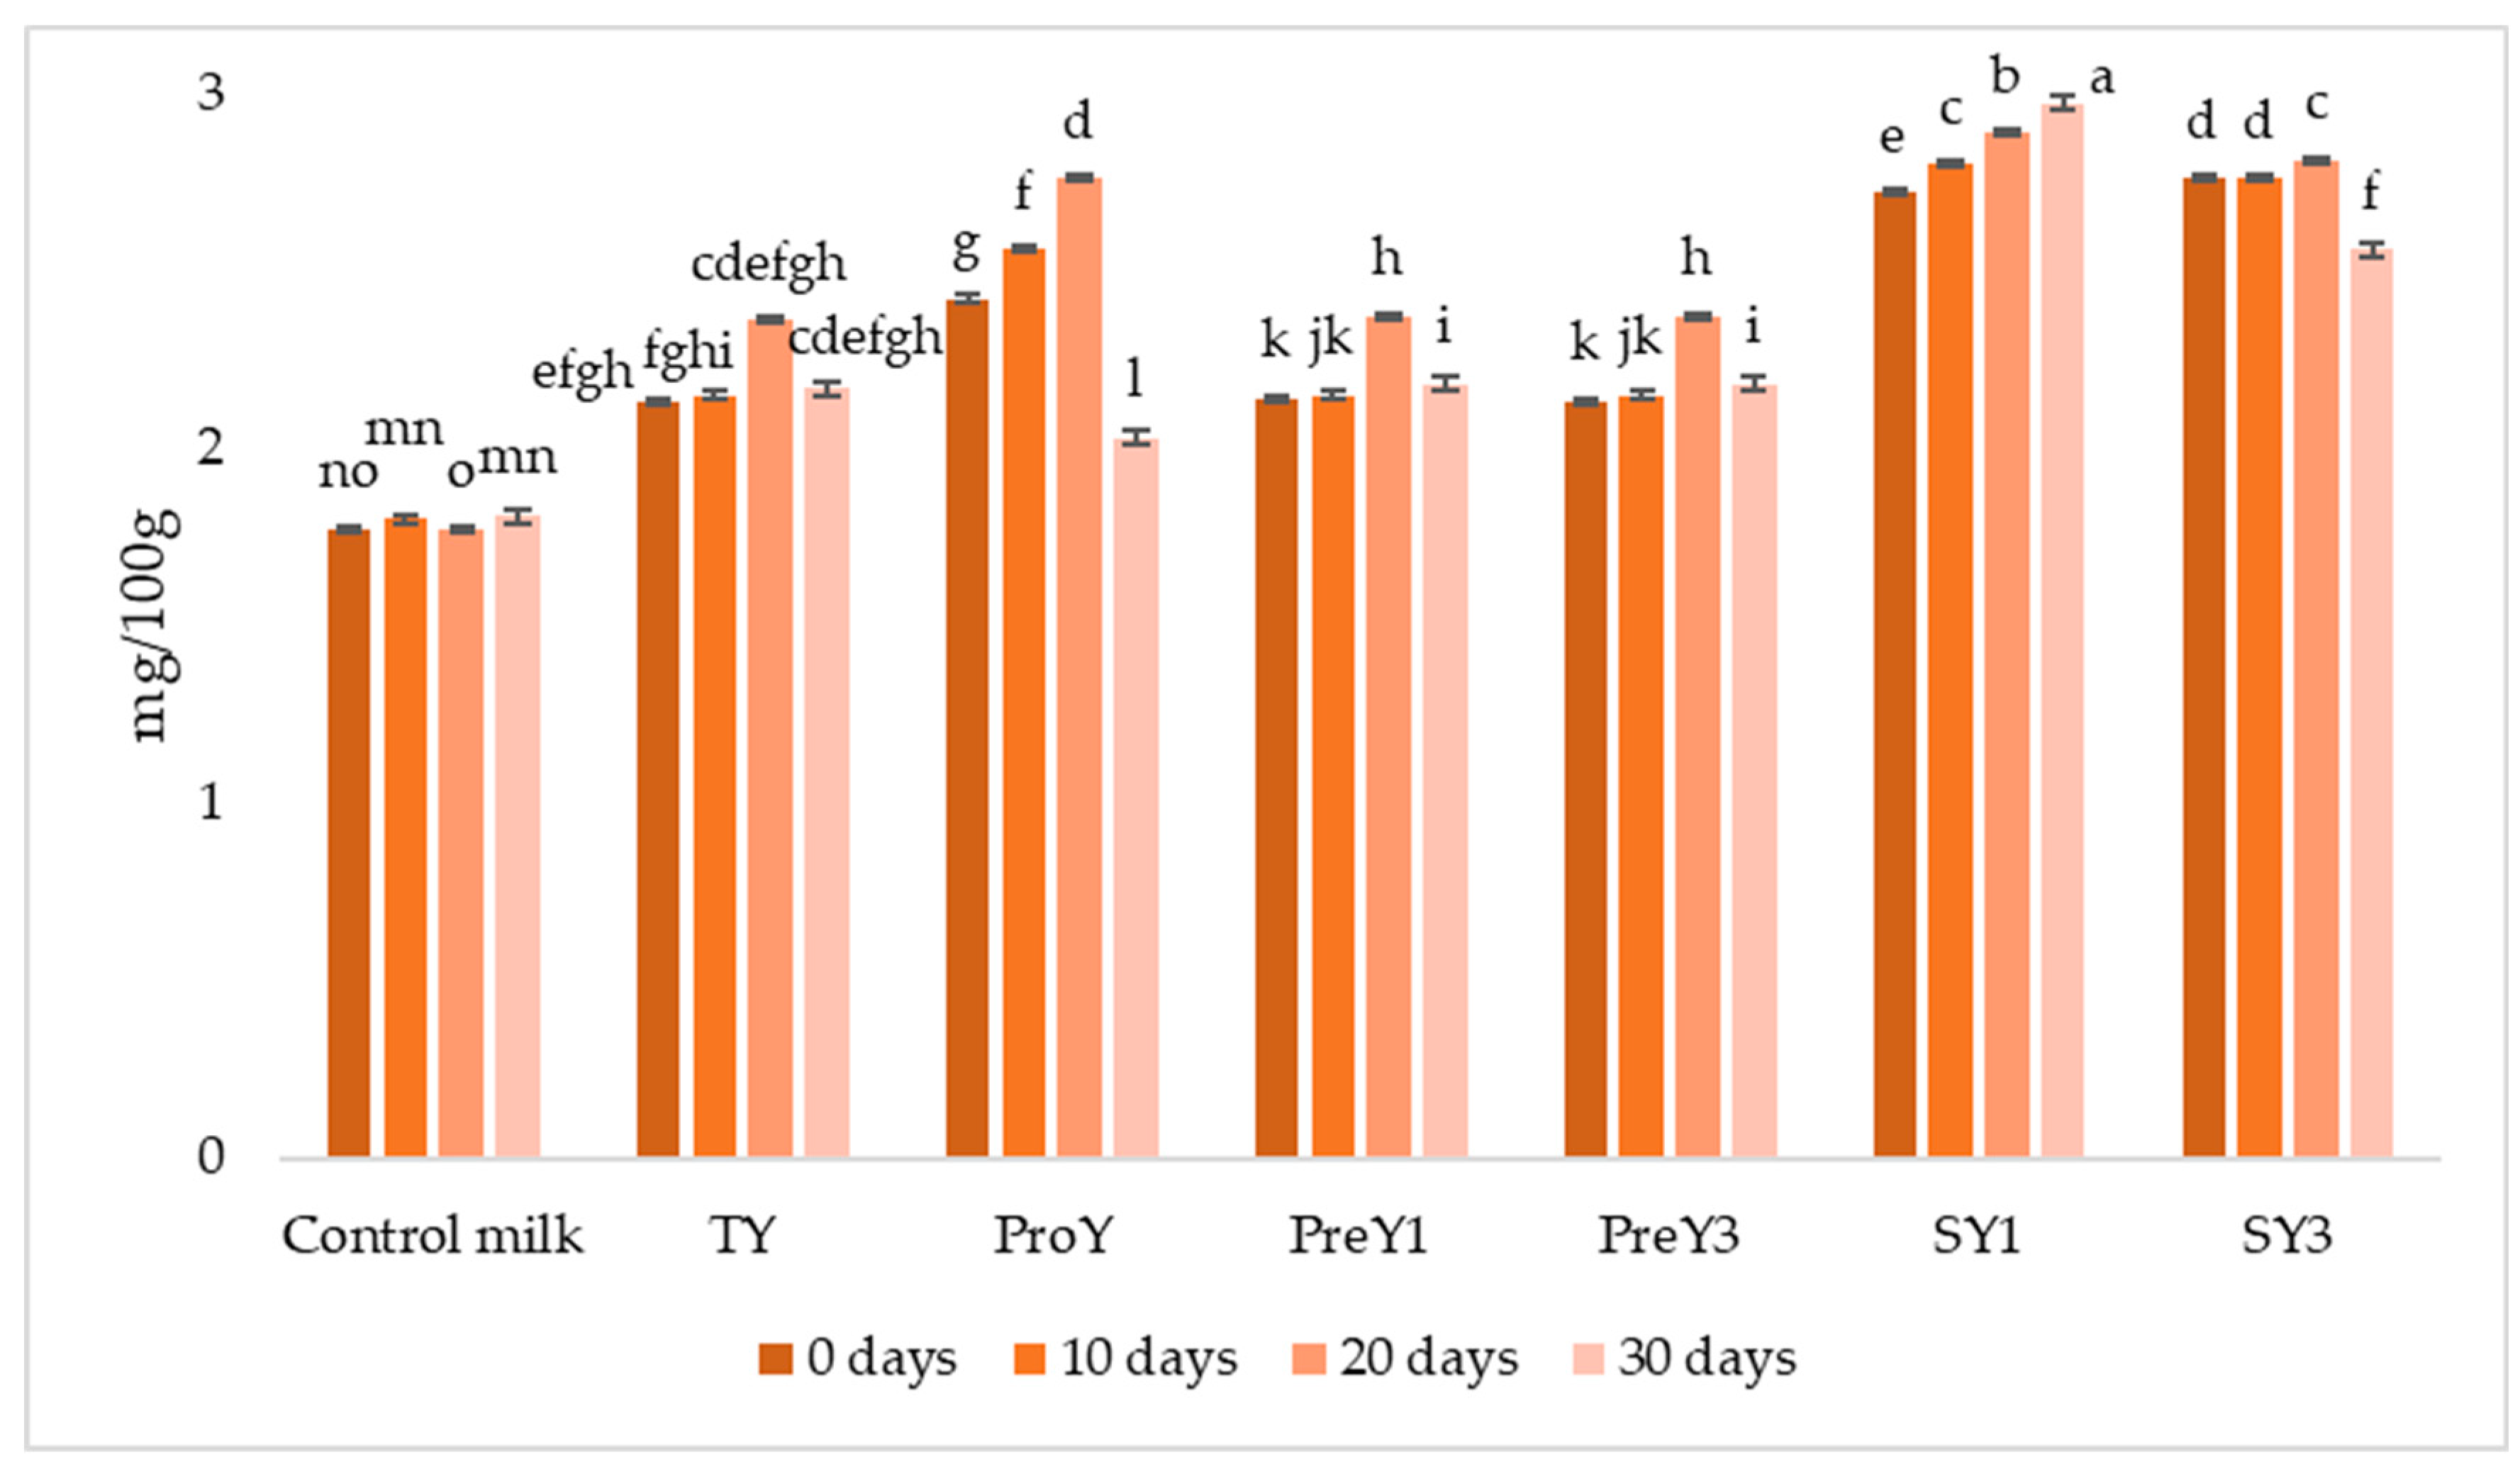
3.4. Butyric Acid Content
3.5. Pyroglutamic Acid Content
4. Conclusions
Author Contributions
Funding
Institutional Review Board Statement
Informed Consent Statement
Data Availability Statement
Conflicts of Interest
References
- Galanakis, C.M. Functionality of Food Components and Emerging Technologies. Foods 2021, 10, 128. [Google Scholar] [CrossRef]
- Puhakka, R.; Valve, R.; Sinkkonen, A. Older Consumers’ Perceptions of Functional Foods and Non-edible Health-enhancing Innovations. Int. J. Consum. Stud. 2018, 42, 111–119. [Google Scholar] [CrossRef]
- Di Renzo, L.; Gualtieri, P.; Pivari, F.; Soldati, L.; Attinà, A.; Cinelli, G.; Leggeri, C.; Caparello, G.; Barrea, L.; Scerbo, F.; et al. Eating Habits and Lifestyle Changes during COVID-19 Lockdown: An Italian Survey. J. Transl. Med. 2020, 18, 229. [Google Scholar] [CrossRef]
- Hasegawa, Y.; Bolling, B.W. Yogurt Consumption for Improving Immune Health. Curr. Opin. Food Sci. 2023, 51, 101017. [Google Scholar] [CrossRef]
- Gomes, A.M.P.; Malcata, F.X. Bifidobacterium spp. and Lactobacillus acidophilus: Biological, Biochemical, Technological and Therapeutical Properties Relevant for Use as Probiotics. Trends Food Sci. Technol. 1999, 10, 139–157. [Google Scholar] [CrossRef]
- Masoumi, S.J.; Mehrabani, D.; Saberifiroozi, M.; Fattahi, M.R.; Moradi, F.; Najafi, M. The Effect of Yogurt Fortified with Lactobacillus acidophilus and Bifidobacterium sp. Probiotic in Patients with Lactose Intolerance. Food Sci. Nutr. 2021, 9, 1704–1711. [Google Scholar] [CrossRef] [PubMed]
- Tamime, A.Y.; Robinson, R.K. Yoghurt: Science and Technology; Woodhead Publishing: Sawston, UK, 1999. [Google Scholar]
- Kailasapathy, K.; Chin, J. Survival and Therapeutic Potential of Probiotic Organisms with Reference to Lactobacillus acidophilus and Bifidobacterium spp. Immunol. Cell Biol. 2000, 78, 80–88. [Google Scholar] [CrossRef]
- Mättö, J.; Fondén, R.; Tolvanen, T.; von Wright, A.; Vilpponen-Salmela, T.; Satokari, R.; Saarela, M. Intestinal survival and persistence of probiotic Lactobacillus and Bifidobacterium strains administered in triple-strain yoghurt. Int. Dairy J. 2006, 16, 1174–1180. [Google Scholar] [CrossRef]
- Martinović, A.; Cocuzzi, R.; Arioli, S.; Mora, D. Streptococcus thermophilus: To survive, or not to survive the gastrointestinal tract, that is the question! Nutrients 2020, 12, 2175. [Google Scholar] [CrossRef]
- Mater, D.D.; Bretigny, L.; Firmesse, O.; Flores, M.J.; Mogenet, A.; Bresson, J.L.; Corthier, G. Streptococcus thermophilus and Lactobacillus delbrueckii subsp. bulgaricus survive gastrointestinal transit of healthy volunteers consuming yogurt. FEMS Microbiol. Lett. 2005, 250, 185–187. [Google Scholar] [CrossRef] [PubMed]
- Esmaeilnejad Moghadam, B.; Keivaninahr, F.; Fouladi, M.; Rezaei Mokarram, R.; Nazemi, A. Inulin Addition to Yoghurt: Prebiotic Activity, Health Effects and Sensory Properties. Int. J. Dairy Technol. 2019, 72, 183–198. [Google Scholar] [CrossRef]
- Gustaw, W.; Kordowska-Wiater, M.; Koziol, J. The Influence of Selected Prebiotics on Growth of Lactic Acid Bacteria for Bio-Yoghurt Production. Acta Sci. Pol. Technol. Aliment. 2011, 10, 455–466. [Google Scholar] [PubMed]
- Vasej, N.; Mojgani, N.; Amirinia, C.; Iranmanesh, M. Comparison of Butyric Acid Concentration in Ordinary and Probiotic Yogurt Samples in Iran. Iran. J. Microbiol. 2012, 4, 87–93. [Google Scholar]
- Aiello, A.; Pepe, E.; De Luca, L.; Pizzolongo, F.; Romano, R. Preliminary Study on Kinetics of Pyroglutamic Acid Formation in Fermented Milk. Int. Dairy J. 2022, 126, 105233. [Google Scholar] [CrossRef]
- Sossai, P. Butyric Acid: What Is the Future for This Old Substance? Swiss Med. Wkly. 2012, 142, 2324. [Google Scholar] [CrossRef] [PubMed]
- Guilloteau, P.; Martin, L.; Eeckhaut, V.; Ducatelle, R.; Zabielski, R.; Van Immerseel, F. From the Gut to the Peripheral Tissues: The Multiple Effects of Butyrate. Nutr. Res. Rev. 2010, 23, 366–384. [Google Scholar] [CrossRef]
- Warman, D.J.; Jia, H.; Kato, H. The Potential Roles of Probiotics, Resistant Starch, and Resistant Proteins in Ameliorating Inflammation during Aging (Inflammaging). Nutrients 2022, 14, 747. [Google Scholar] [CrossRef] [PubMed]
- Wang, M.; Wichienchot, S.; He, X.; Fu, X.; Huang, Q.; Zhang, B. In Vitro Colonic Fermentation of Dietary Fibers: Fermentation Rate, Short-Chain Fatty Acid Production and Changes in Microbiota. Trends Food Sci. Technol. 2019, 88, 1–9. [Google Scholar] [CrossRef]
- Aiello, A.; Pizzolongo, F.; De Luca, L.; Blaiotta, G.; Aponte, M.; Addeo, F.; Romano, R. Production of Butyric Acid by Different Strains of Lactobacillus plantarum (Lactiplantibacillus plantarum). Int. Dairy J. 2023, 140, 105589. [Google Scholar] [CrossRef]
- Coppola, S.; Avagliano, C.; Calignano, A.; Berni Canani, R. The Protective Role of Butyrate against Obesity and Obesity-Related Diseases. Molecules 2021, 26, 682. [Google Scholar] [CrossRef]
- Coppola, S.; Nocerino, R.; Paparo, L.; Bedogni, G.; Calignano, A.; Di Scala, C.; De Giovanni Di Santa Severina, A.F.; De Filippis, F.; Ercolini, D.; Berni Canani, R. Therapeutic Effects of Butyrate on Pediatric Obesity: A Randomized Clinical Trial. JAMA Netw. Open 2022, 5, e2244912. [Google Scholar] [CrossRef] [PubMed]
- Kumar, A.; Bachhawat, A.K. Pyroglutamic Acid: Throwing Light on a Lightly Studied Metabolite. Curr. Sci. 2012, 102, 288–297. [Google Scholar]
- Grioli, S.; Lomeo, C.; Quattropani, M.; Spignoli, G.; Villardita, C. Pyroglutamic Acid Improves the Age Associated Memory Impairment. Fundam. Clin. Pharmacol. 1990, 4, 169–173. [Google Scholar] [CrossRef]
- Murgia, A.; Scano, P.; Cacciabue, R.; Dessì, D.; Caboni, P. GC-MS Metabolomics Comparison of Yoghurts from Sheep’s and Goats’ Milk. Int. Dairy J. 2019, 96, 44–49. [Google Scholar] [CrossRef]
- Pinto, G.; Picariello, G.; Addeo, F.; Chianese, L.; Scaloni, A.; Caira, S. Proteolysis and Process-Induced Modifications in Synbiotic Yogurt Investigated by Peptidomics and Phosphopeptidomics. J. Agric. Food Chem. 2020, 68, 8744–8754. [Google Scholar] [CrossRef] [PubMed]
- Scanlan, R.A.; Sather, L.A.; Day, E.A. Contribution of free fatty acids to the flavor of rancid milk. J. Dairy Sci. 1965, 48, 1582–1584. [Google Scholar] [CrossRef]
- Pfeiffer, P.; König, H. Pyroglutamic acid: A novel compound in wines. In Biology of Microorganisms on Grapes, in Must and in Wine; Springer: Berlin/Heidelberg, Germany, 2009; pp. 233–240. [Google Scholar]
- Ministero dell’Agricoltura e delle Foreste Approvazione Dei Metodi Ufficiali Di Analisi per i Formaggi. Ital. Off. Methods Cheeses Anal. 1986, 8, 15. Available online: https://www.gazzettaufficiale.it/eli/gu/1986/10/02/229/so/88/sg/pdf (accessed on 25 June 2023).
- Manzo, N.; Santini, A.; Pizzolongo, F.; Aiello, A.; Marrazzo, A.; Meca, G.; Durazzo, A.; Lucarini, M. Romano Influence of Ripening on Chemical Characteristics of a Traditional Italian Cheese: Provolone Del Monaco. Sustainability 2019, 11, 2520. [Google Scholar] [CrossRef]
- Bevilacqua, A.E.; Califano, A.N. Determination of Organic Acids in Dairy Products by High Performance Liquid Chromatography. J. Food Sci. 1989, 54, 1076. [Google Scholar] [CrossRef]
- Marconi, O.; Floridi, S.; Montanari, L. Organic Acids Profile in Tomato Juice by HPLC with UV Detection. J. Food Qual. 2007, 30, 253–266. [Google Scholar] [CrossRef]
- Casolari, A. Spallanzani e Pasteur; Lampi di Stampa: Milano, Italy, 2007; ISBN 978-88-488-0595-7. [Google Scholar]
- Al-Kadamany, E.; Khattar, M.; Haddad, T.; Toufeili, I. Estimation of Shelf-Life of Concentrated Yogurt by Monitoring Selected Microbiological and Physicochemical Changes during Storage. LWT Food Sci. Technol. 2003, 36, 407–414. [Google Scholar] [CrossRef]
- Mucchetti, G.; Neviani, E. Microbiologia e Tecnologia Lattiero-Casearia. Qualità e Sicurezza; Tecniche Nuove: Milano, Italy, 2006. [Google Scholar]
- Aryana, K.J.; McGrew, P. Quality Attributes of Yogurt with Lactobacillus Casei and Various Prebiotics. LWT Food Sci. Technol. 2007, 40, 1808–1814. [Google Scholar] [CrossRef]
- Sinaga, H.; Bansal, N.; Bhandari, B. Effects of Milk PH Alteration on Casein Micelle Size and Gelation Properties of Milk. Int. J. Food Prop. 2017, 20, 179–197. [Google Scholar] [CrossRef]
- Corradini, C. Chimica e Tecnologia del Latte; Tecniche Nuove: Milano, Italy, 1995; ISBN 88-481-0005-8. [Google Scholar]
- Kim, H.S.; Gilliland, S.E. Lactobacillus Acidophilus as a Dietary Adjunct for Milk to Aid Lactose Digestion in Humans. J. Dairy Sci. 1983, 66, 959–966. [Google Scholar] [CrossRef]
- Damin, M.R.; Minowa, E.; Alcântara, M.R.; Oliveira, M.N. Effect of Cold Storage on Culture Viability and Some Rheological Properties of Fermented Milk Prepared with Yogurt and Probiotic Bacteria. J. Texture Stud. 2008, 39, 40–55. [Google Scholar] [CrossRef]
- Mani-López, E.; Palou, E.; López-Malo, A. Probiotic Viability and Storage Stability of Yogurts and Fermented Milks Prepared with Several Mixtures of Lactic Acid Bacteria. J. Dairy Sci. 2014, 97, 2578–2590. [Google Scholar] [CrossRef]
- Gueimonde, M.; Delgado, S.; Mayo, B.; Ruas-Madiedo, P.; Margolles, A.; de los Reyes-Gavilán, C.G. Viability and Diversity of Probiotic Lactobacillus and Bifidobacterium Populations Included in Commercial Fermented Milks. Food Res. Int. 2004, 37, 839–850. [Google Scholar] [CrossRef]
- del Prato, O.S. Tecnologie del Latte. Burro, Yogurt, Gelato, Latte Alimentare; Edagricole: Bologna, Italy, 2005. [Google Scholar]
- Fernandez-Garcia, E.; McGregor, J.U. Determination of Organic Acids during the Fermentation and Cold Storage of Yogurt. J. Dairy Sci. 1994, 77, 2934–2939. [Google Scholar] [CrossRef]
- Alm, L. Effect of Fermentation on L(+) and D(−) Lactic Acid in Milk. J. Dairy Sci. 1982, 65, 515–520. [Google Scholar] [CrossRef]
- Hekmat, S.; Reid, G. Sensory Properties of Probiotic Yogurt Is Comparable to Standard Yogurt. Nutr. Res. 2006, 26, 163–166. [Google Scholar] [CrossRef]
- Serafeimidou, A.; Zlatanos, S.; Kritikos, G.; Tourianis, A. Change of Fatty Acid Profile, Including Conjugated Linoleic Acid (CLA) Content, during Refrigerated Storage of Yogurt Made of Cow and Sheep Milk. J. Food Compos. Anal. 2013, 31, 24–30. [Google Scholar] [CrossRef]
- Güler, Z.; Gürsoy-Balcı, A.C. Evaluation of Volatile Compounds and Free Fatty Acids in Set Types Yogurts Made of Ewes’, Goats’ Milk and Their Mixture Using Two Different Commercial Starter Cultures during Refrigerated Storage. Food Chem. 2011, 127, 1065–1071. [Google Scholar] [CrossRef] [PubMed]
- Beshkova, D.; Simova, E.; Frengova, G.; Simov, Z. Production of Flavour Compounds by Yogurt Starter Cultures. J. Ind. Microbiol. Biotechnol. 1998, 20, 180–186. [Google Scholar] [CrossRef]
- Serra, M.; Trujillo, A.J.; Guamis, B.; Ferragut, V. Flavour Profiles and Survival of Starter Cultures of Yoghurt Produced from High-Pressure Homogenized Milk. Int. Dairy J. 2009, 19, 100–106. [Google Scholar] [CrossRef]
- Collins, Y.F.; McSweeney, P.L.H.; Wilkinson, M.G. Lipolysis and Free Fatty Acid Catabolism in Cheese: A Review of Current Knowledge. Int. Dairy J. 2003, 13, 841–866. [Google Scholar] [CrossRef]
- O’Sullivan, A.M.; O’Grady, M.N.; O’Callaghan, Y.C.; Smyth, T.J.; O’Brien, N.M.; Kerry, J.P. Seaweed Extracts as Potential Functional Ingredients in Yogurt. Innov. Food Sci. Emerg. Technol. 2016, 37, 293–299. [Google Scholar] [CrossRef]
- Shantha, N.C.; Ram, L.N.; O’Leary, J.; Hicks, C.L.; Decker, E.A. Conjugated Linoleic Acid Concentrations in Dairy Products as Affected by Processing and Storage. J. Food Sci. 1995, 60, 695–697. [Google Scholar] [CrossRef]
- Paszczyk, B.; Łuczyńska, J.; Polak-Śliwińska, M. The Effect of Storage on the Yogurt Fatty Acid Profile. Mljekarstvo. Com. 2020, 70, 59–70. [Google Scholar] [CrossRef]
- Jiang, L.; Fu, H.; Yang, H.K.; Xu, W.; Wang, J.; Yang, S.-T. Butyric Acid: Applications and Recent Advances in Its Bioproduction. Biotechnol. Adv. 2018, 36, 2101–2117. [Google Scholar] [CrossRef]
- Chang, Y.H.; Jeong, C.H.; Cheng, W.N.; Choi, Y.; Shin, D.M.; Lee, S.; Han, S.G. Quality Characteristics of Yogurts Fermented with Short-Chain Fatty Acid-Producing Probiotics and Their Effects on Mucin Production and Probiotic Adhesion onto Human Colon Epithelial Cells. J. Dairy Sci. 2021, 104, 7415–7425. [Google Scholar] [CrossRef]
- Smit, G.; Smit, B.A.; Engels, W.J.M. Flavour Formation by Lactic Acid Bacteria and Biochemical Flavour Profiling of Cheese Products. FEMS Microbiol. Rev. 2005, 29, 591–610. [Google Scholar] [CrossRef]
- Liu, Y.D.; Goetze, A.M.; Bass, R.B.; Flynn, G.C. N-Terminal Glutamate to Pyroglutamate Conversion in Vivo for Human IgG2 Antibodies. J. Biol. Chem. 2011, 286, 11211–11217. [Google Scholar] [CrossRef]
- Airaudo, C.B.; Gayte-Sorbier, A.; Armand, P. Stability of Glutamine and Pyroglutamic Acid under Model System Conditions: Influence of Physical and Technological Factors. J. Food Sci. 1987, 52, 1750–1752. [Google Scholar] [CrossRef]
- Heller, K.J. Probiotic Bacteria in Fermented Foods: Product Characteristics and Starter Organisms. Am. J. Clin. Nutr. 2001, 73, 374s–379s. [Google Scholar] [CrossRef] [PubMed]
- Playne, M.J. Probiotic Foods. In Proceedings of the Foodpro-93—International Food Processing Machinery and Technology Exhibition and Conference, Sydney, NSW, Australia, 12–14 July 1993; pp. 1–9. [Google Scholar]
- Shah, N.P.; Lankaputhra, W.E.V. Improving Viability of Lactobacillus acidophilus and Bifidobacterium spp. in Yogurt. Int. Dairy J. 1997, 7, 349–356. [Google Scholar] [CrossRef]
- Ng, E.W.; Yeung, M.; Tong, P.S. Effects of Yogurt Starter Cultures on the Survival of Lactobacillus acidophilus. Int. J. Food Microbiol. 2011, 145, 169–175. [Google Scholar] [CrossRef]
- Machuga, E.J.; Ives, D.H. Isolation and Characterization of an Aminopeptidase from Lactobacillus Acidophilus R-26. Biochim. Biophys. Acta BBA Protein Struct. Mol. Enzymol. 1984, 789, 26–36. [Google Scholar] [CrossRef]
- Kailasapathy, K.; Rybka, S.L. Acidophilus and Bifidobacterium spp.—Their Therapeutic Potential and Survival in Yogurt. Aust. J. Dairy Technol. 1997, 52, 28–35. [Google Scholar]
- Mohammad Hossein Marhamatizadeh Effect of Spearmint on the Growth of Lactobacillus acidophilus and Bifidobacterium bifidum in Probiotic Milk and Yoghurt. Afr. J. Food Sci. 2011, 5. [CrossRef]
- Shihata, A.; Shah, N.P. Proteolytic Profiles of Yogurt and Probiotic Bacteria. Int. Dairy J. 2000, 10, 401–408. [Google Scholar] [CrossRef]
- Mucchetti, G.; Locci, F.; Massara, P.; Vitale, R.; Neviani, E. Production of Pyroglutamic Acid by Thermophilic Lactic Acid Bacteria in Hard-Cooked Mini-Cheeses. J. Dairy Sci. 2002, 85, 2489–2496. [Google Scholar] [CrossRef] [PubMed]


| Samples | Composition Specifications | Storage (Days) | pH | Lactic Acid (mg/100 g) |
|---|---|---|---|---|
| Concentrated milk (control milk) | - | 0 | 6.54 ± 0.02 c | nd |
| 10 | 6.60 ± 0.04 c | nd | ||
| 20 | 6.59 ± 0.03 b,c | nd | ||
| 30 | 6.63 ± 0.04 a,b | nd | ||
| Traditional yoghurt used as control (TY) | L. delbrueckii subs. bulgaricus | 0 | 4.32 ± 0.00 d | 878.0 ± 1.90 l |
| S. thermophilus | 10 | 4.29 ± 0.01 d | 890.1 ± 8.98 l | |
| 20 | 4.17 ± 0.02 e | 909.0 ± 2.33 k | ||
| 30 | 4.12 ± 0.01 e,f | 923.5 ± 3.26 j,k | ||
| Probiotic yoghurt (ProY) | L. delbrueckii subs. bulgaricus | 0 | 4.06 ± 0.01 g | 1161.5 ± 4.94 a,b,c |
| S. thermophilus | 10 | 4.05 ± 0.00 g | 1174.0 ± 7.17 a | |
| L. acidophilus | 20 | 4.05 ± 0.01 g | 1172.0 ± 4.14 a | |
| Bifidobacteria spp. | 30 | 4.05 ± 0.01 g | 1176.1 ± 0.24 a | |
| Prebiotic yoghurt (PreY1) | L. delbrueckii subs. bulgaricus | 0 | 4.14 ± 0.01 e,f | 929.2 ± 2.91 i,j |
| S. thermophilus | 10 | 4.13 ± 0.00 e,f | 951.1 ± 7.12 g,h | |
| 1% (50% inulin + 50% FOS) | 20 | 4.15 ± 0.01 e | 942.8 ± 1.34 g,h,i | |
| 30 | 4.14 ± 0.01 e,f | 950.4 ± 1.77 g,h | ||
| Prebiotic yoghurt (PreY3) | L. delbrueckii subs. bulgaricus | 0 | 4.13 ± 0.01 e,f | 927.2 ± 2.85 i,j |
| S. thermophilus | 10 | 4.12 ± 0.00 e,f | 935.3 ± 1.64 h,i,j | |
| 3% (50% inulin + 50% FOS) | 20 | 4.14 ± 0.01 e,f | 940.5 ± 1.93 g,h,i,j | |
| 30 | 4.13 ± 0.01 e,f | 953.8 ± 0.86 g | ||
| Synbiotic yoghurt (SY1) | L. delbrueckii subs. bulgaricus | 0 | 4.15 ± 0.01 e | 1108.3 ± 2.87 f |
| S. thermophilus | 10 | 4.09 ± 0.00 f,g | 1135.5 ± 4.07 d,e | |
| L. acidophilus | 20 | 4.06 ± 0.01 g | 1144.9 ± 6.29 c,d,e | |
| Bifidobacteria spp. 1% (50% inulin + 50% FOS) | 30 | 4.13 ± 0.01 e,f | 1163.1 ± 3.24 a,b | |
| Synbiotic yoghurt (SY3) | L. delbrueckii subs. bulgaricus | 0 | 4.04 ± 0.01 e,f | 1128.0 ± 1.84 e |
| S. thermophilus | 10 | 4.06 ± 0.00 e,f | 1137.0 ± 1.33 d,e | |
| L. acidophilus | 20 | 4.15 ± 0.01 e,f | 1150.0 ± 8.63 b,c,d | |
| Bifidobacteria spp. 3% (50% inulin + 50% FOS) | 30 | 4.04 ± 0.01 e,f | 1172.9 ± 3.26 a |
| Fatty Acids | Control Milk | Control TY | ProY | PreY1 | PreY3 | SY1 | SY3 |
|---|---|---|---|---|---|---|---|
| C4:0 | 2.78 ± 0.014 a | 3.67 ± 0.011 b | 3.18 ± 0.011 b | 3.66 ± 0.09 b | 3.66 ± 0.09 b | 4.13 ± 0.05 a | 3.42 ± 0.06 b |
| C6:0 | 1.84 ± 0.25 a | 2.41 ± 0.06 a | 1.95 ± 0.17 a | 2.42 ± 0.10 a | 2.40 ± 0.07 a | 2.50 ± 0.30 a | 2.24 ± 0.10 a |
| C8:0 | 1.02 ± 0.15 a | 1.29 ± 0.10 a | 1.05 ± 0.14 a | 1.29 ± 0.06 a | 1.28 ± 0.10 a | 1.44 ± 0.07 a | 1.27 ± 0.06 a |
| C10:0 | 2.67 ± 0.09 a | 2.89 ± 0.17 a | 2.61 ± 0.04 a | 3.00 ± 0.17 a | 2.89 ± 0.17 a | 3.18 ± 0.11 a | 2.99 ± 0.03 a |
| C11:0 | 0.32 ± 0.01 b | 0.36 ± 0.02 a | 0.31 ± 0.01 b | 0.35 ± 0.02 a | 0.35 ± 0.02 a | 0.36 ± 0.02 b | 0.35 ± 0.02 a |
| C12:0 | 3.47 ± 0.03 a | 3.49 ± 0.11 a | 3.47 ± 0.13 a | 3.49 ± 0.11 a | 3.49 ± 0.11 a | 3.65 ± 0.21 a | 3.58 ± 0.01 a |
| C13:0 | 0.16 ± 0.00 a | 0.15 ± 0.04 a | 0.15 ± 0.00 a | 0.15 ± 0.04 a | 0.15 ± 0.04 a | 0.15 ± 0.00 a, b | 0.17 ± 0.03 a |
| C14:0 | 11.48 ± 0.02 a | 11.25 ± 0.11 a | 11.50 ± 0.22 a | 11.26 ± 0.02 a | 11.22 ± 0.07 a | 11.60 ± 0.07 a | 11.69 ± 0.08 a |
| C14:1n9 | 1.03 ± 0.01 a | 0.98 ± 0.02 a | 1.01 ± 0.03 a | 1.00 ± 0.05 a | 0.98 ± 0.02 a | 1.01 ± 0.07 a | 1.01 ± 0.00 a |
| C15:0 | 1.23 ± 0.05 a | 1.19 ± 0.08 a | 1.22 ± 0.00 a | 1.14 ± 0.00 b,c | 1.19 ± 0.08 a | 1.24 ± 0.03 a | 1.21 ± 0.01 a |
| C16:0 | 33.20 ± 0.12 a | 31.62 ± 0.04 c | 32.96 ± 0.23 a | 31.63 ± 0.05 c | 31.63 ± 0.05 c | 31.72 ± 0.05 c | 32.82 ± 0.04 a |
| C16:1n7 | 1.97 ± 0.05 a | 1.85 ± 0.06 a | 2.01 ± 0.00 a | 1.89 ± 0.09 a | 1.86 ± 0.05 a | 2.05 ± 0.05 a | 2.13 ± 0.01 a |
| C17:0 | 0.56 ± 0.02 b | 0.55 ± 0.02 a | 0.57 ± 0.03 a | 0.56 ± 0.02 a | 0.56 ± 0.01 a | 0.60 ± 0.04 a | 0.61 ± 0.03 a |
| C17:1n7 | 0.21 ± 0.02 a | 0.20 ± 0.01 a | 0.25 ± 0.02 a | 0.24 ± 0.03 a | 0.20 ± 0.01 a | 0.27 ± 0.03 a | 0.30 ± 0.02 a |
| C18:0 | 11.3 ± 0.18 a | 11.37 ± 0.19 a,b | 11.09 ± 0.06 a | 11.45 ± 0.08 a | 11.39 ± 0.16 a | 10.15 ± 0.25 b | 11.36 ± 0.13 a |
| C18:1n11t | 0.09 ± 0.01 a | 0.09 ± 0.00 a | 0.10 ± 0.02 b | 0.09 ± 0.00 a | 0.09 ± 0.00 a | 0.09 ± 0.00 a | 0.12 ± 0.01 a |
| C18:1n9t | 0.99 ± 0.02 a | 0.93 ± 0.01 a,b | 1.05 ± 0.03 a | 0.94 ± 0.00 a | 0.94 ± 0.00 a | 0.90 ± 0.02 a | 0.87 ± 0.02 a |
| C18:1n9c | 20.74 ± 0.05 a | 20.03 ± 0.19 a | 20.87 ± 0.08 a | 20.06 ± 0.16 a | 20.03 ± 0.18 a | 20.45 ± 0.25 b,c | 20.34 ± 0.11 a |
| C18:2n9t,12t | 0.40 ± 0.03 a | 0.37 ± 0.06 a | 0.35 ± 0.00 a | 0.40 ± 0.02 a | 0.37 ± 0.06 a | 0.34 ± 0.03 a | 0.34 ± 0.02 a |
| C18:2n9t,12c | 0.07 ± 0.01 a | 0.09 ± 0.01 a | 0.06 ± 0.01 a | 0.09 ± 0.01 a | 0.09 ± 0.01 a | 0.07 ± 0.01 a | 0.08 ± 0.01 a |
| C18:2n9c,12t | 0.08 ± 0.01 a | 0.10 ± 0.01 a | 0.08 ± 0.02 a | 0.10 ± 0.01 a | 0.10 ± 0.01 a | 0.10 ± 0.01 b | 0.11 ± 0.01 a |
| C18:2n9c,12c | 2.85 ± 0.11 a | 3.61 ± 0.01 a | 2.77 ± 0.01 a | 3.60 ± 0.02 a | 2.79 ± 0.01 a | 2.39 ± 0.11 a | 2.44 ± 0.00 a |
| C20:0 | 0.18 ± 0.01 a | 0.19 ± 0.00 a | 0.13 ± 0.03 b | 0.19 ± 0.01 a | 0.19 ± 0.02 a | 0.19 ± 0.01 a | 0.19 ± 0.01 a |
| C18:3n3 | 0.43 ± 0.09 a | 0.42 ± 0.09 a | 0.39 ± 0.00 a | 0.42 ± 0.08 a | 0.39 ± 0.02 a | 0.36 ± 0.09 a | 0.36 ± 0.02 a |
| CLA | 0.42 ± 0.02 a | 0.39 ± 0.02 a | 0.43 ± 0.01 a | 0.38 ± 0.02 a | 0.41 ± 0.00 a | 0.45 ± 0.02 a,b | 0.45 ± 0.02 a |
| C22:0 | 0.14 ± 0.00 a | 0.11 ± 0.01 a | 0.11 ± 0.01 a | 0.11 ± 0.00 a | 0.13 ± 0.01 a | 0.14 ± 0.04 a | 0.12 ± 0.00 a |
| C20:3n6 | 0.06 ± 0.01 a | 0.08 ± 0.01 a | 0.08 ± 0.00 a | 0.08 ± 0.01 a | 0.06 ± 0.02 a | 0.11 ± 0.02 a | 0.12 ± 0.01 a |
| C22:1n9 | 0.16 ± 0.03 b | 0.17 ± 0.02 a | 0.16 ± 0.00 b | 0.17 ± 0.02 a | 0.24 ± 0.08 a | 0.20 ± 0.01 a | 0.22 ± 0.02 a |
| C20:3n3 | 0.02 ± 0.00 b | 0.02 ± 0.00 a | 0.01 ± 0.01 a | 0.01 ± 0.01 a | 0.02 ± 0.00 a | 0.02 ± 0.00 b | 0.03 ± 0.00 a,b |
| C22:2n6 | 0.05 ± 0.01 a | 0.07 ± 0.00 a | 0.03 ± 0.03 a | 0.07 ± 0.00 a | 0.06 ± 0.00 a | 0.09 ± 0.00 a,b | 0.01 ± 0.00 a |
| C24:1n9 | 0.06 ± 0.01 a | 0.06 ± 0.00 a,b | 0.05 ± 0.00 b | 0.05 ± 0.01 a | 0.07 ± 0.00 a | 0.08 ± 0.02 a | 0.07 ± 0.00 a |
| Days of Storage | ||||
|---|---|---|---|---|
| Fatty Acids | 0 | 10 | 20 | 30 |
| C11:0 | 0.32 ± 0.01 b | 0.35 ± 0.00 a | 0.37 ± 0.01 a | 0.37 ± 0.00 a |
| C16:1 | 1.97 ± 0.05 a | 1.86 ± 0.03 a,b | 1.77 ± 0.00 b | 1.77 ± 0.01 b |
| C17:0 | 0.56 ± 0.02 b | 0.65 ± 0.00 a | 0.70 ± 0.00 a | 0.71 ± 0.02 a |
| C18:1n9t | 0.99 ± 0.02 a | 0.93 ± 0.00 b | 0.93 ± 0.00 b | 0.93 ± 0.00 b |
| C22:1n9 | 0.16 ± 0.03 b | 0.30 ± 0.00 a | 0.30 ± 0.01 a | 0.28 ± 0.04 a |
| C20:3n3 | 0.02 ± 0.00 b | 0.023 ± 0.00 a,b | 0.024 ± 0.00 a | 0.024 ± 0.00 a,b |
| Days of Storage | ||||
|---|---|---|---|---|
| Fatty Acids | 0 | 10 | 20 | 30 |
| C4:0 | 3.67 ± 0.011 b | 4.14 ± 0.15 a | 3.72 ± 0.02 a,b | 3.36 ± 0.10 b |
| C16:0 | 31.62 ± 0.04 c | 32.66 ± 0.20 a,b | 33.09 ± 0.17 a | 32.30 ± 0.14 b |
| C18:0 | 11.37 ± 0.19 a,b | 10.64 ± 0.08 c | 10.78 ± 0.04 b,c | 11.53 ± 0.21 a |
| C18:1n9t | 0.93 ± 0.01 a,b | 0.85 ± 0.00 b | 0.87 ± 0.01 a,b | 1.00 ± 0.07 a |
| C18:2n9c,12c | 3.61 ± 0.01 a | 2.76 ± 0.15 b | 2.73 ± 0.08 b | 2.76 ± 0.04 b |
| C24:1n9 | 0.06 ± 0.00 a,b | 0.05 ± 0.00 b | 0.07 ± 0.00 a | 0.07 ± 0.00 a |
| Days of Storage | ||||
|---|---|---|---|---|
| Fatty Acids | 0 | 10 | 20 | 30 |
| C4:0 | 3.18 ± 0.011 b | 3.29 ± 0.11 b | 3.67 ± 0.00 a | 3.21 ± 0.01 b |
| C11:0 | 0.31 ± 0.01 b | 0.32 ± 0.01 b | 0.37 ± 0.01 a | 0.34 ± 0.01 a,b |
| C17:1n7 | 0.25 ± 0.02 a | 0.33 ± 0.00 b | 0.20 ± 0.02 b | 0.24 ± 0.02 b |
| C18:0 | 11.09 ± 0.06 a | 11.07 ± 0.08 a | 10.82 ± 0.08 a,b | 10.70 ± 0.12 b |
| C18:1n11t | 0.10 ± 0.02 b | 0.23 ± 0.01 a | 0.09 ± 0.02 b | 0.10 ± 0.01 b |
| C18:1n9t | 1.05 ± 0.03 a | 1.05 ± 0.03 a | 0.86 ± 0.04 b | 1.04 ± 0.01 a |
| C18:2n9c,12c | 2.77 ± 0.01 a | 2.72 ± 0.06 b | 2.77 ± 0.07 b | 2.75 ± 0.02 b |
| C20:0 | 0.13 ± 0.03 b | 0.16 ± 0.00 a,b | 0.17 ± 0.02 a,b | 0.22 ± 0.01 a |
| C22:1n9 | 0.16 ± 0.00 b | 0.16 ± 0.02 b | 0.17 ± 0.01 b | 0.24 ± 0.02 a |
| C24:1n9 | 0.05 ± 0.00 b | 0.06 ± 0.01 a,b | 0.07 ± 0.01 a | 0.06 ± 0.00 a,b |
| Days of Storage | ||||
|---|---|---|---|---|
| Fatty Acids | 0 | 10 | 20 | 30 |
| C4:0 | 3.66 ± 0.09 b | 4.14 ± 0.15 a | 3.73 ± 0.04 a,b | 3.38 ± 0.13 b |
| C15:0 | 1.14 ± 0.00 b,c | 1.12 ± 0.01 a | 1.26 ± 0.00 a | 1.15 ± 0.01 b |
| C16:0 | 31.63 ± 0.05 c | 32.66 ± 0.20 a,b | 33.04 ± 0.10 a | 32.33 ± 0.12 b |
| C18:0 | 11.45 ± 0.08 a | 10.69 ± 0.02 b | 10.82 ± 0.10 b | 11.54 ± 0.19 a |
| C18:n9t,12t | 0.40 ± 0.02 a | 0.35 ± 0.01 b | 0.34 ± 0.03 b | 0.37 ± 0.01 a |
| C18:2n9c,12c | 3.60 ± 0.02 a | 3.60 ± 0.02 a | 2.77 ± 0.14 a | 2.79 ± 0.01 b |
| C24:1n9 | 0.05 ± 0.01 a | 0.06 ± 0.01 a,b | 0.05 ± 0.00 b | 0.07 ± 0.00 a |
| Days of Storage | ||||
|---|---|---|---|---|
| Fatty Acids | 0 | 10 | 20 | 30 |
| C4:0 | 3.66 ± 0.09 b | 4.14 ± 0.15 a | 3.73 ± 0.04 a,b | 3.36 ± 0.12 b |
| C12:0 | 3.49 ± 0.11 a | 3.58 ± 0.26 a | 3.58 ± 0.06 a | 3.55 ± 0.07 b |
| C15:0 | 1.19 ± 0.08 a | 1.12 ± 0.01 c | 1.26 ± 0.00 a | 1.15 ± 0.01 a |
| C16:0 | 31.63 ± 0.05 c | 32.66 ± 0.20 a,b | 33.04 ± 0.10 a | 32.41 ± 0.12 b |
| C18:0 | 11.39 ± 0.16 a | 10.69 ± 0.02 b | 10.82 ± 0.10 b | 11.54 ± 0.19 a |
| C18:2n9t,12t | 0.37 ± 0.06 a | 0.35 ± 0.01 a | 0.34 ± 0.03 a | 0.37 ± 0.01 b |
| C18:2n9c,12c | 2.79 ± 0.01 a | 2.77 ± 0.14 b | 2.73 ± 0.08 b | 2.78 ± 0.01 a |
| Days of Storage | ||||
|---|---|---|---|---|
| Fatty Acids | 0 | 10 | 20 | 30 |
| C4:0 | 4.13 ± 0.05 a | 3.50 ± 0.01 b | 3.68 ± 0.00 a | 3.75 ± 0.06 b |
| C6:0 | 2.50 ± 0.30 a | 2.28 ± 0.01 a | 2.09 ± 0.00 a | 2.37 ± 0.01 a,b |
| C10:0 | 3.18 ± 0.11 a | 2.97 ± 0.01 a | 2.89 ± 0.04 a | 2.75 ± 0.04 b |
| C11:0 | 0.36 ± 0.02 b | 0.34 ± 0.00 a | 0.34 ± 0.00 a | 0.32 ± 0.01 a |
| C13:0 | 0.15 ± 0.00 a,b | 0.19 ± 0.00 a | 0.20 ± 0.00 a | 0.14 ± 0.00 b |
| C14:0 | 11.60 ± 0.07 a | 11.75 ± 0.01 a | 11.78 ± 0.01 a | 11.34 ± 0.01 b |
| C15:0 | 1.24 ± 0.03 a | 1.10 ± 0.01 b | 1.11 ± 0.01 b | 1.24 ± 0.03 a |
| C16:0 | 31.72 ± 0.05 c | 32.79 ± 0.01 a | 32.91 ± 0.01 a | 32.34 ± 0.06 a |
| C16:1n7 | 2.05 ± 0.05 a | 2.08 ± 0.00 b | 2.07 ± 0.00 b | 2.12 ± 0.01 a |
| C17:0 | 0.60 ± 0.04 a | 0.60 ± 0.00 a,b | 0.56 ± 0.00 a,b | 0.66 ± 0.03 a |
| C18:0 | 10.15 ± 0.25 b | 10.25 ± 0.01 a | 10.34 ± 0.00 a | 10.46 ± 0.09 b |
| C18:1n9t | 0.90 ± 0.02 a | 0.89 ± 0.00 a | 0.89 ± 0.00 a | 0.87 ± 0.03 b |
| C18:1n9c | 20.45 ± 0.25 b,c | 20.30 ± 0.01 a | 20.34 ± 0.00 a | 20.79 ± 0.08 a,b |
| C18:2n9c,12t | 0.10 ± 0.01 b | 0.13 ± 0.01 a | 0.12 ± 0.01 a | 0.21 ± 0.03 a |
| CLA | 0.45 ± 0.02 a,b | 0.44 ± 0.00 a | 0.44 ± 0.00 a | 0.45 ± 0.00 a,b |
| C20:3n3 | 0.02 ± 0.00 b | 0.03 ± 0.00 a | 0.03 ± 0.00 a,b | 0.02 ± 0.00 a,b |
| C22:2n6 | 0.09 ± 0.00 a,b | 0.01 ± 0.00 a | 0.02 ± 0.00 a | 0.01 ± 0.00 c |
| Days of Storage | ||||
|---|---|---|---|---|
| Fatty Acids | 0 | 10 | 20 | 30 |
| C4:0 | 3.42 ± 0.06 b | 4.09 ± 0.02 a | 3.50 ± 0.08 c | 3.63 ± 0.12 a |
| C6:0 | 2.24 ± 0.10 a | 2.82 ± 0.14 a | 2.30 ± 0.02 b | 2.12 ± 0.06 a |
| C10:0 | 2.99 ± 0.03 a | 3.22 ± 0.02 a | 2.65 ± 0.03 b | 2.90 ± 0.06 a |
| C12:0 | 3.58 ± 0.01 a | 3.69 ± 0.07 a | 3.44 ± 0.04 a | 3.51 ± 0.03 b |
| C13:0 | 0.17 ± 0.03 a | 0.16 ± 0.01 a | 0.15 ± 0.00 a,b | 0.22 ± 0.03 a |
| C14:0 | 11.69 ± 0.08 a | 11.61 ± 0.07 a | 11.10 ± 0.01 c | 11.81 ± 0.01 a |
| C15:0 | 1.21 ± 0.01 a | 1.19 ± 0.00 a | 1.15 ± 0.01 a | 1.02 ± 0.00 c |
| C16:0 | 32.82 ± 0.04 a | 31.76 ± 0.08 c | 32.07 ± 0.03 b | 32.92 ± 0.10 a |
| C16:1n7 | 2.13 ± 0.01 a | 2.02 ± 0.03 a | 2.07 ± 0.08 a | 2.08 ± 0.01 b |
| C17:0 | 0.61 ± 0.03 a | 0.60 ± 0.00 a | 0.67 ± 0.02 a | 0.53 ± 0.02 b |
| C18:0 | 11.36 ± 0.13 a | 10.19 ± 0.10 b | 11.09 ± 0.12 a | 10.37 ± 0.10 a |
| C18:1n9t | 0.87 ± 0.02 a | 0.82 ± 0.02 b | 0.91 ± 0.05 b | 0.88 ± 0.04 a |
| C18:1n9c | 20.34 ± 0.11 a | 20.13 ± 0.07 c | 21.29 ± 0.03 a | 20.45 ± 0.00 a |
| C18:2n9c,12t | 0.11 ± 0.01 a | 0.12 ± 0.00 b | 0.12 ± 0.00 b | 0.11 ± 0.00 a |
| C20:0 | 0.19 ± 0.01 a | 0.15 ± 0.00 b | 0.17 ± 0.0 a,b | 0.19 ± 0.02 a |
| CLA | 0.45 ± 0.02 a | 0.44 ± 0.00 b | 0.51 ± 0.02 a | 0.43 ± 0.00 a |
| C20:3n3 | 0.03 ± 0.00 a,b | 0.02 ± 0.00 a,b | 0.00 ± 0.00 a | 0.02 ± 0.00 b |
| C22:2n6 | 0.01 ± 0.00 a | 0.10 ± 0.01 a | 0.08 ± 0.00 b | 0.01 ± 0.00 a |
Disclaimer/Publisher’s Note: The statements, opinions and data contained in all publications are solely those of the individual author(s) and contributor(s) and not of MDPI and/or the editor(s). MDPI and/or the editor(s) disclaim responsibility for any injury to people or property resulting from any ideas, methods, instructions or products referred to in the content. |
© 2023 by the authors. Licensee MDPI, Basel, Switzerland. This article is an open access article distributed under the terms and conditions of the Creative Commons Attribution (CC BY) license (https://creativecommons.org/licenses/by/4.0/).
Share and Cite
Aiello, A.; De Luca, L.; Pizzolongo, F.; Pinto, G.; Addeo, F.; Romano, R. Kinetics of Formation of Butyric and Pyroglutamic Acid during the Shelf Life of Probiotic, Prebiotic and Synbiotic Yoghurt. Fermentation 2023, 9, 763. https://doi.org/10.3390/fermentation9080763
Aiello A, De Luca L, Pizzolongo F, Pinto G, Addeo F, Romano R. Kinetics of Formation of Butyric and Pyroglutamic Acid during the Shelf Life of Probiotic, Prebiotic and Synbiotic Yoghurt. Fermentation. 2023; 9(8):763. https://doi.org/10.3390/fermentation9080763
Chicago/Turabian StyleAiello, Alessandra, Lucia De Luca, Fabiana Pizzolongo, Gabriella Pinto, Francesco Addeo, and Raffaele Romano. 2023. "Kinetics of Formation of Butyric and Pyroglutamic Acid during the Shelf Life of Probiotic, Prebiotic and Synbiotic Yoghurt" Fermentation 9, no. 8: 763. https://doi.org/10.3390/fermentation9080763