Article

A Study of Key Aroma Compounds in Hurood Cheese and Their Potential Correlations with Lactic Acid Bacteria

School of Food and Health, Beijing Technology and Business University, No. 11, Fucheng Road, Beijing 100048, China
*
Authors to whom correspondence should be addressed.
Fermentation 2023, 9(7), 670; https://doi.org/10.3390/fermentation9070670
Submission received: 5 June 2023 / Revised: 13 July 2023 / Accepted: 14 July 2023 / Published: 17 July 2023

Abstract

:
Hurood cheese (namely Hurood) is a traditional acid-coagulated cheese in China. This work investigated key aroma compounds and their potential correlations with dominant species of Hurood sampled from three distinct geographical origins. Key aroma compounds were determined according to Gas chromatography–mass spectrometry (GC–MS), gas chromatography–olfactometry (GC–O), and relative odor active values (ROAVs) analyses. In addition, 16S rDNA sequencing was used to identify the dominant species. Furthermore, Pearson correlation analysis was used to determine the potential relationships between key aroma compounds and dominant species. A total of 31 key aroma compounds were identified in the Hurood samples from three regions. Lactobacillus paracasei, Lactobacillus crispatus, and Leuconostoc citreum were found to be significantly correlated with the key aroma compounds (p < 0.05) and were identified as the core species. This study shows the link between the presence of presumptive functional core microbes and the unique aroma profiles of this traditional dairy product.

Graphical Abstract

1. Introduction

Hurood cheese (namely Hurood) is a traditional acid-coagulated cheese with a unique aroma, mainly manufactured and consumed in North China—especially in the Inner Mongolia region [1]. Hurood is usually made with fresh bovine milk. The processing steps of making Hurood are to first naturally ferment and acidify the curd without the heat treatment of fresh milk (Figure 1). Subsequently followed by whey draining, the raw Hurood is pressed in a specialized mold for 24 h, which forms the final product cheese. Hurood is not aged; therefore, it belongs to the fresh cheese family.
Aroma is one of the key indexes that determines the cheese’s overall quality. Aroma compounds in cheese are mainly derived from microbial metabolism [2]. Dicrepancies in fermenting cultures can lead to a deviation in the aroma of the final product [3]. Through the analysis of the relationship between the microbial diversity and the aroma of milk fan samples from six different geographical origins, Chen et al. found that Lactobacillus spp. was greatly associated with short even-chain fatty acids such as butyric acid, caprylic acid, and caproic acid [4,5]. Jiang et al. reported that Lactobacillus spp. displayed a significant correlation with aroma compounds such as benzaldehyde, 2,3-pentanedione, ethanol, and ethyl acetate in traditional yak yogurt [6]. However, only a few efforts have been made to investigate how microorganisms can affect the aroma profiling of Hurood [7]. Functional microbes that contribute to the formation of key aroma compounds of Hurood with different production locations remains unclear.
Lactic acid bacteria (LAB) are widely used starter cultures for the production of fermented dairy products [8]. Traditional Chinese fermented dairy products, such as Hurood, are rich in LAB resources [1,9]. Several studies have explored the microbial diversity of Hurood-grown LAB [1,10]. Lactococcus and Lactobacillus were found to be the main bacterial genera in Hurood samples collected in the Inner Mongolian region [11], while microbial communities of Hurood sampled from the Xinjiang Uygur Autonomous Region (Northwest China) were mainly composed of Lactobacillus, Acetobacter, and Enterobacter [12]. The microbial compositions of Hurood can vary significantly across different regions [13].
This work aims to explore the microbial diversities, key aroma compounds, and potential relationships between dominant species and key aroma compounds of Hurood sampled from three regions of Inner Mongolia, i.e., the Ulanqab League, Bayannur League, and Xilingol League. To do this, 16S rDNA sequencing was used to identify the dominant species in each region. SAFE–GC–MS was used to detect their aroma compounds. Finally, Pearson correlation analysis was adopted to assess the possible links between core microbial species and key aroma compounds.

2. Materials and Methods

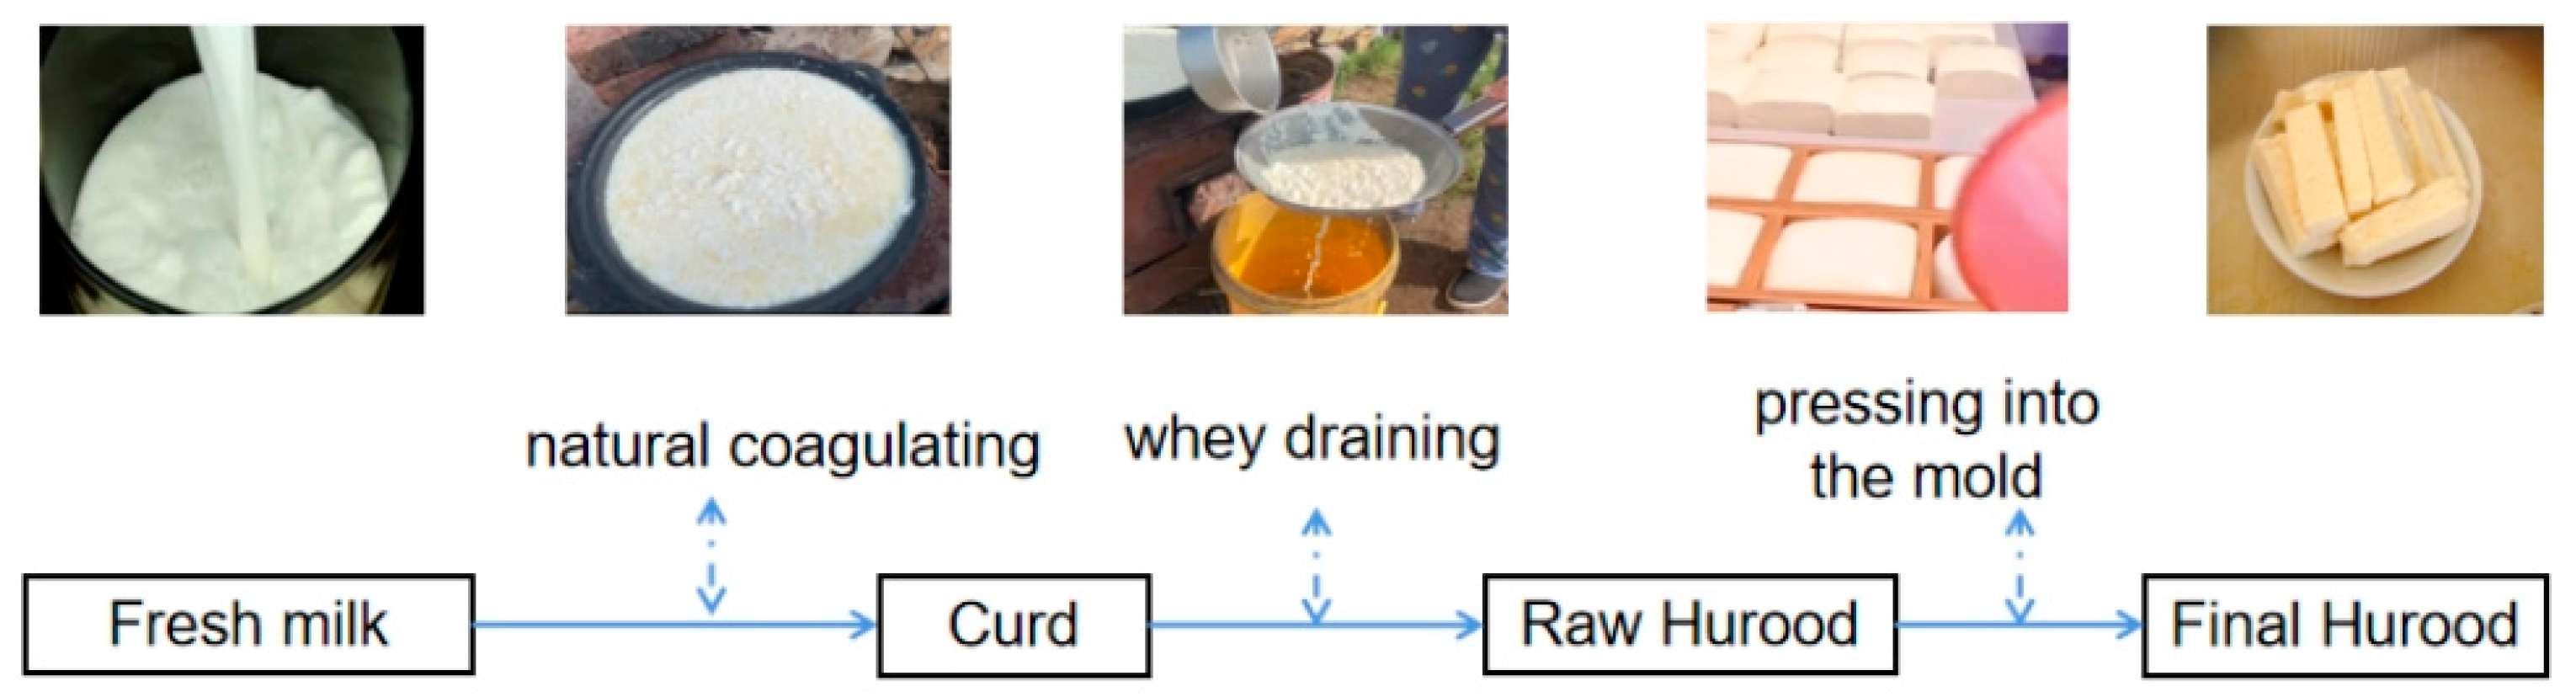
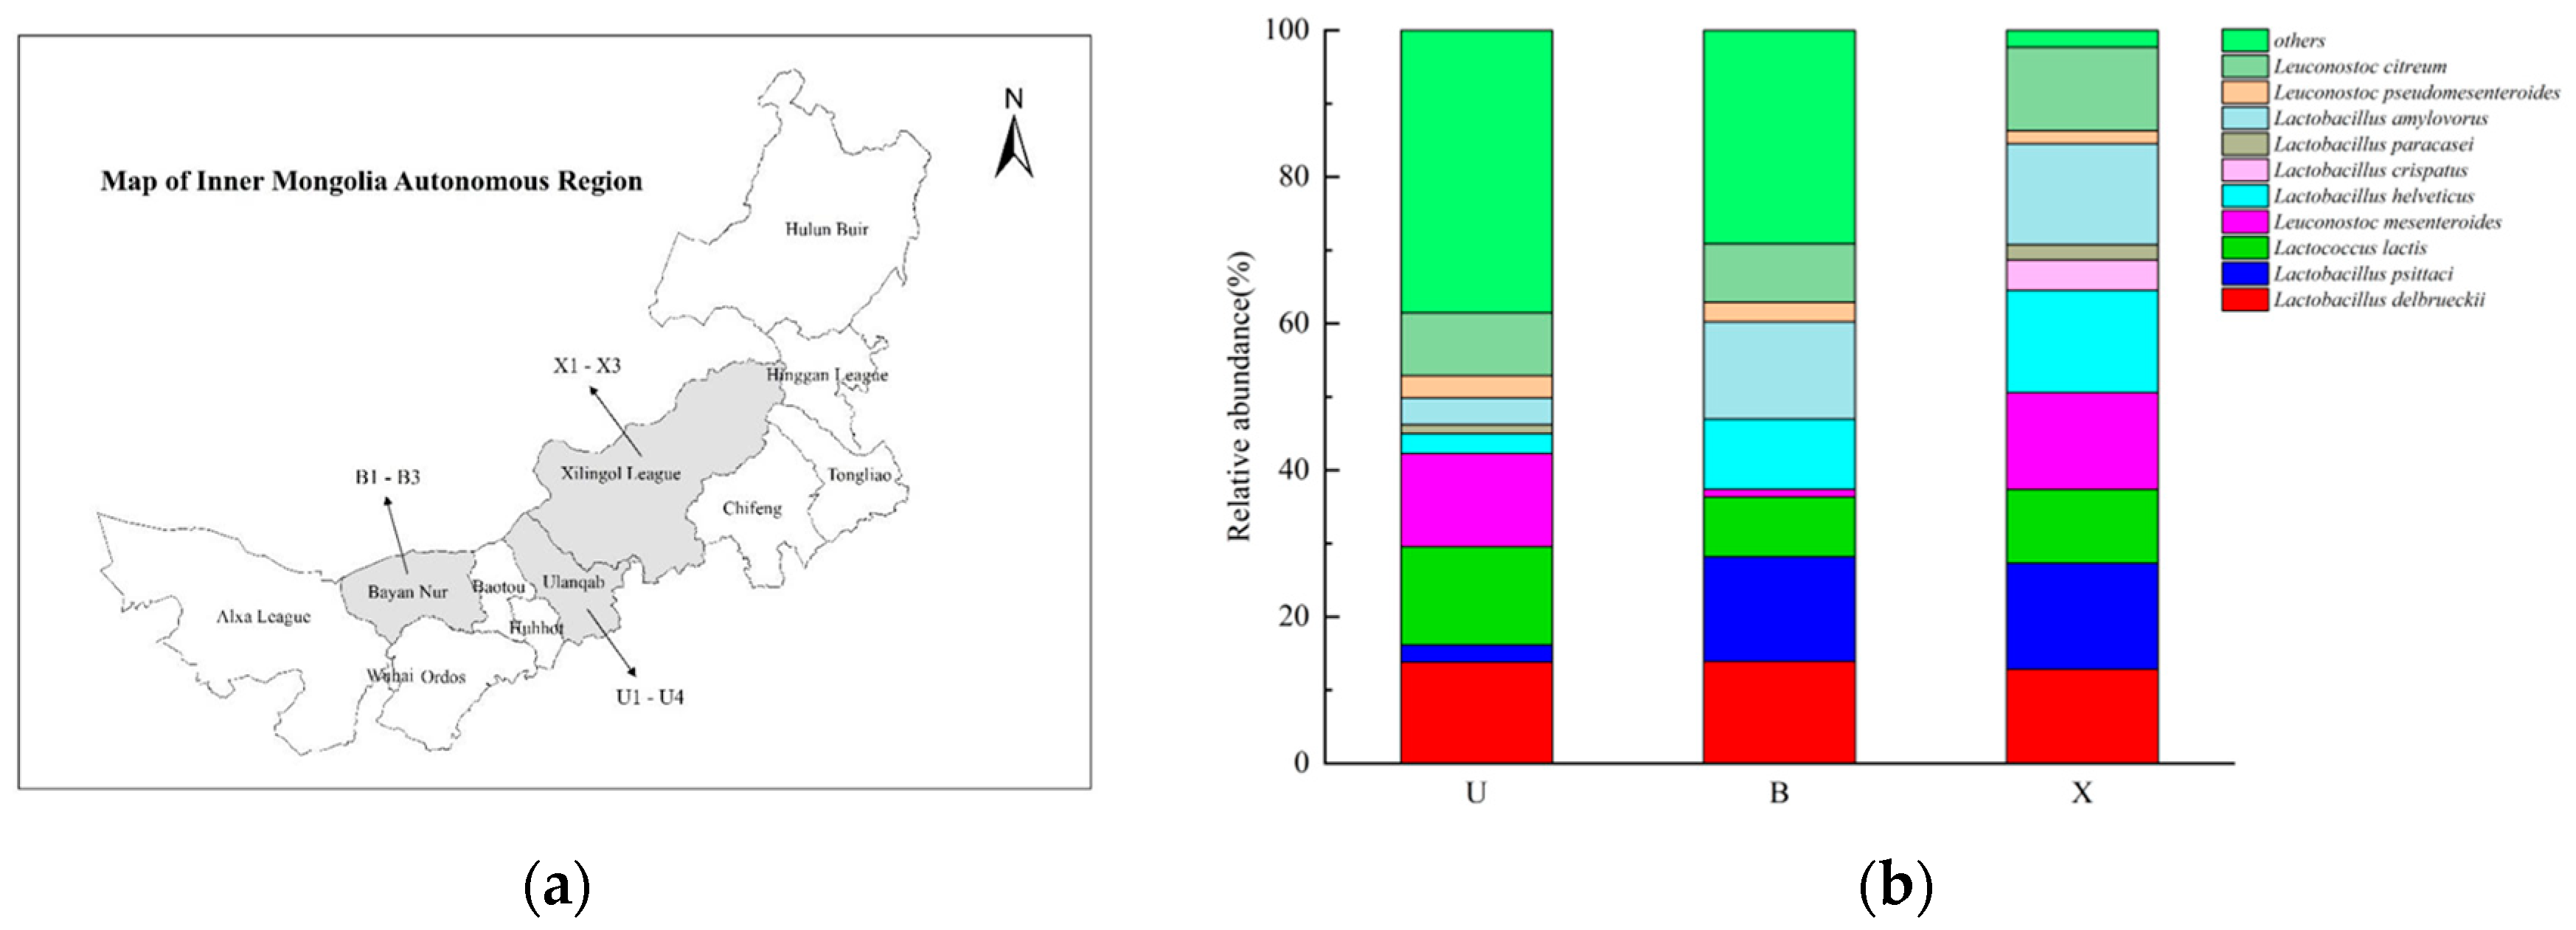
2.1. Sample Collection

Hurood samples (n = 10) were collected from the Bayannur league (sample B1, B2, B3), Ulanqab league (sample U1, U2, U3, U4), and Xilingol league (sample X1, X2, X3) of Inner Mongolia in China—freshly made by local herdsmen, with basically the same production process (Figure 1). Hurood samples were vacuum-packed and transported by plane to the laboratory within 24 h at 4 °C. Hurood samples were cut into cubes (2 × 2 × 2 cm3) and stored at −20 °C and 48% relative humidity.

2.2. Sample Preparation

Hurood samples were prepared according to the method described by Majcher [14], with some modifications. Each Hurood sample was cut into 2 cm3 cubes, frozen in liquid nitrogen, and ground to obtain a homogenized sample. Then, 100 g of ground Hurood was transferred into an Erlenmeyer flask and extracted with diethyl ether (200 mL) at 350 rpm in an incubator shaker at room temperature (24 ± 2 °C) for 7 h. The residual substances were separated by centrifuging at 3000× g for 15 min at 4 °C. To further enrich the aroma compounds, solvent extraction was performed using a solvent-assisted flavor evaporation (SAFE) method.

2.3. Solvent-assisted Flavor Evaporation (SAFE)

Volatile compounds from Hurood solvent extract with a 10 μL internal standard solution containing 2-methyl-3-heptanone (154.3 μg/mL) and 3-methyl-pentanoic acid (1266.8 μg/mL) dissolved in diethyl ether were distilled using SAFE, as described by Majcher [15]. The SAFE apparatus was connected to a receiving tube and a waste tube. The glassware was then connected to an Edwards nxds6i rotary vane pump as the vacuum source. The SAFE apparatus was kept thermostated at 40 °C with a circulating water bath. Liquid nitrogen was poured into the cooling trap and the receiver flasks. Distillation was carried out for 2 h under vacuum (~10−4 Pa). After distillation, the distillate was dried over anhydrous sodium sulphate overnight and then concentrated to 1 mL under a gentle stream of high-purity nitrogen. The concentrated distillate was washed three times with 1 mL 0.5 M sodium bicarbonate and mixed thoroughly. After each wash, the bottom layer—the water phase of the distillate—was removed and collected in a separate test tube.

2.4. Gas Chromatography–Mass Spectrometry (GC–MS) Analysis

GC–MS analysis was carried out using an Agilent 7890/5977 instrument. Samples (1 μL) for MS analysis were injected using a CombiPal autosampler with a 10 μL direct injection syringe attached. Compounds were separated on DB-WAX (30 m × 0.25 mm i.d. × 0.25 μm film, Agilent Technologies, Santa Clara, CA, USA). The GC oven temperature program used was as follows: 35 °C for 3 min, raised at 4 °C/min to 100 °C held for 2 min, then 3 °C/min to 150 °C, and finally raised at 10 °C/min to 230 °C held for 3 min to confirm the cleanness of the column. The GC–MS transfer line temperature was maintained at 250 °C. The mass spectrometer was operated in the electron impact (EI) mode and the source temperature was set at 220 °C. The mass spectrometer operated in full scan mode from 33 to 450 amu. All the analyses were performed using 70 eV.

2.5. Gas Chromatography Olfactometry (GC–O) Analysis

An Agilent 7890B series GC coupled with a sniffing system (ODP 3 Gerstel, Mülheim, Germany) was used to locate odor-active components. The temperatures of the olfactory port and transfer line were kept at 230 °C and 250 °C, respectively. During the GC–O analysis, four experienced panelists recorded the aroma descriptor and the time when the aroma compound occurred. If 2 or more panelists detected the aroma, an odor-active location was identified.

2.6. Qualitative and Quantitative Methods

Identification of the constituents was performed by comparing mass spectra, linear retention indices (RI), and GC–O. Tentative identification was based on comparisons of their mass spectra with those of the known compounds from the standard NIST 14 library and the RI sourced from the NIST Standard Reference Database (the reference column type is DB-WAX). RI was calculated using the C7–C33 n-alkane series under the same chromatographic conditions. The internal standard method was conducted to quantify the compounds.

2.7. Extraction of DNA from Cheese Samples

The genomic DNA of all bacteria present in the cheese samples was extracted using the OMEGA DNA isolation kit (Omega Bio-tek, Inc., Norcross, Georgia, USA), following the manufacturer’s instructions, and triple DNA extraction was performed. The quality of the extracted DNA was checked by 1% agarose gel electrophoresis and spectrophotometry (optical density at 260 nm/280 nm ratio). The final DNA concentration was above 100 ng/μL and a 260 nm/280 nm ratio at 1.8–2.0. All extracted DNA samples were stored at −20 °C for further analysis.

2.8. Microbial Analysis

The V3 domains of the 16S rDNA were amplified by PCR (95 °C for 5 min; followed by 25 cycles of 95 °C for 30 s, 55 °C for 30 s, and 72 °C for 40 s with a final extension of 72 °C for 10 min) using primer pairs 515F (5′-GTGYCAGCMGCCGCGGTAA-3′) and 806R (5′-GGACTACHVGGGTWTCTAAT-3′) with a specific barcode. The purified amplicons were pooled at equimolar concentrations, and further paired-end sequencing was performed using an Illumina MiSeq instrument (Illumina Inc., San Diego, CA, USA)

2.9. Statistical Analysis

All statistical analyses were carried out with three biological replicates. The principal component analysis and Pearson correlation of the aroma compounds were analyzed using OriginPro 2021 64-bit (OriginPro Lab Corp., Northampton, MA, USA) and IBM SPSS Statistics 23.

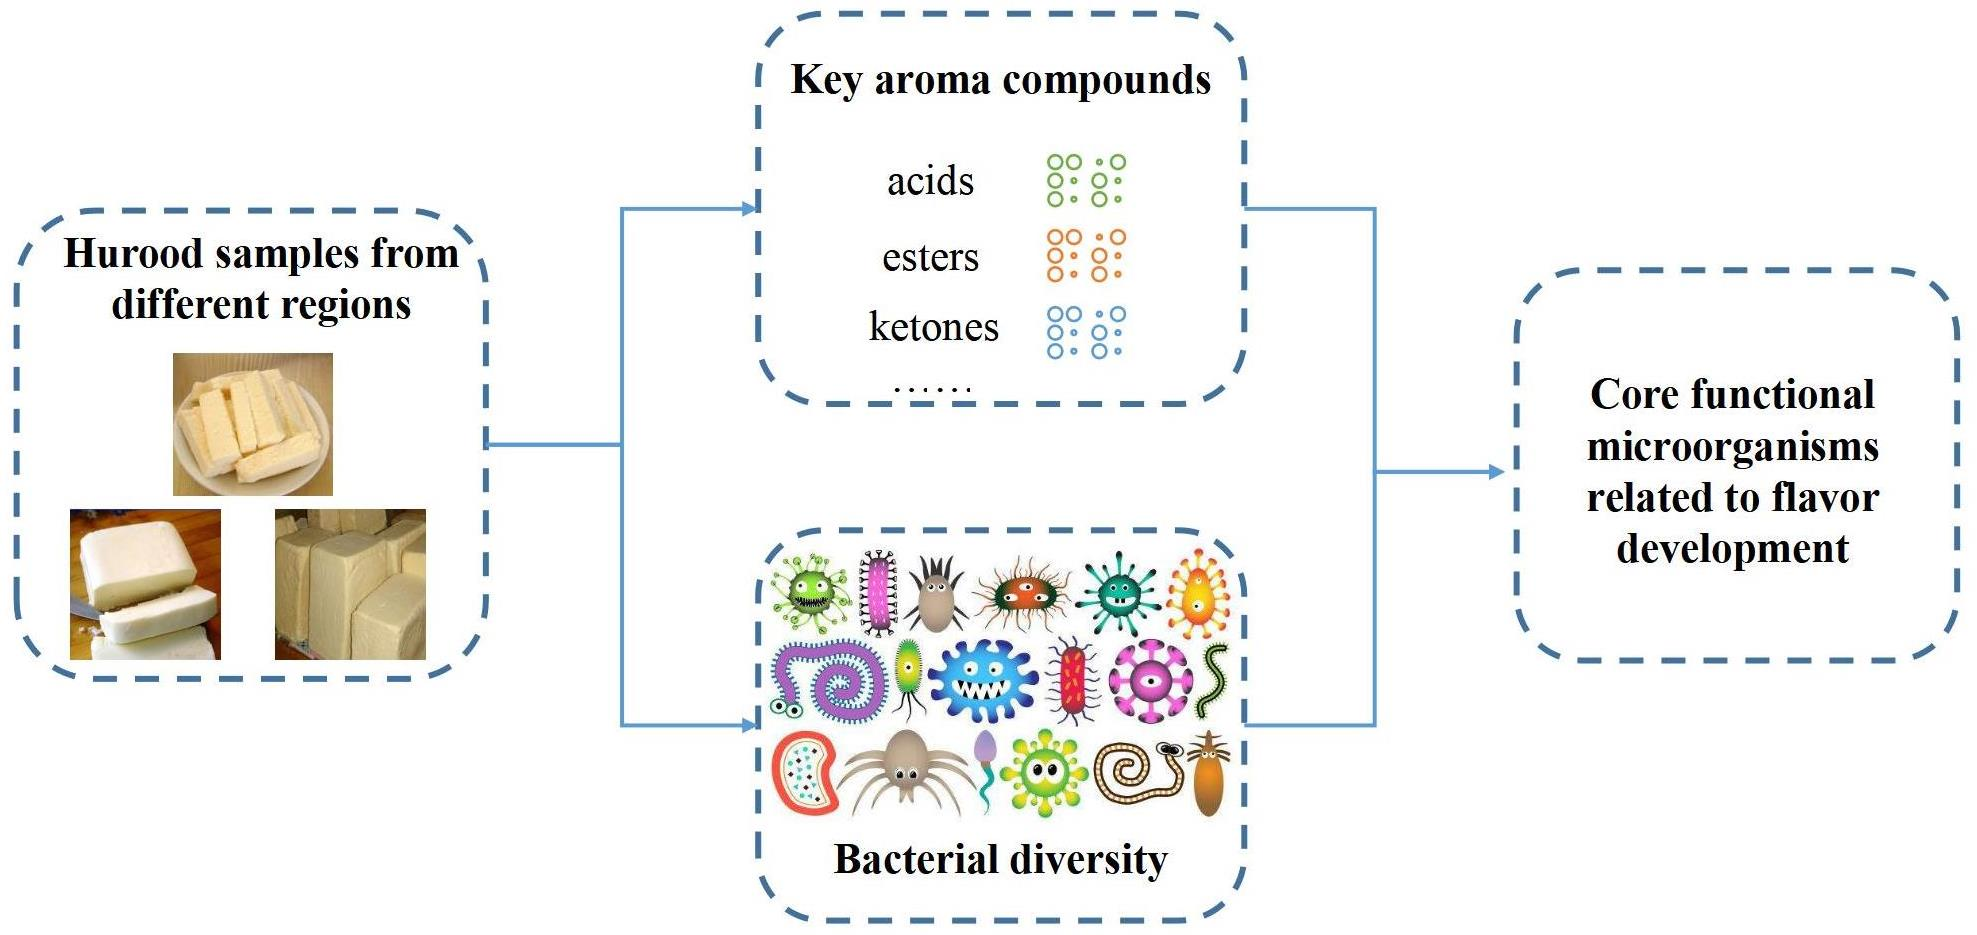
3. Results and Discussion

3.1. Quantitation of Odor-Active Compounds and Associated ROAVs

The olfactory intensity of an aroma compound is related to both the compound concentration and odor threshold. The relative odor activity value (ROAV) [16] is the most commonly used quantification index of olfactory intensity. When the ROAV of an aroma compound is bigger than one, this compound will likely be the key contributor to the overall aroma [17,18]. In addition, ROAVs are also suitable indicators for the determination of aroma differences in foods [19].
To better study the key aroma contributors in Hurood, the original 75 aroma compounds detected by SAFE–GC–MS were refined by their ROAVs. A total number of 31 compounds with ROAV > 1 were identified as the key aroma compounds, including six carboxylic acids, five ketones, six aldehydes, one aromatic compound, four alcohols, six esters, and three sulfur compounds (Table 1).
Carboxylic acids are important, sometimes predominant, contributors to the overall aroma of cheeses [20,21,22]. They are also the precursors of other aroma substances such as esters, aldehydes, and methyl ketones [23]. Among all the carboxylic acids detected, acetic acid, hexanoic acid, and octanoic acid were the top three ROAVs. These volatile carboxylic acids are typical aroma compounds of cheese [2]. The average ROAVs of these three carboxylic acids showed significant differences between the three regions (p < 0.05). The ROAVs of octanoic acid were the highest (between 8.94 and 43.34) compared to the other acids. The ROAV of hexanoic acid in samples U1–U4 was higher than that of the others. In addition, the ROAV of acetic acid in the samples from the Xilingol League (X1–X3) were all less than one, indicating that acetic acid does not contribute much to the overall aroma of Hurood produced from this region. Besides this, decenoic acid—which has an unpleasant rancid odor—was detected only in samples from the Xilingol League (X1–X3). The means of the ROAVs of the acetic acid, hexanoic acid, and decanoic acid were significantly different between the Hurood samples of the three different regions (p < 0.05). These three acid compounds may be one of the characteristic aroma compounds that distinguish Hurood samples from the three different regions in terms of their aroma characteristics.
Esters, often with a low perception threshold, are another major contributor to cheese’s aroma. They generally have sweet, fruity, and floral notes [23]. Esterification reactions can occur between short- to medium-chain fatty acids and primary and secondary alcohols derived from lactose fermentation and amino acid catabolism [24]. In cheese production, esters are generally produced during the re-maturation process. Matured cheeses, such as cheddar and blue cheeses, usually have high ester concentrations. As Hurood is a fresh cheese with no aging process, the ester content was relatively lower—ranging from 18.89 μg/kg to 1096.89 μg/kg for 10 samples (Table S1). Previous research on the aroma of traditional Chinese dairy products also found that ester contents in the milk fan are minor; only ethyl butyrate, isobutyl butyrate, ethyl octanoate, and ethyl hexanoate were reported to have an ROAV bigger than one [25].
Ketones are another group of important flavor compounds with a unique aroma and low sensory thresholds [26]. Five ketones with an ROAV greater than one were detected in 10 Hurood samples, including 2,3-butanedione, 3-hydroxy-2-butanone, 2-butanone, 2-nonanone, and 2-undecanone. Of these, 2,3-Butanedione (i.e., diacetyl) is one of the most important diketones for dairy products [20,21]—mainly produced by the fermentation of citrate. Diacetyl has a buttery and nutty note and has been identified as the key odorant of Camembert, Cheddar, and Emmental cheese [27,28]. Diacetyl was the only ketone compound with significant differences (p < 0.05) in the ROAV analyses among the Hurood samples from the three different regions. This may indicate that there is little difference in the aroma quality of Hurood samples from different regions in terms of ketone compounds.
Aldehydes can contribute to freshness and floral aromas. Linear aldehydes, such as hexanal, heptanal, octanal, and nonanal, are commonly found in cheeses. Branched-chain aldehydes can originate from the degradation of amino acids via enzymatic processes [29] or non-enzymatic reactions (Strecker degradation). The chemical properties of aldehydes are relatively active; they can easily be reduced into alcohols or be oxidized to their corresponding acids. Such an unstable feature coincides with the observed low content of aldehydes (25.34–2394.56 μg/kg) in the 10 Hurood samples. Nevertheless, the low odor thresholds of aldehydes—such as furfural (threshold = 2.8 μg/kg), benzaldehyde (threshold = 3 μg/kg), and 2-nonenal (threshold = 0.1 μg/kg)—make them still important contributors to the overall aroma.
Other groups of aroma active compounds—e.g., sulfur compounds, alcohols, and aromatic heterocyclic compounds—were also detected. The content of sulfur compounds (0.04–7.1 μg/kg) in the fresh Hurood samples was low. The ROAVs of sulfur compounds in samples B1–B3 were the highest. Dimethyl trisulfide was only detected in sample B2. Pentanol and 2-ethyl-n-hexanol were not detected in samples X1–X3. There was a significant difference in the ROAVs of 2-ethyl-n-hexanol between the Hurood samples from the three different regions (p < 0.05). In summary, the volatility and ROAV values of these compounds were relatively low, and they could not be or were only slightly recognized by the GC–O experiment, which may indicate that their impact on overall aroma characteristics is relatively small.

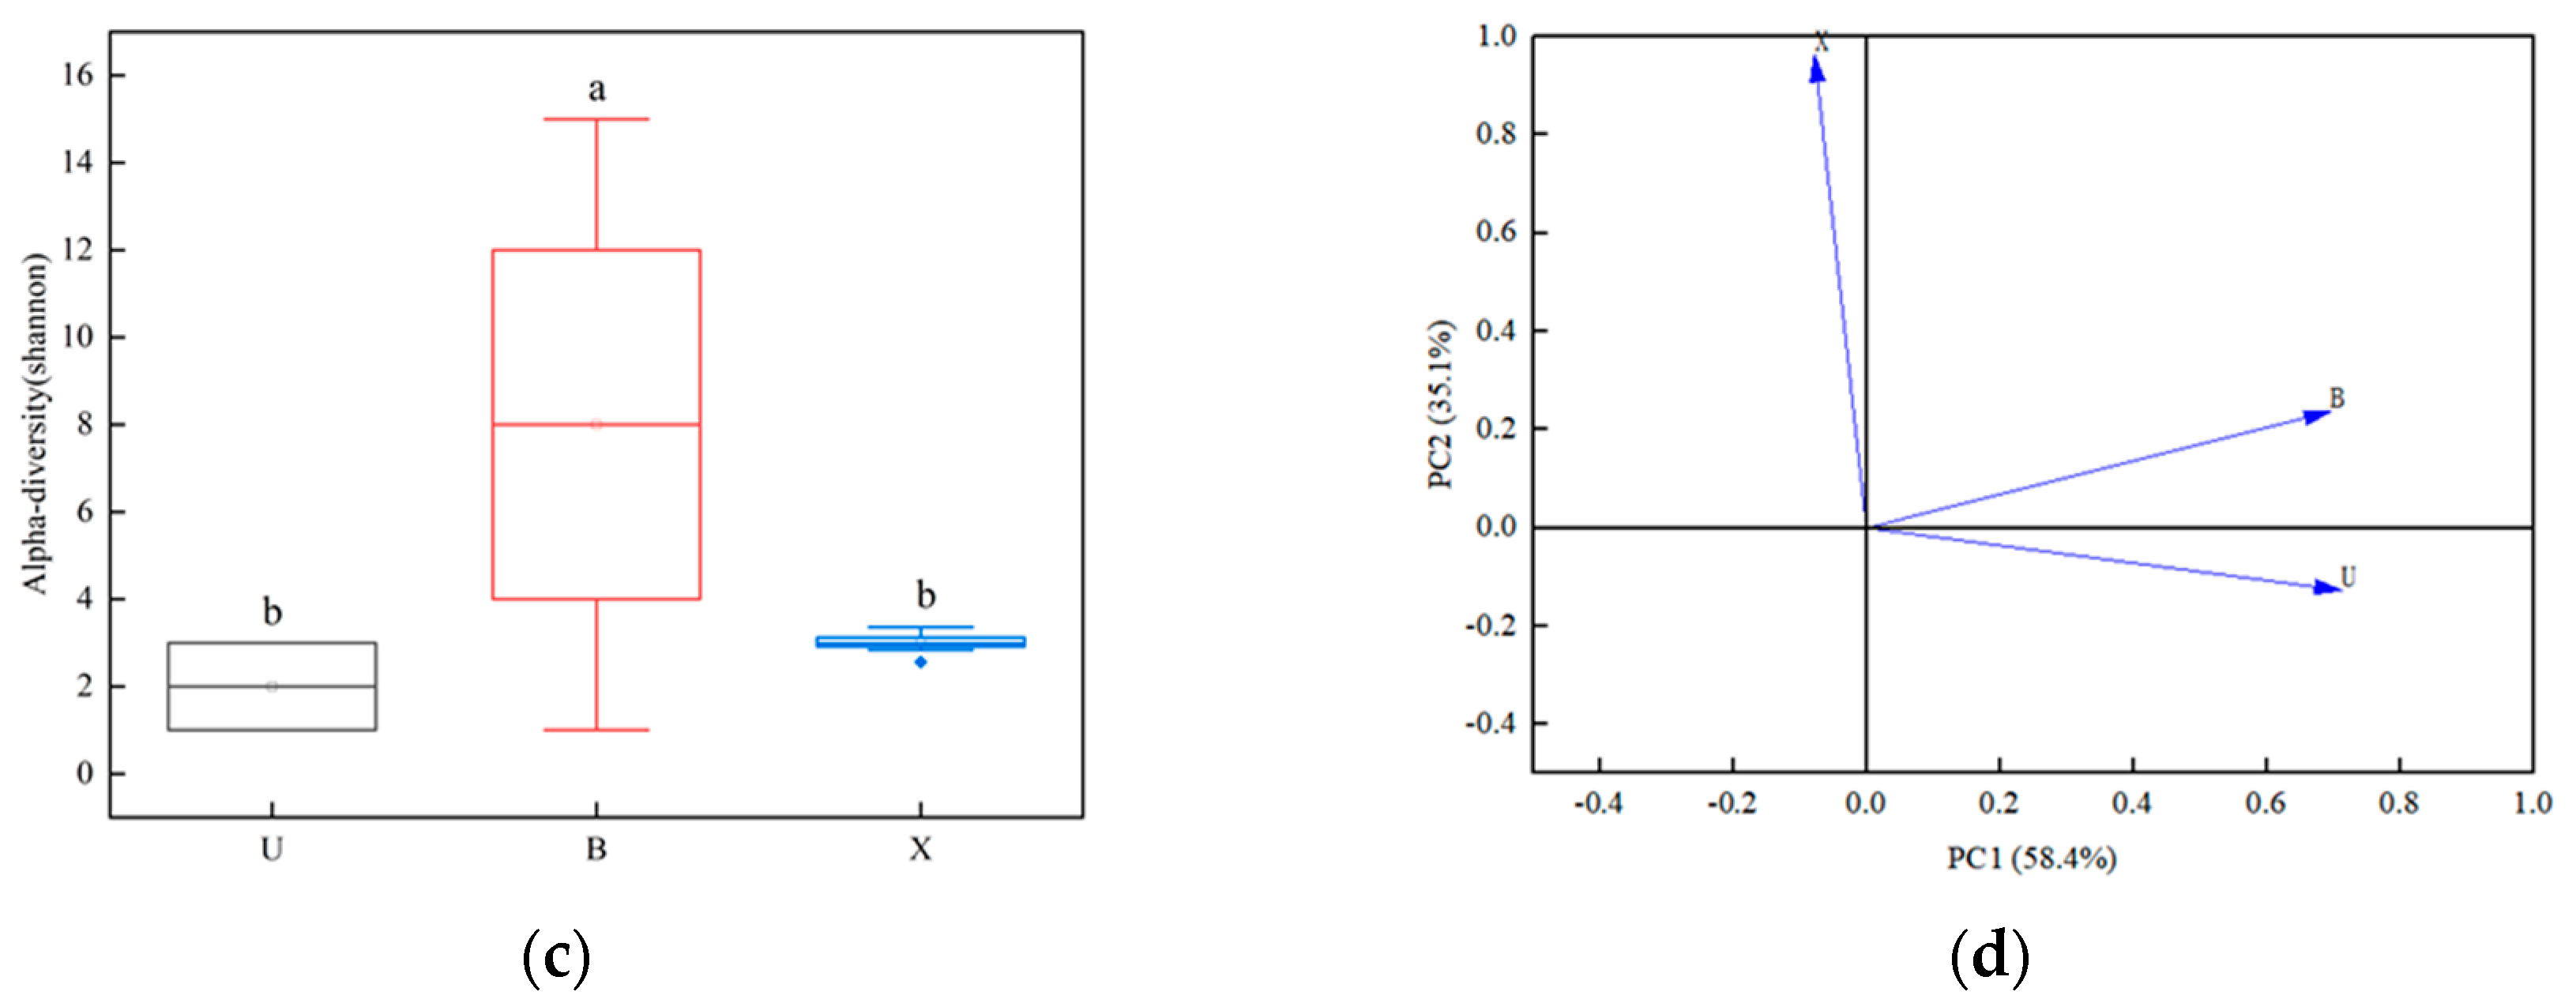
3.2. Analysis of Bacterial Communities

We carried out a microbiological analysis of the samples from the different regions by high-throughput sequencing (16S rDNA), where samples U1–U4 (U), B1–B3 (B), and X1–X3 (X) were collected from the Ulanqab league, Bayannur league, and Xilingol league, respectively (Figure 2a).
A total of 79 species were detected at the level of bacterial community species in the Hurood. As shown in Figure 2b, the top 10 species in the species level were Lactococcus lactis, Lactobacillus delbrueckii, Lactobacillus psittaci, Lactobacillus helveticus, Lactobacillus crispatus, Lactobacillus paracasei, Lactobacillus amylovorus, Leuconostoc mesenteroides, and Leuconostoc pseudomesenteroides. Among them, the dominant species in the samples collected from the Ulanqab league (i.e., U) were Lactobacillus delbrueckii, Lactococcus lactis, and Leuconostoc mesenteroides. The dominant species in the samples collected from the Bayannur league (i.e., B) were Lactobacillus delbrueckii, Lactobacillus amylovorus. Lactobacillus psittaci, and Leuconostoc mesenteroides. The dominant species in the samples collected from the Xilingol league (i.e., X) were Lactobacillus amylovorus, Leuconostoc mesenteroides, Lactobacillus helveticus, Lactobacillus psittaci, and Lactobacillus delbrueckii. Lactobacillus delbrueckii is a dominant bacterium commonly found in three regions. Lactobacillus delbrueckii is an important microorganism for cheese or yogurt production and is widely used as a starter for yogurt and cheese worldwide, playing important roles in acid production and flavor formation in fermented dairy products [30]. In addition, there were certain differences in the dominant bacteria among the three regions, which may be one of the direct reasons for the differences in the flavor of the Hurood samples in the different regions.
The α-diversity index shows the differences in microorganisms within a group, while the β-diversity index can display microbial differences between groups. To further investigate the microbial diversities in the Hurood samples, an analysis of the microbiota α-diversity (indicated by the Shannon index) indices suggests that the microbial diversity of the Bayannur League (B) was higher than that of the samples from the other two regions—suggesting a higher microbial richness and evenness. In addition, based on the weighted uniFrac distance metric, the PCA of the microorganisms’ β-diversity in the Hurood samples from the different regions is presented in Figure 2d; it shows the distribution map for the first two principal components determined by PCA, which describe 48.4% and 35.1% of the accumulative variance contribution rate. A visualization of the data was also obtained; it showed that the microbial diversity of the Xilingol League (X) was significantly different to the other two regions (p < 0.05).

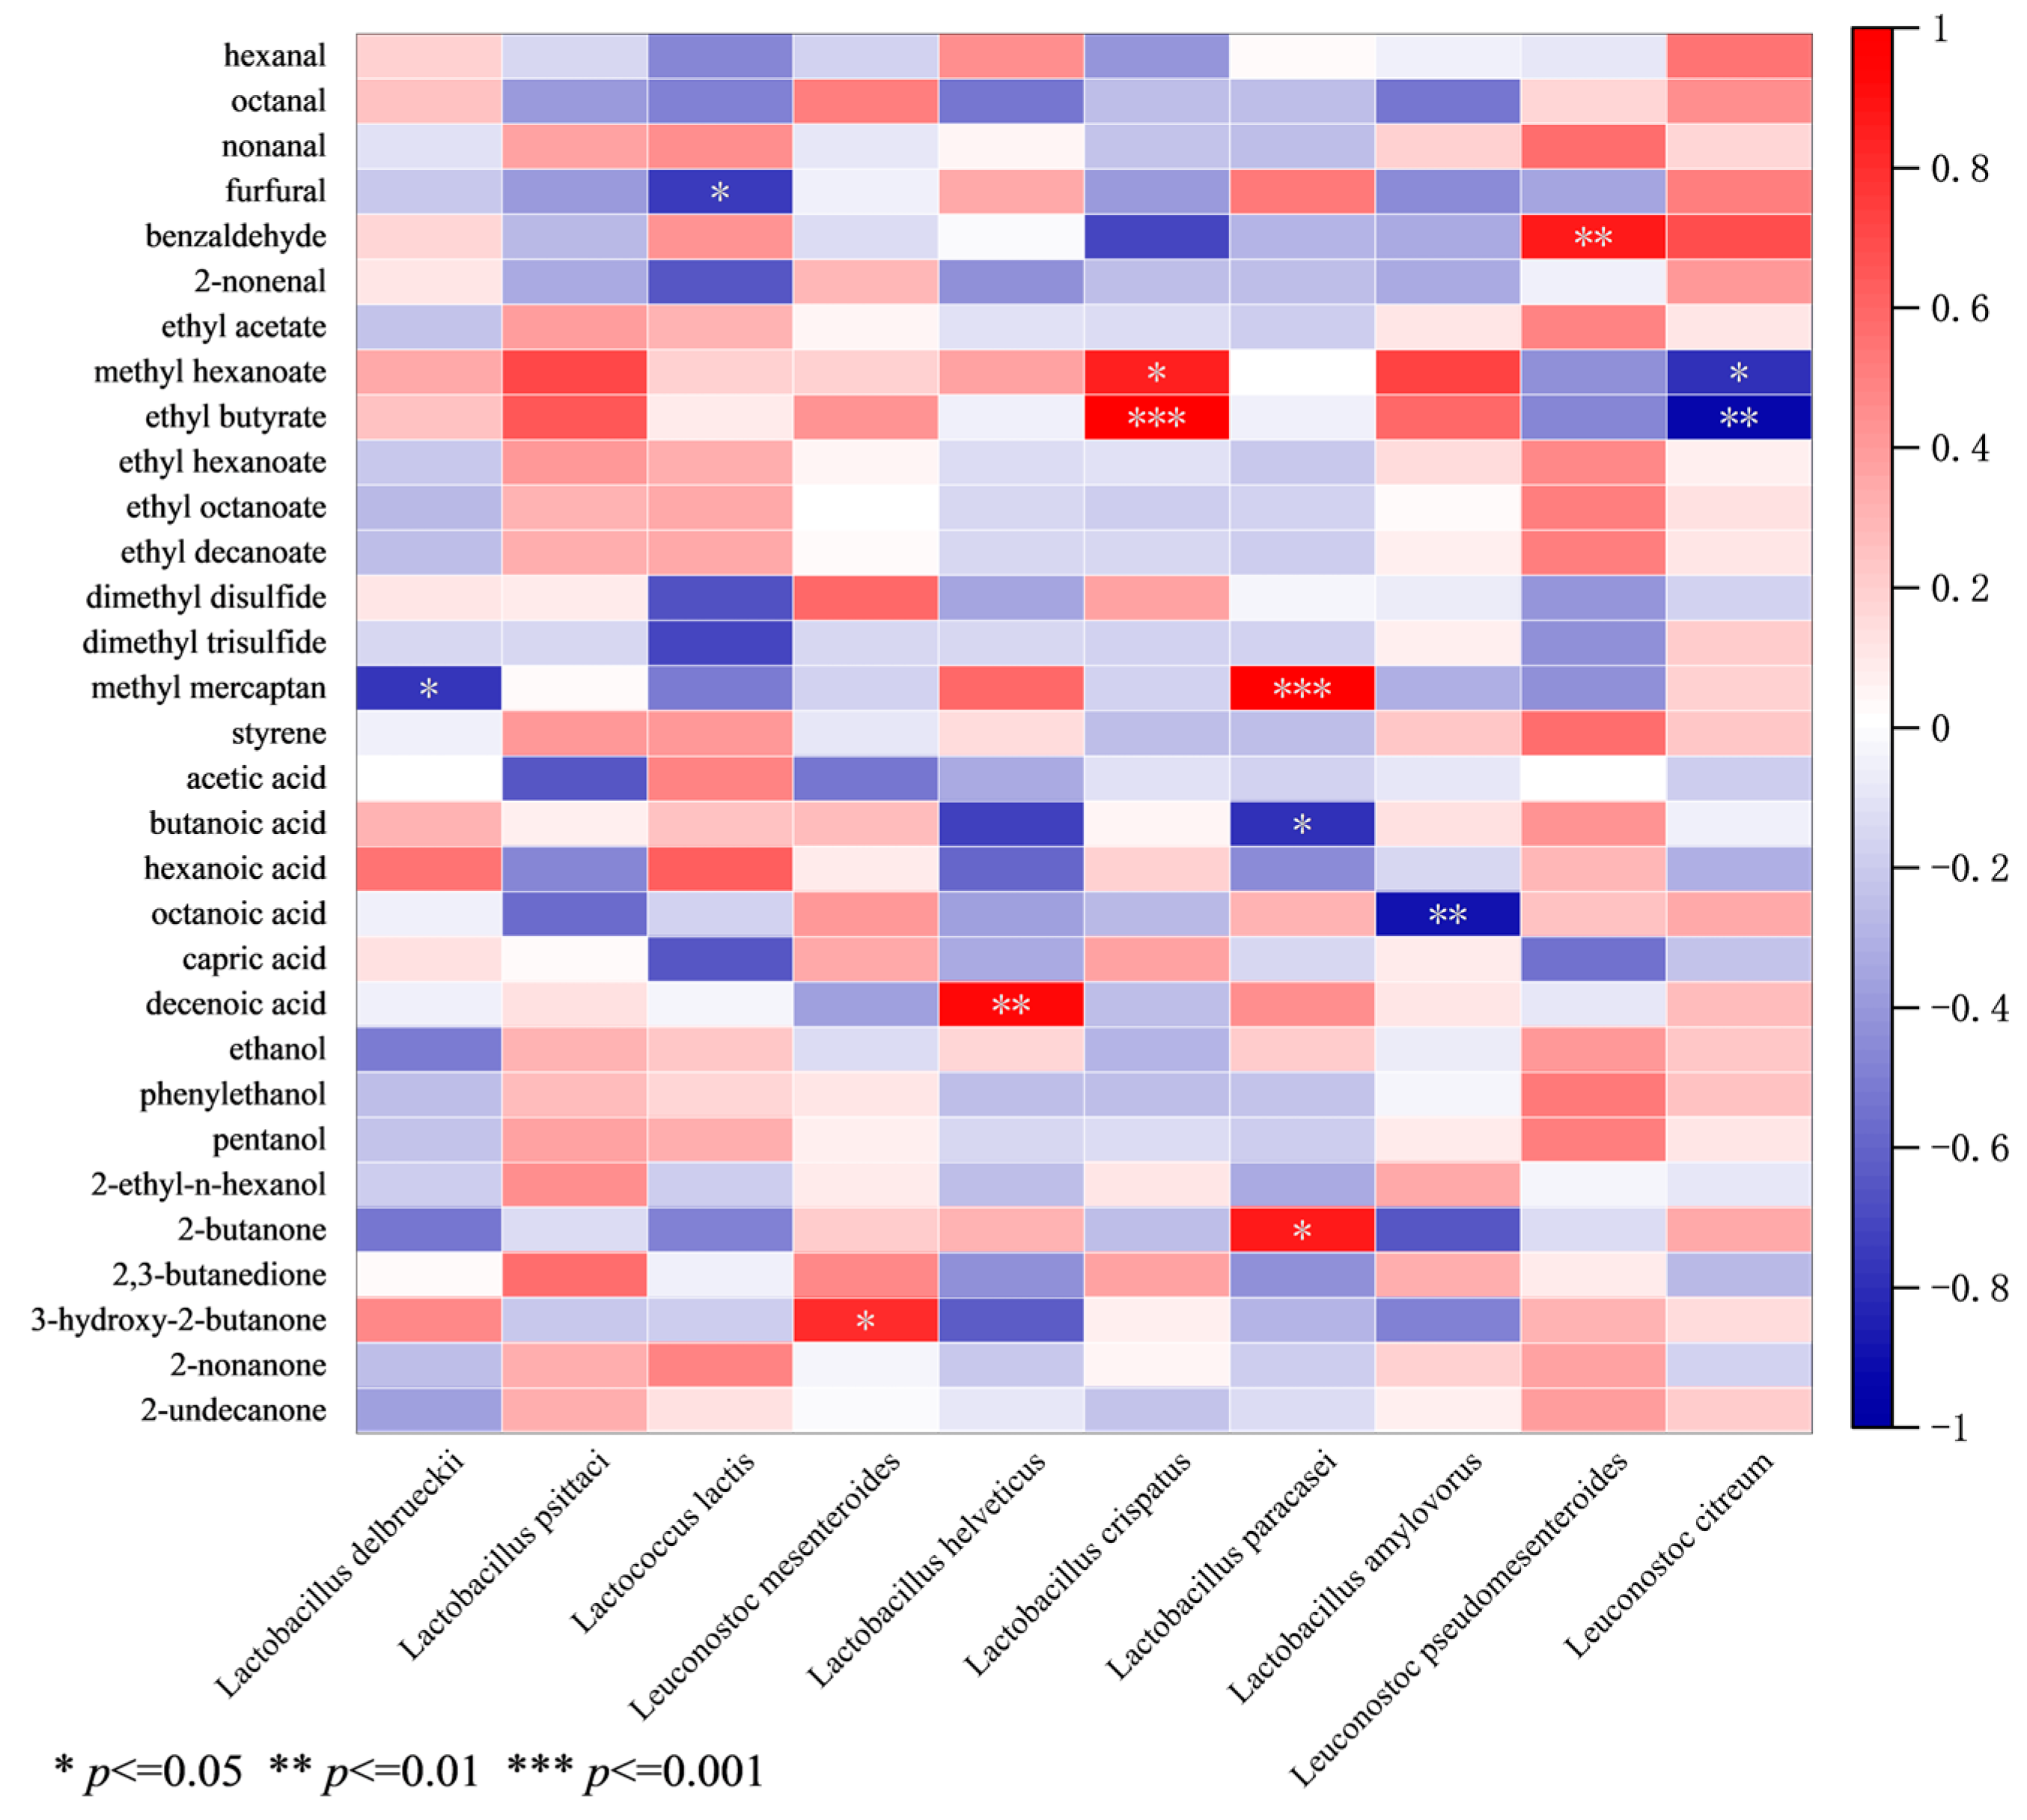
3.3. Correlation Analysis of Dominant Species and Key Aroma Compounds

As illustrated in Figure 3, the Pearson correlation coefficients were calculated to better understand the potential relationships between key aroma compounds and the dominant microbial species found in the Hurood samples. From this, 13 significant pair-wise correlations (|r| > 0.6, p < 0.05) were captured. Nine bacterial species were noted to be significantly correlated with the aroma properties of the Hurood (p < 0.05). Among these, Lactobacillus paracasei, Lactobacillus crispatus, and Leuconostoc citreum were significantly correlated with two or more key aroma compounds (p < 0.05), such as methyl hexanoate or ethyl butyrate.
Lactobacillus paracasei was correlated with the highest number (three) of key aroma compounds in the Hurood. Specifically, Lactobacillus paracasei was positively correlated with methyl mercaptan (r = 1.0, p < 0.001) and 2-butanone (r = 0.87, p < 0.05), while it was negatively correlated with butanoic acid (r = −0.79, p < 0.05). Lactobacillus paracasei is a probiotic that is widely present in the human gut and in fermented foods such as cheeses and pickles. It can enhance secondary proteolysis in soft and semi-hard cheese as well as the production of aroma compounds in mini-soft cheese [31]. Barouei et al. found that Lactobacillus paracasei could improve the sensory quality of cheeses; in this study, after 8 weeks of ripening, cheese that was supplemented with Lactobacillus paracasei received significantly higher scores for taste, aroma, texture, and overall preference than the control cheese [32,33].
Lactobacillus crispatus was positively correlated with methyl hexanoate (r = 0.86, p < 0.05) and ethyl butyrate (r = 0.99, p < 0.001). Lactobacillus crispatus is considered a probiotic [34]; it may help the body break down food, absorb nutrients, and fight off harmful organisms that might cause diseases [33]. These bacteria are sometimes added to fermented foods such as cheese and are also found in dietary supplements [35]. Leuconostoc citreum possesses a negative correlation with methyl hexanoate (r = −0.79, p < 0.05) and ethyl butyrate (r = −0.93, p < 0.01), which indicates that the growth of Leuconostoc citreum is in opposition to the formation and accumulation of ester compounds in Hurood. However, Leuconostoc citreum is closely related to food fermentation. Previous studies have shown that Leuconostoc citreum is one of the most prevalent LAB found in the manufacturing process of kimchi [36]. Genes in Leuconostoc citreum that are likely involved in fermentation and its probiotic effects have been revealed by a complete genome sequencing study [37].
In summary, Lactobacillus paracasei, Lactobacillus crispatus, and Leuconostoc citreum were identified as the core functional microorganisms in Hurood due to their significant correlation with key aroma compounds. In the future, more in-depth studies are needed to validate this preliminary inference. For instance, mono-culture fermentation tests should be conducted to verify the role of each strain on aroma formation.

4. Conclusions

This study characterized the aroma profiles, microbial diversities, and presumptive correlations between the key aroma compounds and dominant microorganisms of Hurood cheeses sampled from three distinct geographical origins. There were significant differences in LAB between different regions (p < 0.05) These dominant microbes were found to be significantly correlated with key aroma compounds such as methyl hexanoate and ethyl butyrate. Lactobacillus paracasei, Lactobacillus crispatus, and Leuconostoc citreum were identified as the core functional microorganisms of Hurood based on their P values and Pearson correlation coefficients. This work provides a theoretical basis of how microbial diversity can affect the final aroma profiles of Hurood cheeses, with special attention paid to their different production locations, paving the way to improving the overall aromas of traditional Chinese cheese products via the modification of the composition of functional LAB strains.

Supplementary Materials

The following supporting information can be downloaded at: https://www.mdpi.com/article/10.3390/fermentation9070670/s1, Table S1: GC–MS analysis results of aroma compounds in different Hurood samples. Table S2: Correlation coefficient r.

Author Contributions

Y.W.: Formal analysis, Investigation, Methodology, Writing—original draft and editing. H.Z.: Methodology, Writing—review and editing, Supervision. Y.C.: Supervision. S.W.: Supervision, Validation, Methodology, Writing—review and editing. B.W.: Supervision, Validation, Methodology, Writing—review and editing, Funding acquisition, Project administration. All authors have read and agreed to the published version of the manuscript.

Funding

This research was funded by the National Natural Science Foundation of China (Bei Wang, project No. 32072345; Beijing) and the Cultivation Project of Double First-Class Disciplines of Food Science and Engineering, Beijing Technology & Business University (Bei Wang, project No. BTBUYXTD202205).

Institutional Review Board Statement

Not applicable.

Informed Consent Statement

Not applicable.

Data Availability Statement

Data is contained within the article.

Conflicts of Interest

The authors declare no conflict of interest.

References

  1. Zhang, J.; Zhang, X.; Zhang, L.; Zhao, Y.; Niu, C.; Yang, Z.; Li, S. Potential probiotic characterization of Lactobacillus plantarum strains isolated from Inner Mongolia “Hurood” cheese. J. Microbiol. Biotech. 2014, 24, 225–235. [Google Scholar] [CrossRef] [PubMed] [Green Version]
  2. Fox, P.F.; Guinee, T.P.; Cogan, T.M.; McSweeney, P. Biochemistry of Cheese Ripening; Springer: New York, NY, USA, 2017. [Google Scholar] [CrossRef]
  3. Hailu, Y.; Hansen, E.B.; Seifu, E.; Eshetu, M.; Petersen, M.A.; Lametsch, R.; Rattray, F.; Ipsen, R. Rheological and sensory properties and aroma compounds formed during ripening of soft brined cheese made from camel milk. Int. Dairy J. 2018, 81, S0958694618300311. [Google Scholar] [CrossRef] [Green Version]
  4. Chen, Y.; Ning, H.E.; Yi-Jun, M.U.; Liu, Q.Y.; Qin, X.J.; Yun, M.A.; Xing, C.; Bai, L.J. Effect of Lactobacillus helveticus on the quality of Cheddar cheese. Food Sci. Tech.-Braz. 2018, 39, 122–125+131. [Google Scholar] [CrossRef]
  5. Wei, Y.; Xiang, W.U.; Zhou, H.; Baocai, X.U.; Xinfu, L.I. Changes of Microbial Flora during the Fermentation of Salami and Their Effect on Flavor. Meat Res. 2018, 32, 48–54. [Google Scholar]
  6. Chen, C.; Huang, K.; Yu, H.; Tian, H. The diversity of microbial communities in Chinese milk fan and their effects on volatile organic compound profiles. J. Dairy Sci. 2020, 104, 2581–2593. [Google Scholar] [CrossRef]
  7. Jiang, Y.; Li, N.; Wang, Q.; Liu, Z.; Chen, W. Microbial diversity and volatile profile of traditional fermented yak milk. J. Dairy Sci. 2019, 103, 87–97. [Google Scholar] [CrossRef]
  8. Gao, X.; Zhang, L.; Bo, L.I. Effect of fermentation starter addition on the flavor of Mongolian hard cheese. China Brew. 2015, 34, 77–81. [Google Scholar] [CrossRef]
  9. Esen, Y.; Cetin, B. Bacterial and yeast microbial diversity of the ripened traditional middle east surk cheese. Int. Dairy J. 2021, 117, 105004. [Google Scholar] [CrossRef]
  10. Hasiqimuge; Zhang, H.M.; Fang, X.; Zhu, J.J.; Chen, Y.F.; Mei, Y.A. Study of the production process and the nutrition analysis of the traditional cheese from different regions of Inner Mongolia. China Dairy Ind. 2016, 44, 35–37. [Google Scholar]
  11. Zhu, L.; Hou, Z.; Hu, X.; Liu, X.; Dai, T.; Wang, X.; Zeng, C.; Wang, Y.; Wang, C.; Yang, S.; et al. Genomic and Metabolic Features of an Unexpectedly Predominant, Thermophilic, Assistant Starter Microorganism, Thermus thermophilus, in Chinese Inner Mongolian Cheese. Foods 2021, 10, 2962. [Google Scholar] [CrossRef]
  12. Lei, Y.; Zhou, Y.; Shan, C.; Cai, W.; Song, K.; Guo, Z. Study on the core bacterial microbiota of dairy toufu based on high-throughput sequencing technology. China Dairy Ind. 2020, 48, 9–13. [Google Scholar] [CrossRef]
  13. Gao, M.L.; Hou, H.M.; Teng, X.X.; Zhu, Y.L.; Hao, H.S.; Zhang, G.L. Microbial diversity in raw milk and traditional fermented dairy products (Hurood cheese and Jueke) from Inner Mongolia, China. Genet. Mol. Res. 2017, 16, gmr16019451. [Google Scholar] [CrossRef] [PubMed]
  14. Zz, A.; Chao, N.; Long, C.D.; Yz, A.; Ge, Y.A.; Chao, W.A.; Nc, D.; Zz, D.; Sl, A. Impacts of manufacture processes and geographical regions on the microbial profile of traditional Chinese cheeses. Food Res. Int. 2021, 148, 110600. [Google Scholar] [CrossRef]
  15. Majcher, M.A.; Jeleń, H. Key Odorants of Oscypek, a Traditional Polish Ewe’s Milk Cheese. J. Agric. Food Chem. 2011, 59, 4932–4937. [Google Scholar] [CrossRef]
  16. Zhao, D.; Hu, J.; Chen, W. Analysis of the relationship between microorganisms and flavour development in dry-cured grass carp by high-throughput sequencing, volatile flavour analysis and metabolomics. Food Chem. 2022, 368, 130889. [Google Scholar] [CrossRef]
  17. Engel, W.; Bahr, W.; Schieberle, P. Solvent assisted flavour evaporation—A new and versatile technique for the careful and direct isolation of aroma compounds from complex food matrices. Eur. Food Res. Technol. 1999, 209, 237–241. [Google Scholar] [CrossRef]
  18. Trabue, S.L.; Anhalt, J.C.; Zahn, J.A. Bias of Tedlar Bags in the Measurement of Agricultural Odorants. J. Environ. Qual. 2006, 35, 1668–1677. [Google Scholar] [CrossRef] [Green Version]
  19. Friedrich, J.E.; Acree, T.E. Gas Chromatography Olfactometry (GC/O) of Dairy Products. Int. Dairy J. 1998, 8, 235–241. [Google Scholar] [CrossRef]
  20. Wang, J.; Yang, Z.J.; Xu, L.Y.; Wang, B.; Tan, L. Key aroma compounds identified in Cheddar cheese with different ripening times by aroma extract dilution analysis, odor activity value, aroma recombination, and omission. J. Dairy Sci. 2020, 104, 1576–1590. [Google Scholar] [CrossRef]
  21. Wang, B.; Wang, J.; Xu, L.Y.; Zhang, J.H.; Ai, N.S.; Cao, Y.P. Characterization of the key odorants in kurut with aroma recombination and omission studies. J. Dairy Sci. 2020, 103, 4164–4173. [Google Scholar] [CrossRef]
  22. Wang, J.; Yang, Z.J.; Wang, Y.D.; Cao, Y.P.; Wang, B.; Liu, Y. The key aroma compounds and sensory characteristics of commercial Cheddar cheeses. J. Dairy Sci. 2021, 104, 7555–7571. [Google Scholar] [CrossRef] [PubMed]
  23. Delgado, F.J.; Gonzalez-Crespo, J.; Cava, R.; Ramirez, R. Formation of the aroma of a raw goat milk cheese during maturation analysed by SPME–GC–MS. Food Chem. 2011, 129, 1156–1163. [Google Scholar] [CrossRef] [PubMed]
  24. Liu, S.Q.; Holland, R.; Crow, V.L. Esters and their biosynthesis in fermented dairy products: A review. Int. Dairy J. 2004, 14, 923–945. [Google Scholar] [CrossRef]
  25. Kruis, A.J.; Bohnenkamp, A.C.; Patinios, C.; Nuland, Y.; Weusthuis, R.A. Microbial production of short and medium chain esters: Enzymes, pathways, and applications. Biotechnol. Adv. 2019, 37, 107407. [Google Scholar] [CrossRef] [PubMed]
  26. Tian, H.; Xu, X.; Ch En, C.; Yu, H. Flavoromics approach to identifying the key aroma compounds in traditional Chinese milk fan—ScienceDirect. J. Dairy Sci. 2019, 102, 9639–9650. [Google Scholar] [CrossRef]
  27. Rincon-Delgadillo, M.I.; Lopez-Hernandez, A.; Wijaya, I.; Rankin, S.A. Diacetyl levels and volatile profiles of commercial starter distillates and selected dairy foods. J. Dairy Sci. 2012, 95, 1128–1139. [Google Scholar] [CrossRef] [Green Version]
  28. Midje, D.L.; Bastian, E.D.; Morris, H.A.; Martin, F.B.; Bridgeman, T.; Vickers, Z.M. Flavor enhancement of reduced fat cheddar cheese using an integrated culturing system. J. Agric. Food Chem. 2000, 48, 1630–1636. [Google Scholar] [CrossRef]
  29. Papaioannou, G.; Kosma, I.; Badeka, A.V.; Kontominas, M.G. Profile of Volatile Compounds in Dessert Yogurts Prepared from Cow and Goat Milk, Using Different Starter Cultures and Probiotics. Foods 2021, 10, 3153. [Google Scholar] [CrossRef]
  30. Tsuchihashi, H.; Ichikawa, A.; Takeda, M.; Koizumi, A.; Mizoguchi, C.; Ishida, T.; Kimura, K. Genetic diversity of Lactobacillus delbrueckii isolated from raw milk in Hokkaido, Japan. J. Dairy Sci. 2021, 105, 2082–2093. [Google Scholar] [CrossRef]
  31. Baptista, I.; Santos, M.; Rudnitskaya, A.; Saraiva, J.A.; Almeida, A.; Rocha, S.M. A comprehensive look into the volatile exometabolome of enteroxic and non-enterotoxic Staphylococcus aureus strains. Int. J. Biochem. Cell Biol. 2019, 108, 40–50. [Google Scholar] [CrossRef]
  32. Poveda, J.M.; Chicón, R.; Cabezas, L. Biogenic amine content and proteolysis in Manchego cheese manufactured with Lactobacillus paracasei subsp. paracasei as adjunct and other autochthonous strains as starters. Int. Dairy J. 2015, 47, 94–101. [Google Scholar] [CrossRef]
  33. Barouei, J.; Karbassi, A.; Ghoddusi, H.B.; Mortazavi, A.; Moussavi, M. Impact of native Lactobacillus paracasei subsp. paracasei and Pediococcus spp. as adjunct cultures on sensory quality of Iranian white brined cheese. Int. Dairy J. 2011, 64, 526–535. [Google Scholar] [CrossRef]
  34. Peralta, G.H.; Wolf, I.V.; Bergamini, C.V.; Perotti, M.A.C.; Hynes, E.R. Evaluation of volatile compounds produced byLactobacillus paracaseiI90 in a hard-cooked cheese model using solid-phase microextraction. Dairy Sci. Technol. 2014, 94, 73–81. [Google Scholar] [CrossRef] [Green Version]
  35. Li, T.; Liu, Z.; Zhang, X.; Chen, X.; Wang, S. Local Probiotic Lactobacillus crispatus and Lactobacillus delbrueckii Exhibit Strong Antifungal Effects Against Vulvovaginal Candidiasis in a Rat Model. Front. Microbiol. 2019, 10, 1033. [Google Scholar] [CrossRef] [PubMed] [Green Version]
  36. Muhammad, I.; Ahmad, A.A.; Shah, T. Health Promoting and Disease Preventing Properties of Probiotics with Special Reference to Lactobacillus: A Review. J. Probiotics Health 2018, 6, 1. [Google Scholar] [CrossRef]
  37. Patrignani, F.; Siroli, L.; Parolin, C.; Serrazanetti, D.I.; Vitali, B.; Lanciotti, R.; Shukla, P. Use of Lactobacillus crispatus to produce a probiotic cheese as potential gender food for preventing gynaecological infections. PLoS ONE 2019, 14, e0208906. [Google Scholar] [CrossRef]
Figure 1. The process of making Hurood in the Inner Mongolia region, China.
Fermentation 09 00670 g001
Figure 2. (a) An overview of the sampling location of the Hurood studied in this work. Samples U1–U4 (U) were obtained in the Ulanqab league; samples B1–B3 (B) were obtained in the Bayannur; samples X1–X3 (X) were obtained in the Xilingol league; (b). The relative abundance of bacterial communities at the species level of the Hurood; (c). Changes in bacteria community diversity of the Hurood (within the community). Based on the Shannon index of the Tukey test of α-Diversity (Different letters corresponding to statistically significant differences (p < 0.05)); (d). Changes in the bacteria community diversity of the Hurood, based on weighted uniFrac distance metric β-Diversity.
Fermentation 09 00670 g002aFermentation 09 00670 g002b
Figure 3. The correlation between core microbes and key aroma compounds in the Hurood samples. Blue represents negative correlations between aroma compounds and microorganisms, red represents positive correlations between aroma compounds and microorganisms.
Fermentation 09 00670 g003
Table 1. The relative odor activity values (ROAVs) of 31 key aroma compounds detected in the Hurood samples (* p < 0.05).
RTCompound *SampleThresholdAroma
Description
Identification
U1U2U3U4B1B2B3X1X2X3(μg/kg)
Carboxylic Acids
21.71Acetic acid *1.85 ± 0.9725.71 ± 21.8923.49 ± 10.3221.16 ± 15.621.23 ± 0.580.25 ± 0.172.83 ± 1.350.25 ± 0.151.35 ± 0.861.48 ± 1.06700.00sour, vinegarMS, RI, O
28.83Butanoic acid0.97 ± 0.240.87 ± 0.062.66 ± 1.223.67 ± 2.541.34 ± 0.241.10 ± 1.000.90 ± 0.541.37 ± 1.230.22 ± 0.080.62 ± 0.34410.00pungentMS, RI, O
36.82Hexanoic acid *11.41 ± 5.3413.85 ± 2.5421.66 ± 10.3230.88 ± 14.635.76 ± 2.344.73 ± 1.329.79 ± 4.2317.80 ± 6.354.58 ± 1.237.30 ± 2.64225.00sour, cheesyMS, RI, O
42.00Octanoic acid21.53 ± 19.6314.44 ± 9.4533.12 ± 16.8743.34 ± 24.789.55 ± 6.4910.59 ± 3.2810.21 ± 2.6443.07 ± 26.5916.23 ± 6.378.94 ± 6.33250.00rancidMS, RI, O
44.84n-Decanoic acid3.21 ± 2.641.45 ± 0.641.12 ± 0.242.46 ± 1.230.59 ± 0.325.59 ± 1.364.09 ± 1.242.55 ± 1.331.97 ± 0.161.11 ± 0.542200.00sour, cheesyMS, RI, O
44.81Decenoic acid *-------149.21 ± 32.5436.71 ± 11.3454.30 ± 23.454.30sour, cheesy, rancidMS, RI, O
Alcohols
5.33Ethanol5.54 ± 1.268.06 ± 2.1210.46 ± 3.2612.08 ± 2.1525.24 ± 10.264.29 ± 1.334.89 ± 1.247.53 ± 2.9513.57 ± 6.497.90 ± 5.298.00alcoholMS, RI, O
38.89Phenyl ethanol1.18 ± 0.580.58 ± 0.421.46±1.18 ± 1.096.36 ± 4.271.61 ± 1.260.26 ± 0.080.24 ± 0.190.39 ± 0.270.29 ± 0.0315.00fruity, fermentedMS, RI, O
18.79Pentanol16.76 ± 4.2939.74 ± 10.48190.92 ± 62.84195.62 ± 98.491337.25 ± 526.3425.03 ± 11.8554.44 ± 12.65---0.15 MS, RI
23.572-ethyl-n-hexanol *----60.28±51.15±26.33±---0.80 MS, RI
Ketones
9.722-Butanone2.52 ± 1.03-------4.89 ± 2.49-1.30 MS, RI
10.492,3-Butanedione *1.04 ± 0.26---2.98 ± 1.622.08 ± 1.052.22 ± 1.06---15.00creamy, butteryMS, RI, O
18.533-Hydroxy-2-butanone44.60 ± 10.260.91 ± 0.262.70 ± 1.62--15.33 ± 3.4513.38 ± 2.484.91 ± 1.26-0.02 ± 0.0014.00creamyMS, RI, O
19.552-Nonanone-0.46 ± 0.32-0.38 ± 0.241.36 ± 1.49-0.38 ± 0.29-0.11 ± 0.00-420.00fruityMS, RI, O
27.722-Undecanone0.04 ± 0.010.11 ± 0.020.24 ± 0.060.23 ± 0.082.16 ± 1.090.53 ± 0.370.05 ± 0.000.11 ± 0.040.25 ± 0.030.09 ± 0.0182.00fruityMS, RI, O
Aldehydes
9.27Hexanal1.02 ± 0.230.07 ± 0.01---1.86 ± 1.030.02 ± 0.000.01 ± 0.000.93 ± 0.252.20 ± 1.0650.00grassMS, RI, O
16.19Octanal1.51 ± 0.52-9.84 ± 2.45--1.26 ± 0.65---- fruityMS, RI, O
19.66Nonanal-0.87 ± 0.251.06 ± 0.261.08 ± 0.329.70 ± 2.650.22 ± 0.050.21 ± 0.030.06 ± 0.01-3.06 ± 1.6242.00 MS, RI
22.13Furfural2.71 ± 0.891.28 ± 0.41---3.14 ± 1.290.85 ± 0.450.85 ± 0.323.54 ± 1.622.37 ± 0.852.80 MS, RI
24.46Benzaldehyde16.98 ± 4.1614.66 ± 5.9613.38 ± 2.8522.75 ± 6.8420.23 ± 4.8511.35 ± 2.985.84 ± 1.541.73 ± 0.8210.69 ± 6.1219.00 ± 5.263.00almondMS, RI, O
24.992-Nonenal75.90 ± 15.26----119.30 ± 20.84----0.10RoastMS, RI, O
Esters
6.22Ethyl acetate1.51 ± 0.8516.27 ± 1.6512.99 ± 3.4819.80 ± 5.92819.31 ± 105.4624.93 ± 2.1637.47 ± 11.858.39 ± 2.062.16 ± 1.2522.08 ± 0.5838.00 MS, RI
11.23Methyl hexanoate------96.71 ± 36.1522.57 ± 12.4825.14 ± 10.6550.43 ± 8.450.07 MS, RI
13.44Ethyl butyrate16.42 ± 0.58-----316.60 ± 107.40268.30 ± 98.4541.32 ± 12.45-0.05 MS, RI
14.39Ethyl hexanoate0.06 ± 0.010.29 ± 0.125.33 ± 1.525.28 ± 2.166.45 ± 2.120.49 ± 0.160.67 ± 0.052.94 ± 1.200.06 ± 0.020.37 ± 0.010.88fruity, fermentedMS, RI, O
21.31Ethyl octanoate0.04 ± 0.010.42 ± 0.122.67 ± 1.263.64 ± 1.414.02 ± 1.26--6.99 ± 1.240.11 ± 0.06-220.00flower, fruityMS, RI, O
41.72Ethyl decanoate0.03 ± 0.020.20 ± 0.141.23 ± 0.85 2.16 ± 1.260.03 ± 0.020.08 ± 0.012.77 ± 1.240.03 ± 0.01-180.00appleMS, RI, O
Sulfur compounds
14.32Dimethyl disulfide4.76 ± 1.26----5.95 ± 2.584.76 ± 3.49-2.38 ± 1.32-0.0084rotten eggsMS, RI, O
35.26Dimethyl trisulfide-----12.50 ± 3.26----0.0080 MS, RI
4.23Methyl mercaptan--------28.32 ± 5.64-0.28 MS, RI
Aromatic
hydrocarbon
15.01Styrene--0.16 ± 0.05-2.23 ± 0.510.12 ± 0.03-0.07 ± 0.05-1.02 ± 0.3226.40aromatics, reagentsMS, RI, O
Method of identification: MS = mass spectrum comparison using NIST 14; RI = retention index in agreement with literature value (the reference column type is DB-WAX); O = odor.
Disclaimer/Publisher’s Note: The statements, opinions and data contained in all publications are solely those of the individual author(s) and contributor(s) and not of MDPI and/or the editor(s). MDPI and/or the editor(s) disclaim responsibility for any injury to people or property resulting from any ideas, methods, instructions or products referred to in the content.

