Article

A Novel Batched Four-Stage–Two-Phase Anaerobic Digestion System to Facilitate Methane Production from Rice Straw and Cow Manure with Low Inoculum/Substrate Ratios

1
Department of Chemistry, Zhejiang Sci-Tech University, Hangzhou 310018, China
2
College of Biological, Chemical Science and Engineering, Jiaxing University, Jiaxing 314001, China
*
Authors to whom correspondence should be addressed.
Fermentation 2023, 9(6), 565; https://doi.org/10.3390/fermentation9060565
Submission received: 10 May 2023 / Revised: 1 June 2023 / Accepted: 13 June 2023 / Published: 15 June 2023

Abstract

:
In order to improve the performance of methane production from agro-waste, a batched four-stage–two-phase anaerobic digestion (4S2P-AD) system was designed to combine the advantages of both anaerobic co-digestion (co-AD) and two-phase AD. The initial separation of two phases was performed using rice straw (RS) as a feedstock in acidogenic phase and cow manure (CM) in methanogenic phase at low inoculum/substrate (I/S) ratios of 0.5 and 0.2 and a high organic loading of 60 g volatile solid (VS)/L. The periodic round-trip reflux of leachate during the 4S2P-AD process facilitated re-inoculation throughout the four stages. The results showed that this round-trip reflux also dispersed toxic ammonia, balanced the carbon/nitrogen ratio, unified the microbial community structure, and led to the selection of Methanosarcina (relative abundance > 80%) as the dominant methanogens. With the abilities to overcome volatile fatty acid accumulation, shorten lag times, improve biodegradability, and foster synergistic effects, it was verified that the 4S2P-AD process can maintain efficient and stable methanogenesis from high-solid lignocellulosic feedstock. The averaged methane production throughout the four stages of 4S2P-AD was 234 mL/g VS. This result is 96% higher than the averaged methane production obtained from the four one-step AD groups using mono-feedstock, and 91% higher than that obtained using co-feedstock. This study provides a scientific reference for the development of new processes of bio-methane production from agro-waste with a high fermentation capacity and stability in the future.

Graphical Abstract

1. Introduction

Innovation in reactor configuration with matching processes is a focal point of technical development in the field of anaerobic digestion (AD). In a healthy AD process, hydrolytic and acidogenic bacteria, acetogens, and methanogens all play integral roles in the sequence. However, the physiological drivers of these microbes are different. The former three groups rapidly convert organics into volatile fatty acids (VFAs), alcohols, CO2, and H2 and are insensitive to acidic conditions. Meanwhile, the methanogens yield CH4 from acetic acid, CO2, and H+ slowly and are prone to inhibition due to the accumulation of VFAs and H+ [1]. Based on the kinetic conflict of acidogenesis and methanogenesis, two-phase AD, also known as two-stage AD, was developed. In a tandem concept, the acidogenic phase (AP) is separated from the methanogenic phase (MP) by regulating the operation parameters of two reactors so that the acidogens and methanogens can maximize their growth in two-phase AD [2]. Thus, two-phase AD exhibits advantages over single-phase AD in terms of methane production, the organic loading rate (OLR), and stability [3,4].
Usually, two-phase AD involves the installation of one AP reactor and one MP reactor in series [3,5]. AP can be achieved by adding bio-nontoxic chemicals, such as NaOH or HCl solutions, to regulate the pH outside the range of 6.5–7.5 [6,7,8], the optimal pH for methanogens [9]. Other approaches include the application of methanogenic inhibitors [10,11], the control of temperature to obtain conditions unfavorable for methanogens but favorable for acidogens [12], and the employment of short HRTs to deplete methanogens or their combinations. As an increased OLR will shorten the HRT, an AP with a pH naturally decreasing to <6.5 can be established by increasing the OLR and/or lowering the inoculum/substrate (I/S) ratio, e.g., to 0.25 [6]. In this high-OLR operation, the AP performance declines due to acidogen washout, which can be overcome through digestate re-circulation using MP [13].
Two-phase AD has been proven to improve methanogenesis from agricultural waste [6,7]. However, many agro-wastes, such as rice straw (RS) and cow manure (CM), are still considered unsuitable for two-stage AD because of their high lignocellulose contents [9]. In the digestion of agro-waste, hydrolysis is the main rate-limiting step in either single-phase AD or the AP of two-phase AD [3]. This requires a long period of HRT operation. Therefore, long-term batched AD is a common choice for straws, while a plug-flow reactor is often employed to degrade CM. According to calculations, the degradation rates of RS and CM in single-phase AD are merely 20–60% [14,15,16]. Thus, two-phase AD is a tempting option that may be used to obtain more methane from these agro-wastes.
Nutrient imbalance in RS and CM is another problem in the AD process. The anaerobic co-digestion (co-AD) of the two feedstocks can offset the C or N shortage in manures or straws, thus realizing the proper C/N ratio of 20–35 [9]. Compared with anaerobic mono-digestion (mono-AD), synergy is frequently detected in co-AD, as it can dilute toxins, shorten lag times, enrich biogas, and stabilize microflora [1,17,18]. The co-AD process is currently deemed to be the best methanogenic option for RS as a result of its sustained performance [15]. However, co-AD is still challenging. Its stability and optimization problems have not yet been solved, even in studies employing two-stage AD [17]. The feedstock stoichiometry, loading choice, and kinetic match between acidogens and methanogens are the main obstacles involved in co-AD [18]. All these problems contribute to digestive imbalance. However, one review article proposed a hypothesis that carrying out co-AD within a two-phase AD framework may help to settle the degradability mismatch of crops and manure. To be specific, the authors proposed importing less biodegradable feedstock into AP, followed by the addition of highly degradable feedstock in the subsequent MP unit. This two-phase AD operation may aid in the improvement of synergy in co-AD [1].
Based on the above discussion, a novel AD process, namely, the four-stage–two-phase AD (4S2P-AD) system was designed to combine two-phase AD and co-AD. The 4S2P-AD was expected to exhibit the following technical features: (1) Crop straw and manure are used as feedstocks, as in co-AD, but without being directly mixed; (2) The AP, with straw as a feedstock, and MP, with manure as a feedstock, are established by controlling and maintaining a low I/S ratio and high organic loading in individual reactors. This is because the digestion of crop straw with large polysaccharides is likely to produce VFAs when methanogens are in low abundance, whereas manure is likely to yield methane spontaneously because of its abundant native methanogens; (3) The two-phase AD process is further cascaded to form 4S2P-AD with four stages: AP, MP, AP, and MP. Thus, the number of fermentation spaces is increased to four, with two two-phase AD systems working serially at the same time. These multiple stages are expected to improve the reaction capacity, increase the spatial heterogeneity, disperse the risk of reactor operation failure, and enhance the impact resistance of the whole system to interference; and (4) Unlike the one-way flow from AP to MP in most two-phase AD processes, the liquid digestate, i.e., leachate, flows intermittently and periodically back and forth throughout the four stages in 4S2P-AD. Therefore, not only will the intermediate metabolites from AP be periodically imported into MP, but the abundant methanogens in MP will also re-inoculate into AP. This process is expected to prevent both the decline of AP performance due to acidogens transfer to MP, and the decrease in methane production from straw due to persistent hydrogen production in the late fermentation stage in AP.
In summary, an experimental study of a batched-mode 4S2P-AD system was conducted to determine whether the use of less biodegradable straw and highly degradable manure in AP and MP, respectively, can provide the technical advantages of both two-phase AD and co-AD. To verify this hypothesis, the purposes of this study were as follows: (1) to assess the feasibility of using the 4S2P-AD system to improve methanogenesis from RS and CM with low I/S ratios of 0.2 and 0.5 and a high loading of 60 g volatile solid (VS)/L; (2) to verify the advantages of 4S2P-AD by comparing it with single-phase AD (mono-AD and co-AD) in terms of the reactor performance, methane yields, and kinetics; and (3) to elucidate the biological causes behind the superiority of 4S2P-AD by observing the structural dynamics of microbial communities.

2. Materials and Methods

2.1. Inoculum and Feedstock

The inoculum was digestate from a 1000 m3 biogas plant treating diluted CM. The feedstocks were CM and RS, collected from a dairy farm and a rice plantation, respectively. All three sites are located at Zhejiang Yijing Ecological Husbandry co. LTD, Shaoxing, China. After collection, the inoculum was sieved with 40 mesh screens and then incubated at 36 °C for 3 days. The CM was sub-packaged into 2 L plastic boxes and stored at −20 °C to await thawing before use. The air-dried RS was ground to a size of less than 0.5 cm.

2.2. Experimental Design and Operation

Mono-AD, co-AD, and 4S2P-AD were conducted in the form of duplicated batched AD assays in 250 mL serum bottles. For mono-AD and co-AD, the working space was 200 mL. For 4S2P-AD, a 200 or 150 mL working volume was intermittently employed as a result of liquid digestate transfer. The sealed bottles were placed in a water bath at 36 °C and manually shaken once a day. In order to explore the AD performance potential of the 4S2P-AD system, a relatively high OLR of 60 g volatile solid (VS)/L and 2 low I/S ratios of 0.5 and 0.2 were adopted. For the single-phase control groups, mono-AD assays using CM or RS as a sole feedstock were labeled as CM-0.5-CK, CM-0.2-CK, RS-0.5-CK, and RS-0.2-CK, respectively. The co-AD assays using both CM and RS as a co-feedstock with a reported optimal CM/RS ratio of 1:1 (VS basis) [19] were labeled as RSCM-0.5-CK and RSCM-0.2-CK. The experiential groups of 4S2P-AD were investigated using four cascaded bottles, using a mono-feedstock of CM and RS at I/S ratios of 0.5 and 0.2, respectively. These four reactors were labeled as CM-0.5, RS-0.5, CM-0.2, and RS-0.2. The experimental setup schematic and corresponding flow diagram are shown in Figure 1.
The liquid samples were collected with syringes for analyses of the intermediate metabolites and microbial diversity. Gas samples were collected in Tedlar bags to measure the volume and methane content. The control groups were sampled on days 3, 5, 8, 11, 14, 21, and 29, while the 4S2P-AD groups were sampled on days 3, 5, 8, 11, 16, 22, and 30. After each sampling, periodical bidirectional leachate reflux was carried out in 4S2P-AD. Each time, 50 mL of leachate sample was transferred using a syringe in the forward or backward direction of CM-0.5, RS-0.5, CM-0.2, and RS-0.2. The periodical bidirectional leachate reflux flow diagram is shown in Figure 1. Manual shaking was performed after leachate transfer.

2.3. Analytical Methods

The total solid (TS) and VS contents were determined according to ASTM E1756-08 and ASTM E1755-01, respectively. The C/H/N/S/O analysis was quantified using an elemental analyzer (ThermoFisher, Flash Smart, Waltham, MA, USA). The pH was measured using a pH meter (Leici, PHS-3C, Shanghai, China). The partial (PA), intermediate (IA), and total alkalinity (TA) were determined using an automatic titrator (Leici, ZDJ-5B, China) with 0.1 N H2SO4 to the pH end points of 5.7, 4.3, and 4.0 [20]. The total ammonia nitrogen (TAN) content was analyzed using an automatic Kjeldahl apparatus (TOP instrument, ZDDN-II, Hangzhou, China), while free ammonia nitrogen (FAN) was calculated using equations [21]. For the RS, the detection of the neutral detergent fiber (NDF), acid detergent fiber (ADF), hemi-cellulose, cellulose, and acid detergent lignin (ADL) contents was performed in reference to van Soest’s method [14].

2.4. Calculations

2.4.1. Biochemical Methane Potential (BMP) and Biodegradability

The weighted BMP (BMPw) was obtained using Equation (1). Based on a modified Buswell equation [22] (Equation (2)), the theoretical methane content (TMC), ultimate BMP (BMPu), and bio-degradable fraction (fd) were calculated from Equations (3)–(5), respectively:
B M P w , m L / g V S = B M P o R S × a + B M P o C M × b a + b
CcHhOoNnSs + 1/4 (4c − h − 2o +3n + 2s) H2O → 1/8 (4c − h + 2o +3n + 2s) CO2 + 1/8 (4c + h − 2o −3n − 2s) CH4 + nNH3 + sH2S
T M C , % = 1 8 4 c + h 2 o 3 n 2 s × 100 % 1 8 4 c + h 2 o 3 n 2 s + 1 8 4 c h + 2 o + 3 n + 2 s + n + s
B M P u , m L / g V S = 22.4 × 1000 × 1 8 4 c + h 2 o 3 n 2 s 12 c + h + 16 o + 14 n + 32 s
f d , % = B M P o B M P u × 100 %
where a and b are the VS fractions of RS and CM in mono-AD, respectively; BMPo is the observed biochemical methane potential (mL/g VS); and c, h, o, n, and s are the numbers of C, H, O, N, and S atoms in the feedstock formulae calculated based on elemental analysis, respectively.

2.4.2. Kinetics Study

The BMPo data were fitted with a modified Gompertz model, as shown in Equation (6), with R2 ≥ 0.99 for validating the BMPo fittings of CM-0.5, CM-0.2, RS-0.2, CM-0.5-CK, CM-0.2-CK, and RSCM-0.5-CK, while R2 ≥ 0.97 was used for RS-0.5:
Y = P   e x p e x p e × R m a x P λ t + 1
where Y is the BMPo, mL CH4/g VS; P is the predicate BMP, mL CH4/g VS; t is the digestion time, d; Rmax is the maximum methane production rate, mL CH4/g VS/d; λ is the lag phase time, d; and e is the constant (2.718282).

2.5. Microbial Diversity Analysis

Next, 16 s RNA high-throughput pyrosequencing was carried out to analyze the microbial community structures. The DNA extraction, amplification, library construction, and bioinformatics analysis were conducted by the OE Biotech Company, Shanghai, China. For bacteria, the V3–V4 variable regions of 16S rRNA genes were amplified with the primers 343F (5′-TACGGRAGGCAGCAG-3’) and 798R (5′-AGGGTATCTAATCCT-3′), while for archaea, the primers Arch349F (5′-GYGCASCAGKCGMGAAW-3′) and Arch806R (5′-GGACTACVSGGGTATCTAAT-3′) were used. Sequencing was performed with an Illumina Miseq system (Illumina Inc., San Diego, CA, USA). Clean reads were clustered to generate operational taxonomic units (OTUs) with 97% similarity. The representative OTUs were annotated and blasted against the Silva database version 132 with a confidence threshold of 70%. Functional predictions were performed via Phylogenetic Investigation of Communities by Reconstruction of Unobserved States (PICRUSt), and information was obtained from the Kyoto Encyclopedia of Genes and Genomes (KEGG).

2.6. Statistical Analysis and Software

The Data Processing System software was used to perform variance and correlation analyses. Microbial diversity was calculated using alpha diversity indices and plotted using Origin 2020 software. Rarefaction curves, heatmaps, and principal component analysis (PCA) diagrams were drawn using the R Language statistical package (version 3.3.1).

3. Results and Discussions

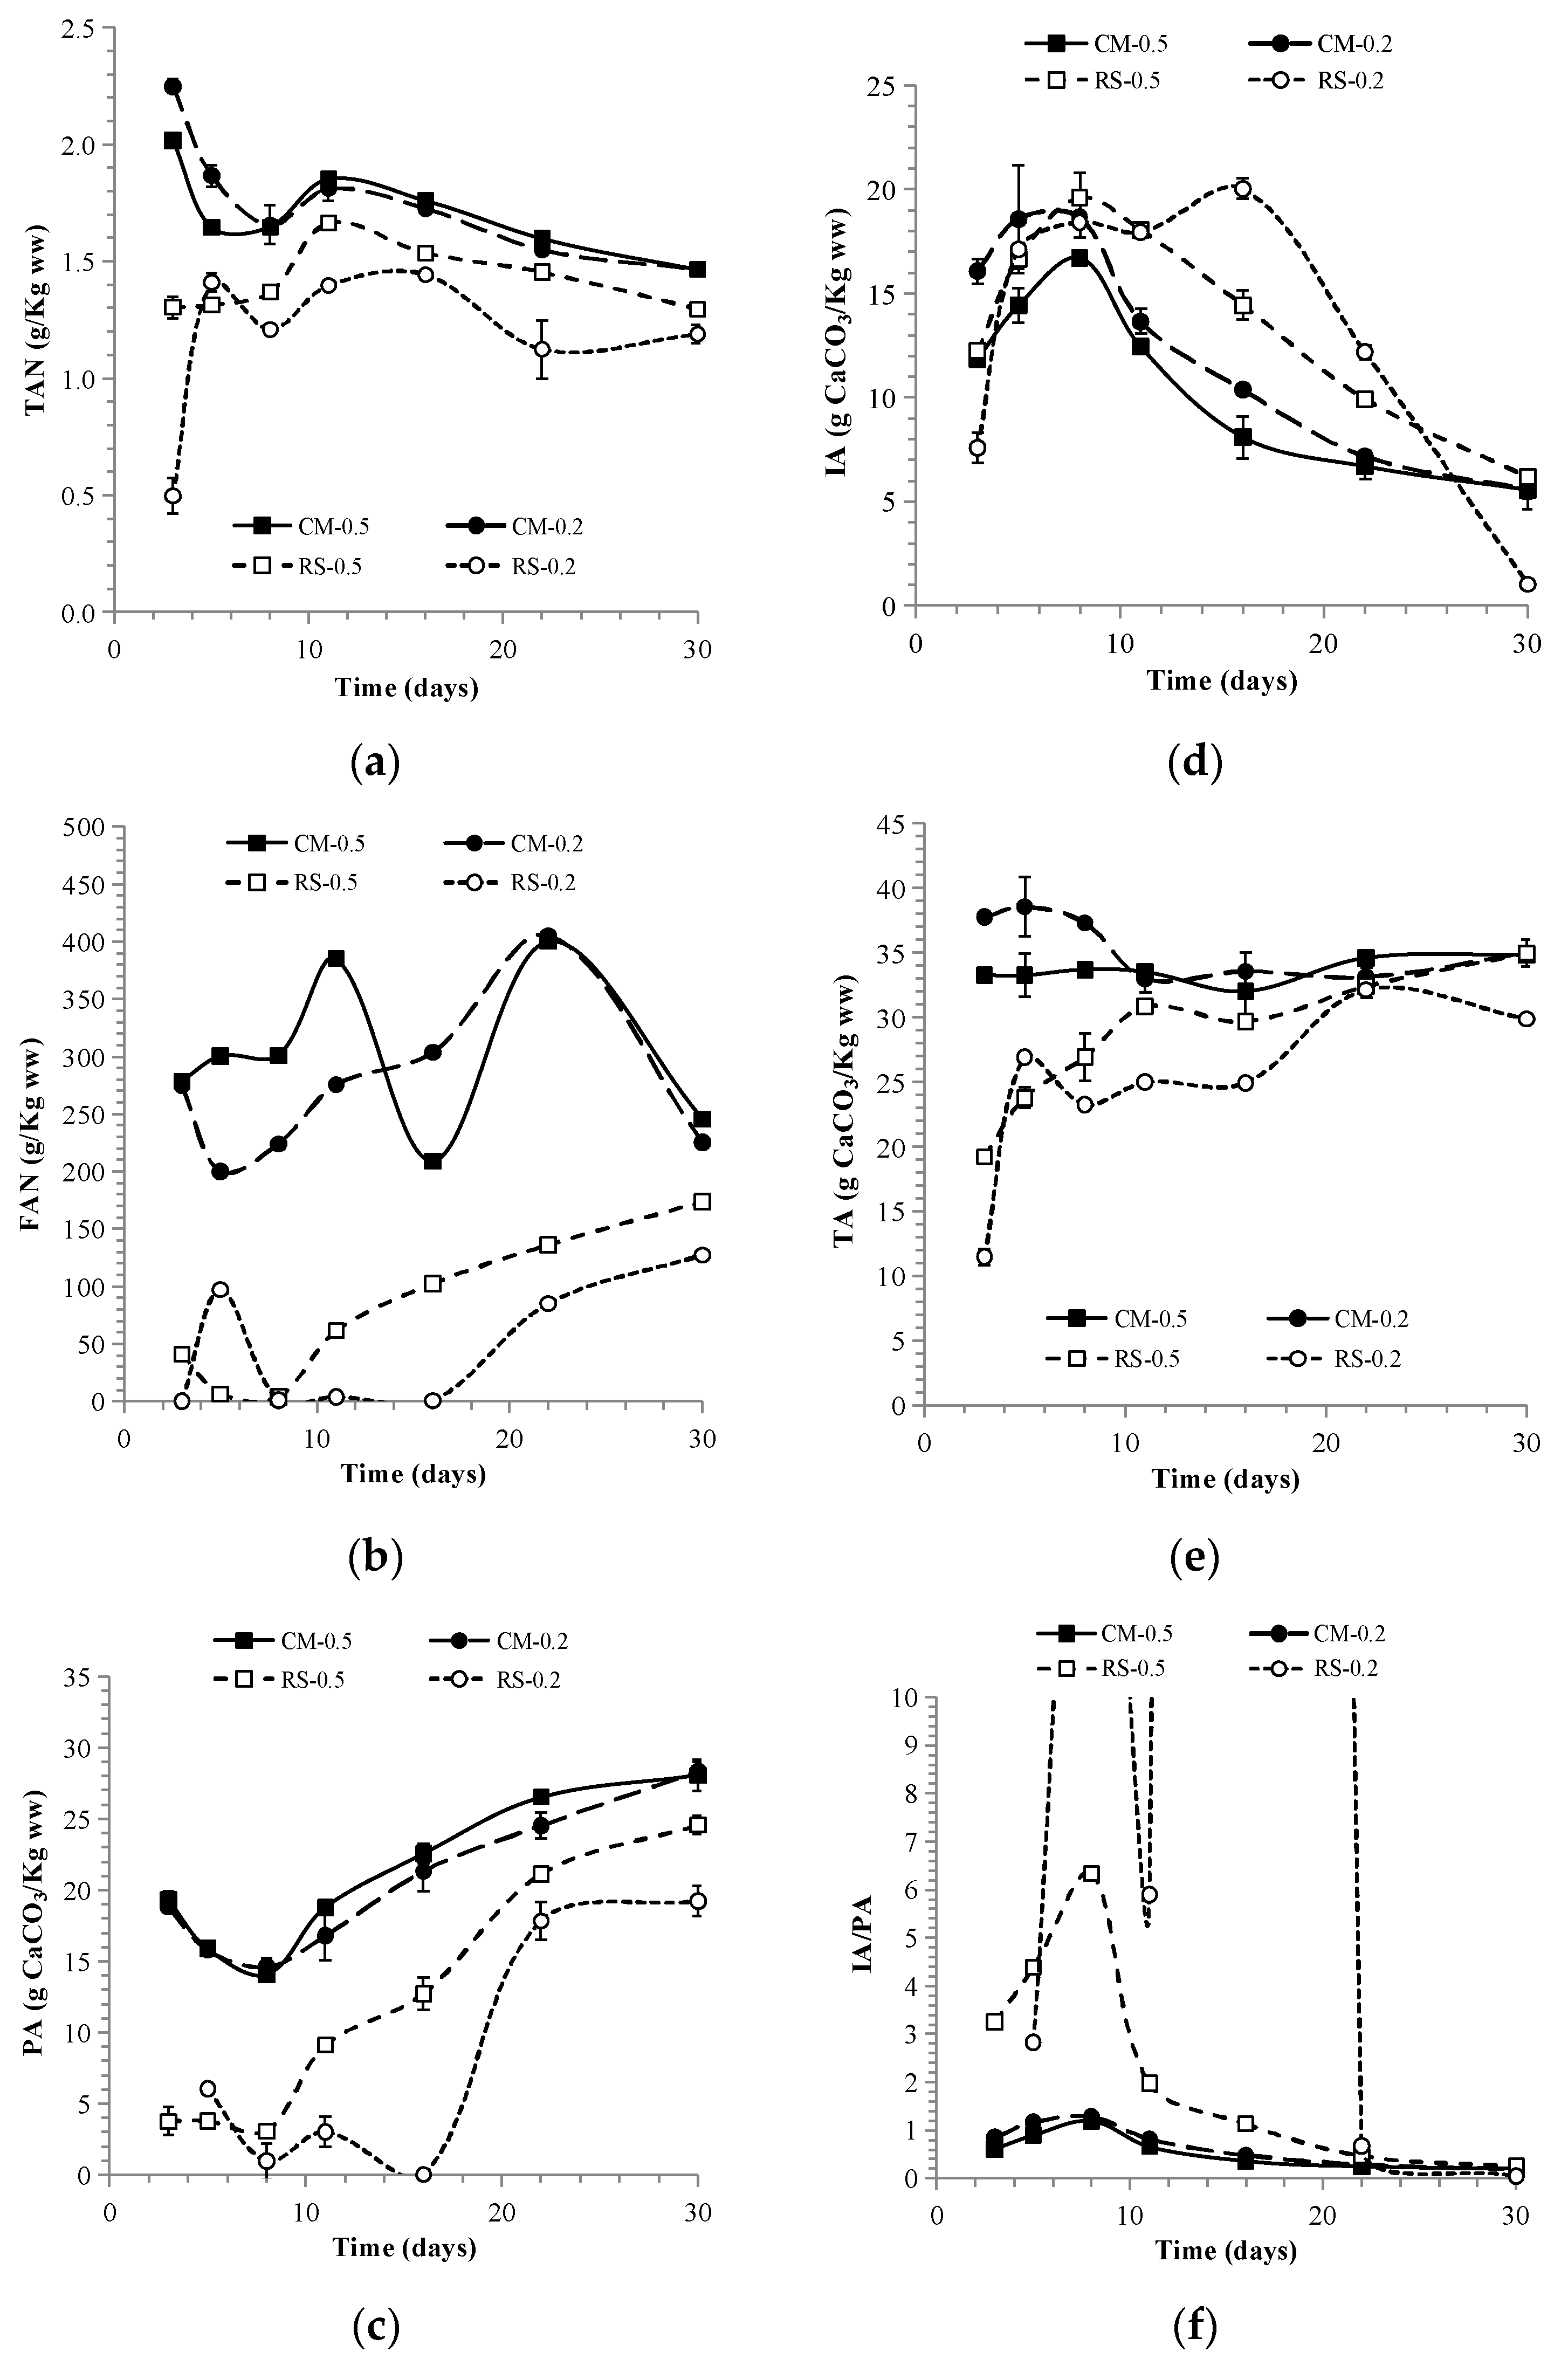
3.1. Operation Parameters

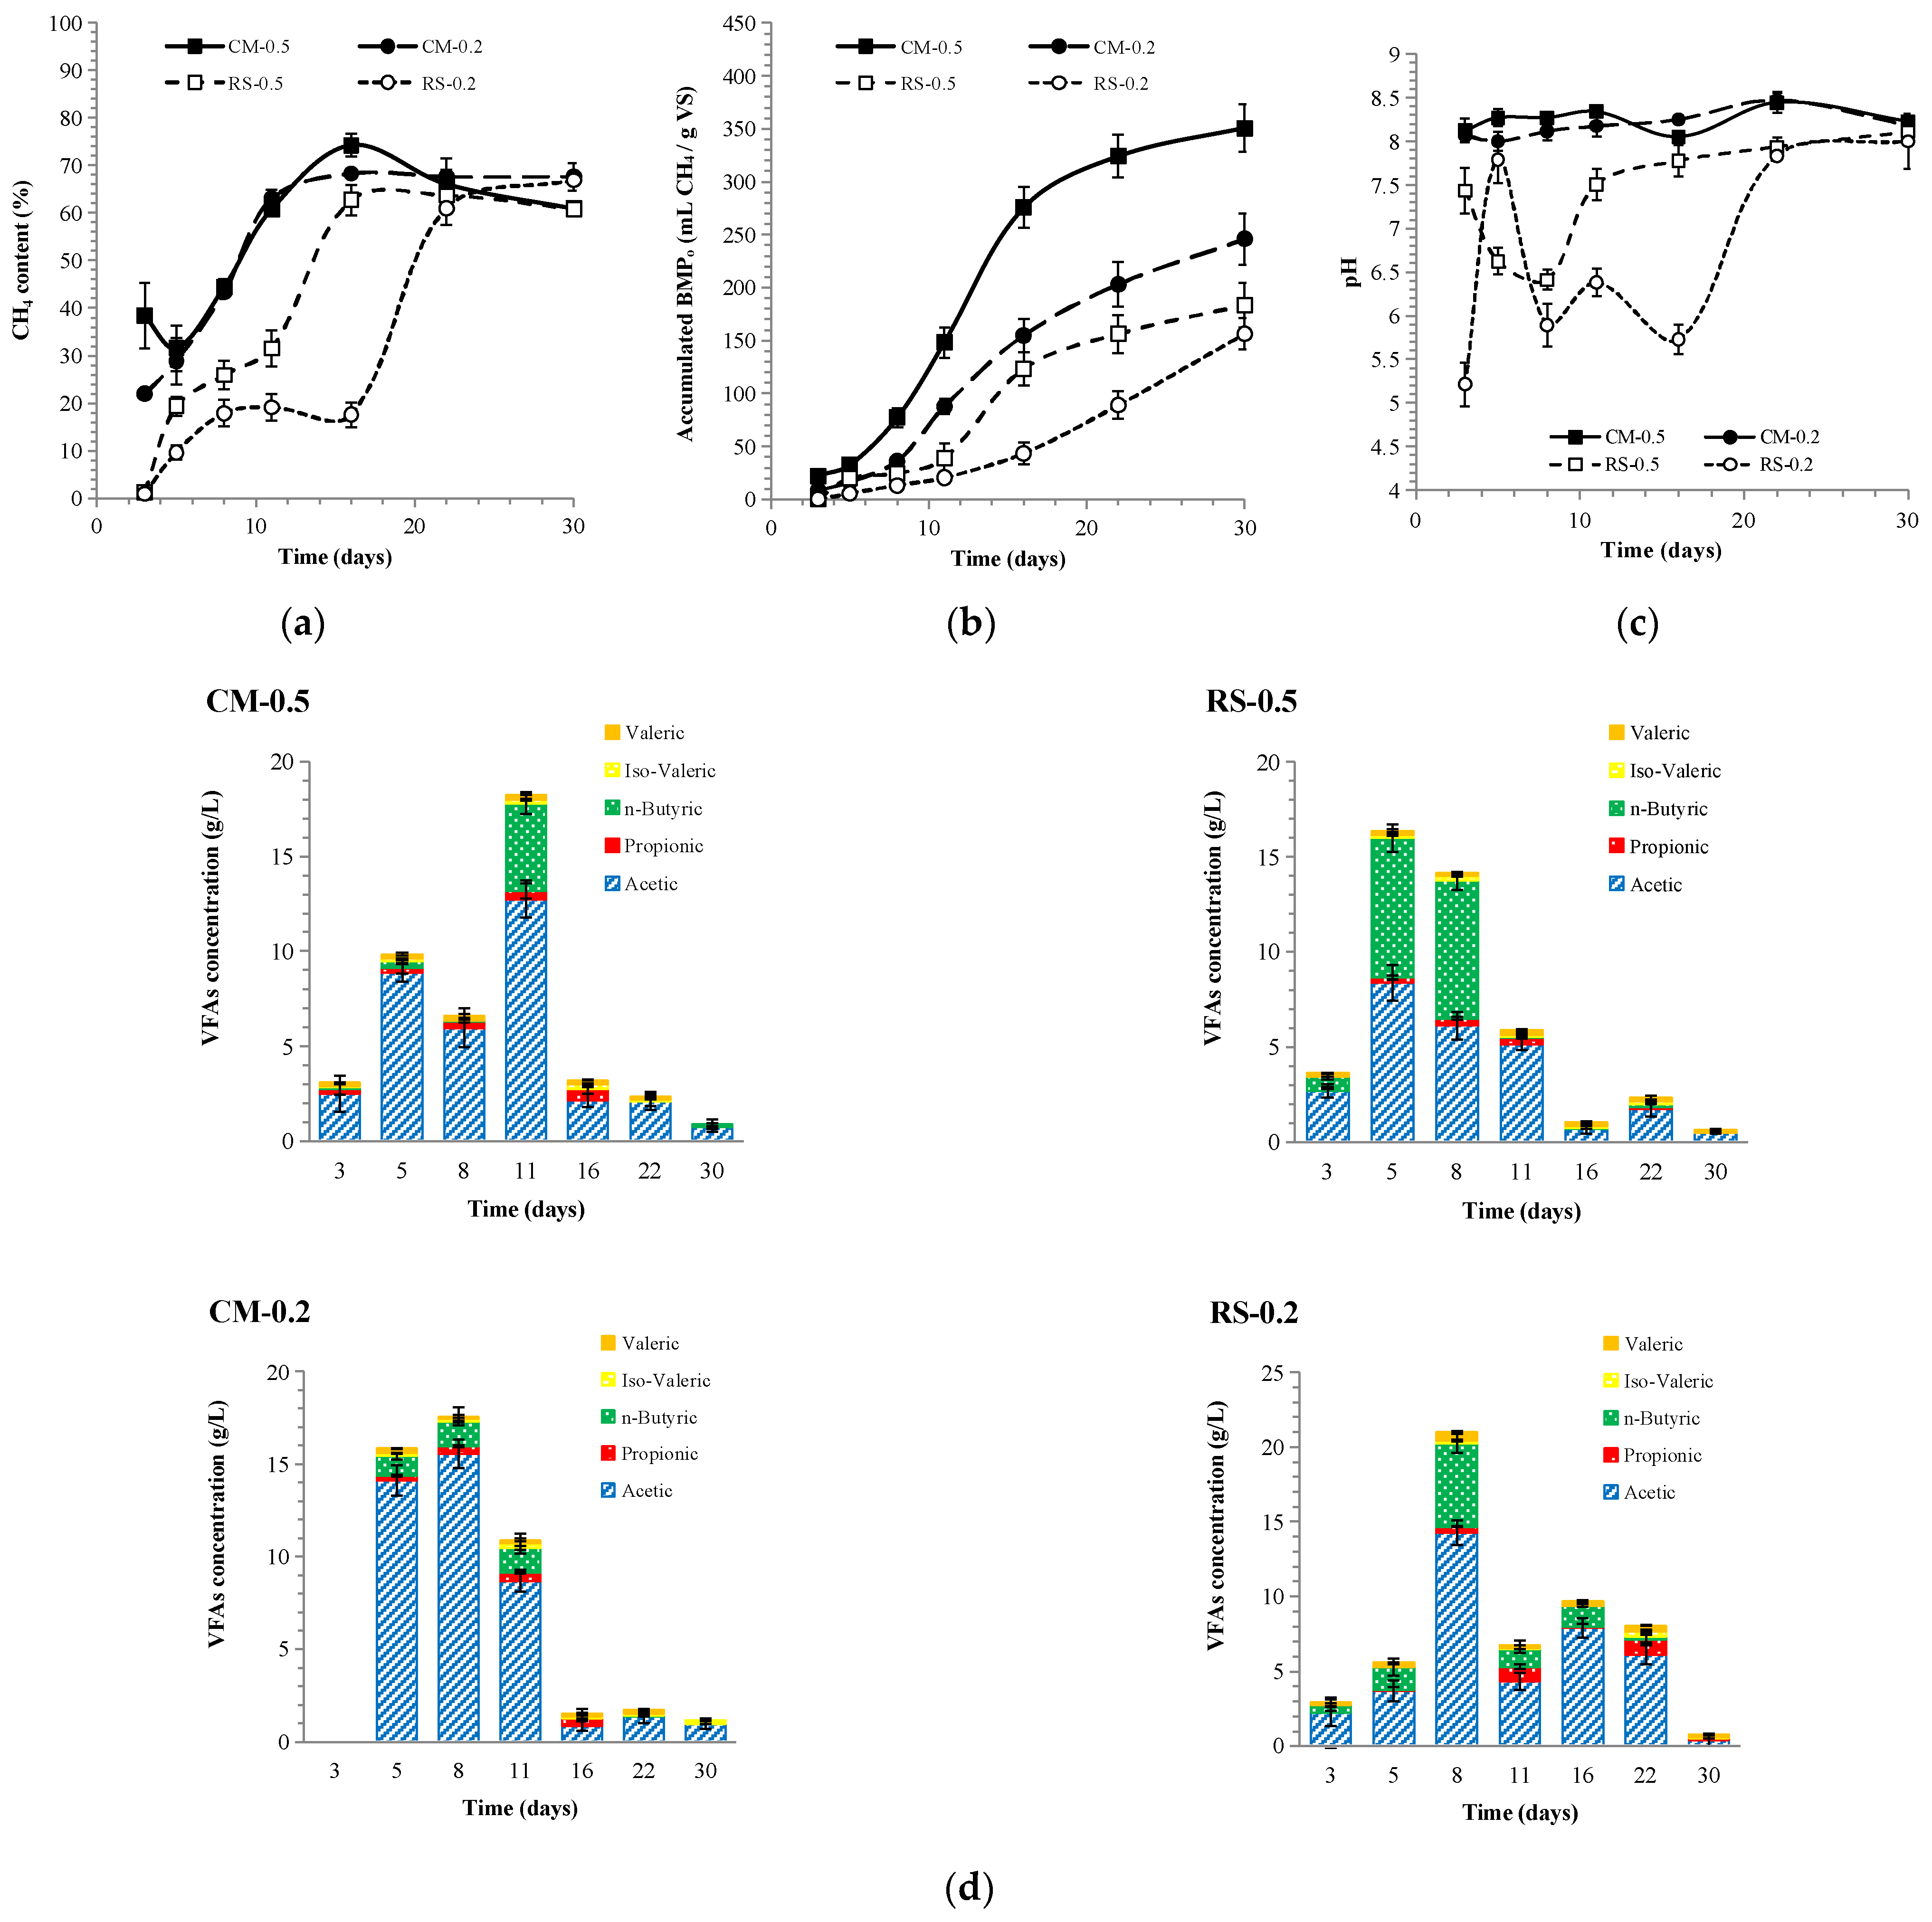
3.1.1. The Anaerobic Digestion Performance of Mono- and Co-Feedstocks

Table S1 shows the basic characteristics of the inoculum and feedstock and their corresponding TMC and BMPu results. The BMPu of CM and RS were 519 ± 9 and 422 ± 2 mL CH4/g VS, respectively. The theoretical BMPu of co-AD from CM and RS, with a VS weight ratio of 1:1, was 471 mL CH4/g VS. According to previous reports, the BMPu of RS and CM are 486–506 mL/g VS and 491–592 mL/g VS, respectively [23]. The actual BMPo of RS and CM are approximately 51–300 mL/g VS and 127–329 mL/g VS, respectively [14,15,16].
The methane content and accumulated BMPo of mono- and co-AD are shown in Figure 2a,b. A striking methanogenic contrast between the mono-AD results of CM and RS can be observed. For CM-0.5-CK and CM-0.2-CK, the methane content climbed from an initial ~35% to a final >65% within 14 days, being slightly higher than their TMC of 59% due to their high alkalinity and consequent strong CO2 absorption. Finally, the BMPo values of CM-0.5-CK and CM-0.2-CK reached 266 and 206 mL/g VS, with a continued growth trend, engendering 51% and 40% fds and 3.6 ± 0.6 d and 5.6 ± 0.6 d lag times, respectively. However, both groups subjected to mono-AD of RS failed, with a methane content <5% and BMPo < 3 mL/g VS, which might be attributed to the low I/S ratio.
The methanogenic properties showed that an I/S = 0.5 was sufficient to boost co-AD. The methane content and BMPo of RSCM-0.5-CK (198 mL/g VS) resembled those of CM-0.5-CK, consistent with a 35-day process of co-AD (197 mL CH4/g VS) with a VS ratio of RS/CM = 1/2 [24]. Other reported BMPo values for the co-AD of RS and CM are higher than ours due to the lower OLR (6 kg VS/(m3 d)) [14], higher I/S ratio (TS = 3% and I/S = 1) [25], or additives adopted (1% limonite) [26]. However, when applying low I/S ratios of 0.25 and 0.5 in the co-AD of corn straw and food waste, the BMPo was negligible [27]. Methane yield growth in co-AD was deemed to be linked to a significant increase in the OLR [28]. A higher OLR seemed to afford a more resilient community in the face of inhibitors [29], but an excessively high OLR provoked losses in terms of acidification and the methane yield, probably because it inhibited the acidogens [30]. The OLR might be a key parameter in the co-AD of straws and CM or their analogues [31]. With a batched loading of 60 g VS/L, the BMPo for RSCM-0.5-CK was higher than the calculated BMPw (153 mL/g VS), elucidating a synergistic effect. However, RSCM-0.2-CK produced a BMPo (46 mL/g VS) that was lower than its BMPw (119 mL/g VS), implying an antagonistic effect. This suggested that there is a lower limit of the I/S ratio, above which synergy can be observed in co-AD. Though RSCM-0.2-CK showed operation initiation with a final methane content of 65%, its data deficiency precluded a kinetics study. In one study, the lag time in the co-AD of straws and chicken manure was shorter than that for the mono-AD of each feedstock [32]. In another, a larger RS/CM ratio shortened the lag time from 12.83 d to 5.44 d [25]. Both studies indicated the effects of straws in reducing lag time in co-AD with manure.
Methane production is closely linked to extracellular metabolites, including H+ (expressed as pH), ammonia (TAN and FAN), substances causing alkalinity (PA, IA, and TA), and VFAs (acetic, propionic, butyric, isovaleric, and valeric acids). Their concentration variations in mono- and co-AD are shown in Figure 2c–e and Figure 3. The digestible and nitrogen-rich nature of CM endowed CM-0.2-CK and CM-0.5-CK with high TAN levels of ~1.9 and ~1.6 L/Kg ww, respectively. This led to a pH fluctuating around the value of 8, caused a PA and TA higher than those for the mono-AD of RS and co-AD, and produced a FAN level as high as 250–300 mg/L. Because of its higher CM portion, CM-0.2-CK exhibited higher a TAN, FAN, and TA than CM-0.5-CK. Probably due to cytotoxic inhibition caused by the diffusibility of FAN into methanogen cells [21], a 27% lower BMPo was obtained for CM-0.2-CK as compared to CM-0.5-CK. With acetic acid as the major contributor, the total VFAs in CM-0.5-CK sharply declined from 21 g/L on day 5 to 4 g/L on day 8. In the case of CM-0.2-CK, the VFAs showed two lower peaks of 16 g/L on day 5 and 10 g/L on day 11 and declined to <3 g/L on day 14. In a comparable study on food waste with an I/S ratio = 0.25 and OLR = 60 g VS/L, methane production ceased within 3 days as the pH dropped to 4.3 as result of instant VFA surge [3]. Though butyrate growth occurred on day 8 in CM-0.2-CK, it did not exert any obvious influence on the pH or IA. Meanwhile, the IA/PA ratios of CM-0.5-CK and CM-0.2-CK dropped from 0.9 to 0.2 and from 1.3 to 0.3, respectively, implying the benign AD operation of CM.
The pH of 5.2–5.9 in RS-0.5-CK and RS-0.2-CK resulted in undetectable PAs and VFAs rising from 8 to 15 g/L and 2 to 13 g/L, with butyric acids amounting to 16–28% and 25–35%, respectively. The pH range of 5.0–5.5, with acetic and butyric acids as major acidifiers, can indicate butyrate-type fermentation [8], combined with a boom in the number of bacteria and disappearance of archaea [33]. The rise in the lag of IA and acidogenesis, as well as the low TA and pH, reflect methanogenic failure in the mono-AD of RS.
Feedstock mixing can be used to reform chemical composition and degradability so as to adjust intermediate metabolites [17]. Both co-AD groups exhibited mid-metabolites levels between the mono-AD of CM and RS. Through co-AD, RSCM-0.5-CK displayed a metabolite distribution close to that for the mono-AD of CM and also resulted in methane production. The total VFA content in RSCM-0.5-CK was initially >32 g/L with 33% butyric acid but finally reduced to 0.7 g/L with undetectable levels of propionic and butyric acids. The rise in pH and drop in VFAs suggest a smooth methanogenic process [3]. This changed the methane content from 40% (day 11) to 67% (day 14). However, in RSCM-0.2-CK, the pH slowly climbed from 6.2 (day 11) to 7.8 (day 29), and the VFAs slowly declined from 15 g/L (day 11) to 8 g/L (day 29), with 27–42% butyric acids.

3.1.2. The Performance of the Four-Stage–Two-Phase Anaerobic Digestion System

The variations in the methanogenic properties of 4S2P-AD are shown in Figure 4a,b. The methane contents for CM-0.5 and CM-0.2 increased gradually from 32% and 22%, respectively, to over 60% on day 11, matching that for the mono-AD of CM. Although the lag times for CM-0.5 (4.8 ± 0.5 d) and CM-0.2 (5.2 ± 0.4 d) were similar to those of CM-0.5-CK and CM-0.2-CK, their accumulated BMPo values reached 350 and 245 mL/g VS, being 32% and 20% higher than those of CM-0.5-CK and CM-0.2-CK, respectively. Moreover, the calculated Rmax values of CM-0.5 (25.5 ± 2.2 d−1) and CM-0.2 (14.4 ± 0.8 d−1) were higher than those of CM-0.5-CK (11.9 ± 0.8 d−1) and CM-0.2-CK (9.5 ± 0.5 d−1). In contrast to the absence of a methane yield from the mono-AD of RS, the methane contents for RS-0.5 and RS-0.2 showed similar growth trends to co-AD. Additionally, the methane content of RS-0.2 exceeded 60% at an earlier stage (day 22) than RS-0.2-CK (day 29). The accumulated BMPo values reached 183 and 156 mL/g VS in RS-0.5 and RS-0.2, respectively, which matched the value for RSCM-0.5-CK and were higher than that of RSCM-0.2-CK, showing encouraging signs of methanogenic promotion. The Rmax of RS-0.5 (12.5 ± 2.2 d−1) was higher than that of RSCM-0.5-CK (9.0 ± 0.4 d−1), with the lag time of the former (6.8 ± 1.1 d) being similar to that of the latter (6.4 ± 0.5 d). The Rmax and lag time of RS-0.2 were 8.7 ± 0.4 d−1 and 12.0 ± 0.8 d, respectively, thus showing better methanogenic properties than RSCM-0.2-CK. The power of RS to enhance the methane yield and the shorten lag time was thus proven and can be ascribed to re-circulation [15].
Based on our calculation, the averaged BMPo of the four reactors within 4S2P-AD was 234 mL/g VS, being 96% higher than the averaged value for the four single mono-ADs (119 mL/g VS) and 91% higher than that of the two single co-ADs (122 mL/g VS). Additionally, the averaged BMPo of 4S2P-AD was higher than its calculated BMPw (134 mL/g VS). With the highest individual fd of 68% for CM-0.5 and lowest value of 37% for RS-0.2, the overall fd of 4S2P-AD was 50%, being higher than the values for RSCM-0.5-CK (42%) and RSCM-0.2-CK (10%). These results indicated synergy within the four stages of 4S2P-AD.
The metabolite variations in 4S2P-AD are shown in Figure 4d and Figure 5. Due to leachate transfer, the pH, TAN, FAN, and TA displayed fluctuating curves, especially in the case of RS-0.2. Contrary to the rising tendency in mono- and co-AD, the TAN declined in the CM stages, with a convergent level at 1.2–1.5 g/L. The same trend was observed in the pH values, finally converging within a narrow range of 8–8.2 after RS-0.2 wavered in a wide range of 5.2–7.8 in the early stage. As the leachate was transferred from the CM stages, with high alkalinity, to the RS stages, and in reverse, from the RS stages, with plentiful VFAs, to the CM stages, the pH for RS-0.2 climbed to reach over 7 at an earlier stage than RSCM-0.2-CK. Similarly, in high-solid AD, the two-stage process showed better resistance and a higher pH than co-AD [3].
According to the VFA peak values of 18 g/L (day11), 16 g/L (day 5), 18 g/L (day 8), and 21 g/L (day 8) for CM-0.5, RS-0.5, CM-0.2, and RS-0.2, respectively, leachate transfer also successfully eliminated VFA accumulation. Shortly after VFA peaks appeared, butyrate-type fermentation occurred in CM-0.5, RS-0.5, and RS-0.2, while acetate-type fermentation was maintained in CM-0.2. The observation of butyrate-type fermentation in RS-0.5 and RS-0.2 verified that the leachate re-circulation to AP would cause dominant VFA changing to butyrate [34]. In contrast to the trend of constant VFA increase in the mono-AD of RS and co-AD with I/S = 0.2, VFA wipe-out in the two RS stages proved the advantages caused by acidic/alkaline leachate interchange. In fact, an I/S = 0.5 was deemed sufficient to produce VFAs in AP, but would induce MP failure when handling lignocellulosic hydrolysate [33]. In addition, propionic acid, which thermodynamically resists degradation, decelerates VS removal and sustains methanogenesis via the hydrogenotrophic pathway, and its level will rise at high OLRs or low I/S (0.5) [33,35]. However, even with the lower I/S (0.2) used here, methanogenesis was successfully launched, with a drop in VFAs and propionic acid to below the inhibition level. Moreover, although the FAN peaks (~400 mg/L) were higher in the CM stages than in the mono-AD of CM (~300 mg/L), they were still below the reported toxicity threshold (630 mg FAN/L at pH 8 and 37 °C) [21]. This partially explains the resilience of 4S2P-AD to VFA accumulation.

3.1.3. The Function of Leachate Interchange

In a mechanistic study on two-phase AD, the re-circulation of both metabolites and microbes within leachate to AP was found to alleviate microbial loss, ameliorate community structure, enhance system resistance, and improve functional gene encoding in VFA biosynthesis. This stimulated hydrolytic enzymes and yielded 2.3–4.2-fold increases in the quantity of metabolites [34]. Moreover, leachate re-circulation could not only ensure stability in AP by providing a buffer from MP but also accelerated the conversion of VFAs to methane via the dilution and homogenization of the metabolites generated in AP [36]. A proper re-circulation ratio could enhance acetic-acid- and H2-producing activities and build a powerful methanogenic community [36]. In this study, the functions of leachate interchange resembled re-circulation in the published reports but showed a more sophisticated pattern. In a single transfer, the leachate passes from one or more anterior stages to one or more posterior stages and then proceeds periodically vice versa. In addition to dispersing toxins and balancing nutrients, it can also be complementarily re-inoculated, creating more spatial heterogeneity than that observed in two stages. Moreover, the four stages can lead to alternating switchovers between light and heavy loading so as to avoid instability caused by long-term, high-load operation. Hence, 4S2P-AD can be stabilized without persistent VFA accumulation, even at low I/S ratios and high OLRs.

3.2. Microbial Structure Distributions

3.2.1. Microbial Community Structure Dynamics

According to the results of the alpha diversities (Figure S1), both the bacterial richness and methanogens richness in 4S2P-AD dropped. The former might be caused by stricter anaerobic conditions throughout the AD process, while the latter might be due to inevitable oxygen dissolution in leachate transfer using a syringe. Even so, higher methanogenic properties were observed in 4S2P-AD, suggesting that the archaeal population size is not the absolute factor determining the methanogenic properties. The archaeal alpha diversity decreased sharply in 4S2P-AD, which marked a difference from single-phase AD and was a consequence of both the loss of OTUs and the expansion of dominant archaea. One possible reason for this trend is that reactors dominated by acetotrophic methanogens support lower phylogenetic diversity than those occupied by hydrogenotrophic methanogens [37]. Another possibility is that the re-inoculation causes microflora to transform from a diversity of various species to a uniformity of dominant species [33]. Similarly, the bacterial diversity of CM-0.5/CM-0.2 decreased. All the above results imply that the 4S2P-AD was prone to selecting, trimming, and maintaining microflora in both CM and RS reactors by enriching the dominant species. According to one study, the more diverse the microbes are, the better the methanogenic performance is [38]. However, in this study, better methanogenic properties corresponded to lower archaeal diversity.
According to the findings of bacterial (phylum-level) community structure studies (Figure S2a), Firmicutes and Bacteroidetes, the two typical dominant hydrolytic phyla in mesophilic AD [34,39], were also prevalent in this study, with average proportions of 51% and 30% in the control groups and 43% and 40% in 4S2P-AD, respectively. Throughout 4S2P-AD, the relative abundance of Firmicutes and Bacteroidetes, together, declined from 82% to 75% in the CM reactors, while it fluctuated around 85%–90% in the RS reactors. Notably, these two phyla showed negative correlations in abundance. In particular, when I/S = 0.2, their correlation coefficients were −0.97 and −0.90 with R2 = 0.95 and 0.82 in RS-0.2 and CM-0.2, respectively, implying competition between these two phyla. This finding supports Zhao’s view that Bacteroidetes and Firmicutes compete for dominance in AP [40]. Firmicutes uses complex organics, including proteins and refractory lignocellulose, especially at high TAN levels [41]. Abundance in Firmicutes is reported to be positively correlated with the acidogenic efficiency of RS [42], corresponding to the low pH in RS-0.5 and RS-0.2 (Figure 4c). Bacteroidetes also accelerates acidification via the conversion of a variety of carbohydrates and proteins into VFAs [4,33,40]. Their similar functions may lead to the negative correlations. In total, there was no distinct disparity, but rather a balance of bacterial phyla within the four stages of 4S2P-AD.
In the archaeal (genus-level) community structures (Figure S2b), methanogens dominated. In the control groups, the top archaea genera were Methanosarcina (with an average proportion of 33.7%), Methanoculleus (12.5%), and Methanosaeta (12.1%). In the 4S2P-AD groups, they were Methanosarcina (50%), Methanobrevibacter (13.1%), and Methanosaeta (10.8%). Methanosarcina, often dominant in AD from manure, is the only known methanogen that is capable of employing both acetotrophic and hydrogenotrophic methanogenic pathways, while Methanosaeta is an obligative acetate eater and adept in utilizing acetate at low levels [37,43]. This physiological characteristic caused Methanosaeta to exhibit dominance in RS-0.2-CK and RS-0.5-CK on days 3 and 8. Other methanogens adopt hydrogenotrophic methanogenesis or methylotrophy [43].
The diversity of methanogens dispersed in the control groups implied heterogenous community evolution. RSCM-0.2-CK displayed a unique community structure with Methanosphaera prevailing on day 8 (42.8%), in line with the syntrophic acetogenic conditions required for Firmicutes and Tenericutes to thrive. As Methanosphaera declined, the hydrogenotrophic Methanofollis occupied the gap (45.9%). Failure to form a normal methanogenic community might have contributed to the failure of RSCM-0.2-CK. Likewise, without Methanosarcina, the mono-AD of RS also fostered an abnormal distribution, with strictly hydrogenotrophic Methanoculleus and Methanocorpusculum as the main flora.
In 4S2P-AD, in place of Methanobrevibacter, Methanosaeta, and Methanocorpusculum, Methanosarcina gradually came to form the majority share (>80%). Methanosarcina was dominant in MP, with an HRT of 17 days [2] or with re-circulation [44]. This dominance suggests that the HRT in this study was enough to favor proper methanogens. However, it is contrary to the findings that microbial diversity was higher in two-phase AD than in single-stage AD [45] and that Methanosaeta was the dominant genus in MP when applying co-AD in a two-phase AD process [31]. These disparities may be attributed to the unique leachate flow mode in 4S2P-AD. In typical two-phase ADs, there is a one-way flow from AP to MP, while in 4S2P-AD, a periodic multi-directional flow pattern is carried out. That is, the deviations in properties in the four units were not as clear as those in two-phase AD. With Methanosarcina flourishing even in RS-0.2, the system’s stability was increasingly reinforced.
Methanosarcina mainly produces methane via acetic acid cleavage in favorable conditions [46] but can survive via hydrogenotrophic methanogenesis in adverse situations [43]. This is probably why Methanosarcina was selected and retained. It can tolerant a TAN level of 0.7 g/L and FAN of 0.08 g/L [47] or an acetic acid level of 15 g/L [46]. Thus, it is unsurprising that Methanosarcina was prevalent in 4S2P-AD, the mono-AD of CM, and co-AD with an I/S = 0.5 at TAN > 2 g/L and acetic acid > 10 g/L, levels which would impair the viability of other acetolactic methanogens [2]. In RS-0.2, Methanosarcina only accounted for 5.2% on day 8. The reason for this might be an excessively high level of VFAs of >20 g/L, which resulted in the recession of all the methanogens, including Methanosarcina. Methanosarcina first increased and then decreased in the mono-AD of CM and co-AD, with an I/S = 0.5. However, in 4S2P-AD, it continuously increased as a result of both systematical selection under loading alternation and the structural and functional basis serving to maintain stable methanogenesis. Methanosarcina might be a key factor in coordinating synergy in 4S2P-AD.

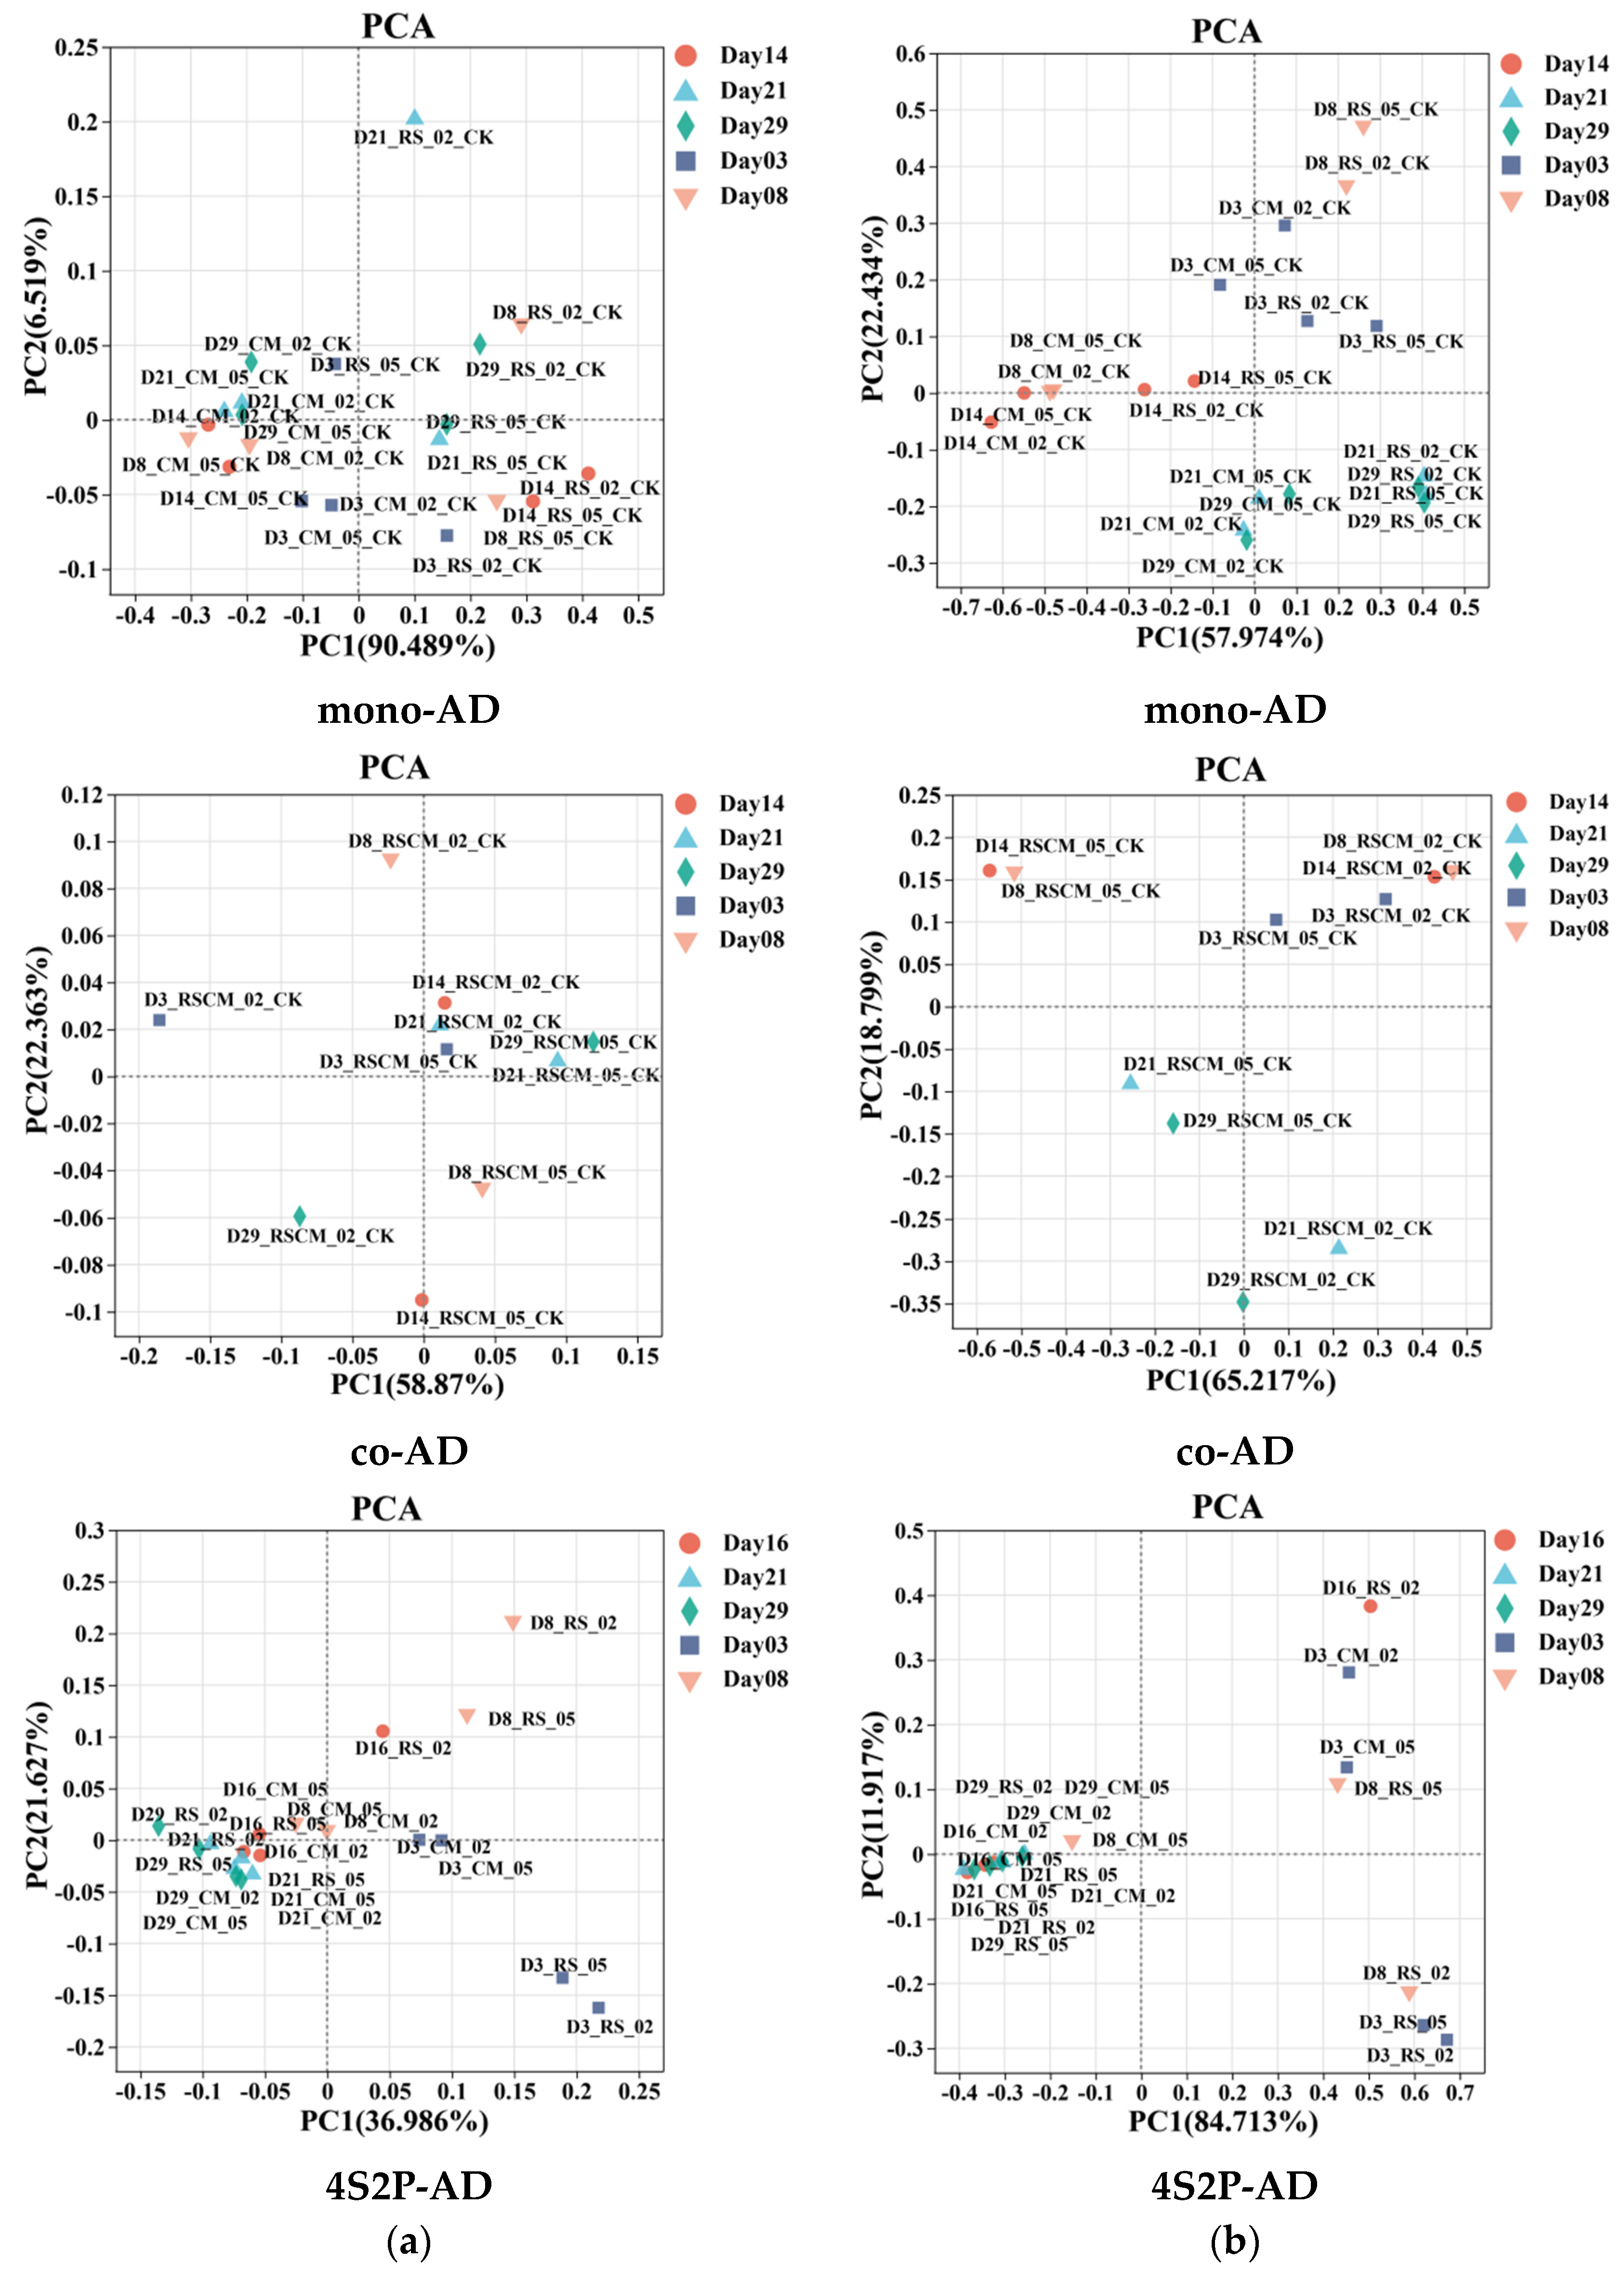
3.2.2. Microbial Diversity Similarity between Different Reactors

The dynamics of the bacteria phyla and methanogen genera, along with the AD time, investigated via PCA, are shown based on the matrix distance between samples (Figure 6a,b). The microbes in the four units of 4S2P-AD were originally scattered but then finally converged and clustered, showing strong correlations with time. Similarly, a narrower bacterial community was accompanied by the disappearance of partial initial microbes in a cascade AD process with four reactors and recirculation [48]. The diversity dynamics were deemed to be related to the proliferation of microbes acclimatized to dominant conditions [4]. In 4S2P-AD, the dominant conditions were homogenized via leachate exchange, resulting in the disappearance of microbial distances. However, the mono-AD and co-AD groups did not produce similarly strong correlations, implying uncertainty in microflora evolution during single-phase AD. In mono-AD, the archaeal diversity was almost clustered according to the AD time, while in co-AD, it was clustered according to the I/S ratio. The similarity discrepancies demonstrated that the microfloral homogenization in 4S2P-AD was a consequence of leachate shuttling, i.e., repeated inoculation and directed proliferation, rather than a result of the AD time. In this way, the targeted functional microbes flourished to promote community maturation and methanogenic function, building a physiological basis for synergy in 4S2P-AD.
The heat maps of bacterial phyla similarity on day 3 (Figure S3) showed a strong positive correlation when using the same feedstock, regardless of the I/S ratio or AD pattern. Then, on day 29, strong positive correlations were observed in groups with good methanogenesis (four 4S2P-AD stages: CM-0.5-CK, CM-0.2-CK, and RSCM-0.5-CK). Negative correlations between these groups and the other three groups, which failed, proved that 4S2P-AD promoted RS degradation, probably via re-inoculation from MP to AP.

3.3. Perspectives

Multi-stage AD promotes stability and efficiency [1], especially with refractory substrate and/or toxins. The multiple stages regulate variables, optimize conditions for microbes, assure organics removal, and stabilize the process [9]. The 4S2P-AD process combined the multi-stage concept with the benefits of co-AD to produce synergy. Therefore, it can simultaneously handle C- and N-rich wastes with high TS, helping to advance AD technology for treating agro-wastes.
As leachate flows back and forth through the four interconnected reactors, the dynamics of a 4S2P-AD process are more intricate than those of the traditional co-AD and two-phase AD, presenting more challenges but enhancing the study of its control system design. The 4S2P-AD analysis in this study was a tentative experiment. In future, the whole 4S2P-AD process could be carried out in one reactor, with multiple small units for phase division. Suitable percolating devices could be placed between the small units to achieve the reciprocating motion of the leachate by periodically shifting the reactor upside down based on the design parameters. As long as the corresponding functions of both multi-phase and co-AD are achieved, this process could also be realized using other process designs, e.g., using both up-flow and down-flow pumping in a series of tandem reactors. Furthermore, the validation of the continuous process based on the batched pattern requires optimization and development. Noticeably, the decision on HRT and OLR ought to be paid more attention, because it determine the growth kinetics of the microbes and the overall performance of the whole system [49]. The other operation parameters and reflux strategy should also be improved and determined during technological upgrading. Additionally, understanding the phylogenetic diversity and functional dynamics of the microbial community will aid in process optimization and methanogenesis by enabling the calibration of the operational parameters and by enhancing the preferred microbial pathways. For instance, in this study, our predictions of the secondary KEGG functions of the bacterial and archaeal communities (Figure S4) showed that both the bacterial and archaeal communities in the control groups offered less functionality than those in 4S2P-AD. Consequently, the mechanisms of internal stabilization of 4S2P-AD, such as the molecular evolution of microflora accompanied by leachate communications, are worthy of scientific attention.

4. Conclusions

The 4S2P-AD system could co-digest RS and CM with a small inoculum size and high OLR. The multi-path interchange of leachate between different stages could balance nutrients and toxins, shorten the lag time, stimulate efficient bio-conversion by shaping the microbial community with dominant populations (Methanosarcina > 80%), and thus promote healthy AD performance without persistent VFA accumulation. The methane production of 4S2P-AD was 96% and 91% higher than that of mono-AD and co-AD, respectively. Although 4S2P-AD sustained less archaeal diversity, more community functionalities were predicted as compared to mono-AD and co-AD, which might be the genetic basis for the synergy observed in 4S2P-AD.

Supplementary Materials

The following supporting information can be downloaded at: https://www.mdpi.com/article/10.3390/fermentation9060565/s1, Table S1: Basic characteristics of inoculum and feedstock; Figure S1: Distribution of OTUs among the bacterial and methanogenic archaeal communities in mono-AD, co-AD, and the 4S2P AD system; Figure S2: Microbial community structure bar graph of bacteria on the phylum level and archaea on the genus level; Figure S3: Heat maps showing the similarity degree of the bacterial phyla on day 3 and day 29; Figure S4: Secondary KEGG function prediction map of bacterial and archaeal communities in control groups and 4S2P AD groups.

Author Contributions

Conceptualization, C.S.; data curation, Z.Y., S.Z., X.Z., X.L. and Z.W.; formal analysis, W.C.; funding acquisition, W.C. and C.S.; investigation, S.Z., X.Z., X.L. and Z.W.; methodology, W.C.; supervision, C.S.; visualization, Z.Y.; writing—original draft, Z.Y.; writing—review and editing, J.W., W.C. and C.S. All authors have read and agreed to the published version of the manuscript.

Funding

This research was funded by the National Key Research and Development Program of China (2021YFE0104600), Natural Science Foundation of Zhejiang province, China (LY22E060002), and the Research Innovation Team Funding Project for Undergraduates of Zhejiang Province, China (2022R417A007).

Institutional Review Board Statement

Not applicable.

Informed Consent Statement

Not applicable.

Data Availability Statement

Data are contained within the article and Supplementary Materials.

Conflicts of Interest

The authors declare no conflict of interest.

References

  1. Srisowmeya, G.; Chakravarthy, M.; Nandhini Devi, G. Critical considerations in two-stage anaerobic digestion of food waste—A review. Renew. Sustain. Energy Rev. 2020, 119, 109587. [Google Scholar] [CrossRef]
  2. Gaby, J.C.; Zamanzadeh, M.; Horn, S.J. The effect of temperature and retention time on methane production and microbial community composition in staged anaerobic digesters fed with food waste. Biotechnol. Biofuels 2017, 10, 302. [Google Scholar] [CrossRef] [PubMed]
  3. Li, W.; Loh, K.-C.; Zhang, J.; Tong, Y.W.; Dai, Y. Two-stage anaerobic digestion of food waste and horticultural waste in high-solid system. Appl. Energy 2018, 209, 400–408. [Google Scholar] [CrossRef]
  4. García-Ruíz, M.J.; Castellano-Hinojosa, A.; Armato, C.; González-Martínez, A.; González-López, J.; Osorio, F. Biogas production and microbial community structure in a stable-stage of a two-stage anaerobic digester. AIChE J. 2020, 66, e16807. [Google Scholar] [CrossRef]
  5. Ma, S.-J.; Ma, H.-J.; Hu, H.-D.; Ren, H.-Q. Effect of mixing intensity on hydrolysis and acidification of sewage sludge in two-stage anaerobic digestion: Characteristics of dissolved organic matter and the key microorganisms. Water Res. 2019, 148, 359–367. [Google Scholar] [CrossRef] [PubMed]
  6. Li, Y.; Hua, D.; Xu, H.; Jin, F.; Mu, H.; Zhao, Y.; Fang, X. Acidogenic and methanogenic properties of corn straw silage: Regulation and microbial analysis of two-phase anaerobic digestion. Bioresour. Technol. 2020, 307, 123180. [Google Scholar] [CrossRef] [PubMed]
  7. Chen, X.; Yuan, H.; Zou, D.; Liu, Y.; Zhu, B.; Chufo, A.; Jaffar, M.; Li, X. Improving biomethane yield by controlling fermentation type of acidogenic phase in two-phase anaerobic co-digestion of food waste and rice straw. Chem. Eng. J. 2015, 273, 254–260. [Google Scholar] [CrossRef]
  8. Zhao, Z.; Wang, J.; Li, Y.; Zhu, T.; Yu, Q.; Wang, T.; Liang, S.; Zhang, Y. Why do DIETers like drinking: Metagenomic analysis for methane and energy metabolism during anaerobic digestion with ethanol. Water Res. 2020, 171, 115425. [Google Scholar] [CrossRef]
  9. Cremonez, P.A.; Teleken, J.G.; Weiser Meier, T.R.; Alves, H.J. Two-Stage anaerobic digestion in agroindustrial waste treatment: A review. J. Environ. Manag. 2021, 281, 111854. [Google Scholar] [CrossRef]
  10. Zhang, G.; Shi, Y.; Zhao, Z.; Wang, X.; Dou, M. Enhanced two-phase anaerobic digestion of waste-activated sludge by combining magnetite and zero-valent iron. Bioresour. Technol. 2020, 306, 123122. [Google Scholar] [CrossRef]
  11. Xu, Q.; Luo, T.-Y.; Wu, R.-L.; Wei, W.; Sun, J.; Dai, X.; Ni, B.-J. Rhamnolipid pretreatment enhances methane production from two-phase anaerobic digestion of waste activated sludge. Water Res. 2021, 194, 116909. [Google Scholar] [CrossRef]
  12. Zhao, X.; Liu, M.; Yang, S.; Gong, H.; Ma, J.; Li, C.; Wang, K. Performance and microbial community evaluation of full-scale two-phase anaerobic digestion of waste activated sludge. Sci. Total Environ. 2022, 814, 152525. [Google Scholar] [CrossRef] [PubMed]
  13. Kim, S.-H.; Cheon, H.-C.; Lee, C.-Y. Enhancement of hydrogen production by recycling of methanogenic effluent in two-phase fermentation of food waste. Int. J. Hydrog. Energy 2012, 37, 13777–13782. [Google Scholar] [CrossRef]
  14. Sun, C.; Liu, R.; Cao, W.; Yin, R.; Mei, Y.; Zhang, L. Impacts of alkaline hydrogen peroxide pretreatment on chemical composition and biochemical methane potential of agricultural crop stalks. Energy Fuels 2015, 29, 4966–4975. [Google Scholar] [CrossRef]
  15. Kumar, S.; D’ Silva, T.C.; Chandra, R.; Malik, A.; Vijay, V.K.; Misra, A. Strategies for boosting biomethane production from rice straw: A systematic review. Bioresour. Technol. Rep. 2021, 15, 100813. [Google Scholar] [CrossRef]
  16. Labatut, R.A.; Angenent, L.T.; Scott, N.R. Biochemical methane potential and biodegradability of complex organic substrates. Bioresour. Technol. 2011, 102, 2255–2264. [Google Scholar] [CrossRef]
  17. Hagos, K.; Zong, J.; Li, D.; Liu, C.; Lu, X. Anaerobic co-digestion process for biogas production: Progress, challenges and perspectives. Renew. Sustain. Energy Rev. 2017, 76, 1485–1496. [Google Scholar] [CrossRef]
  18. Aichinger, P.; Wadhawan, T.; Kuprian, M.; Higgins, M.; Ebner, C.; Fimml, C.; Murthy, S.; Wett, B. Synergistic co-digestion of solid-organic-waste and municipal-sewage-sludge: 1 plus 1 equals more than 2 in terms of biogas production and solids reduction. Water Res. 2015, 87, 416–423. [Google Scholar] [CrossRef]
  19. Zhang, J.; Sun, Q.-L.; Zeng, Z.-G.; Chen, S.; Sun, L. Microbial diversity in the deep-sea sediments of Iheya North and Iheya Ridge, Okinawa Trough. Microbiol. Res. 2015, 177, 43–52. [Google Scholar] [CrossRef]
  20. Zhang, C.a.; Hu, C.; Cao, W.; Wang, M.; Hou, F.; Yu, A.; Xie, H.; Lou, J.; Sun, C.; Liu, R. Essential regulators of iron chemical speciation distributions in anaerobic digestion of pretreated food waste: Organic volatile fatty acids or inorganic acid radicals? Bioresour. Technol. 2019, 293, 122051. [Google Scholar] [CrossRef]
  21. Sun, C.; Cao, W.; Banks, C.J.; Heaven, S.; Liu, R. Biogas production from undiluted chicken manure and maize silage: A study of ammonia inhibition in high solids anaerobic digestion. Bioresour. Technol. 2016, 218, 1215–1223. [Google Scholar] [CrossRef] [PubMed]
  22. Ki, D.W. Anaerobic Conversion of Primary Sludge to Resources in Microbial Electrochemical Cells; Arizona State University: Tempe, AZ, USA, 2016. [Google Scholar]
  23. Wang, M.; Cao, W.; Sun, C.; Sun, Z.; Miao, Y.; Liu, M.; Zhang, Z.; Xie, Y.; Wang, X.; Hu, S.; et al. To distinguish the primary characteristics of agro-waste biomass by the principal component analysis: An investigation in East China. Waste Manag. 2019, 90, 100–120. [Google Scholar] [CrossRef]
  24. Pal, D.B.; Tiwari, A.K.; Mohammad, A.; Prasad, N.; Srivastava, N.; Srivastava, K.R.; Singh, R.; Yoon, T.; Syed, A.; Bahkali, A.H.; et al. Enhanced biogas production potential analysis of rice straw: Biomass characterization, kinetics and anaerobic co-digestion investigations. Bioresour. Technol. 2022, 358, 127391. [Google Scholar] [CrossRef] [PubMed]
  25. Mosadegh Ranjbar, F.; Karrabi, M.; Shahnavaz, B. Bioconversion of wheat straw to energy via anaerobic co-digestion with cattle manure in batch-mode bioreactors (Experimental investigation and kinetic modeling). Fuel 2022, 320, 123946. [Google Scholar] [CrossRef]
  26. Xu, L.; Peng, S.; Dong, D.; Wang, C.; Fan, W.; Cao, Y.; Huang, F.; Wang, J.; Yue, Z. Performance and microbial community analysis of dry anaerobic co-digestion of rice straw and cow manure with added limonite. Biomass Bioenergy 2019, 126, 41–46. [Google Scholar] [CrossRef]
  27. Owamah, H.I. Optimization of biogas production through selection of appropriate Inoculum-to-Substrate ((I/S) ratio. Niger. J. Technol. Dev. 2019, 16, 17–19. [Google Scholar] [CrossRef]
  28. Mata-Alvarez, J.; Dosta, J.; Romero-Güiza, M.S.; Fonoll, X.; Peces, M.; Astals, S. A critical review on anaerobic co-digestion achievements between 2010 and 2013. Renew. Sustain. Energy Rev. 2014, 36, 412–427. [Google Scholar] [CrossRef]
  29. Amha, Y.M.; Corbett, M.; Smith, A.L. Two-Phase Improves Performance of Anaerobic Membrane Bioreactor Treatment of Food Waste at High Organic Loading Rates. Environ. Sci. Technol. 2019, 53, 9572–9583. [Google Scholar] [CrossRef] [PubMed]
  30. Merlin Christy, P.; Gopinath, L.R.; Divya, D. A review on anaerobic decomposition and enhancement of biogas production through enzymes and microorganisms. Renew. Sustain. Energy Rev. 2014, 34, 167–173. [Google Scholar] [CrossRef]
  31. Xing, W.; Chen, X.; Zuo, J.; Wang, C.; Lin, J.; Wang, K. A half-submerged integrated two-phase anaerobic reactor for agricultural solid waste codigestion. Biochem. Eng. J. 2014, 88, 19–25. [Google Scholar] [CrossRef]
  32. Zahan, Z.; Othman, M.Z.; Muster, T.H. Anaerobic digestion/co-digestion kinetic potentials of different agro-industrial wastes: A comparative batch study for C/N optimisation. Waste Manag. 2018, 71, 663–674. [Google Scholar] [CrossRef]
  33. Li, Y.; Xu, H.; Hua, D.; Zhao, B.; Mu, H.; Jin, F.; Meng, G.; Fang, X. Two-phase anaerobic digestion of lignocellulosic hydrolysate: Focusing on the acidification with different inoculum to substrate ratios and inoculum sources. Sci. Total Environ. 2020, 699, 134226. [Google Scholar] [CrossRef]
  34. Luo, L.; Xu, S.; Liang, J.; Zhao, J.; Wong, J.W.C. Mechanistic study of the effect of leachate recirculation ratios on the carboxylic acid productions during a two-phase food waste anaerobic digestion. Chem. Eng. J. 2023, 453, 139800. [Google Scholar] [CrossRef]
  35. Toledo-Cervantes, A.; Guevara-Santos, N.; Arreola-Vargas, J.; Snell-Castro, R.; Méndez-Acosta, H.O. Performance and microbial dynamics in packed-bed reactors during the long-term two-stage anaerobic treatment of tequila vinasses. Biochem. Eng. J. 2018, 138, 12–20. [Google Scholar] [CrossRef]
  36. Li, W.; Cai, T.; Lu, X.; Han, Y.; Kudisi, D.; Chang, G.; Dong, K.; Zhen, G. Two-Phase improves Bio-hydrogen and Bio-methane production of anaerobic membrane bioreactor from waste activated sludge with digestate recirculation. Chem. Eng. J. 2023, 452, 139547. [Google Scholar] [CrossRef]
  37. Lim, J.W.; Chen, C.L.; Ho, I.J.R.; Wang, J.Y. Study of microbial community and biodegradation efficiency for single- and two-phase anaerobic co-digestion of brown water and food waste. Bioresour. Technol. 2013, 147, 193–201. [Google Scholar] [CrossRef]
  38. Tang, F.; Tian, J.; Zhu, N.; Lin, Y.; Zheng, H.; Xu, Z.; Liu, W. Dry anaerobic digestion of ammoniated straw: Performance and microbial characteristics. Bioresour. Technol. 2022, 351, 126952. [Google Scholar] [CrossRef] [PubMed]
  39. Wang, P.; Wang, H.; Qiu, Y.; Ren, L.; Jiang, B. Microbial characteristics in anaerobic digestion process of food waste for methane production–A review. Bioresour. Technol. 2018, 248, 29–36. [Google Scholar] [CrossRef]
  40. Zhao, Y.; Wu, J.; Yuan, X.; Zhu, W.; Wang, X.; Cheng, X.; Cui, Z. The effect of mixing intensity on the performance and microbial dynamics of a single vertical reactor integrating acidogenic and methanogenic phases in lignocellulosic biomass digestion. Bioresour. Technol. 2017, 238, 542–551. [Google Scholar] [CrossRef] [PubMed]
  41. Sieber, J.R.; McInerney, M.J.; Gunsalus, R.P. Genomic insights into syntrophy: The paradigm for anaerobic metabolic cooperation. Annu. Rev. Microbiol. 2012, 66, 429–452. [Google Scholar] [CrossRef] [PubMed]
  42. Chen, S.; Cheng, H.; Wyckoff, K.N.; He, Q. Linkages of Firmicutes and Bacteroidetes populations to methanogenic process performance. J. Ind. Microbiol. Biotechnol. 2016, 43, 771–781. [Google Scholar] [CrossRef] [PubMed]
  43. Timmis, K.N. Handbook of Hydrocarbon and Lipid Microbiology; Springer: Berlin/Heidelberg, Germany, 2010. [Google Scholar]
  44. Wu, L.-J.; Higashimori, A.; Qin, Y.; Hojo, T.; Kubota, K.; Li, Y.-Y. Comparison of hyper-thermophilic–mesophilic two-stage with single-stage mesophilic anaerobic digestion of waste activated sludge: Process performance and microbial community analysis. Chem. Eng. J. 2016, 290, 290–301. [Google Scholar] [CrossRef]
  45. Fontana, A.; Campanaro, S.; Treu, L.; Kougias, P.G.; Cappa, F.; Morelli, L.; Angelidaki, I. Performance and genome-centric metagenomics of thermophilic single and two-stage anaerobic digesters treating cheese wastes. Water Res. 2018, 134, 181–191. [Google Scholar] [CrossRef] [PubMed]
  46. Liu, Y.; Whitman, W.B. Metabolic, phylogenetic, and ecological diversity of the methanogenic archaea. Ann. N. Y. Acad. Sci. 2008, 1125, 171–189. [Google Scholar] [CrossRef]
  47. Hao, L.; Bize, A.; Conteau, D.; Chapleur, O.; Courtois, S.; Kroff, P.; Desmond-Le Quéméner, E.; Bouchez, T.; Mazéas, L. New insights into the key microbial phylotypes of anaerobic sludge digesters under different operational conditions. Water Res. 2016, 102, 158–169. [Google Scholar] [CrossRef]
  48. Guo, H.; Oosterkamp, M.J.; Tonin, F.; Hendriks, A.; Nair, R.; van Lier, J.B.; de Kreuk, M. Reconsidering hydrolysis kinetics for anaerobic digestion of waste activated sludge applying cascade reactors with ultra-short residence times. Water Res. 2021, 202, 117398. [Google Scholar] [CrossRef]
  49. Gómez Camacho, C.E.; Ruggeri, B.; Mangialardi, L.; Persico, M.; Luongo Malavé, A.C. Continuous two-step anaerobic digestion (TSAD) of organic market waste: Rationalising process parameters. Int. J. Energy Environ. Eng. 2019, 10, 413–427. [Google Scholar] [CrossRef]
Figure 1. The experimental setup schematic and corresponding flow diagram for four-stage–two-phase anaerobic digestion (4S2P-AD). Orange/green arrows show the forward and backward transfer directions on different sampling days, respectively. Numbers on the arrows stand for the order of each transfer operation using 50 mL of leachate.
Fermentation 09 00565 g001
Figure 2. Variations in methane content (a), accumulated observed BMPo (b), pH (c), and volatile fatty acids (VFAs) (d,e) in anaerobic digestion with mono-feedstock (mono-AD) and co-feedstock (co-AD).
Fermentation 09 00565 g002
Figure 3. Variations in total ammonia nitrogen (TAN) (a), free ammonia nitrogen (FAN) (b), partial alkalinity (PA) (c), intermediate alkalinity (IA) (d), total alkalinity (TA) (e), and IA/PA (f) in mono-AD and co-AD.
Fermentation 09 00565 g003
Figure 4. Variations in methane content (a), accumulated BMPo (b), pH (c), and VFAs (d) in 4S2P-AD.
Fermentation 09 00565 g004
Figure 5. Variations in TAN (a), FAN (b), PA (c), IA (d), TA (e), and IA/PA (f) in 4S2P-AD.
Fermentation 09 00565 g005
Figure 6. Beta diversity similarity described via principal component analysis (PCA) for bacterial (a) and archaeal (b) communities in mono-AD, co-AD, and 4S2P-AD.
Fermentation 09 00565 g006
Disclaimer/Publisher’s Note: The statements, opinions and data contained in all publications are solely those of the individual author(s) and contributor(s) and not of MDPI and/or the editor(s). MDPI and/or the editor(s) disclaim responsibility for any injury to people or property resulting from any ideas, methods, instructions or products referred to in the content.

