
In Vitro Fermentation of Different Indigestible Glucans with Varying Physico-Chemical Properties by Human Fecal Microbiota
 , and
, and
Abstract
: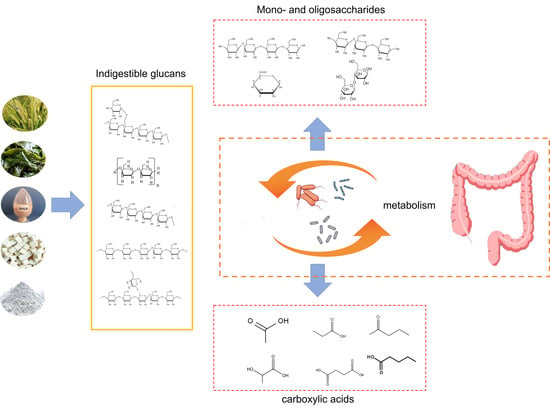
1. Introduction
2. Materials and Methods
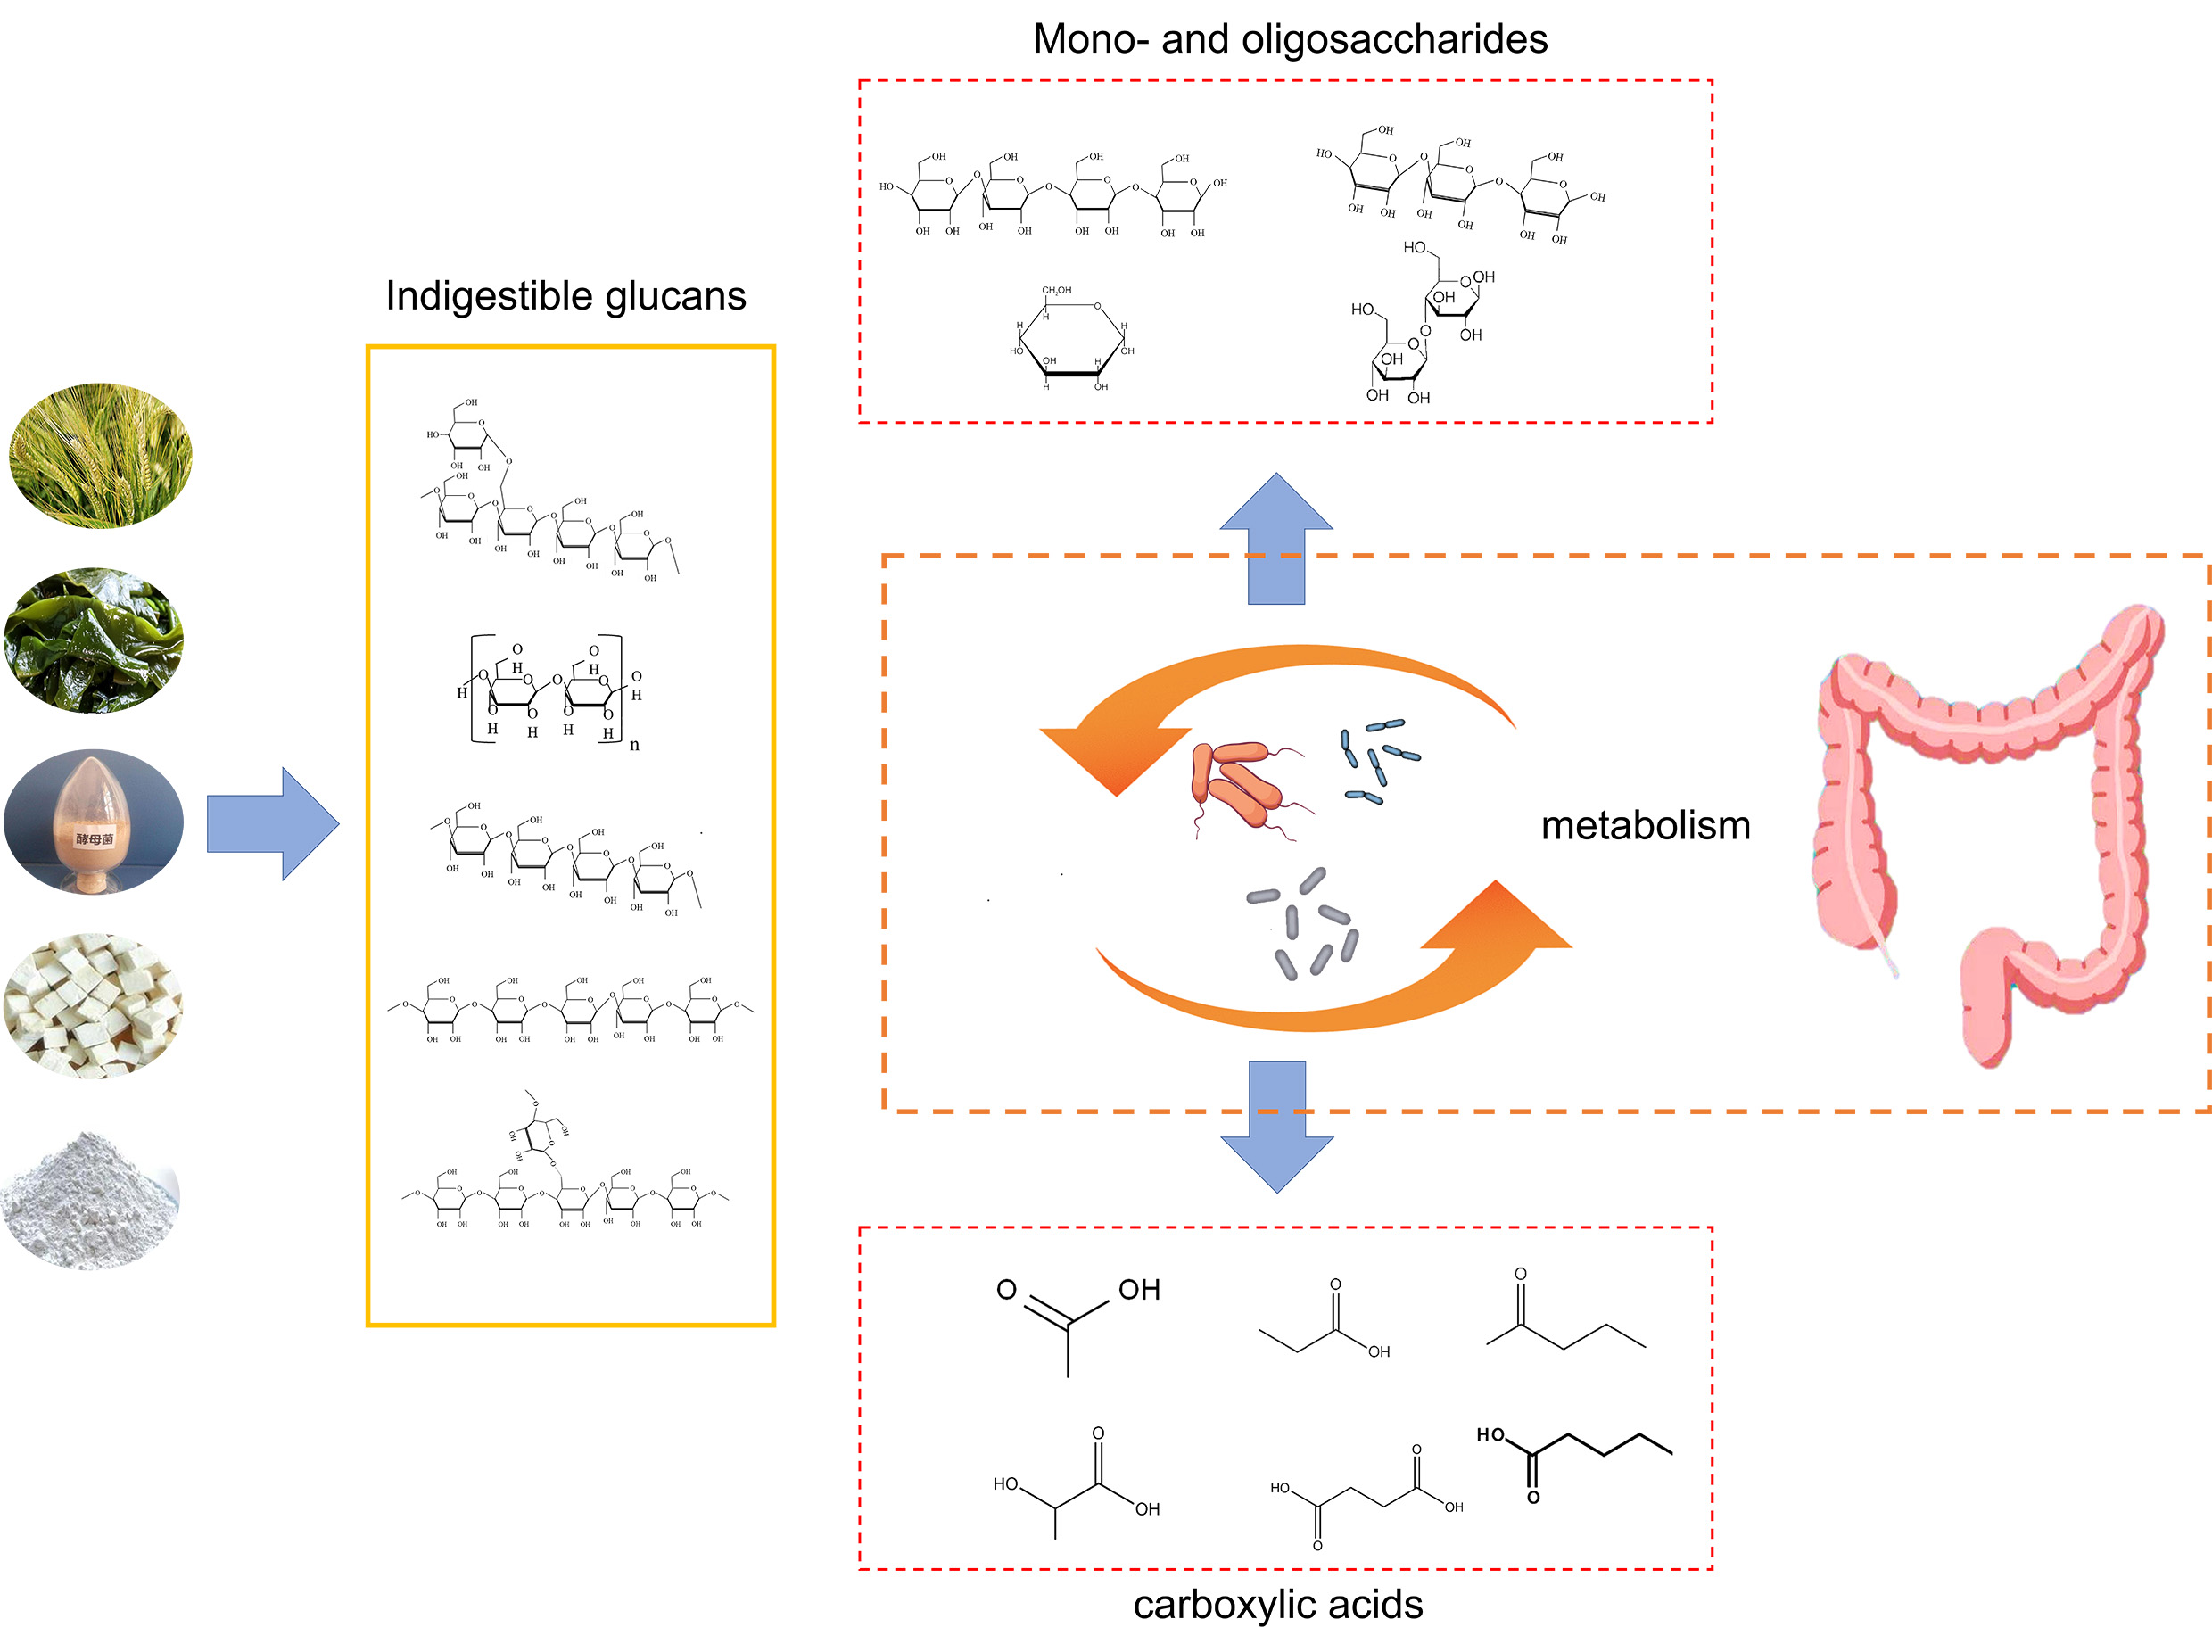
2.1. Materials
2.2. Culture Medium
2.3. Collection and Preparation of Fecal Inoculum
2.4. In Vitro Fermentation
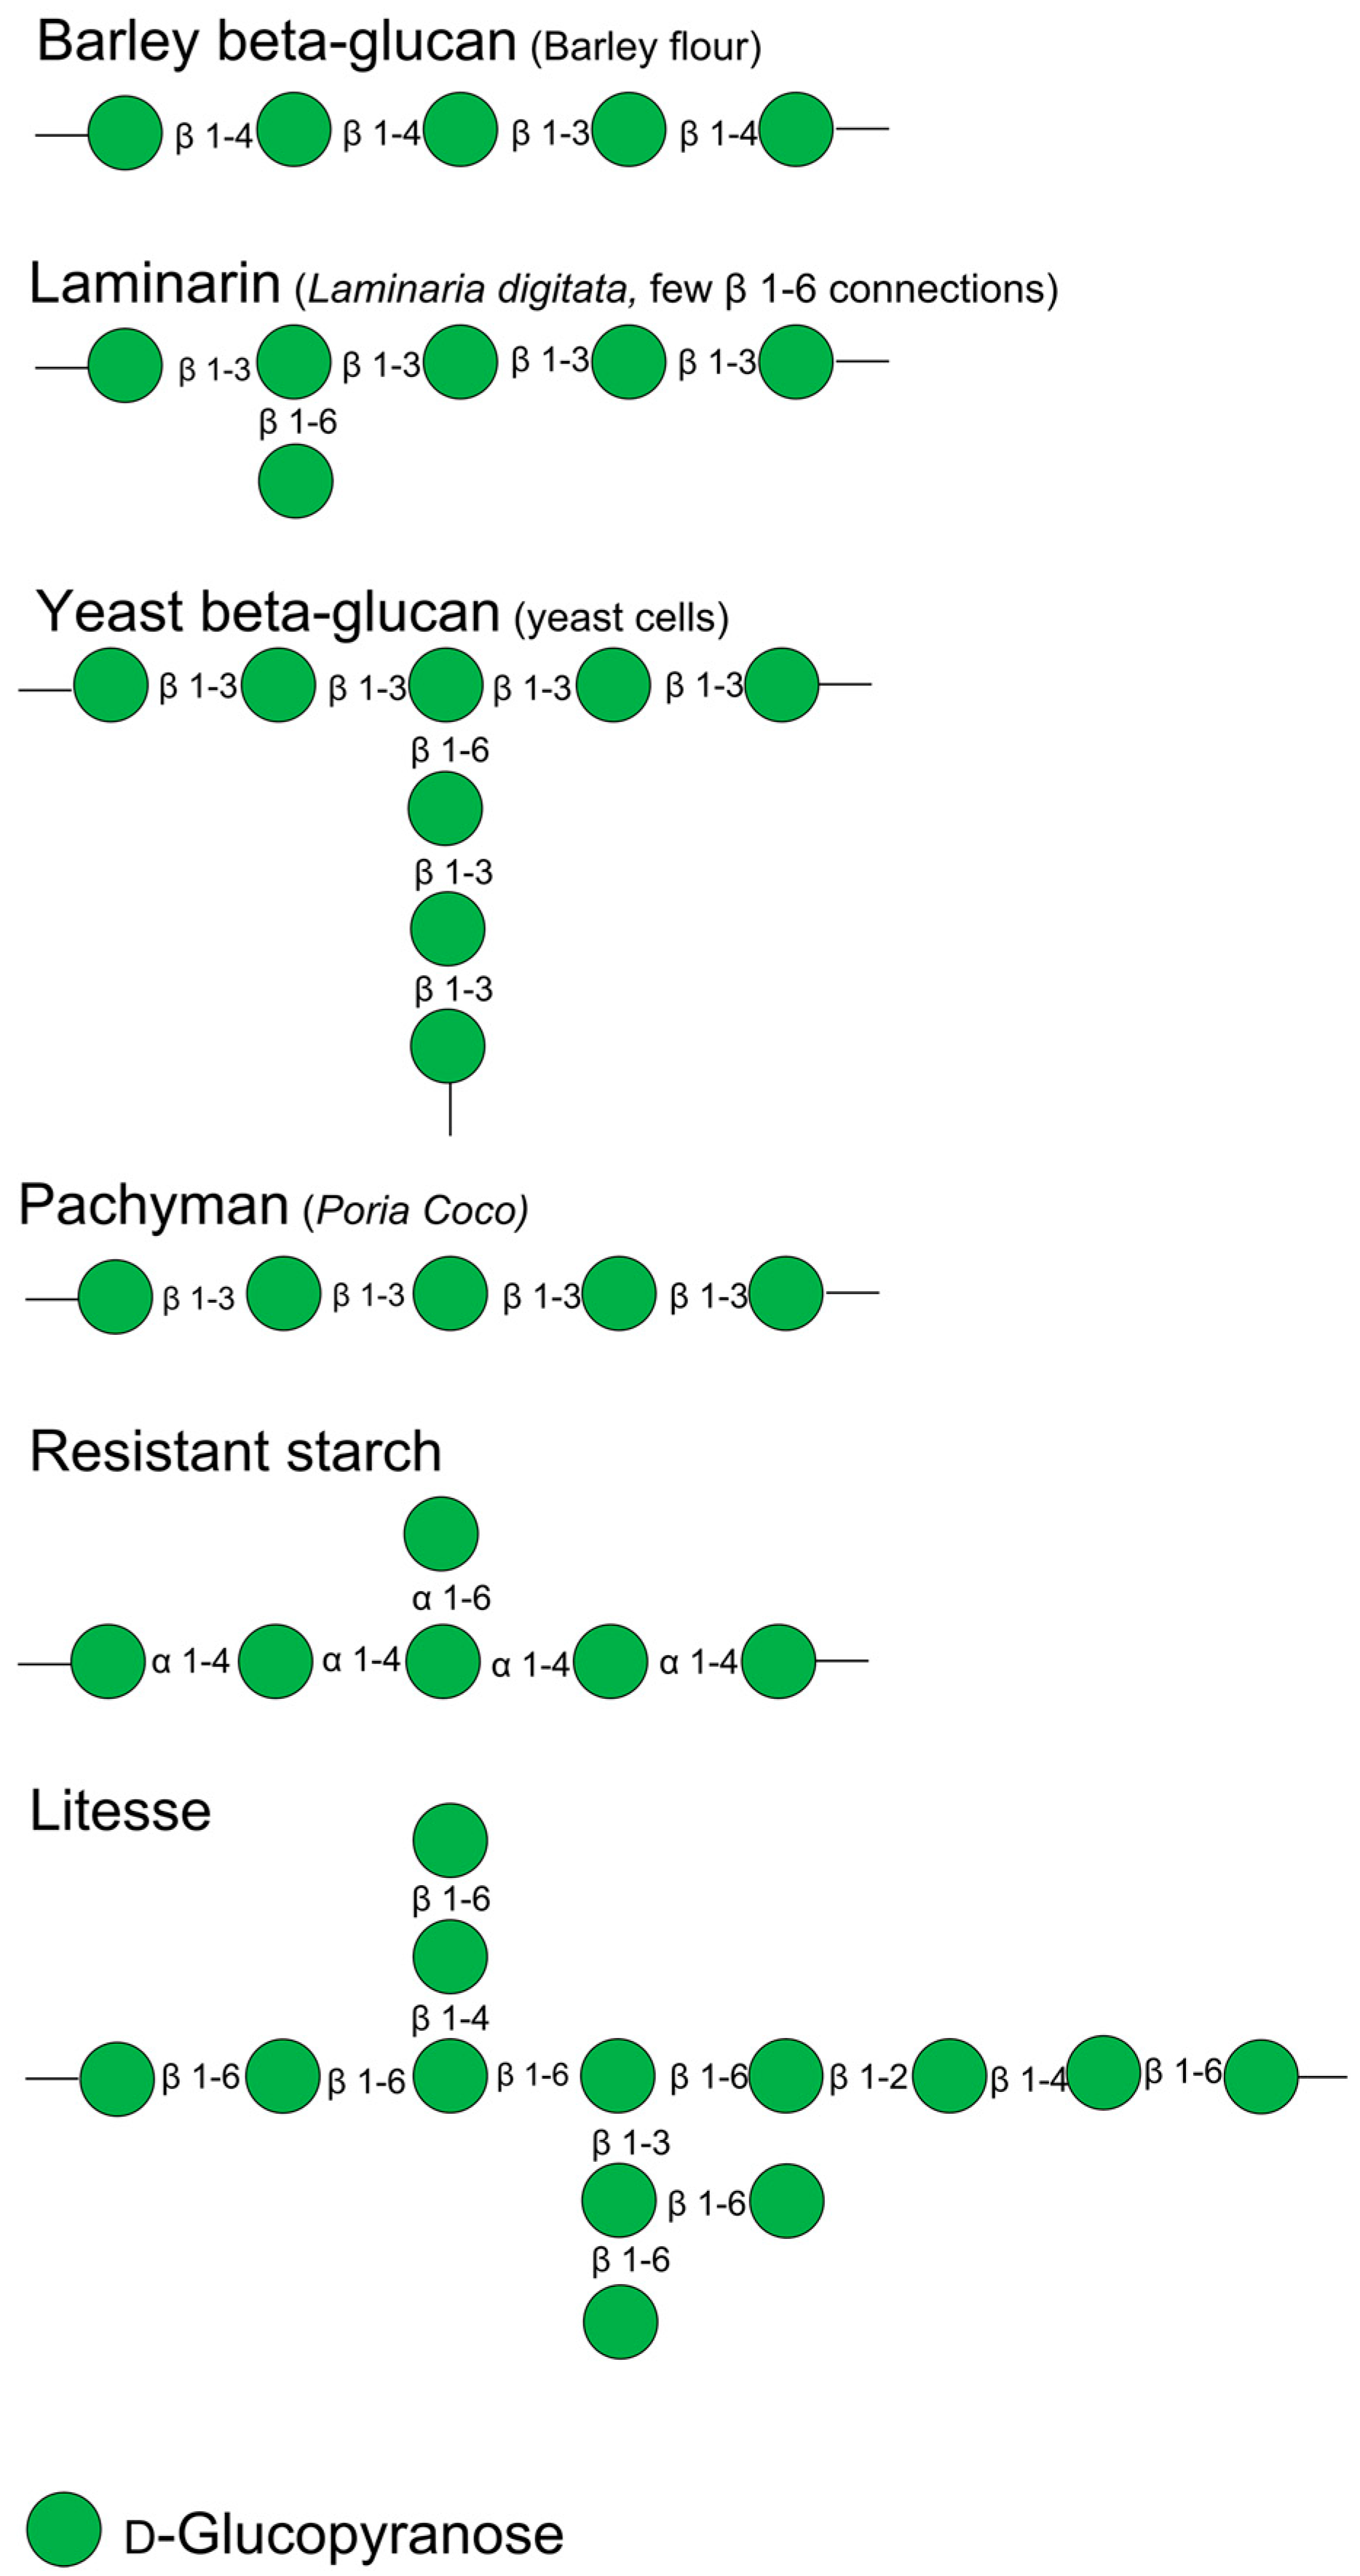
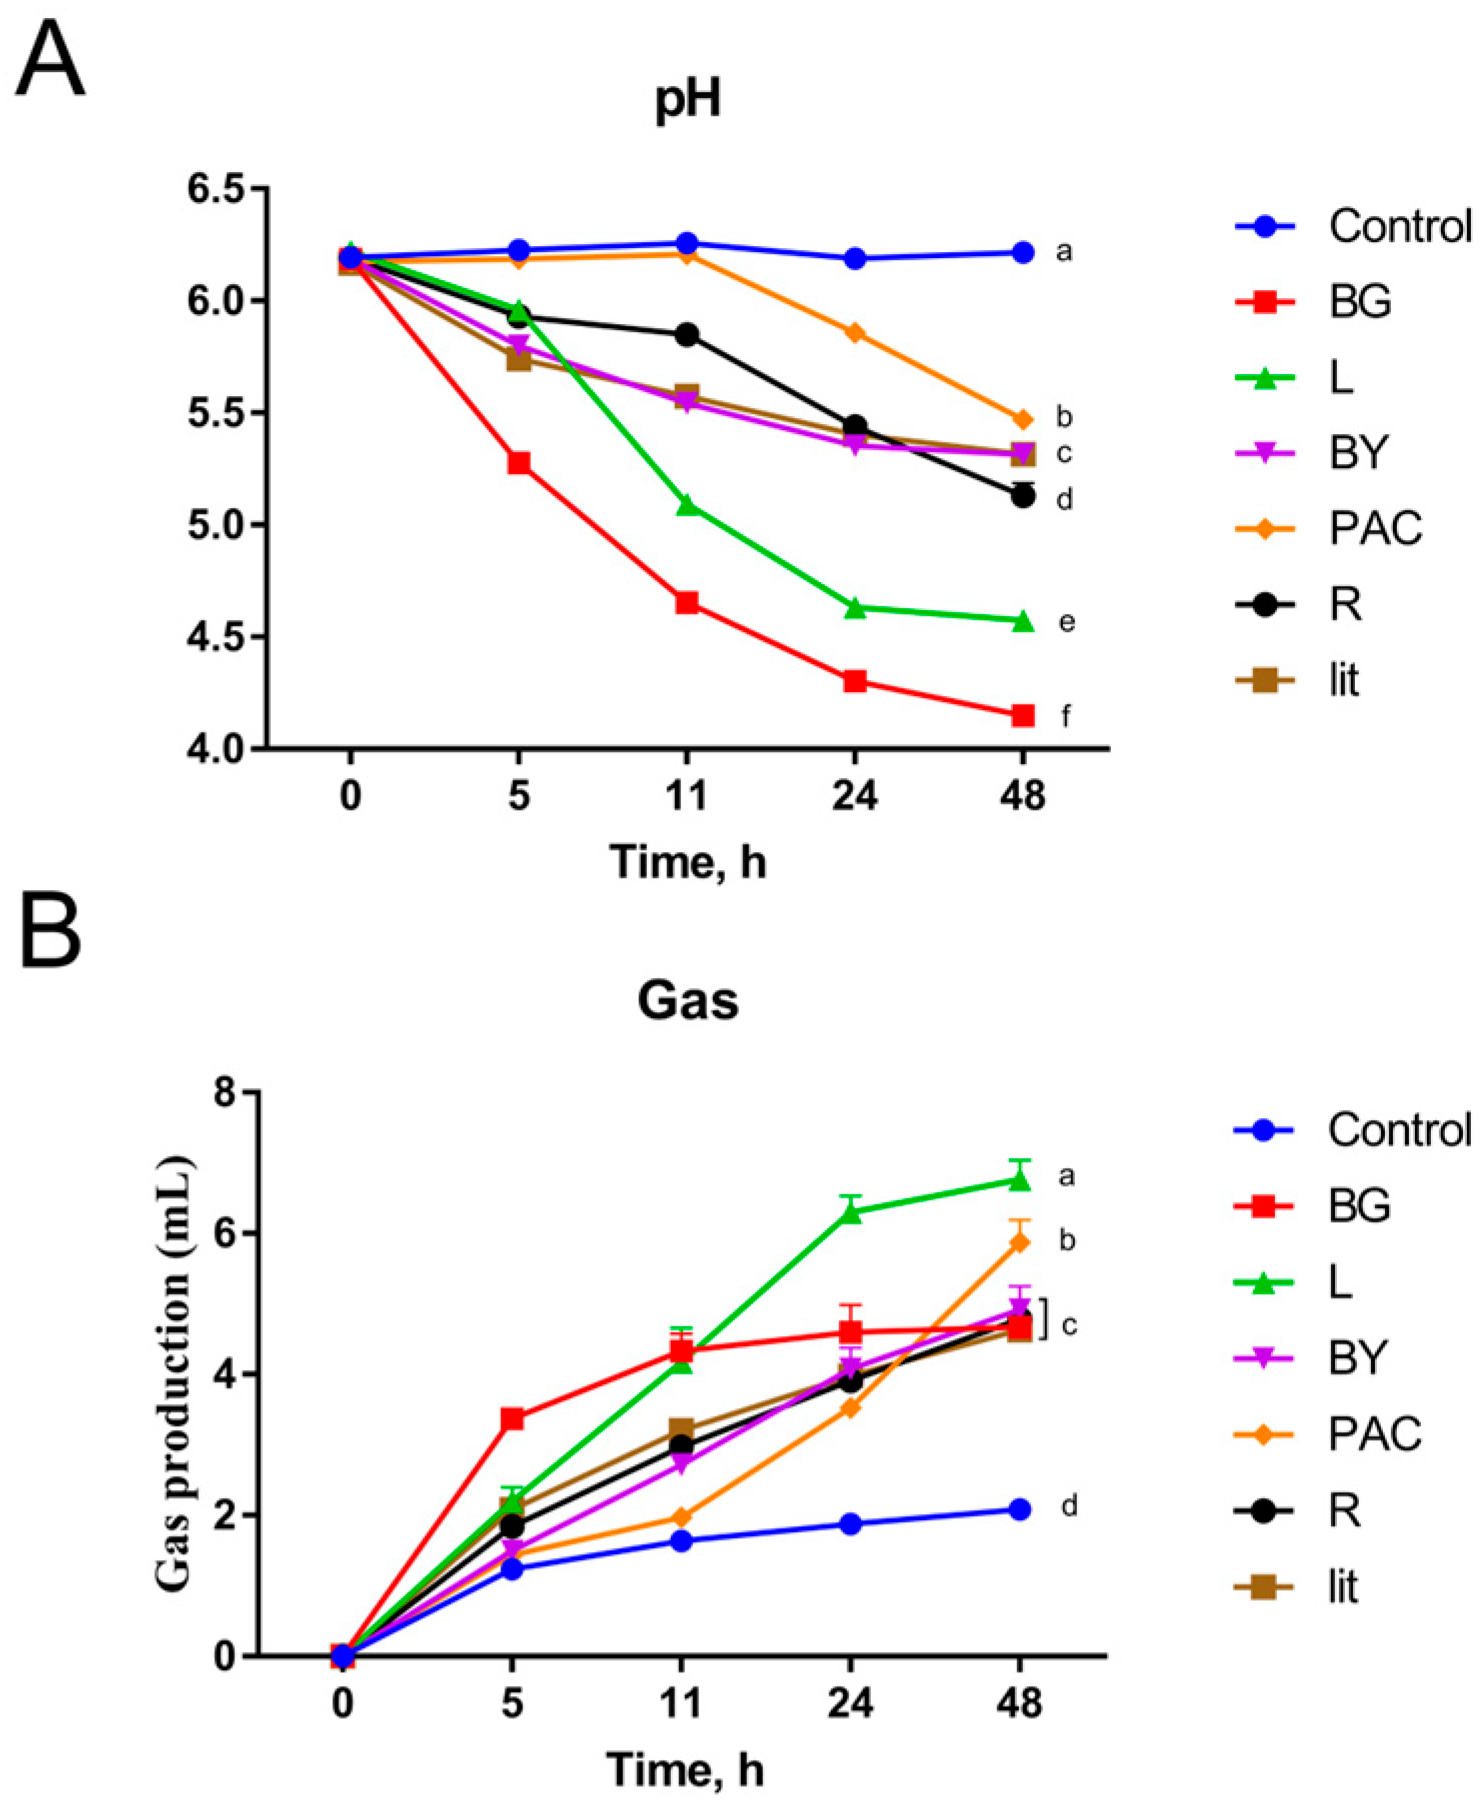
2.5. Determination of Gas Production and pH of Broth
2.6. Analysis of Residual Carbohydrates and Fermentation Degree
2.7. Analysis of Free Monosaccharides and Oligosaccharides
2.8. Analysis of Short-Chain Fatty Acid
2.9. Analysis of Lactic Acid and Succinic Acid
2.10. 16 S rRNA Gene Sequencing
2.11. Quantitative PCR for Gut Microbes
2.12. Statistical Analysis
3. Results
3.1. Impact of IGs on pH and Gas Production during In Vitro Fermentation
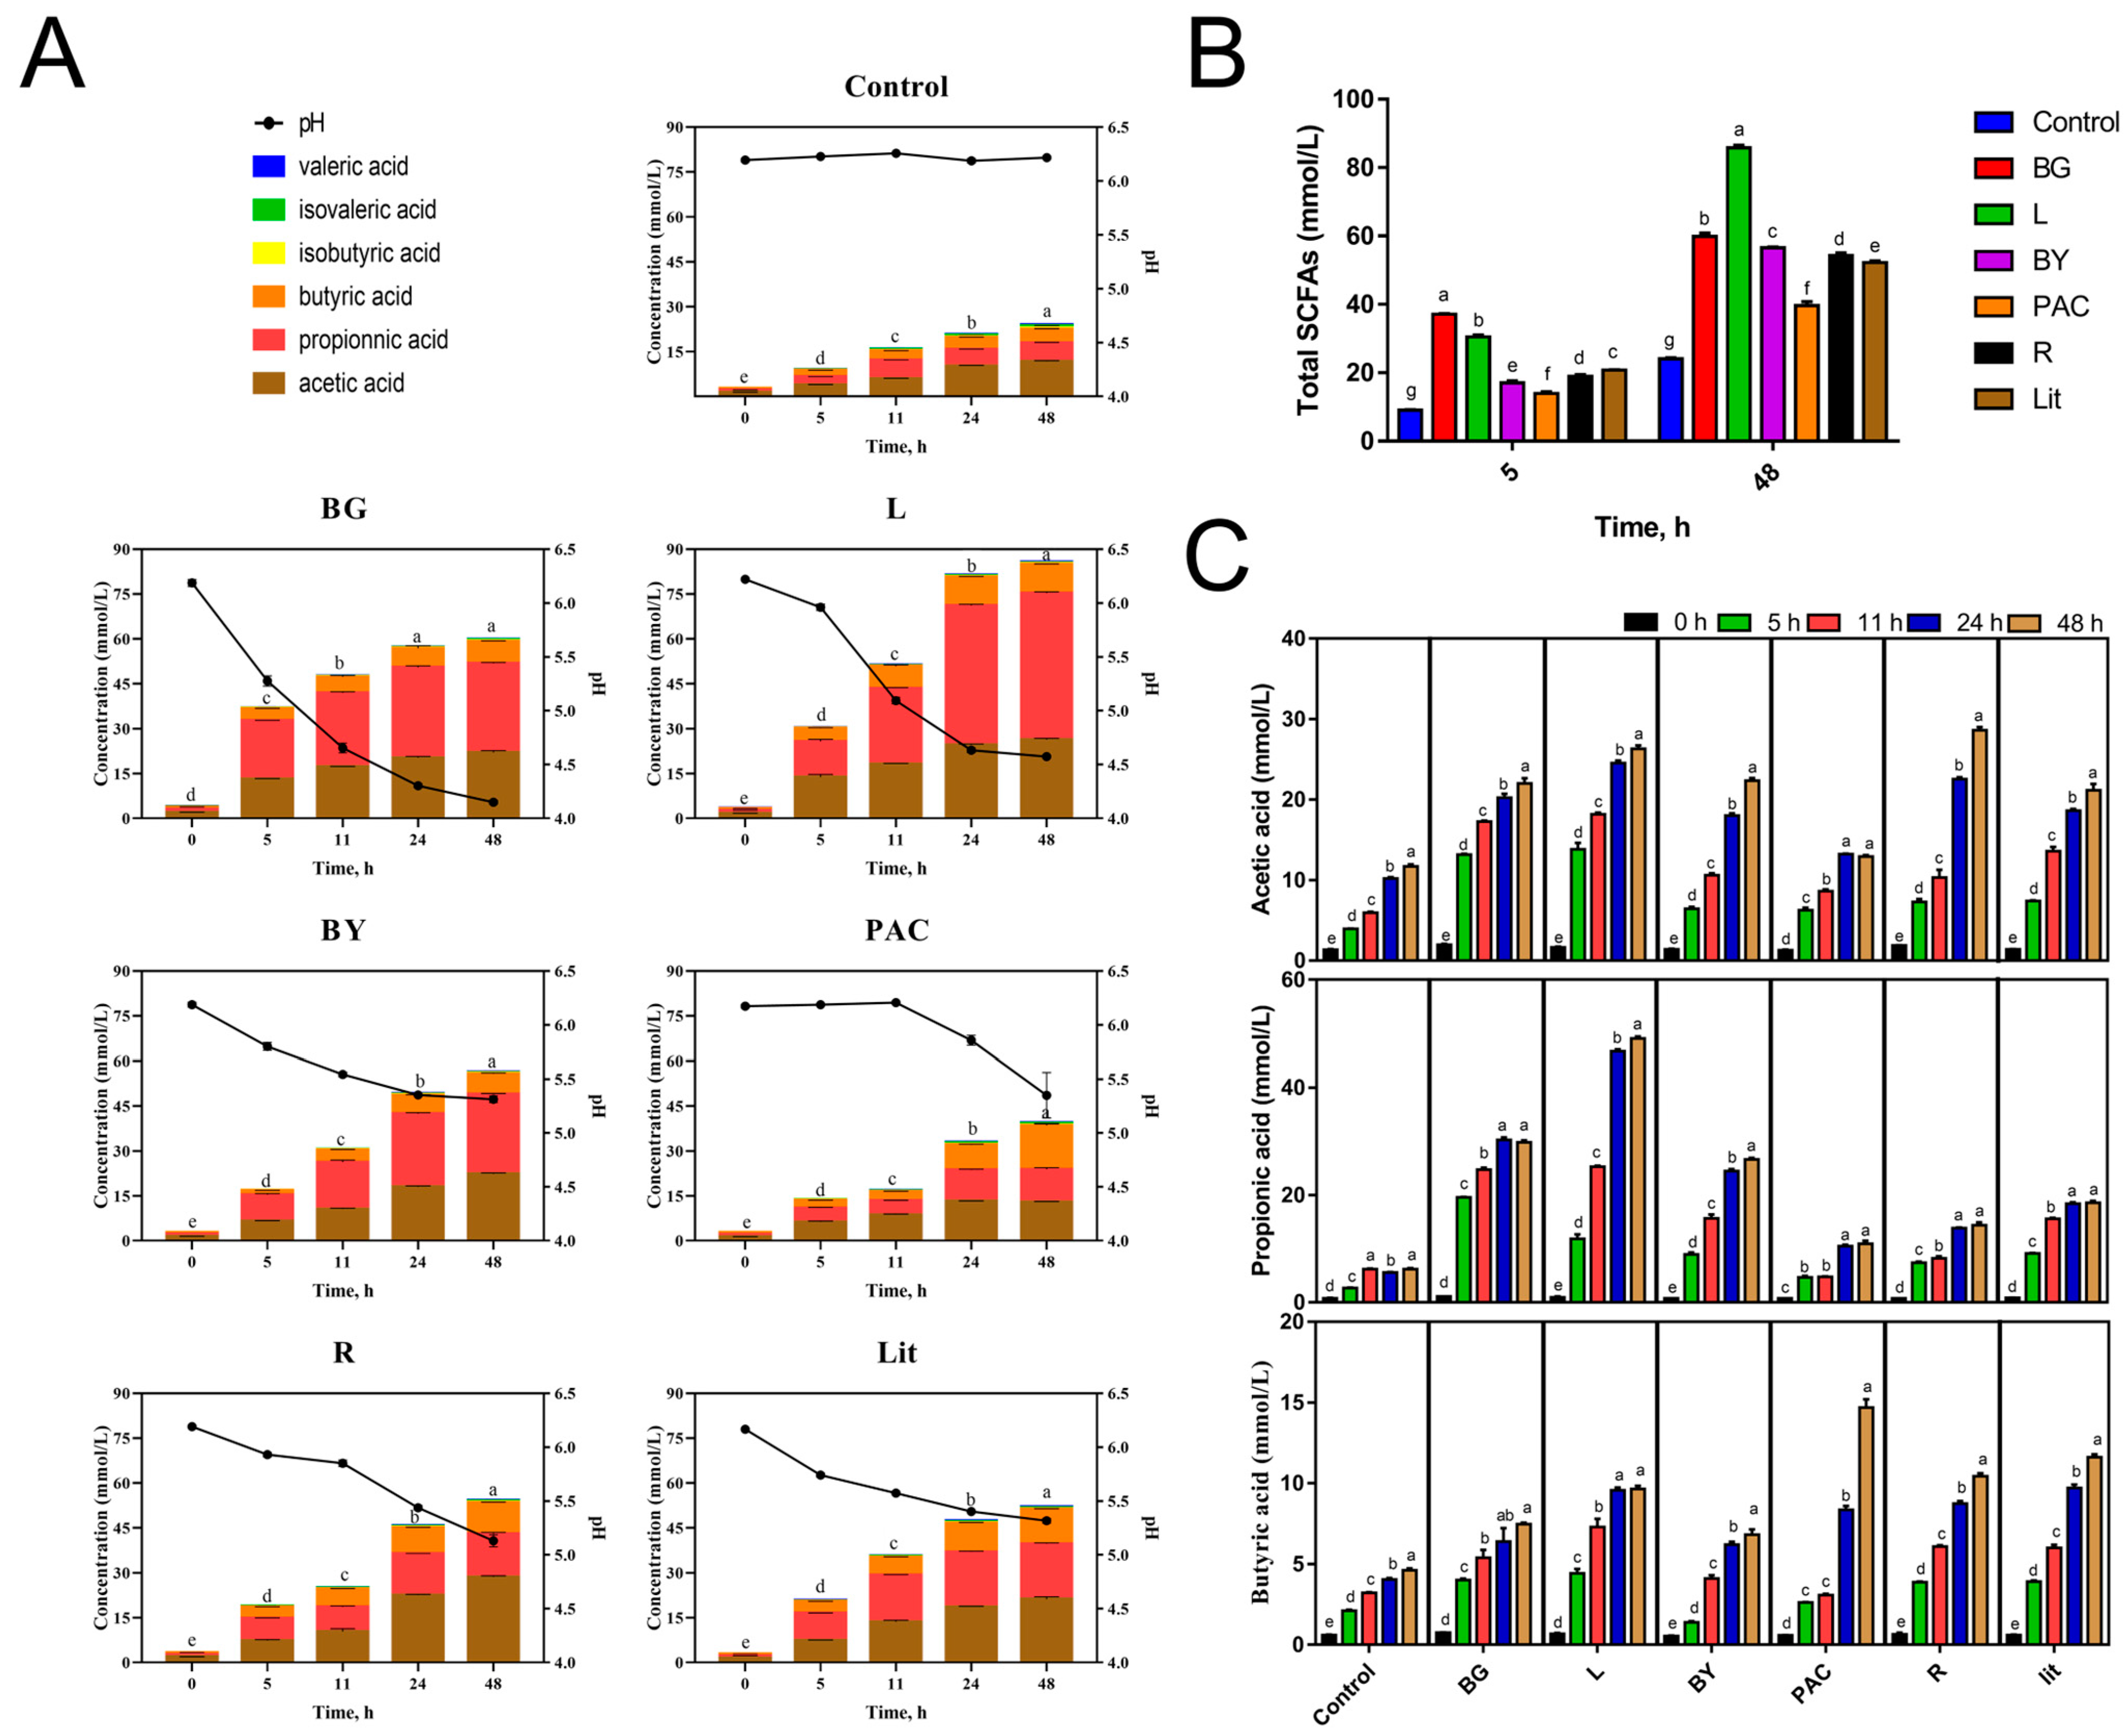
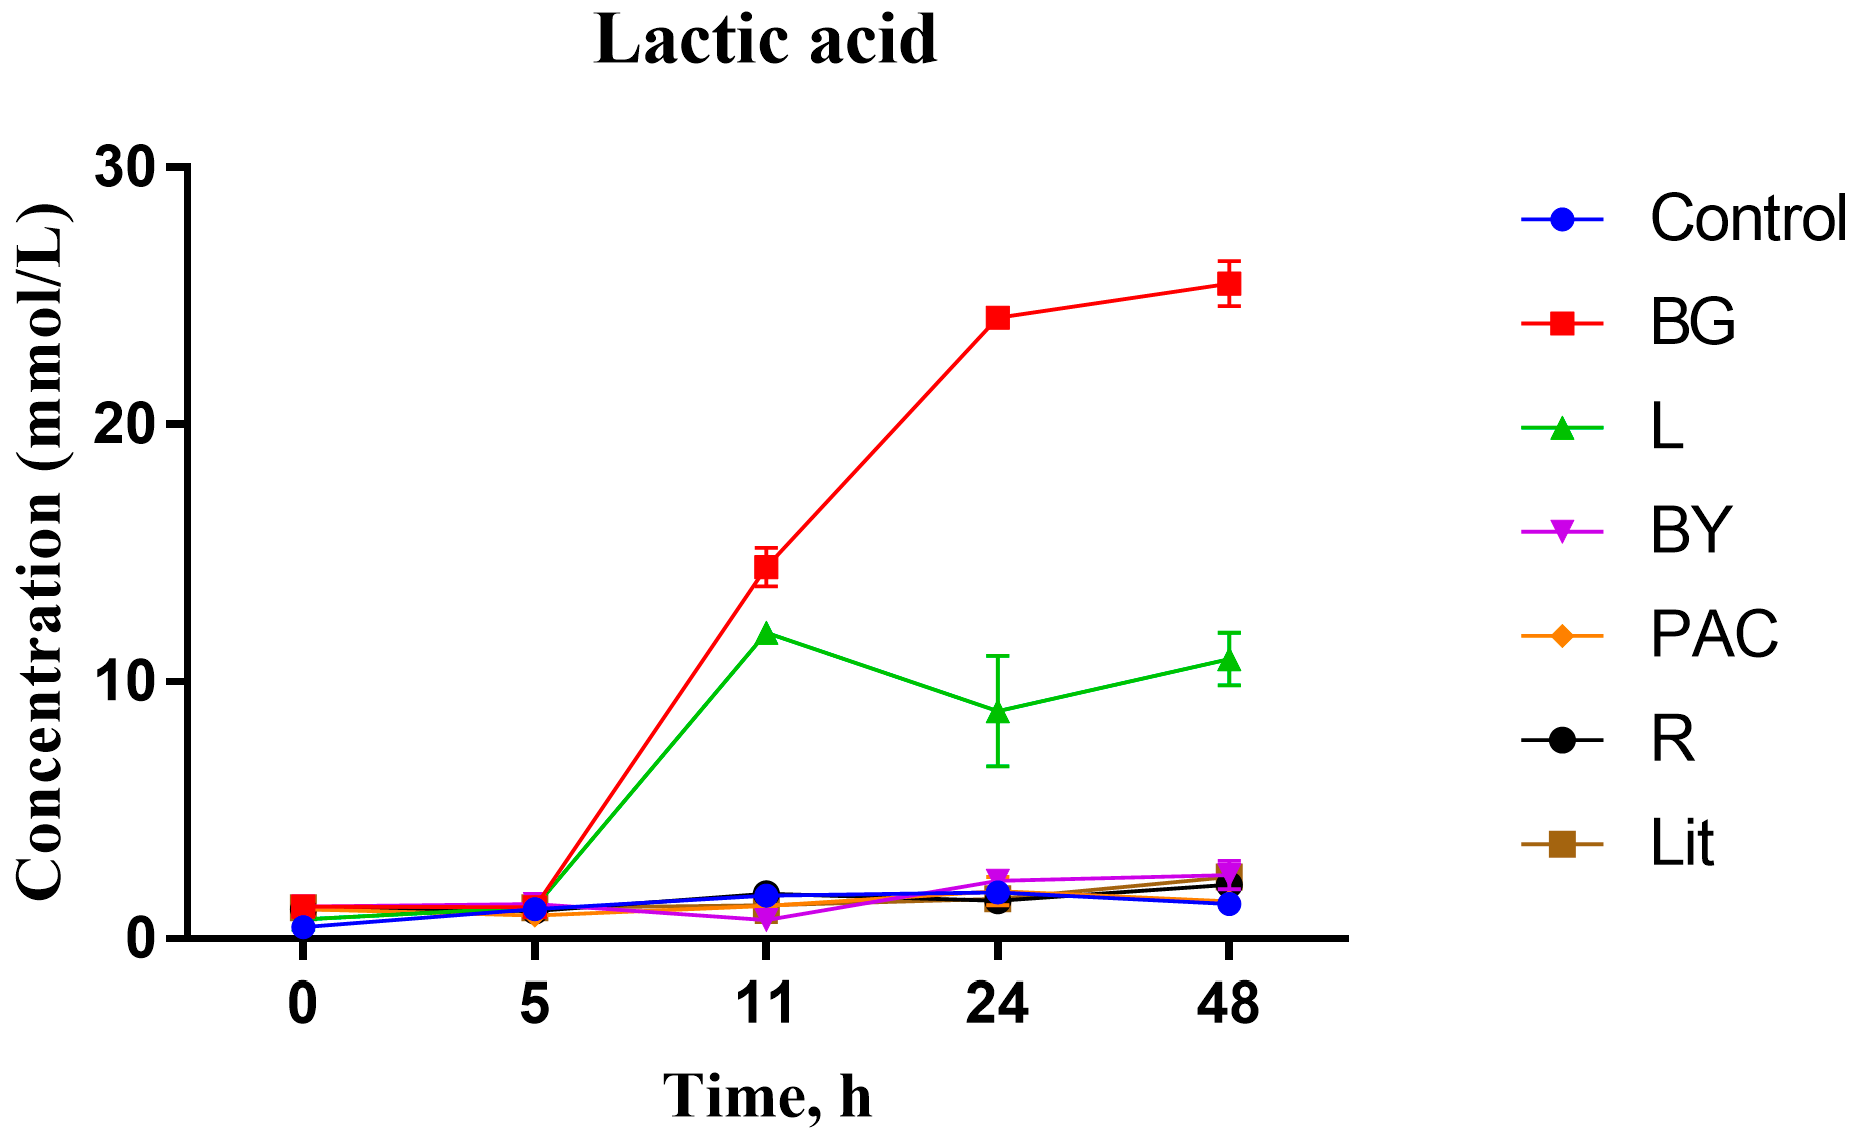
3.2. Impact of IGs on Carboxylic Acid Production during In Vitro Fermentation
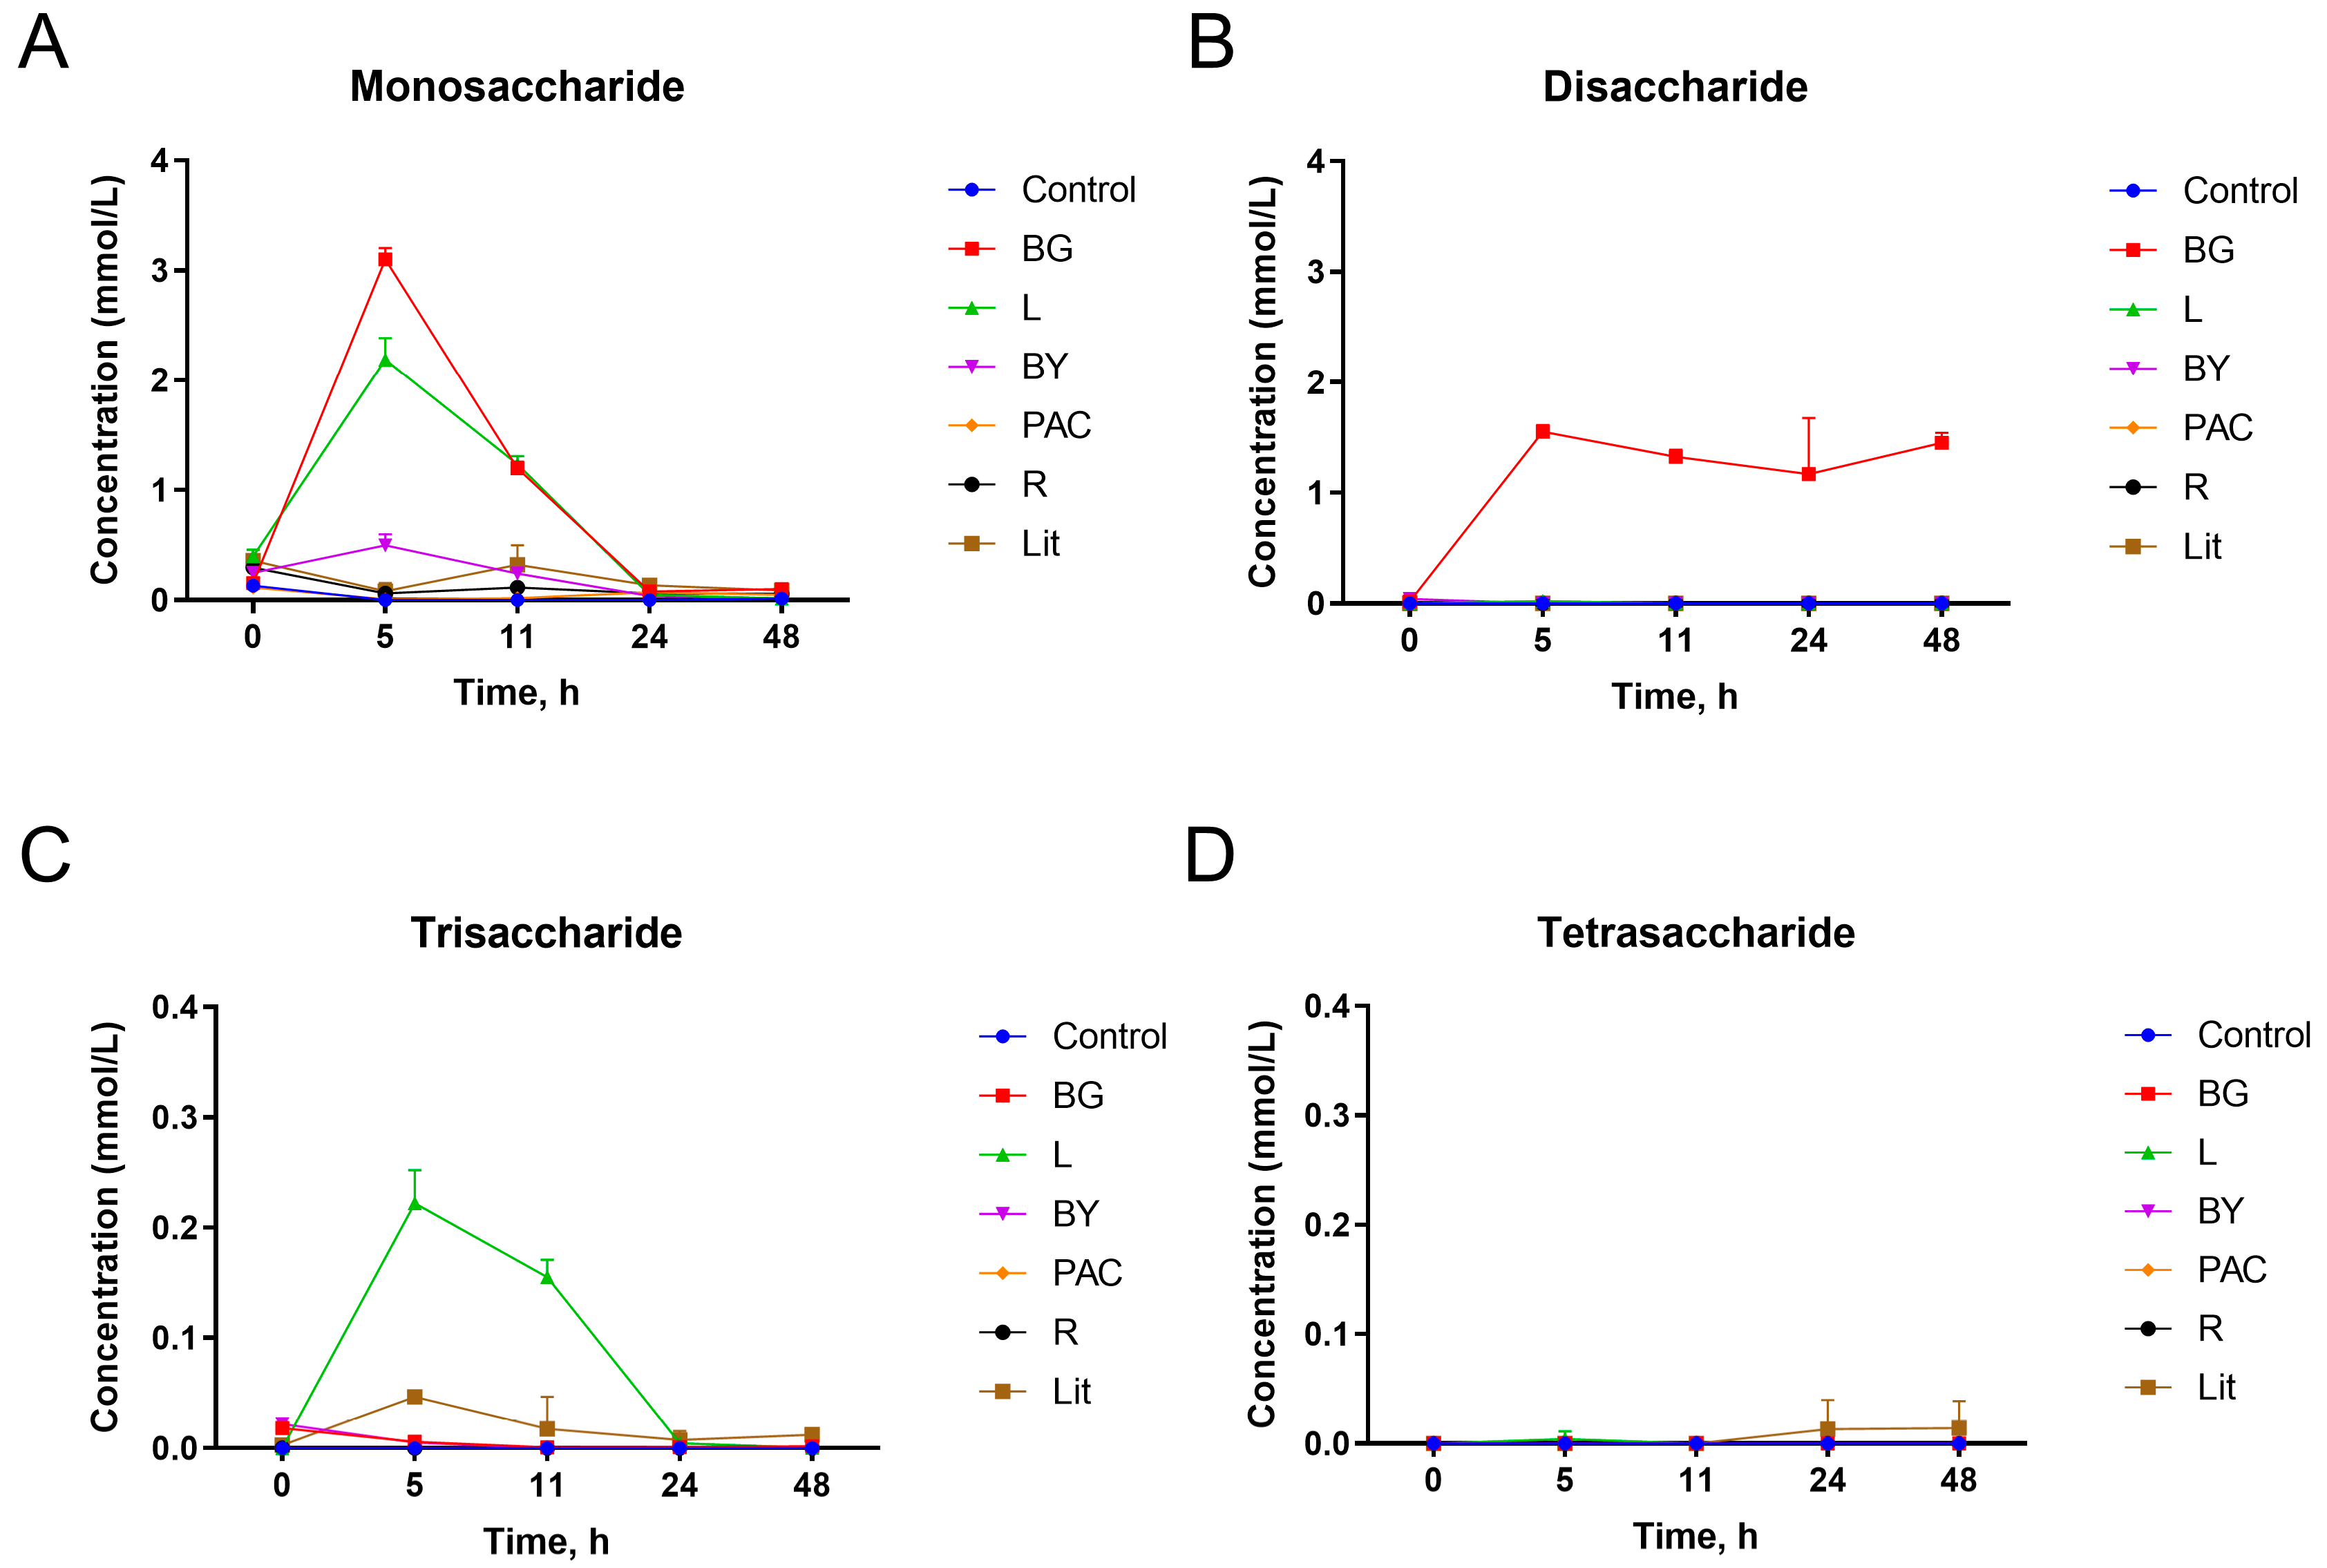
3.3. Impact of IGs on Release of Free Monosaccharides and Oligosaccharides during In Vitro Fermentation
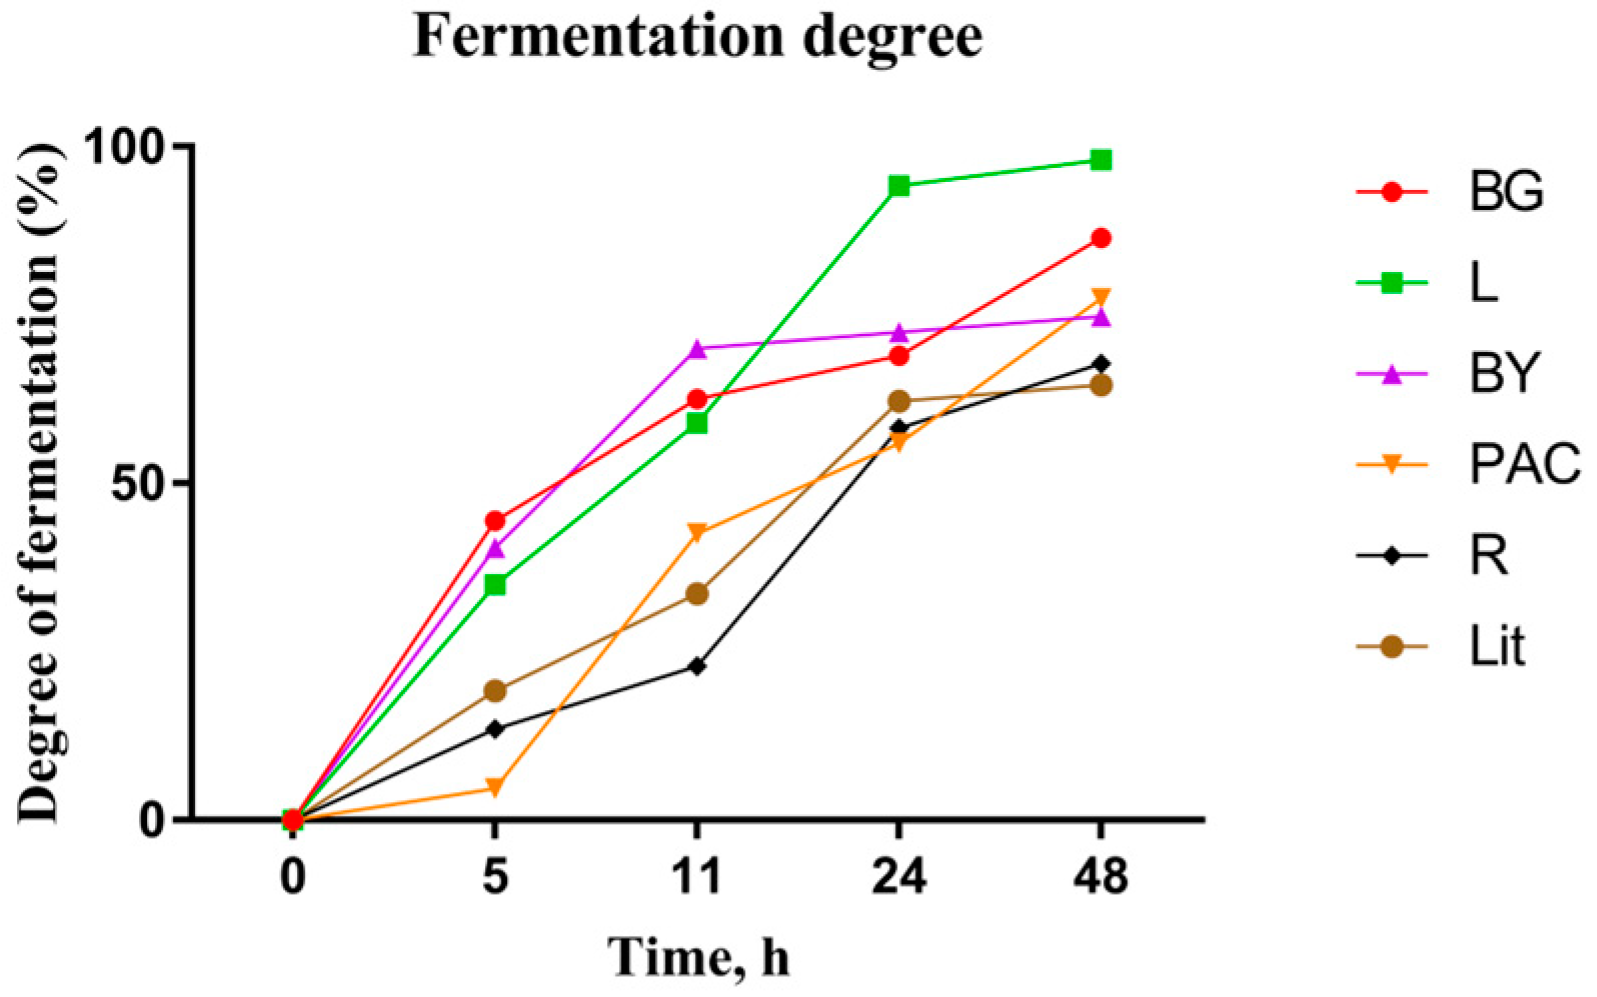
3.4. Fermentation Degree of IGs during In Vitro Fermentation
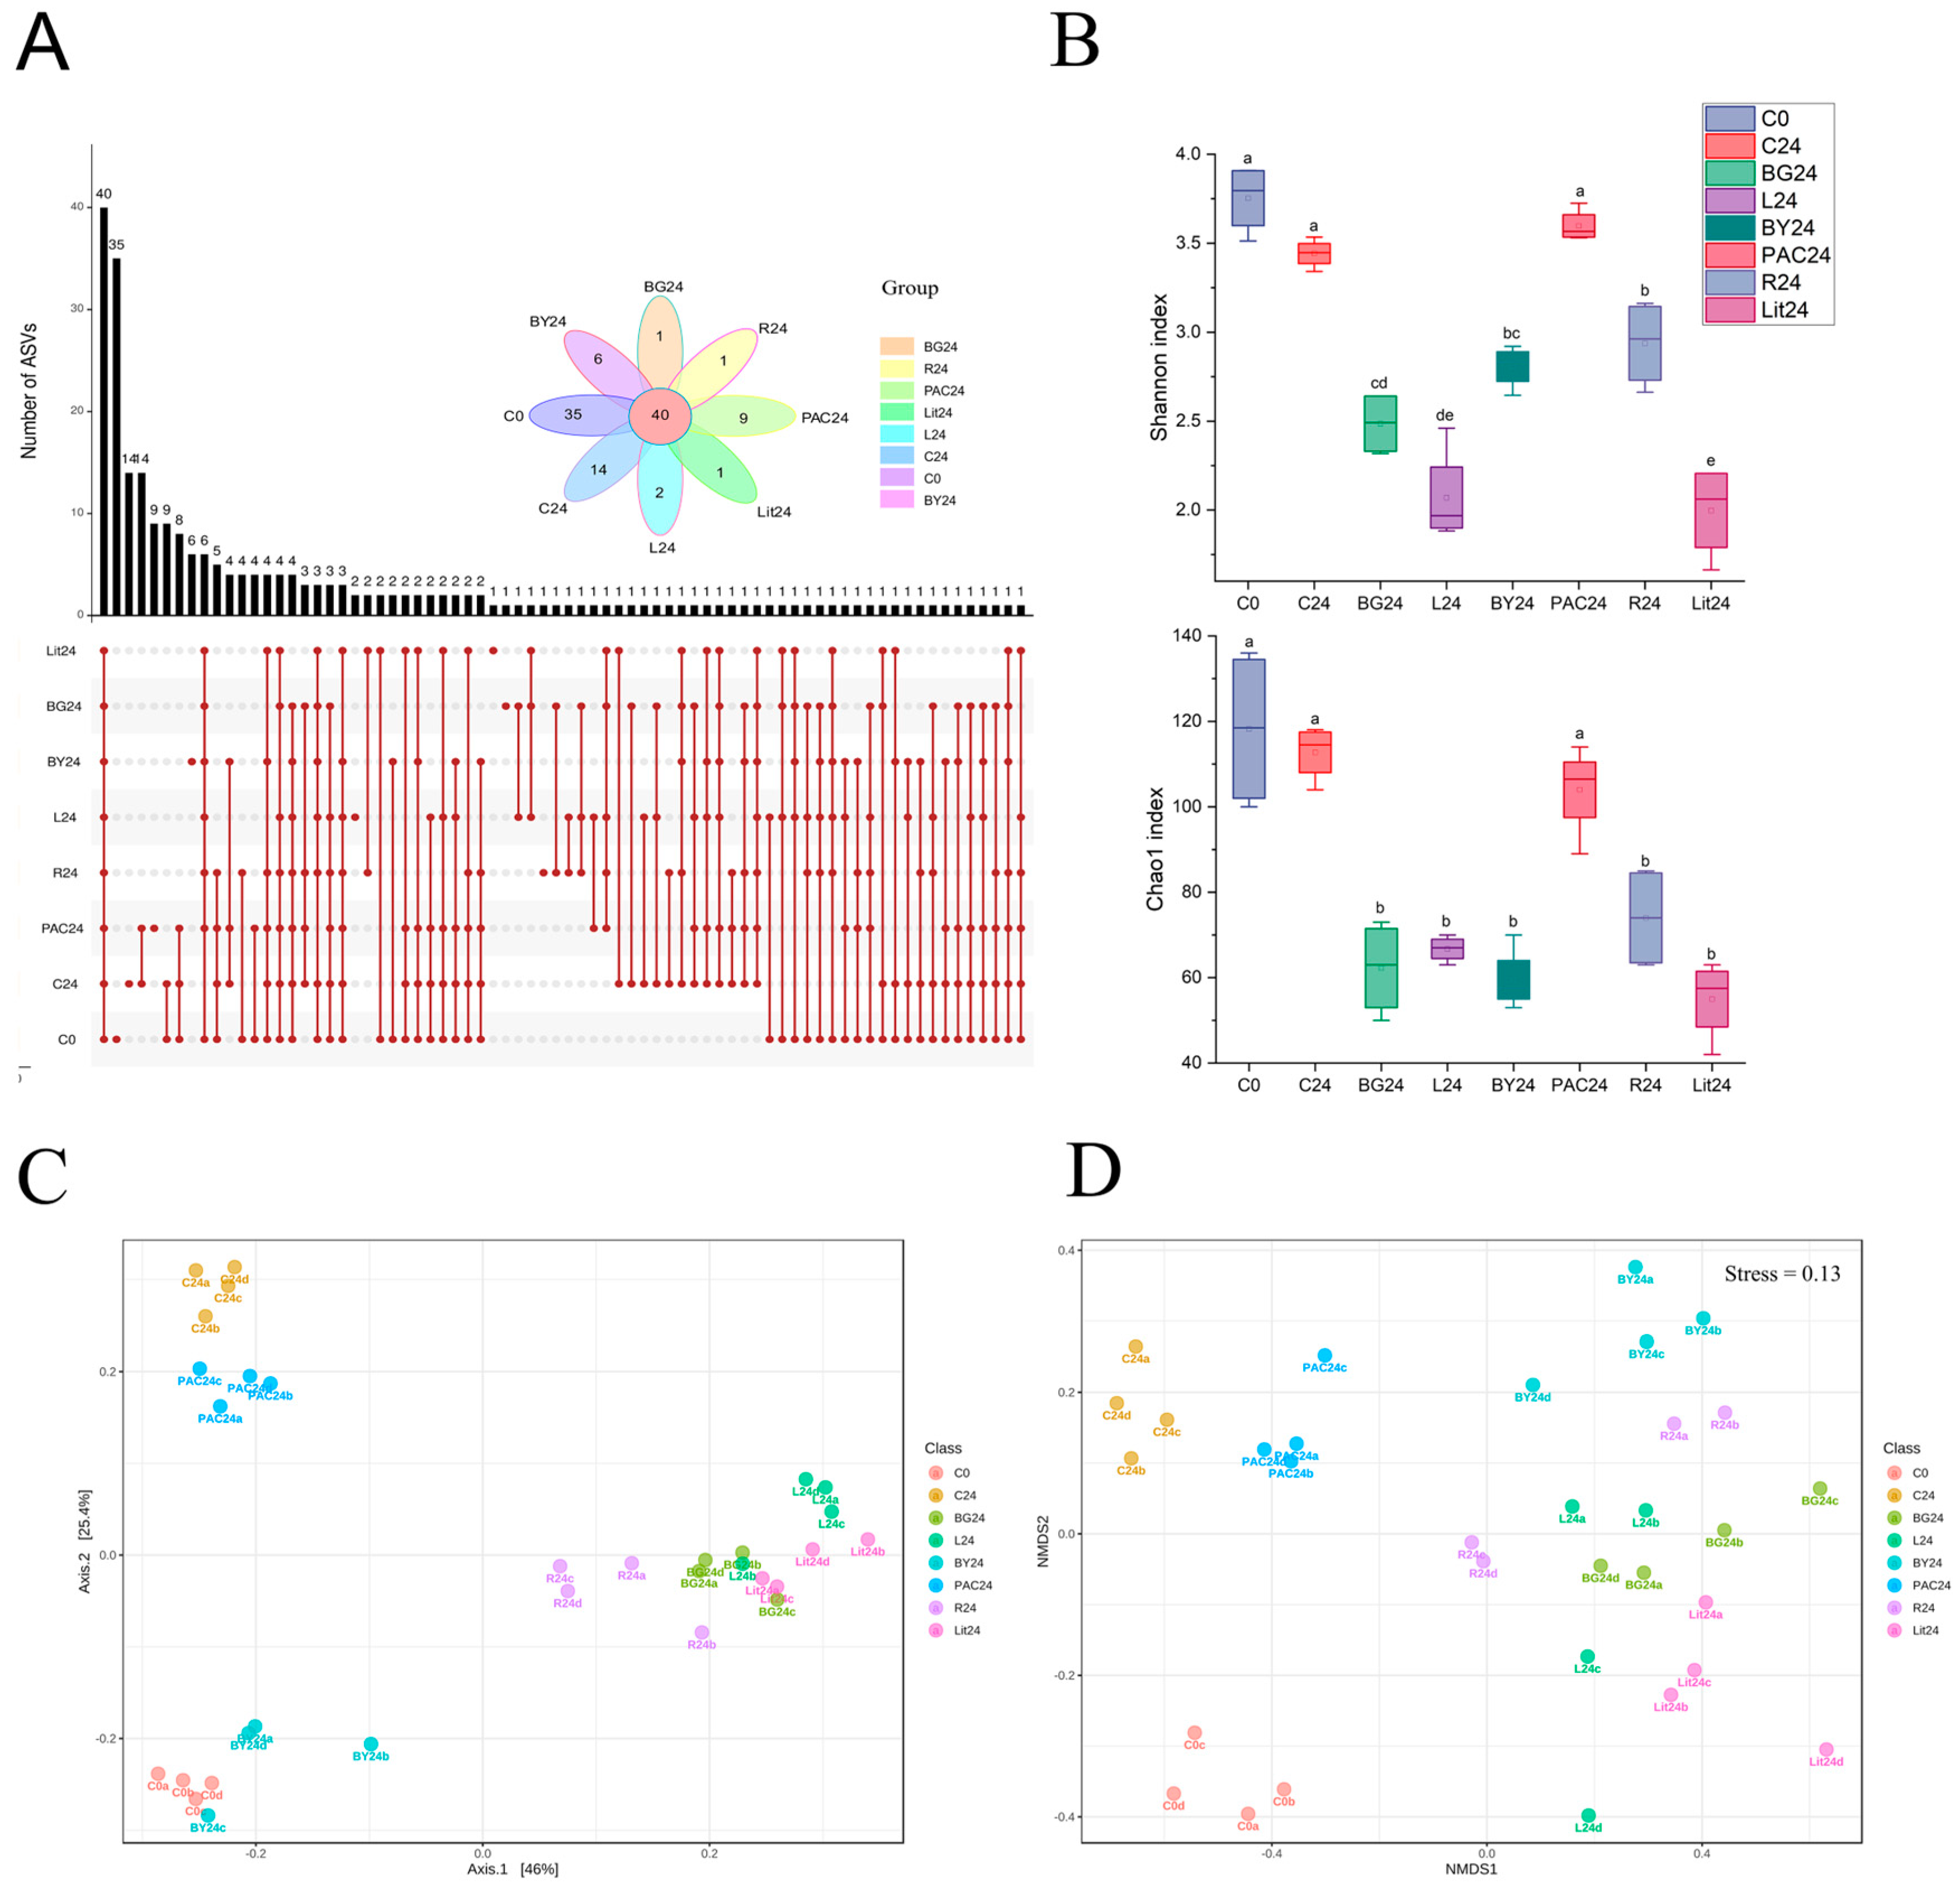
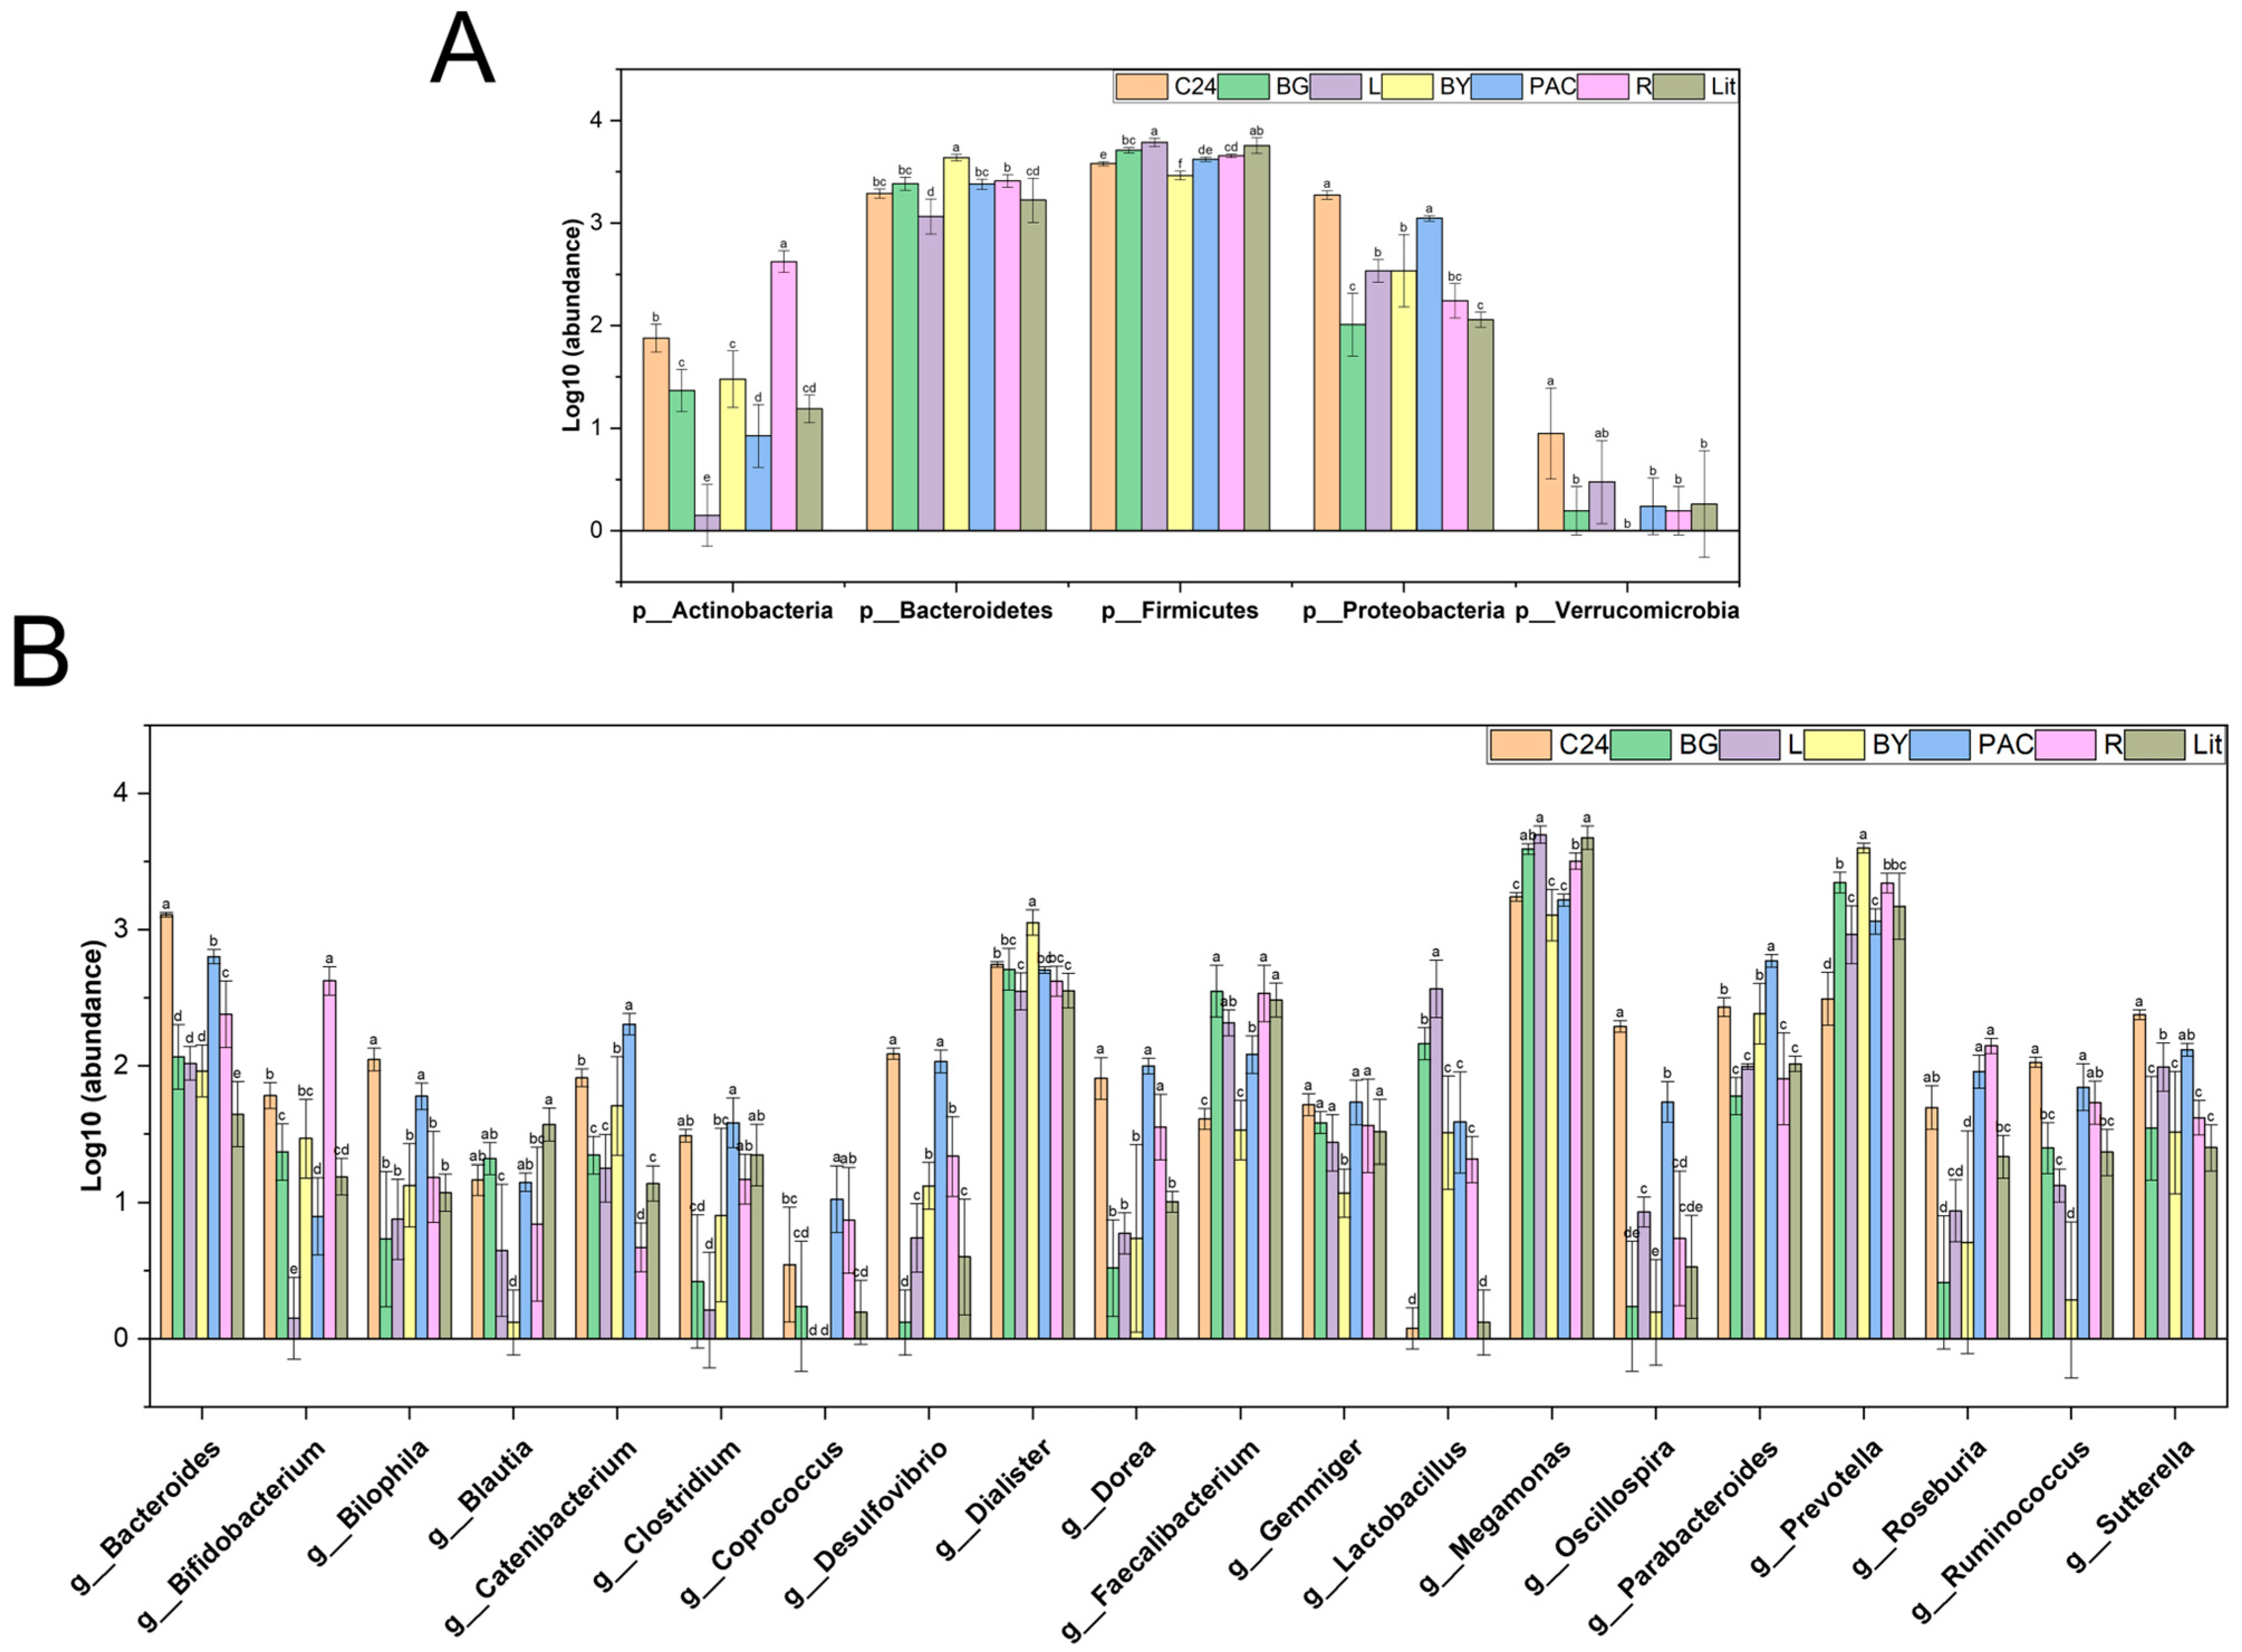
3.5. Impact of IGs on Gut Microbial Diversity and Composition
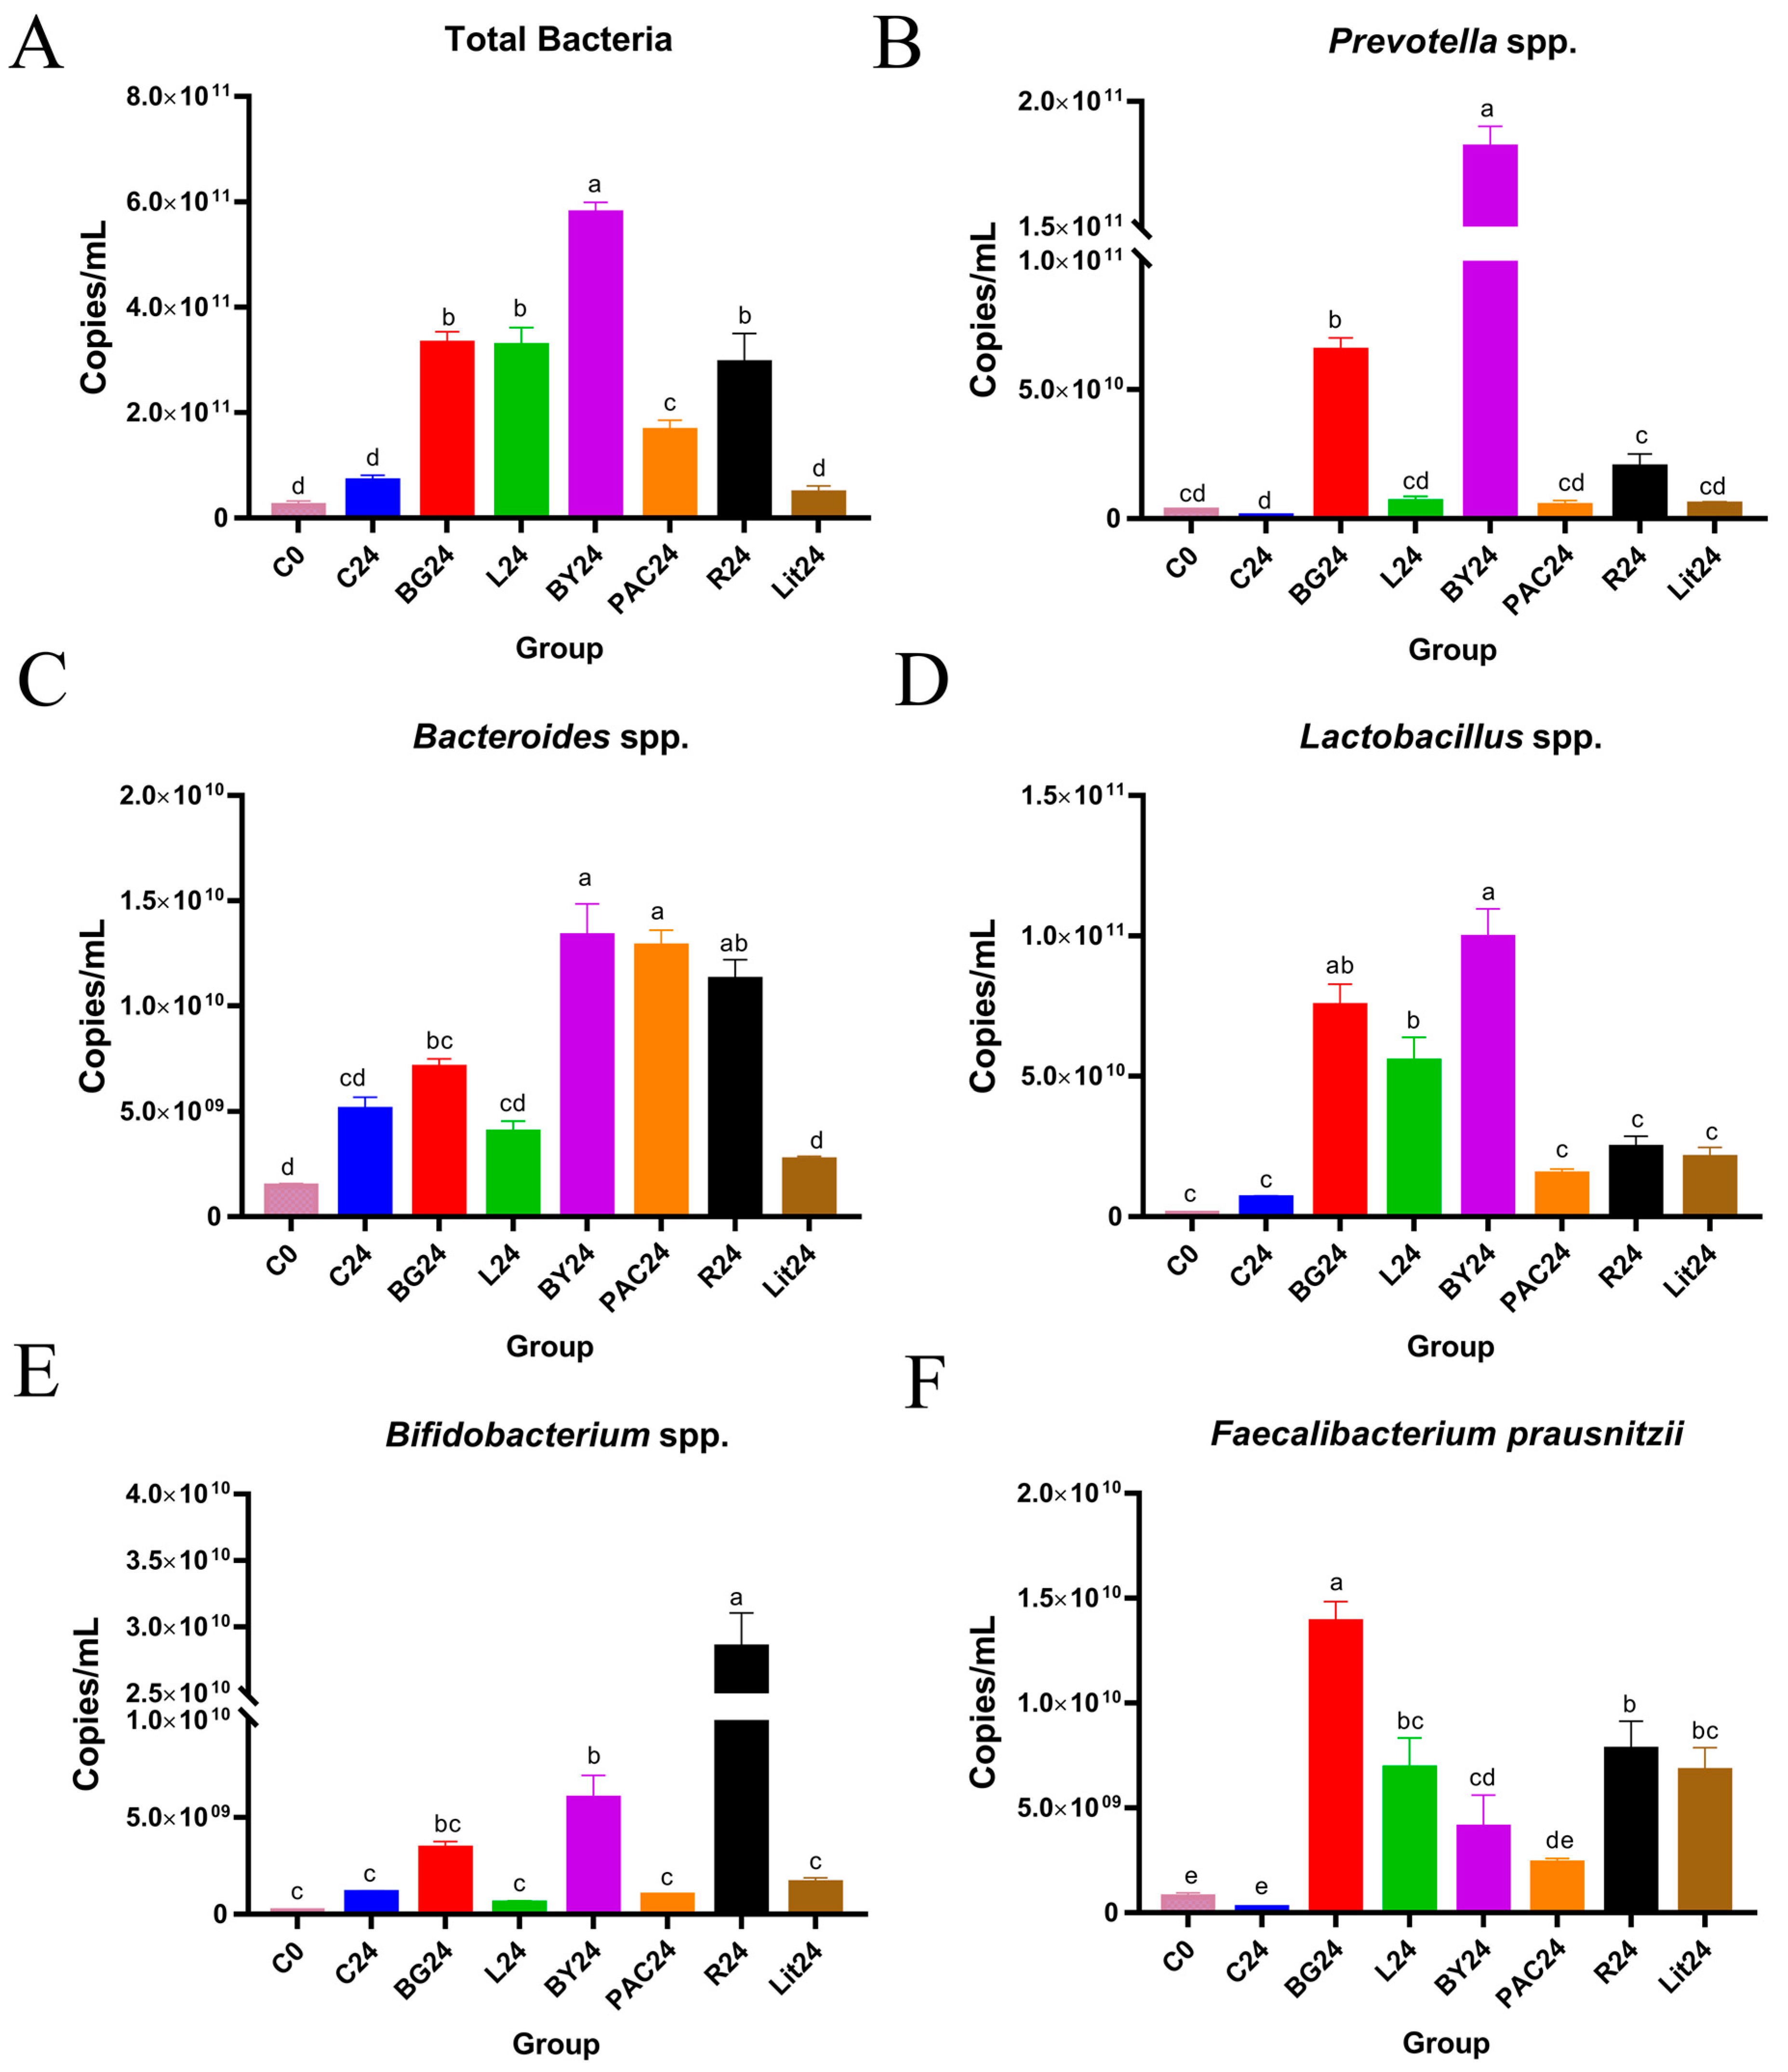
3.6. Impact of IGs on the Abundance of Gut Bacteria
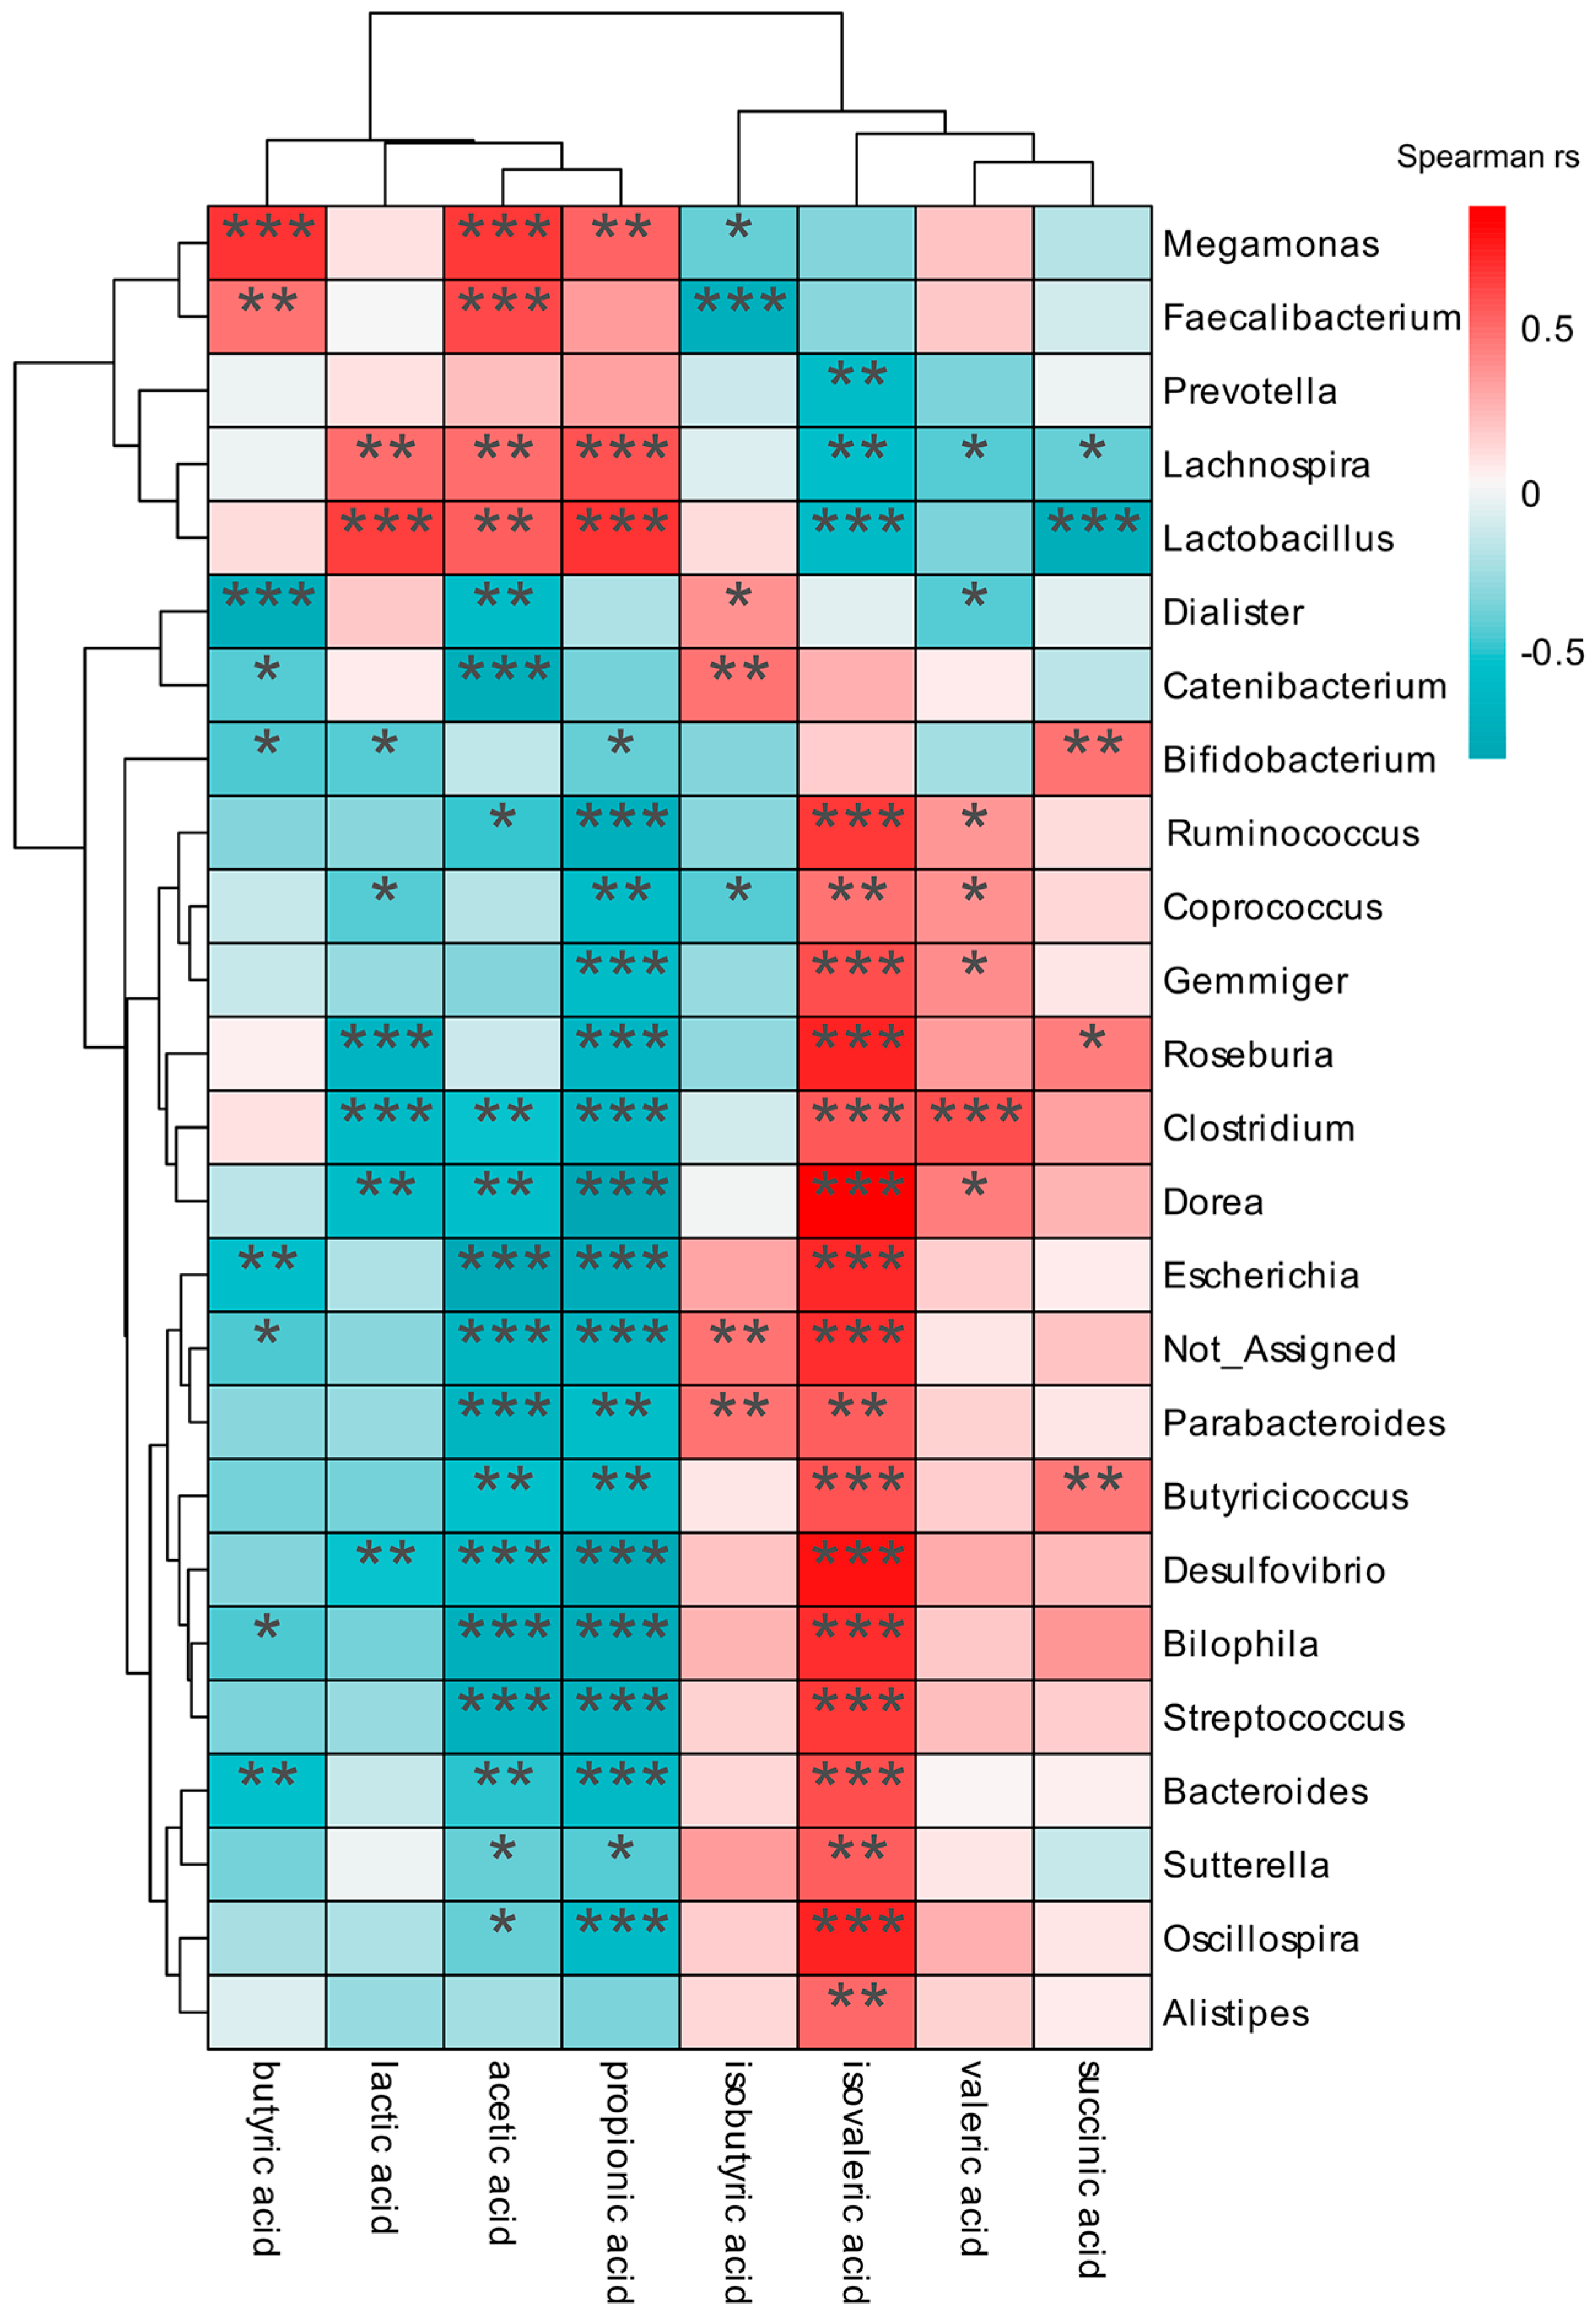
3.7. Correlation Analysis between Gut Microbiota and Carboxylic Acids
4. Discussion
5. Conclusions
Supplementary Materials
Author Contributions
Funding
Institutional Review Board Statement
Informed Consent Statement
Data Availability Statement
Conflicts of Interest
Abbreviations
| IG | indigestible glucan |
| BG | barley β-glucan |
| L | laminarin |
| BY | yeast β-glucan |
| PAC | pachyman |
| R | resistant starch |
| Lit | litesse |
| C | control |
| SCFA | short-chain fatty acid |
| SDF | soluble dietary fiber |
| IDF | insoluble dietary fiber |
| CAZymes | carbohydrate-active enzymes |
References
- Koh, A.; De Vadder, F.; Kovatcheva-Datchary, P.; Bäckhed, F. From Dietary Fiber to Host Physiology: Short-Chain Fatty Acids as Key Bacterial Metabolites. Cell 2016, 165, 1332–1345. [Google Scholar] [CrossRef] [PubMed]
- Deehan, E.C.; Duar, R.M.; Armet, A.M.; Perez-Munoz, M.E.; Jin, M.; Walter, J. Modulation of the Gastrointestinal Microbiome with Nondigestible Fermentable Carbohydrates To Improve Human Health. Microbiol. Spectr. 2017, 5, 1–24. [Google Scholar] [CrossRef] [PubMed]
- Cummings, J.H.; Mann, J.I.; Nishida, C.; Vorster, H.H. Dietary fibre: An agreed definition. Lancet 2009, 373, 365–366. [Google Scholar] [CrossRef] [PubMed]
- Barber, T.M.; Kabisch, S.; Pfeiffer, A.F.H.; Weickert, M.O. The Health Benefits of Dietary Fibre. Nutrients 2020, 12, 3209. [Google Scholar] [CrossRef]
- Bharucha, A.E.; Lacy, B.E. Mechanisms, Evaluation, and Management of Chronic Constipation. Gastroenterology 2020, 158, 1232–1249.e1233. [Google Scholar] [CrossRef]
- Soltani, M.; Kamyab, H.; El Enshasy, H. Molecular weight (Mw) and Monosaccharide composition (MC): Two major factors affecting the therapeutic action of polysaccharides extracted from Cordyceps sinensis. J. Pure Appl. Microbiol. 2013, 7, 1601–1613. [Google Scholar]
- Ferreira, S.S.; Passos, C.P.; Madureira, P.; Vilanova, M.; Coimbra, M.A. Structure–function relationships of immunostimulatory polysaccharides: A review. Carbohydr. Polym. 2015, 132, 378–396. [Google Scholar] [CrossRef]
- Fan, L.; Zuo, S.; Tan, H.; Hu, J.; Cheng, J.; Wu, Q.; Nie, S. Preventive effects of pectin with various degrees of esterification on ulcerative colitis in mice. Food Funct. 2020, 11, 2886–2897. [Google Scholar] [CrossRef]
- Bishehsari, F.; Engen, P.A.; Preite, N.Z.; Tuncil, Y.E.; Naqib, A.; Shaikh, M.; Rossi, M.; Wilber, S.; Green, S.J.; Hamaker, B.R.; et al. Dietary Fiber Treatment Corrects the Composition of Gut Microbiota, Promotes SCFA Production, and Suppresses Colon Carcinogenesis. Genes 2018, 9, 102. [Google Scholar] [CrossRef]
- Fulde, M.; Hornef, M.W. Maturation of the enteric mucosal innate immune system during the postnatal period. Immunol. Rev. 2014, 260, 21–34. [Google Scholar] [CrossRef]
- Kamada, N.; Chen, G.Y.; Inohara, N.; Nunez, G. Control of pathogens and pathobionts by the gut microbiota. Nat. Immunol. 2013, 14, 685–690. [Google Scholar] [CrossRef] [PubMed]
- Neuman, H.; Debelius, J.W.; Knight, R.; Koren, O. Microbial endocrinology: The interplay between the microbiota and the endocrine system. FEMS Microbiol. Rev. 2015, 39, 509–521. [Google Scholar] [CrossRef] [PubMed]
- Yano, J.M.; Yu, K.; Donaldson, G.P.; Shastri, G.G.; Ann, P.; Ma, L.; Nagler, C.R.; Ismagilov, R.F.; Mazmanian, S.K.; Hsiao, E.Y. Indigenous bacteria from the gut microbiota regulate host serotonin biosynthesis. Cell 2015, 161, 264–276. [Google Scholar] [CrossRef] [PubMed]
- Hungin, A.P.; Mulligan, C.; Pot, B.; Whorwell, P.; Agreus, L.; Fracasso, P.; Lionis, C.; Mendive, J.; Philippart, D.F.J.M.; Rubin, G.; et al. Systematic review: Probiotics in the management of lower gastrointestinal symptoms in clinical practice—An evidence-based international guide. Aliment. Pharmacol. Ther. 2013, 38, 864–886. [Google Scholar] [CrossRef]
- Zhou, M.; Zheng, X.; Zhu, H.; Li, L.; Zhang, L.; Liu, M.; Liu, Z.; Peng, M.; Wang, C.; Li, Q.; et al. Effect of Lactobacillus plantarum enriched with organic/inorganic selenium on the quality and microbial communities of fermented pickles. Food Chem. 2021, 365, 130495. [Google Scholar] [CrossRef]
- Holscher, H.D. Dietary fiber and prebiotics and the gastrointestinal microbiota. Gut Microbes 2017, 8, 172–184. [Google Scholar] [CrossRef]
- Wang, Y.; Ames, N.P.; Tun, H.M.; Tosh, S.M.; Jones, P.J.; Khafipour, E. High Molecular Weight Barley beta-Glucan Alters Gut Microbiota Toward Reduced Cardiovascular Disease Risk. Front. Microbiol. 2016, 7, 129. [Google Scholar]
- Falck, P.; Precha-Atsawanan, S.; Grey, C.; Immerzeel, P.; Stalbrand, H.; Adlercreutz, P.; Karlsson, E.N. Xylooligosaccharides from hardwood and cereal xylans produced by a thermostable xylanase as carbon sources for Lactobacillus brevis and Bifidobacterium adolescentis. J. Agric. Food Chem. 2013, 61, 7333–7340. [Google Scholar] [CrossRef]
- Baky, M.H.; Salah, M.; Ezzelarab, N.; Shao, P.; Elshahed, M.S.; Farag, M.A. Insoluble dietary fibers: Structure, metabolism, interactions with human microbiome, and role in gut homeostasis. Crit. Rev. Food Sci. Nutr. 2022, 53, 1–15. [Google Scholar] [CrossRef]
- Mudgil, D.; Barak, S. Composition, properties and health benefits of indigestible carbohydrate polymers as dietary fiber: A review. Int. J. Biol. Macromol. 2013, 61, 1–6. [Google Scholar] [CrossRef]
- Worrasinchai, S.; Suphantharika, M.; Pinjai, S.; Jamnong, P. β-Glucan prepared from spent brewer’s yeast as a fat replacer in mayonnaise. Food Hydrocoll. 2006, 20, 68–78. [Google Scholar] [CrossRef]
- Mikkelsen, M.S.; Jespersen, B.M.; Larsen, F.H.; Blennow, A.; Engelsen, S.B. Molecular structure of large-scale extracted β-glucan from barley and oat: Identification of a significantly changed block structure in a high β-glucan barley mutant. Food Chem. 2013, 136, 130–138. [Google Scholar] [CrossRef] [PubMed]
- Chen, J.; Yang, J.; Du, H.; Aslam, M.; Wang, W.; Chen, W.; Li, T.; Liu, Z.; Liu, X. Laminarin, a Major Polysaccharide in Stramenopiles. Mar. Drugs 2021, 19, 576. [Google Scholar] [CrossRef]
- Carvalho, V.S.D.; Gomez-Delgado, L.; Curto, M.A.; Moreno, M.B.; Perez, P.; Ribas, J.C.; Cortes, J.C.G. Analysis and application of a suite of recombinant endo-beta(1,3)-D-glucanases for studying fungal cell walls. Microb. Cell Factories 2021, 20, 126. [Google Scholar] [CrossRef] [PubMed]
- Habtemariam, S. Trametes versicolor (Synn. Coriolus versicolor) Polysaccharides in Cancer Therapy: Targets and Efficacy. Biomedicines 2020, 8, 135. [Google Scholar] [CrossRef] [PubMed]
- Wen, J.J.; Li, M.Z.; Hu, J.L.; Tan, H.Z.; Nie, S.P. Resistant starches and gut microbiota. Food Chem. 2022, 387, 132895. [Google Scholar] [CrossRef]
- Zou, S.; Duan, B.; Xu, X. Inhibition of tumor growth by beta-glucans through promoting CD4(+) T cell immunomodulation and neutrophil-killing in mice. Carbohydr. Polym. 2019, 213, 370–381. [Google Scholar] [CrossRef]
- Bourdon, I.; Yokoyama, W.; Davis, P.; Hudson, C.; Backus, R.; Richter, D.; Knuckles, B.; Schneeman, B.O. Postprandial lipid, glucose, insulin, and cholecystokinin responses in men fed barley pasta enriched with beta-glucan. Am. J. Clin. Nutr. 1999, 69, 55–63. [Google Scholar] [CrossRef]
- Dery, B.; Zaixiang, L. Recent Developments in Resistant Starch as a Functional Food. Starch-Stärke 2020, 73, 2000139. [Google Scholar]
- Liu, Y.; Liu, W.; Li, J.; Tang, S.; Wang, M.; Huang, W.; Yao, W.; Gao, X. A polysaccharide extracted from Astragalus membranaceus residue improves cognitive dysfunction by altering gut microbiota in diabetic mice. Carbohydr. Polym. 2019, 205, 500–512. [Google Scholar] [CrossRef]
- Liu, Y.; Wang, C.; Li, J.; Li, T.; Zhang, Y.; Liang, Y.; Mei, Y. Phellinus linteus polysaccharide extract improves insulin resistance by regulating gut microbiota composition. FASEB J. 2020, 34, 1065–1078. [Google Scholar] [CrossRef] [PubMed]
- Staudte, R.G.; Woodward, J.R.; Fincher, G.B.; Stone, B.A. Water-soluble (1→3), (1→4)-β-d-glucans from barley (Hordeum vulgare) endosperm. III. Distribution of cellotriosyl and cellotetraosyl residues. Carbohydr. Polym. 1983, 3, 299–312. [Google Scholar] [CrossRef]
- Zhang, H.; Row, K.H. Extraction and Separation of Polysaccharides from Laminaria japonica by Size-Exclusion Chromatography. J. Chromatogr. Sci. 2014, 53, 498–502. [Google Scholar] [CrossRef] [PubMed]
- Golisch, B.; Lei, Z.; Tamura, K.; Brumer, H. Configured for the Human Gut Microbiota: Molecular Mechanisms of Dietary β-Glucan Utilization. ACS Chem. Biol. 2021, 16, 2087–2102. [Google Scholar] [CrossRef]
- Saito, H.; Misaki, A.; Harada, T. A Comparison of the Structure of Curdlan and Pachyman. Agric. Biol. Chem. 1968, 32, 1261–1269. [Google Scholar] [CrossRef]
- Raigond, P.; Ezekiel, R.; Raigond, B. Resistant starch in food: A review. J. Sci. Food Agric. 2015, 95, 1968–1978. [Google Scholar] [CrossRef] [PubMed]
- Wang, H.; Shi, Y.; Le, G. Rapid microwave-assisted synthesis of polydextrose and identification of structure and function. Carbohydr. Polym. 2014, 113, 225–230. [Google Scholar] [CrossRef] [PubMed]
- Kim, H.J.; White, P.J. Optimizing the molecular weight of oat β-glucan for in vitro bile acid binding and fermentation. J. Agric. Food Chem. 2011, 59, 10322–10328. [Google Scholar] [CrossRef] [PubMed]
- Hughes, S.A.; Shewry, P.R.; Li, L.; Gibson, G.R.; Sanz, M.L.; Rastall, R.A. In vitro fermentation by human fecal microflora of wheat arabinoxylans. J. Agric. Food Chem. 2007, 55, 4589–4595. [Google Scholar] [CrossRef]
- Wang, H.; Chen, G.; Li, X.; Zheng, F.; Zeng, X. Yeast beta-glucan, a potential prebiotic, showed a similar probiotic activity to inulin. Food Funct. 2020, 11, 10386–10396. [Google Scholar] [CrossRef]
- Williams, B.A.; Mikkelsen, D.; le Paih, L.; Gidley, M.J. In vitro fermentation kinetics and end-products of cereal arabinoxylans and (1,3;1,4)-β-glucans by porcine faeces. J. Cereal Sci. 2011, 53, 53–58. [Google Scholar] [CrossRef]
- Liu, X.Y.; Lu-Yao, M.A.; Wang, L.; Wang, X.Y.; Nie, S.P.; Xie, M.Y.; Yin, J.Y. Monosaccharide Composition Analysis of Arabinoxylan by High Performance Anion Exchange Chromatography with Pulsed Amperometric Detection. Chin. J. Anal. Chem. 2017, 45, 416–422. [Google Scholar]
- Crittenden, R.; Karppinen, S.; Ojanen, S.; Tenkanen, M.; Fagerström, R.; Mättö, J.; Saarela, M.; Mattila-Sandholm, T.; Poutanen, K. In vitro fermentation of cereal dietary fibre carbohydrates by probiotic and intestinal bacteria. J. Sci. Food Agric. 2002, 82, 781–789. [Google Scholar] [CrossRef]
- Wang, H.; Shi, Y.; Zhang, S.; Gao, X.; Liu, F.; Zhang, H.; Dai, Y.; Wang, Y.; Lu, F. The Vitro Fermentation of Six Functional Oligosaccharides by Clostridium butyricum TK2 and Clostridium butyricum CB8. Food Sci. Technol. Res. 2014, 20, 1005–1011. [Google Scholar] [CrossRef]
- Hu, J.-L.; Nie, S.-P.; Min, F.-F.; Xie, M.-Y. Polysaccharide from Seeds of Plantago asiatica L. Increases Short-Chain Fatty Acid Production and Fecal Moisture along with Lowering pH in Mouse Colon. J. Agric. Food Chem. 2012, 60, 11525–11532. [Google Scholar] [CrossRef]
- Zhao, Y.X.; Hua, H.Y.; Liu, L. Development and validation of an HPLC method for determination of oleanolic acid content and partition of oleanolic acid in submicron emulsions. Pharmazie 2009, 64, 491–494. [Google Scholar]
- Heravi, F.S.; Zakrzewski, M.; Vickery, K.; Hu, H. Host DNA depletion efficiency of microbiome DNA enrichment methods in infected tissue samples. J. Microbiol. Methods 2020, 170, 105856. [Google Scholar] [CrossRef]
- Chen, C.; Wang, H.; Hong, T.; Huang, X.; Xia, S.; Zhang, Y.; Chen, X.; Zhong, Y.; Nie, S. Effects of tea polysaccharides in combination with polyphenols on dextran sodium sulfate-induced colitis in mice. Food Chem. X 2022, 13, 100190. [Google Scholar] [CrossRef]
- Wittwer, C.T.; Herrmann, M.G.; Moss, A.A.; Rasmussen, R.P. Continuous fluorescence monitoring of rapid cycle DNA amplification. BioTechniques 1997, 22, 130–131, 134–138. [Google Scholar] [CrossRef]
- Nguyen, T.D. Glycerol Esters of Butyric and Valeric Acids Counteract Diet-Related Disorders: Prevention of Metabolic Disturbances Induced by High-FAT Intake; Department of Food Technology, Lund University: Lund, Sweden, 2019. [Google Scholar]
- Lam, K.L.; Cheung, P.C. Carbohydrate-Based Prebiotics in Targeted Modulation of Gut Microbiome. J. Agric. Food Chem. 2019, 67, 12335–12340. [Google Scholar] [CrossRef]
- Yang, J.; Martinez, I.; Walter, J.; Keshavarzian, A.; Rose, D.J. In vitro characterization of the impact of selected dietary fibers on fecal microbiota composition and short chain fatty acid production. Anaerobe 2013, 23, 74–81. [Google Scholar] [CrossRef] [PubMed]
- Zhao, J.; Cheung, P.C. Fermentation of β-glucans derived from different sources by bifidobacteria: Evaluation of their bifidogenic effect. J. Agric. Food Chem. 2011, 59, 5986–5992. [Google Scholar] [CrossRef] [PubMed]
- Kaur, A.; Rose, D.J.; Rumpagaporn, P.; Patterson, J.A.; Hamaker, B.R. In vitro batch fecal fermentation comparison of gas and short-chain fatty acid production using “slowly fermentable” dietary fibers. J. Food Sci. 2011, 76, H137–H142. [Google Scholar] [CrossRef] [PubMed]
- Fehlbaum, S.; Prudence, K.; Kieboom, J.; Heerikhuisen, M.; van den Broek, T.; Schuren, F.H.J.; Steinert, R.E.; Raederstorff, D. In Vitro Fermentation of Selected Prebiotics and Their Effects on the Composition and Activity of the Adult Gut Microbiota. Int. J. Mol. Sci. 2018, 19, 3097. [Google Scholar] [CrossRef]
- Varelas, V.; Liouni, M.; Calokerinos, A.C.; Nerantzis, E.T. An evaluation study of different methods for the production of β-D-glucan from yeast biomass. Drug Test. Anal. 2016, 8, 46–55. [Google Scholar] [CrossRef]
- Vaikousi, H.; Biliaderis, C.G.; Izydorczyk, M.S. Solution flow behavior and gelling properties of water-soluble barley (1→3,1→4)-β-glucans varying in molecular size. J. Cereal Sci. 2004, 39, 119–137. [Google Scholar] [CrossRef]
- Usoltseva, R.V.; Belik, A.A.; Kusaykin, M.I.; Malyarenko, O.S.; Zvyagintseva, T.N.; Ermakova, S.P. Laminarans and 1,3-β-D-glucanases. Int. J. Biol. Macromol. 2020, 163, 1010–1025. [Google Scholar] [CrossRef]
- Li, W.; Fang, K.; Yuan, H.; Li, D.; Li, H.; Chen, Y.; Luo, X.; Zhang, L.; Ye, X. Acid-induced Poria cocos alkali-soluble polysaccharide hydrogel: Gelation behaviour, characteristics, and potential application in drug delivery. Int. J. Biol. Macromol. 2023, 45, 124383. [Google Scholar] [CrossRef]
- Lončarević, I.; Pajin, B.; Petrović, J.; Nikolić, I.; Maravić, N.; Ačkar, Đ.; Šubarić, D.; Zarić, D.; Miličević, B. White Chocolate with Resistant Starch: Impact on Physical Properties, Dietary Fiber Content and Sensory Characteristics. Molecules 2021, 26, 5908. [Google Scholar] [CrossRef]
- Lahtinen, S.J.; Knoblock, K.; Drakoularakou, A.; Jacob, M.; Stowell, J.; Gibson, G.R.; Ouwehand, A.C. Effect of molecule branching and glycosidic linkage on the degradation of polydextrose by gut microbiota. Biosci. Biotechnol. Biochem. 2010, 74, 2016–2021. [Google Scholar] [CrossRef]
- Nilsson, U.; Nyman, M. Short-chain fatty acid formation in the hindgut of rats fed oligosaccharides varying in monomeric composition, degree of polymerisation and solubility. Br. J. Nutr. 2005, 94, 705–713. [Google Scholar] [CrossRef] [PubMed]
- Zhang, B.; Zhong, Y.; Dong, D.; Zheng, Z.; Hu, J. Gut microbial utilization of xylan and its implication in gut homeostasis and metabolic response. Carbohydr. Polym. 2022, 286, 119271. [Google Scholar] [CrossRef] [PubMed]
- Liu, Y.; Zhou, H.; Fan, J.; Huang, H.; Deng, J.; Tan, B. Assessing effects of guar gum viscosity on the growth, intestinal flora, and intestinal health of Micropterus salmoides. Int. J. Biol. Macromol. 2022, 222, 1037–1047. [Google Scholar] [CrossRef]
- Rosch, C.; Taverne, N.; Venema, K.; Gruppen, H.; Wells, J.M.; Schols, H.A. Effects of in vitro fermentation of barley beta-glucan and sugar beet pectin using human fecal inocula on cytokine expression by dendritic cells. Mol. Nutr. Food Res. 2017, 61, 1600243. [Google Scholar] [CrossRef] [PubMed]
- Gu, F.; Borewicz, K.; Richter, B.; van der Zaal, P.H.; Smidt, H.; Buwalda, P.L.; Schols, H.A. In Vitro Fermentation Behavior of Isomalto/Malto-Polysaccharides Using Human Fecal Inoculum Indicates Prebiotic Potential. Mol. Nutr. Food Res. 2018, 62, e1800232. [Google Scholar] [CrossRef]
- El, K.A.; Armougom, F.; Gordon, J.I.; Raoult, D.; Henrissat, B. The abundance and variety of carbohydrate-active enzymes in the human gut microbiota. Nat. Rev. Microbiol. 2013, 11, 497–504. [Google Scholar]
- Singh, R.P.; Rajarammohan, S.; Thakur, R.; Hassan, M. Linear and branched beta-Glucans degrading enzymes from versatile Bacteroides uniformis JCM 13288(T) and their roles in cooperation with gut bacteria. Gut Microbes 2020, 12, 1826761. [Google Scholar] [CrossRef]
- Buliga, G.S.; Brant, D.A.; Fincher, G.B. The sequence statistics and solution conformation of a barley (1----3, 1----4)-beta-D-glucan. Carbohydr. Res. 1986, 157, 139–156. [Google Scholar] [CrossRef]
- Wardman, J.F.; Bains, R.K.; Rahfeld, P.; Withers, S.G. Carbohydrate-active enzymes (CAZymes) in the gut microbiome. Nat. Rev. Microbiol. 2022, 20, 542–556. [Google Scholar] [CrossRef]
- Planas, A. Bacterial 1,3-1,4-beta-glucanases: Structure, function and protein engineering. Biochim. Biophys. Acta 2000, 1543, 361–382. [Google Scholar] [CrossRef]
- Barras, D.R.; Moore, A.E.; Stone, B.A. Enzyme-Substrate Relationships Among β-Glucan Hydrolases. Adv. Chem. 1969, 95, 105–138. [Google Scholar]
- Martens, E.C.; Lowe, E.C.; Chiang, H.; Pudlo, N.A.; Wu, M.; McNulty, N.P.; Abbott, D.W.; Henrissat, B.; Gilbert, H.J.; Bolam, D.N.; et al. Recognition and degradation of plant cell wall polysaccharides by two human gut symbionts. PLoS Biol. 2011, 9, e1001221. [Google Scholar] [CrossRef] [PubMed]
- Evans, D.F.; Pye, G.; Bramley, R.; Clark, A.G.; Dyson, T.J.; Hardcastle, J.D. Measurement of gastrointestinal pH profiles in normal ambulant human subjects. Gut 1988, 29, 1035–1041. [Google Scholar] [CrossRef] [PubMed]
- Kobayashi, H.; Saito, H.; Kakegawa, T. Bacterial strategies to inhabit acidic environments. J. Gen. Appl. Microbiol. 2000, 46, 235–243. [Google Scholar] [CrossRef]
- Guerra, A.; Etienne-Mesmin, L.; Livrelli, V.; Denis, S.; Blanquet-Diot, S.; Alric, M. Relevance and challenges in modeling human gastric and small intestinal digestion. Trends Biotechnol. 2012, 30, 591–600. [Google Scholar] [CrossRef]
- Strain, C.R.; Collins, K.C.; Naughton, V.; McSorley, E.M.; Stanton, C.; Smyth, T.J.; Soler-Vila, A.; Rea, M.C.; Ross, P.R.; Cherry, P.; et al. Effects of a polysaccharide-rich extract derived from Irish-sourced Laminaria digitata on the composition and metabolic activity of the human gut microbiota using an in vitro colonic model. Eur. J. Nutr. 2020, 59, 309–325. [Google Scholar] [CrossRef] [PubMed]
- Kundiyana, D.K.; Wilkins, M.R.; Maddipati, P.; Huhnke, R.L. Effect of temperature, pH and buffer presence on ethanol production from synthesis gas by “Clostridium ragsdalei”. Bioresour. Technol. 2011, 102, 5794–5799. [Google Scholar] [CrossRef] [PubMed]
- Timm, D.A.; Stewart, M.L.; Hospattankar, A.; Slavin, J.L. Wheat dextrin, psyllium, and inulin produce distinct fermentation patterns, gas volumes, and short-chain fatty acid profiles in vitro. J. Med. Food 2010, 13, 961–966. [Google Scholar] [CrossRef]
- Cummings, J.H.; Pomare, E.W.; Branch, W.J.; Naylor, C.P.; Macfarlane, G.T. Short chain fatty acids in human large intestine, portal, hepatic and venous blood. Gut 1987, 28, 1221–1227. [Google Scholar] [CrossRef]
- Hughes, S.A.; Shewry, P.R.; Gibson, G.R.; McCleary, B.V.; Rastall, R.A. In vitro fermentation of oat and barley derived beta-glucans by human faecal microbiota. FEMS Microbiol. Ecol. 2008, 64, 482–493. [Google Scholar] [CrossRef]
- Sun, Y.; Hu, J.; Zhang, S.; He, H.; Nie, Q.; Zhang, Y.; Chen, C.; Geng, F.; Nie, S. Prebiotic characteristics of arabinogalactans during in vitro fermentation through multi-omics analysis. Food Chem. Toxicol. 2021, 156, 112522. [Google Scholar] [CrossRef] [PubMed]
- Mikkelsen, D.; Gidley, M.J.; Williams, B.A. In vitro fermentation of bacterial cellulose composites as model dietary fibers. J. Agric. Food Chem. 2011, 59, 4025–4032. [Google Scholar] [CrossRef] [PubMed]
- Lamothe, L.M.; Cantu-Jungles, T.M.; Chen, T.; Green, S.; Naqib, A.; Srichuwong, S.; Hamaker, B.R. Boosting the value of insoluble dietary fiber to increase gut fermentability through food processing. Food Funct. 2021, 12, 10658–10666. [Google Scholar] [CrossRef] [PubMed]
- Yoshikawa, S.; Araoka, R.; Kajihara, Y.; Ito, T.; Miyamoto, H.; Kodama, H. Valerate production by Megasphaera elsdenii isolated from pig feces. J. Biosci. Bioeng. 2018, 125, 519–524. [Google Scholar] [CrossRef] [PubMed]
- Wang, M.; Wichienchot, S.; He, X.; Fu, X.; Huang, Q.; Zhang, B. In vitro colonic fermentation of dietary fibers: Fermentation rate, short-chain fatty acid production and changes in microbiota. Trends Food Sci. Technol. 2019, 88, 1–9. [Google Scholar] [CrossRef]
- Bartolomaeus, H.; Balogh, A.; Yakoub, M.; Homann, S.; Marko, L.; Hoges, S.; Tsvetkov, D.; Krannich, A.; Wundersitz, S.; Avery, E.G.; et al. Short-Chain Fatty Acid Propionate Protects From Hypertensive Cardiovascular Damage. Circulation 2019, 139, 1407–1421. [Google Scholar] [CrossRef] [PubMed]
- Kasahara, K.; Krautkramer, K.A.; Org, E.; Romano, K.A.; Kerby, R.L.; Vivas, E.I.; Mehrabian, M.; Denu, J.M.; Backhed, F.; Lusis, A.J.; et al. Interactions between Roseburia intestinalis and diet modulate atherogenesis in a murine model. Nat. Microbiol. 2018, 3, 1461–1471. [Google Scholar] [CrossRef]
- Zhao, J.; Zhang, X.; Liu, H.; Brown, M.A.; Qiao, S. Dietary Protein and Gut Microbiota Composition and Function. Curr. Protein Pept. Sci. 2019, 20, 145–154. [Google Scholar] [CrossRef]
- Bai, J.; Li, Y.; Li, T.; Zhang, W.; Fan, M.; Zhang, K.; Qian, H.; Zhang, H.; Qi, X.; Wang, L. Comparison of Different Soluble Dietary Fibers during the In Vitro Fermentation Process. J. Agric. Food Chem. 2021, 69, 7446–7457. [Google Scholar] [CrossRef]
- Heinken, A.; Khan, M.T.; Paglia, G.; Rodionov, D.A.; Harmsen, H.J.; Thiele, I. Functional metabolic map of Faecalibacterium prausnitzii, a beneficial human gut microbe. J. Bacteriol. 2014, 196, 3289–3302. [Google Scholar] [CrossRef]
- Mu, Q.; Tavella, V.J.; Luo, X.M. Role of Lactobacillus reuteri in Human Health and Diseases. Front. Microbiol. 2018, 9, 757. [Google Scholar] [CrossRef] [PubMed]
- Galvez, E.J.C.; Iljazovic, A.; Amend, L.; Lesker, T.R.; Renault, T.; Thiemann, S.; Hao, L.; Roy, U.; Gronow, A.; Charpentier, E.; et al. Distinct Polysaccharide Utilization Determines Interspecies Competition between Intestinal Prevotella spp. Cell Host Microbe 2020, 28, 838–852.e836. [Google Scholar] [CrossRef] [PubMed]
- Turroni, F.; Ventura, M.; Buttó, L.F.; Duranti, S.; O’Toole, P.W.; Motherway, M.O.; van Sinderen, D. Molecular dialogue between the human gut microbiota and the host: A Lactobacillus and Bifidobacterium perspective. Cell. Mol. Life Sci. 2014, 71, 183–203. [Google Scholar] [CrossRef] [PubMed]
- Hjorth, M.F.; Roager, H.M.; Larsen, T.M.; Poulsen, S.K.; Licht, T.R.; Bahl, M.I.; Zohar, Y.; Astrup, A. Pre-treatment microbial Prevotella-to-Bacteroides ratio, determines body fat loss success during a 6-month randomized controlled diet intervention. Int. J. Obes. 2018, 42, 284. [Google Scholar] [CrossRef]
- Magne, F.; Gotteland, M.; Gauthier, L.; Zazueta, A.; Pesoa, S.; Navarrete, P.; Balamurugan, R. The Firmicutes/Bacteroidetes Ratio: A Relevant Marker of Gut Dysbiosis in Obese Patients? Nutrients 2020, 12, 1474. [Google Scholar] [CrossRef]
- Baxter, N.T.; Schmidt, A.W.; Venkataraman, A.; Kim, K.S.; Waldron, C.; Schmidt, T.M. Dynamics of Human Gut Microbiota and Short-Chain Fatty Acids in Response to Dietary Interventions with Three Fermentable Fibers. mBio 2019, 10, e02566-18. [Google Scholar] [CrossRef]
- Wang, Y.-X.; Yin, J.-Y.; Zhang, T.; Xin, Y.; Huang, X.-J.; Nie, S.-P. Utilizing relative ordered structure theory to guide polysaccharide purification for structural characterization. Food Hydrocoll. 2021, 115, 106603. [Google Scholar] [CrossRef]
- Castillo, M.; Martinorue, S.; Manzanilla, E.; Badiola, I.; Martin, M.; Gasa, J. Quantification of total bacteria, enterobacteria and lactobacilli populations in pig digesta by real-time PCR. Vet. Microbiol. 2006, 114, 165–170. [Google Scholar] [CrossRef]
- Abdulamir, A.; Nordin, N.; Toke, T.S. Methods for Precise Molecular Detection of Probiotic Microflora: Using Adjusted Molecular Biology Protocols, Primer Sets and PCR Assays. Biotechnology 2010, 9, 25–32. [Google Scholar]
- Rinttila, T.; Kassinen, A.; Malinen, E.; Krogius, L.; Palva, A. Development of an extensive set of 16S rDNA-targeted primers for quantification of pathogenic and indigenous bacteria in faecal samples by real-time PCR. J. Appl. Microbiol. 2004, 97, 1166–1177. [Google Scholar] [CrossRef]
- Ramirez-Farias, C.; Slezak, K.; Fuller, Z.; Duncan, A.; Holtrop, G.; Louis, P. Effect of inulin on the human gut microbiota: Stimulation of Bifidobacterium adolescentis and Faecalibacterium prausnitzii. Br. J. Nutr. 2009, 101, 541–550. [Google Scholar] [CrossRef] [PubMed]
- Matsuki, T.; Watanabe, K.; Fujimoto, J.; Miyamoto, Y.; Takada, T.; Matsumoto, K.; Oyaizu, H.; Tanaka, R. Development of 16S rRNA-gene-targeted group-specific primers for the detection and identification of predominant bacteria in human feces. Appl. Environ. Microbiol. 2002, 68, 5445–5451. [Google Scholar] [CrossRef] [PubMed]
- Matsuki, T.; Watanabe, K.; Fujimoto, J.; Takada, T.; Tanaka, R. Use of 16S rRNA gene-targeted group-specific primers for real-time PCR analysis of predominant bacteria in human feces. Appl. Environ. Microbiol. 2004, 70, 7220–7228. [Google Scholar] [CrossRef] [PubMed]


| Indigestible Glucans | MW (kDa) | Water Solubility (%) | Glycosidic Linkage | Company and Product Code | Source |
|---|---|---|---|---|---|
| Barley β-glucan | 179 | 97.78 | β-(1,3) & β-(1,4) | Megazyme, Bray, Ireland (cat no. P-BGBL) | Barley flour |
| Laminarin | 4–5 | 90.02 | β-(1,3) & β-(1,6) | Sigma Aldrich, Saint Louis, MO, USA (cat no. L9634) | Laminaria digitata |
| Yeast β-glucan | 200 | 20.40 | β-(1,3) & β-(1,6) | Megazyme, Bray, Ireland (cat no. P-BGYST) | Yeast |
| Pachyman | 11–40 | 2.77 | β-(1,3) | Megazyme, Bray, Ireland (cat no. P-PACHY) | Poria coco |
| Resistant starch | - | 4.94 | α-(1,4) & α-(1,6) | Ingredion, Chicago, IL, USA, Novelose 260 | High-amylose maize |
| Litesse | 3.2 | 93.19 | β-(1,2), β-(1,3), β-(1,4), β-(1,6); β-(1,6) dominated | Danisco, Copenhagen, Denmark, Litesse | Artificial synthesis |
Disclaimer/Publisher’s Note: The statements, opinions and data contained in all publications are solely those of the individual author(s) and contributor(s) and not of MDPI and/or the editor(s). MDPI and/or the editor(s) disclaim responsibility for any injury to people or property resulting from any ideas, methods, instructions or products referred to in the content. |
© 2023 by the authors. Licensee MDPI, Basel, Switzerland. This article is an open access article distributed under the terms and conditions of the Creative Commons Attribution (CC BY) license (https://creativecommons.org/licenses/by/4.0/).
Share and Cite
Zhang, H.; Chen, C.; Zhang, Y.; Yin, H.; Hu, J.; Zhong, Y.; Nie, S.; Xie, M. In Vitro Fermentation of Different Indigestible Glucans with Varying Physico-Chemical Properties by Human Fecal Microbiota. Fermentation 2023, 9, 485. https://doi.org/10.3390/fermentation9050485
Zhang H, Chen C, Zhang Y, Yin H, Hu J, Zhong Y, Nie S, Xie M. In Vitro Fermentation of Different Indigestible Glucans with Varying Physico-Chemical Properties by Human Fecal Microbiota. Fermentation. 2023; 9(5):485. https://doi.org/10.3390/fermentation9050485
Chicago/Turabian StyleZhang, Hao, Chunhua Chen, Yanli Zhang, Hongmei Yin, Jielun Hu, Yadong Zhong, Shaoping Nie, and Mingyong Xie. 2023. "In Vitro Fermentation of Different Indigestible Glucans with Varying Physico-Chemical Properties by Human Fecal Microbiota" Fermentation 9, no. 5: 485. https://doi.org/10.3390/fermentation9050485