Article

Enhancing the Activity of a Self-Inducible Promoter in Escherichia coli through Saturation Mutation and High-Throughput Screening

1
Tianjin Key Laboratory of Brine Chemical Engineering and Resource Eco-Utilization, College of Chemical Engineering and Materials Science, Tianjin University of Science & Technology, Tianjin 300457, China
2
Tianjin Key Laboratory for Industrial Biological System and Bioprocessing Engineering, Tianjin Institute of Industrial Biotechnology, Chinese Academy of Sciences, Tianjin 300308, China
3
National Innovation Centre for Synthetic Biology, Tianjin 300308, China
4
Department of Chemistry, COMSATS University Islamabad, Park Road, Tarlai Kalan, Islamabad 45550, Pakistan
5
School of Chemical Engineering and Technology, Hebei University of Technology, Tianjin 300130, China
6
School of Food Science and Technology, Dalian Polytechnic University, Dalian 116034, China
*
Authors to whom correspondence should be addressed.
These authors contributed equally to this work.
Fermentation 2023, 9(5), 468; https://doi.org/10.3390/fermentation9050468
Submission received: 30 March 2023 / Revised: 7 May 2023 / Accepted: 11 May 2023 / Published: 13 May 2023

Abstract

:
The use of self-inducible promoters is a promising strategy to address metabolic imbalances caused by overexpression. However, the low activity of natural self-inducible promoters hinders their widespread application. To overcome this limitation, we selected the fic promoter as a model promoter to create an enhanced self-inducible promoter library using saturation mutations and high-throughput screening. Sequence analysis revealed that these promoters share certain characteristics, including semi-conservation in the −35 hexamer, highly conserved cytosine in the −17 motif (compared to −13 for other promoters), and moderate A+T content between positions −33 and −18 in the spacer region. Additionally, the discriminator region of these promotors features high A+T content in the first five bases. We identified PficI-17, PficII-33, and PficIII-14 promoters as the optional promoters in the −35 hexamer, spacer region, and discriminator mutation libraries, respectively. These promotors were used as representatives to measure the specific fluorescence and OD600 nm dynamics in different media and to confirm their effect on the expression of different proteins, including egfp (enhanced green fluorescence protein) and rfp (red fluorescence protein). Overall, our findings provide valuable guidance for modifying promoters and developing a promoter library suitable for regulating target genes.

1. Introduction

In the early fermentation stage of E. coli, the extensive expression of genes encoding toxic proteins [1,2,3,4,5], membrane proteins [6,7,8], and other organic compounds [9,10,11,12,13,14,15] negatively impacts biomass accumulation. Delaying the expression of these genes to the stationary phase weakens this effect and increases the yield of the target product [1]. Chemical inducers, such as isopropyl β-D-1-thiogalactopyrano-side (IPTG) [16,17], are commonly used to regulate these promotors, but their extensive usage in factory fermentation increases production costs and is toxic to the host. Moreover, the expression level of the exogenous inducible promoter cannot be easily controlled during fed-batch fermentation as the dosage of inducers, such as IPTG, lactose, and arabinose, remains constant regardless of changes in the medium composition or cell growth stage. To address this challenge, the development of self-inducible promoters that can respond to the stationary phase seems to be a better alternative.
Once E. coli strains enter the stationary phase, the transcription factor associated with the RNA polymerase core enzyme is replaced with sigma s (σS, alternative transcription factor) from sigma 70 (σ70, housekeeping transcription factor) [18,19] due to the active expression of the rpoS gene, the reduction in σS proteolysis, and the accumulation of factors that support EσS formation [20,21,22,23,24,25,26] caused by multiple survival stresses [27,28]. Self-inducible promoters recognized and combined by σS initiate over one thousand stationary phase genes [29,30,31], including stress genes, membrane protein genes, and metabolic enzyme genes [32,33,34,35,36,37], which can protect stationary-phase E. coli against environmental stress. This relationship between environmental stress and the σS factor determines the bacterium’s greater capacity to adapt to adversity during the stationary phase rather than the logarithmic phase. However, natural self-inducible promoters have two main disadvantages that hinder their wide application. The first is leaky expression due to the similar transcription recognition sites between σS and σ70, leading to many σS selectivity promoters being recognized by σ70 and expressed during the logarithmic phase. σS and σ70 are homologous proteins [19,38,39]. The −10 hexamer and −35 hexamer are recognized and interact through conserved regions 2.4 and 4.2 in both σS and σ70. The σS- and σ70-selective promoters share almost identical optimal sequences [18,40,41,42]. The second difficulty is the weak strength of the self-inducible promoter [43,44], which was selected by natural evolution because only weak expression was needed to sustain basic metabolism in the stationary phase. However, high σS selectivity and strongly expressed self-inducible promoters are required to produce target proteins in E. coli.
In this experiment, we selected the fic promoter as a model to create an enhanced self-inducible library. The reason for this selection was its strict σS selectivity [43,45]. It is well known that the difference in the −35 hexamer, spacer region, and discriminator can result in different σS selectivity and promoters’ strength [18,40,46,47,48,49,50,51]. Therefore, we carried out saturation mutations in the above regions to obtain a continuous intensity spectrum of the response σS factor. While some research has been conducted on modulating the strength of stationary-phase promoters [52], the lack of effective screening tools renders most promoters non-σS selective. To achieve the σS selectivity and strength of promoter libraries, we conducted high-throughput screening and fluorometric assays using flow cytometry and a microplate reader. This experiment aims to provide more practical options for regulating the endogenous expression of target genes in E. coli.

2. Materials and Methods

2.1. Strains, Plasmids, Competent Cells, and Reagents

The E. coli strain JM109 was utilized for cloning and plasmid DNA propagation, as well as for studying promoter activities. To construct the JM109-ΔrpoS strain, the CRISPR-Cas9/ΔrpoS plasmid was used to knock out a total of 351 bp of the rpoS gene in the JM109 strain. The resulting JM109-ΔrpoS strain was utilized to detect and discard σ70-selective promoters. The pET28a plasmid was used as a promoter-egfp expression vector. Competent cells were prepared for both JM109 and JM109-ΔrpoS using a super competence preparation kit (Sangon Biotech, Shanghai, China). The amplifying enzyme and ligase enzyme used in this experiment were PrimeSTAR® Max DNA Polymerase (Takara, Kyoto, Japan) and a Minerva Super Fusion Cloning Kit (US Everbright® 167 Inc., Suzhou, China), respectively. An E.Z.N.A.® Gel Extraction Kit (Omega Bio-Tek, Beijing, China) was used to purify the gene fragments, and a Fast Plasmid Miniprep kit (Bioequip, Beijing, China) was used to collect the plasmids. Thermo Scientific (Beijing, China) provided EcoRI/SalI restriction endonucleases and T4 ligase for cleaving and inserting the rfp gene into the vector plasmid.

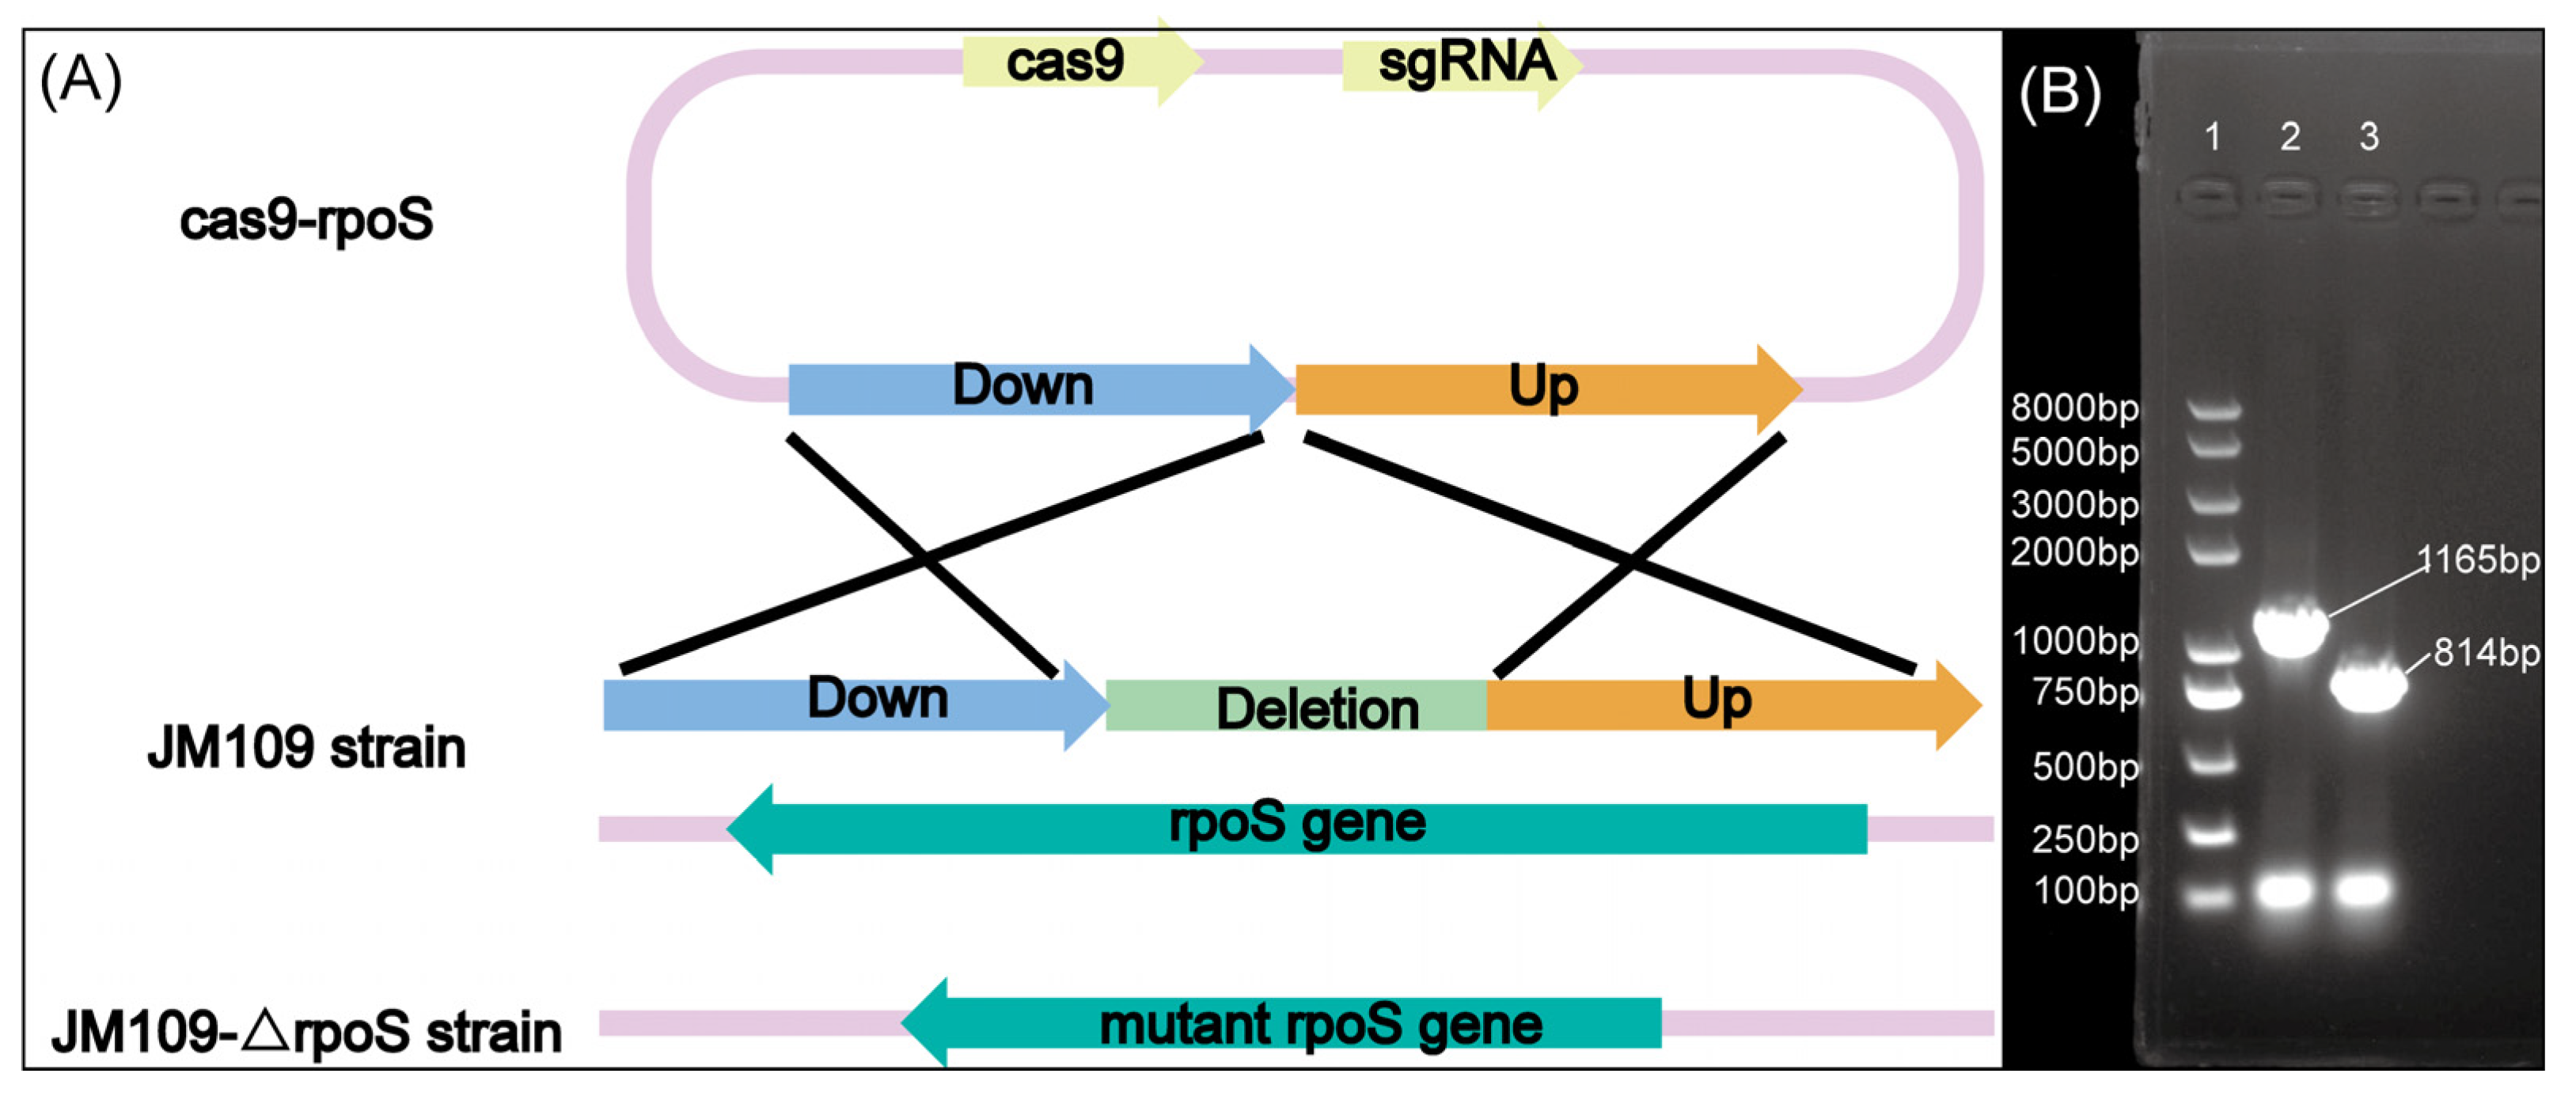
2.2. Construction of the JM109-ΔrpoS Strain

The NCBI database (http://www.ncbi.nlm.nih.gov) accessed on 30 January 2023 was searched for the rpoS gene (ID: 947210). Using the CHOPCHOP web tool (https://chopchop.cbu.uib.no) accessed on 10 February 2023 [53], a single guide RNA (sgRNA) was designed to knock out the rpoS gene. The target gene was the overall 993 bp of the rpoS gene, and the organism used was Escherichia coli (str. K-12/MG1655). CRISPR/Cas9 was the effector, and the purpose was to achieve a knockout gene. A predicted sgRNA, GGTCAAACTTCTCTACCGCGCGG, was identified at the 588th site, with 55% C+G content and 0% self-complementarity, and was designed into the primers N20-F and N20-R. All the primers used in this experiment are shown in the supplementary materials (Table S1). The primers Vect-F/N20-R and N20-F/Vect-R were used to clone fragment Vect1 and fragment Vect2. The primers UP-F/UP-R and DOWN-F/DOWN-R were used to clone the UP and DOWN fragments, respectively, using the E. coli genome as a template. The UP-DOWN fragment was cloned using the UP-F/DOWN-R primers, based on the overlap PCR principle, using the UP and DOWN fragment mixture as a template. Fragments Vect1, Vect2, and UP-DOWN were purified and fused into the CRISPR-Cas9/ΔrpoS plasmid using the Minerva Super Fusion Cloning Kit.
The JM109 competent cells were imported with the CRISPR-Cas9/ΔrpoS plasmid, and the JM109/CRISPR-Cas9/ΔrpoS strain was obtained. This strain was incubated in LB medium with 100 mg/L ampicillin at 30 °C until the OD600nm reached 0.05. Then 10 mM arabinose was added to induce the expression of the Cas9 protein. The primers YrpoS-F/YrpoS-R were used to confirm that the rpoS sequence was correct in the JM109 strain and knocked out in the JM109-ΔrpoS strain. Finally, the JM109-ΔrpoS/CRISPR-Cas9/ΔrpoS strain was incubated in LB medium without ampicillin at 37 °C and transferred to the next generation every 24 h. Replicate plating was carried out on LB plates with and without ampicillin starting from the third generation. Only the strains that did not grow on the LB plate with ampicillin but grew on the LB plate without ampicillin confirmed that the CRISPR-Cas9/ΔrpoS plasmid was lost from the JM109-ΔrpoS strain.

2.3. Construction of the Expression Vector

The promoter probe vector, the pET28a-egfp plasmid with kanamycin, was cloned using the V-F/V-R primers. The PCR procedure consisted of 35 cycles, with initial denaturation at 98 °C for 10 s, annealing at 55 °C for 15 s, and extension at 72 °C for 90 s. The resulting promoter library, named PficN (PficI, PficII, and PficIII for the −35 hexamer, spacer region, and discriminator saturation mutations, respectively), was generated by combining the primer P-L with the oligonucleotides Model I, Model II, and Model III and extending to double-stranded DNA using PrimeSTAR® Max DNA Polymerase. The construction of the promoter library fragment was carried out under two temperature conditions, with the temperature reduced from 98 °C to 20 °C over 20 min for combining, followed by extending at 72 °C for 5 min. Finally, the promoter probe vector and promoter library fragment were purified using an E.Z.N.A.® Gel Extraction Kit and fused to construct the pET28a-PficN-egfp plasmid.

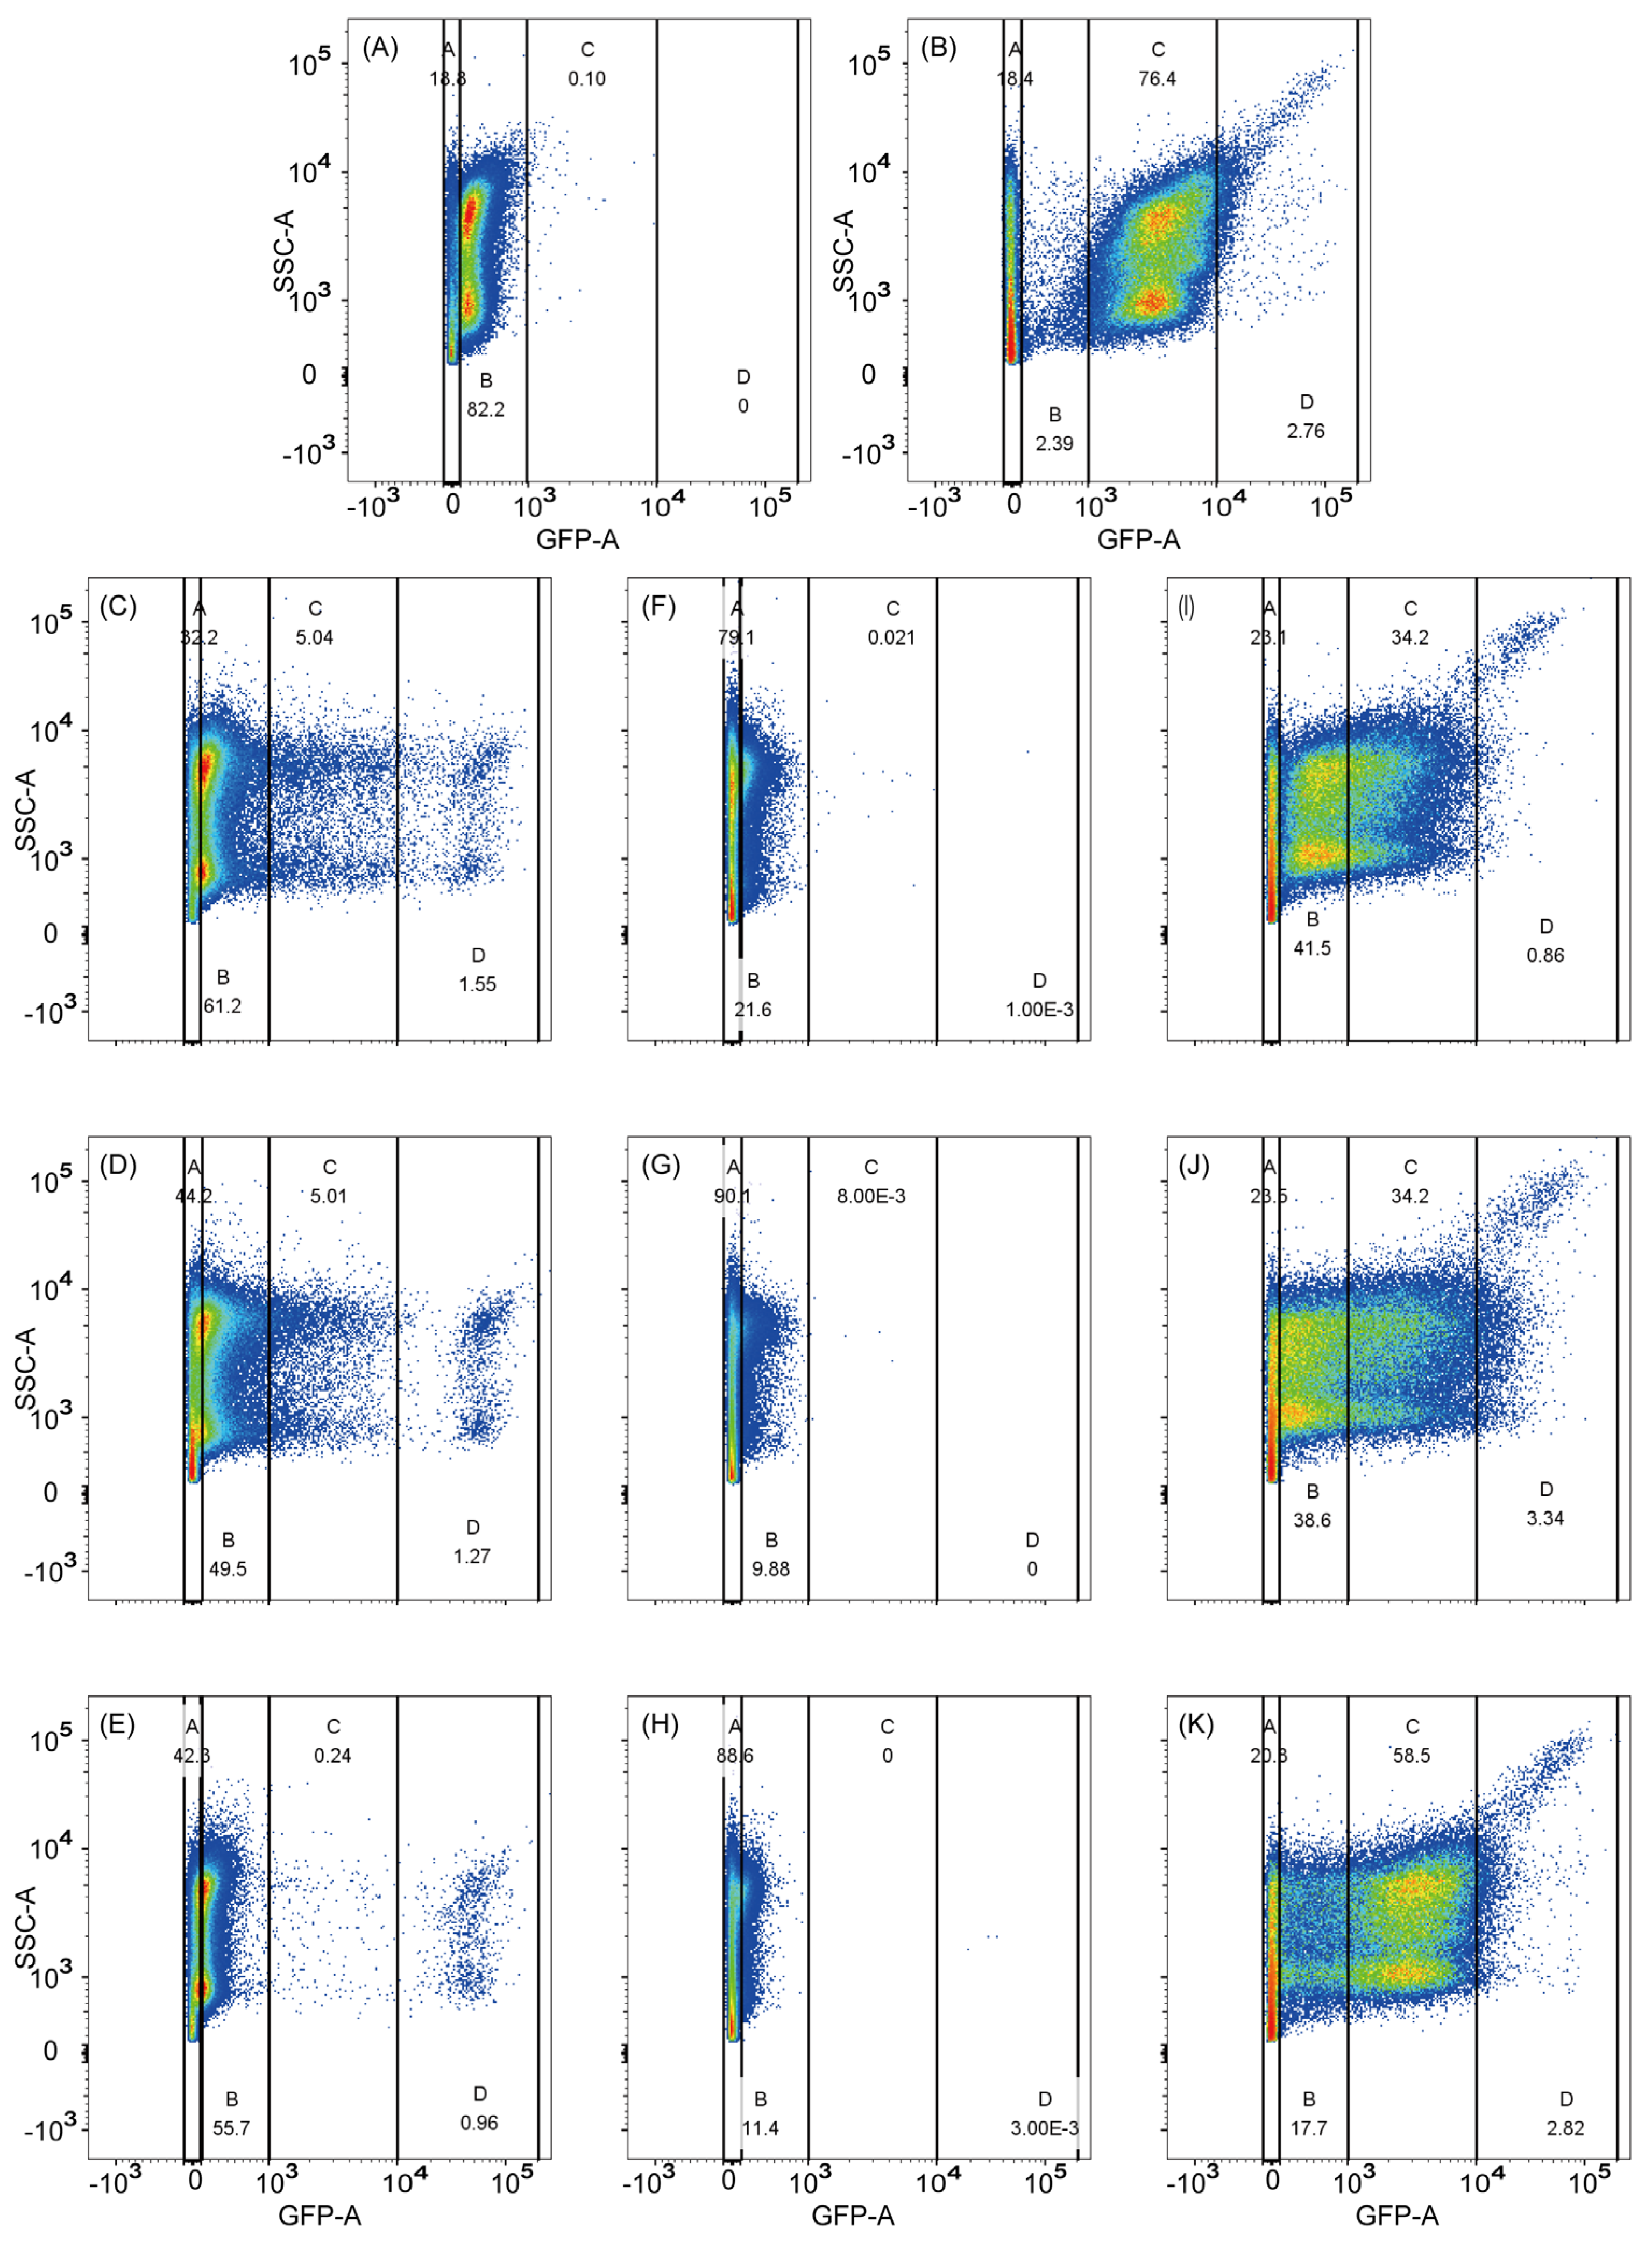
2.4. Cultivation and Screening

The pET28a plasmid strains were cultivated in LB medium with varying NaCl or nutrient concentrations and 100 mg/L kanamycin at 37 °C and 200 rpm. For promoter assessment and dynamics research, 3 mL/7 mL medium was held in the cells of 24 microplates, while 50 mL/250 mL medium was held in the shaker for incubation of the strains and plasmid collection.
The JM109/pET28a-Pfic-egfp and JM109-ΔrpoS/pET28a-Pfic-egfp strains were activated and incubated for 12 h. Samples with an OD600 nm of 0.05 were screened by flow cytometry in an aseptic flow tube. A total of 105 cells were analyzed and collected for each sample. The fluorescence value distributions of JM109/pET28a-Pfic-egfp and JM109-ΔrpoS/pET28a-Pfic-egfp were used as references to set the thresholds of low σ70 selectivity and high σS strength. Subsequently, the JM109-ΔrpoS/pET28a-PficN-egfp strains were cultured and screened using the same method. Low fluorescent cells (JM109-ΔrpoS/pET28a-PficN*-egfp) in the JM109-ΔrpoS/pET28a-PficN-egfp strains were collected in sterile tubes containing PBS solution (137 mM NaCl, 2.7 mM KCl, 10 mM Na2HPO4, and 2 mM KH2PO4). The collections were incubated, and the mixed plasmids were extracted using a Fast Plasmid Miniprep kit and imported into JM109 competent cells. After cultivation and screening, single highly fluorescent JM109/pET28a-PficN*-egfp cells were collected on LB plates (shown in Figure 1).

2.5. Sequence and Sequence Logo

Twenty-five strains of PficI, forty strains of PficII, and twenty strains of PficIII were sequenced by the AZENTA company, Tianjin, China. YpET28a-Pfic was used as the sequence primer. The sequence logos of enhanced self-inducible promoters (described in 2.6) were created using WebLogo as previously reported [18]. All the data and graphs were processed using Origin Pro 9.0 (Origin Lab, Northampton, MA, USA) and Adobe Illustrator 2022.

2.6. Fluorescence Assay

The strains with different promoter sequences were preserved and subjected to specific fluorescence. The preserved strains were then activated and inoculated with 1/1000 seeds. After 12 h, samples were taken to test the strength of the promoter. A 100 µL sample was centrifuged at 12000 rpm for 5 min, and the supernatant was discarded. The remaining precipitate was then dissolved in 1 mL of water. The suspension solution was then checked for OD600 nm and green fluorescence (emission at 485 nm; excitation at 520 nm) using a microplate reader. For every strain, three parallel experiments were performed, and the wild-type fic promoter was used as a control.
Plasmids pET28a-PficN-egfp were imported into JM109 and JM109-ΔrpoS strains to check the strength of two kinds of factors. The σ strength and σ selectivity of the promoter were calculated by Equation (1), and the promoters with σS strength and σS selectivity higher than that of the wild-fic promoter were selected to construct an enhanced self-inducible promoter library.
σ 70   strength = JM 109 rpoS   fluorescence 40 JM 109 rpoS   OD 600   nm 0.04 background   fluorescence
σ s   strength = total   fluorescence   strength σ 70   strength
total   fluorescence   strength = JM 109   fluorescence 40 JM 109   OD 600   nm 0.04 background   fluorescence
σ s   selectivity = σ s   strength σ 70   strength
σ 70   selectivity = σ 70   strength σ s   strength
Equation (1). σ strength describes the ability of promoters to be transcribed by the sigma factor; σ selectivity describes the preference of the promoter to one of the two factors. Background fluorescence is the special fluorescence of the JM109 (without a plasmid) strain, whose value is 157.

2.7. Dynamics under Different Fermentation Patterns

Different stressed environments activate σS in various ways, thereby influencing the levels of σS and affecting certain promoters [29,31,54]. For instance, only 156 of the 1663 genes tested and their promoters can be activated in all of the stressed conditions tested (stationary phase, high osmolarity, and low temperature) were reported in a previous study [29]. In the ideal fermentation model, the logarithmic phase is typically characterized by an abundance of nutrients, while the stationary phase is marked by high osmotic pressure and starvation. To examine the responsiveness of the promoters obtained from this experiment to the primary characteristics of different growth phases, we conducted a study on the dynamics under LB medium with varying levels of nutrients (2×, 0.5×) and 1.5× NaCl for the PficI-17, PficII-33, PficIII-14, and wild-fic promoters, with the original LB medium serving as a control. Sampling was performed at 2 h intervals, and we used the OD600 nm and total fluorescence strength as indicators.

2.8. Validation of the Promoters

To investigate the effect on the expression of different proteins, we verified the developed promoters (PficI-17, PficII-33, PficIII-14, and wild-fic) using rfp as a reporter gene with an emission at 585 nm and excitation at 620 nm. The rfp gene was amplified from the plasmid pBBR1-rfp using the primers EcoRI-rfp-F/SalI-rfp-R. The resulting PCR fragment was cleaved and inserted into the EcoRI- and SalI-cleaved plasmid pET28a, resulting in the plasmids pET28a-PficN-rfp. These plasmids were imported into JM109 strains for the promoters’ validation. To assess the dynamics under different fermentation patterns, we used the OD600 nm and special red fluorescence as indicators and plotted the results.
special   red   fluorescence = JM 109   red   fluorescence JM 109   OD 600   nm 0.04
Equation (2). The special red fluorescence which is obtained by dividing the fluorescence by OD600 nm. The background fluorescence in both water and the JM109 strain (without a plasmid) is almost zero.

3. Results and Discussion

3.1. Construction of the JM109-ΔrpoS Strain

In contrast to transposon insertion to obtain rpoS::Tn10 [55], in this experiment, 351 bp from the 299th site to the 649th site of the rpoS gene were knocked out to construct the JM109-ΔrpoS strain. Figure 2A illustrates the mechanism used for knocking out the rpoS gene, and Figure 2B displays the gel electrophoresis diagram of σS and its mutant. The deleted segment included regions 2 and 3.1 of σS [39], with region 2.4 of σS interacting with the −10 hexamer of the promoter [42]. This deletion caused frameshift mutations in the σS downstream regions. The significant decrease in fluorescence in JM109-ΔrpoS/pET28a-Pfic-egfp compared to JM109/pET28a-Pfic-egfp confirmed the deactivation of σS in the JM109-ΔrpoS strain, as shown in Figure 3A,B.

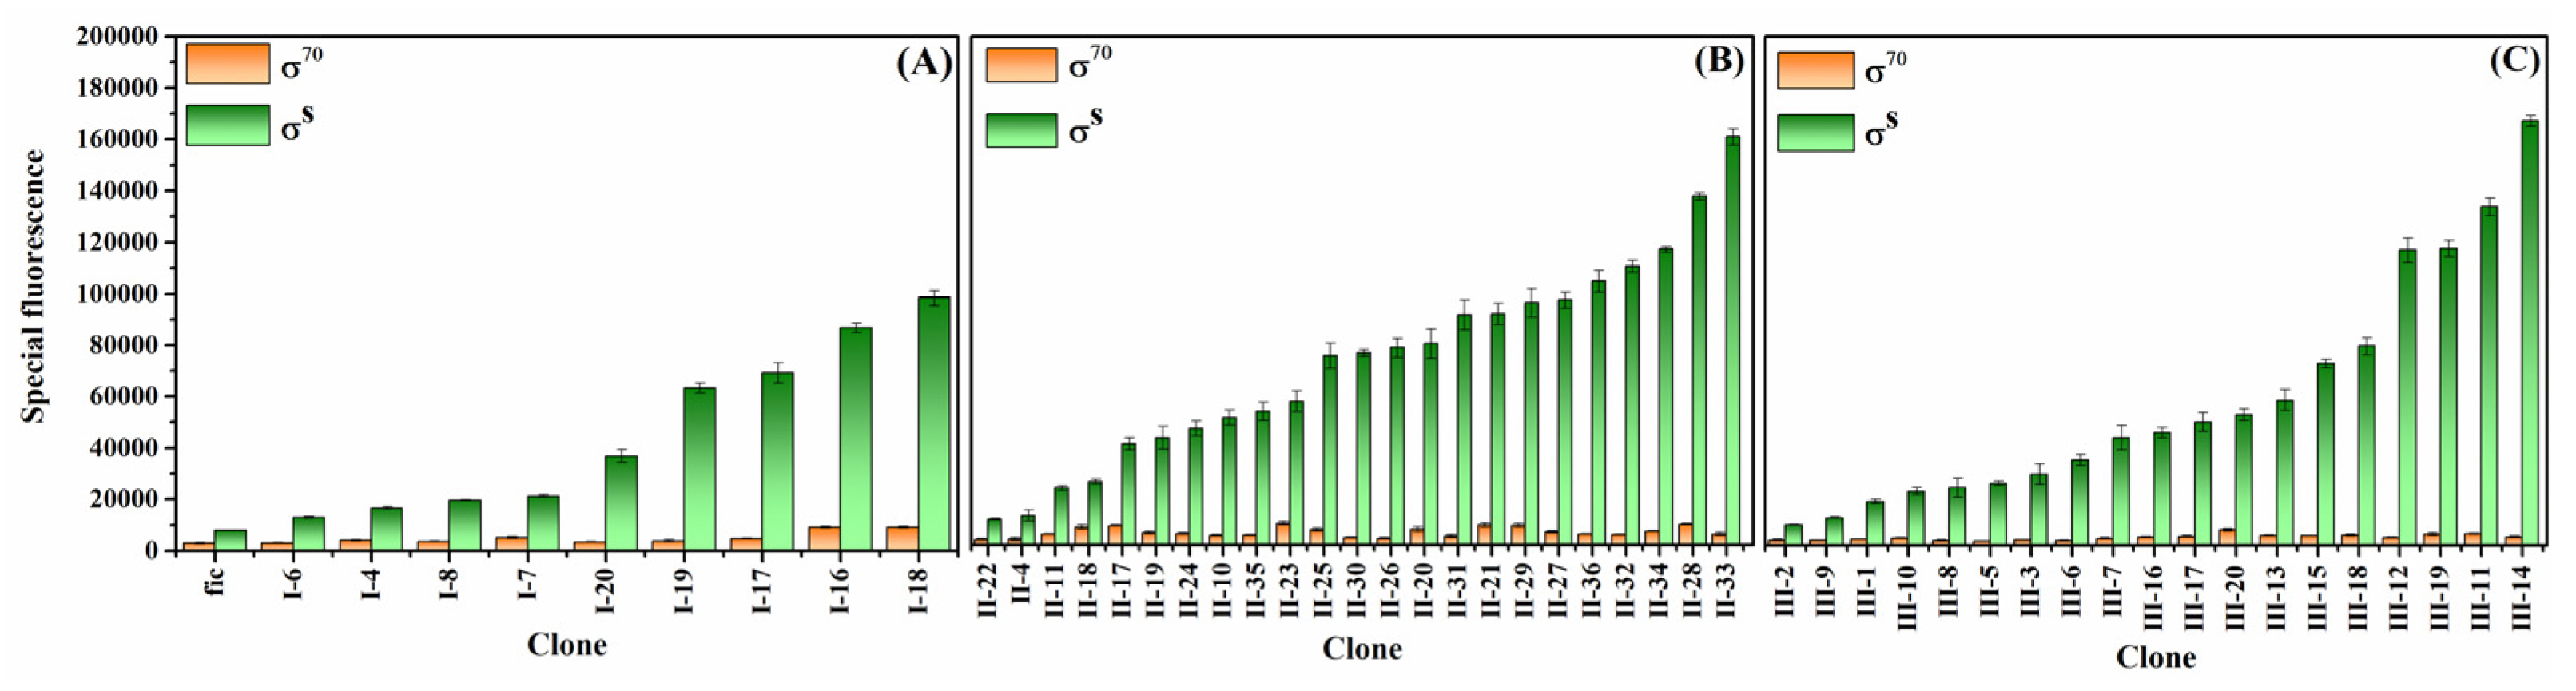
3.2. Screening of Mutant Promoters

The results of the 105-cell scanning analysis for each sample showed a fluorescence range of approximately −102 to 2 × 10⁵. Depending on the screening purpose, fluorescence values of −102–102 (no fluorescence), 102–103 (low fluorescence), 103–104 (moderate fluorescence), and 104 – 2 × 10⁵ (high fluorescence) were designated as Gate A, B, C, and D, respectively. For JM109-ΔrpoS/pET28a-Pfic-egfp, 82.2% of the sample was concentrated in Gate A, while for JM109/pET28a-Pfic-egfp, 76.4% of the sample was concentrated in Gate B (Figure 3A,B). Therefore, it can be concluded that the wild-fic promoter can be efficiently transcribed by σS but not σ70. It is worth noting that approximately 20% of the cells in Gate A were dead cells, and a small proportion of cells were scattered in other gates, possibly due to differences in individual cell activity [56].
The fluorescence distributions of JM109-ΔrpoS/pET28a-PficI-egfp and JM109-ΔrpoS/pET28a-PficII-egfp were similar, with 5% falling in Gate C and 1.5% falling in Gate D (Figure 3C,D). Thus, it appears that the function of the −35 hexamer of σ70 is replaced to some extent by the spacer region. However, the situation was different for JM109-ΔrpoS/pET28a-PficIII-egfp, where only a small amount fell in Gate C and 1% fell in Gate D (Figure 3E). It can be clearly seen that mutation both in the −35 hexamer and the spacer region had a strong influence on σS selectivity, but mutation in the discriminator only had a weak impact on it. Therefore, it can be concluded that σS only interacts strongly with the −35 hexamer and spacer region but not with the discriminator.
JM109-ΔrpoS/pET28a-PficN*(I*, II*, III*)-egfp with fluorescence lower than 900, Gate A and part of Gate B, were collected due to their low responsiveness to σ70. The JM109-ΔrpoS/pET28a-PficN*-egfp collection was scanned to check the accuracy of the flow cytometry screening, and the fluorescence values of the collections were generally reduced compared to the previous scan on JM109-ΔrpoS/pET28a-PficN-egfp, with more organisms falling in Gate A and almost no organisms falling in Gate C or Gate D (Figure 3F–H).
Compared to JM109-ΔrpoS, the JM109 strain showed an obvious increase in the transcriptional capacity of PficN* promoters (Figure 3I–K). However, the features of JM109/pET28a-PficN*-egfp were different. In JM109/pET28a-PficI*-egfp, the number of cells with high fluorescence decreased sharply, whereas in JM109/pET28a-PficII*-egfp, this trend was more gradual. The fluorescence values of JM109/pET28a-PficIII*-egfp were concentrated in Gate C, which was similar to the wild-fic promoter. These features were related to the interaction strength between the promoter and σS. The −35 hexamer of the promoter strongly interacts with region 4.2 of σS, and the extended −10 region of the promoter, located in the spacer region, has a strong interaction with region 3 of σS. The proportion of fluorescence values that fell on Gate D was higher in the spacer region mutation and discriminator mutation. This suggests that mutations in the spacer region and discriminator have a greater effect on σS strength. Single colonies at Gate C and Gate D were collected on plates for further sequencing and fluorescence assessment.

3.3. Generation of Enhanced Self-Inducible Promoter Libraries

Unique sequences were obtained from the sequencing of 19 out of 25 PficI promoters, 33 out of 40 PficII promoters, and all 20 PficIII promoters. To ensure the accuracy of the reported gene, egfp, we measured the fluorescent substrates of JM109 (without a plasmid) and JM109 (without a promoter) strains. There was no significant difference in special fluorescence between the two strains, indicating the insulation of the reporter gene (data not shown). The strength of the promoters was calculated by subtracting the background special fluorescence of the JM109 (without a plasmid) strain from the special fluorescence of all samples, as shown in Equation (1). The wild-fic promoter exhibited a σS strength and σS selectivity of 7952 and 2.61, respectively. We used the mutated promoters with higher values to create an enhanced self-inducible promoter library (Figure 4), which showed a broad range of activity with small increments between neighboring promoters. PficI-18, PficII-33, and PficIII-14 were the optional promoters obtained from saturation mutation in every region, with σS strengths of 12.36×, 20.18×, and 20.98× compared to the wild-fic promoter, respectively. It was obvious that the range of PficII and PficIII was broader than that of PficI, and the PficI promoters showed the highest σS strength accompanied by relatively higher σ70 strength, as in the case of PficI-18, and PficI-16. This may be related to the sequence features in the −35 hexamer. The sequences and strength of all promoters screened are shown in Table S2.

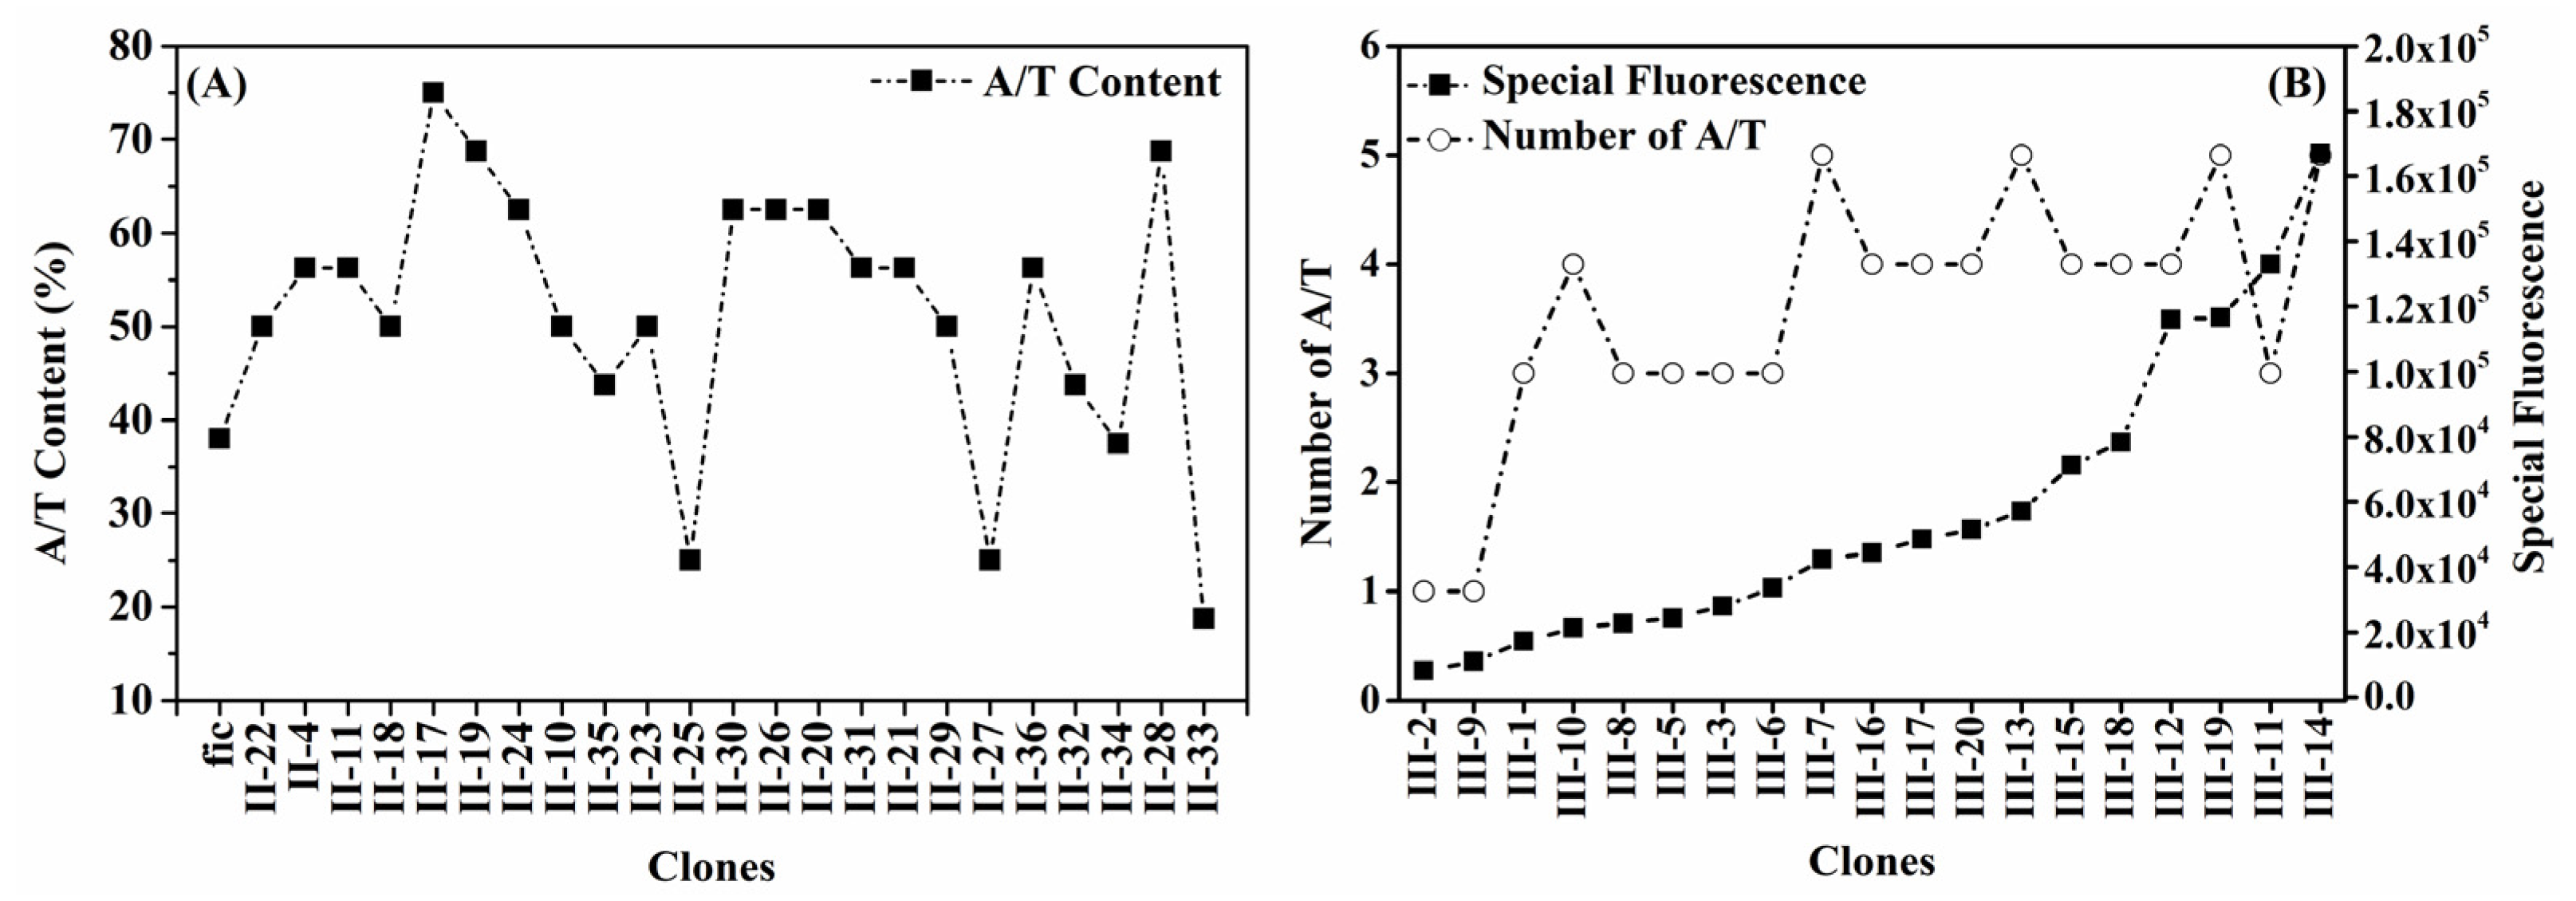
3.4. Features of Enhanced Self-Inducible Promoter Sequences

A total of 9 enhanced self-inducible PficI promoters exhibited a preferred sequence (A/C)XG(C/A)(A/C)A in the −35 hexamer (Figure 5A). This sequence showed semi-conservation with the σ70 consensus sequence, and each promoter had an average of 2.3 base pairs consistent with the consensus sequence, compared to 1.5 in the random combination. Although “TTGACA” was shown to be the optimal sequence for interacting with σS [49], the presence of “TT” at positions −39 and −38 was beneficial for binding to σ70 [57] and therefore did not appear in this preferred sequence. The identification of the −35 hexamer was more compatible with σS than σ70.
The most notable preferred motif in the spacer region of 23 promoters was that “C” was present at a proportion of 96% at position −17 (−13 at other promoters) as shown in Figure 5B, while the preferred base pair at this position was “G” for σ70 [49]. The presence of “C” at −17 enhanced both σS selectivity and σS strength, possibly due to direct interaction with K173 at σS [49].
Another feature was higher A+T content than the wild-fic promoter; 20 out of 23 enhanced self-inducible promoters had a higher A+T content than the wild-fic promoter (Figure 6A). However, this value was only maintained at a moderate level, approximately 50% to 60%. Excessively high A+T content resulted in an increased affinity of the promoter for σ70. For example, the PficII-13 promoter had the highest A+T content (81.25%), yet its σS selectivity was only 1.14 (Table S2), significantly lower than that of the wild-type promoter at 2.67. Moderate A+T content appeared to be a compromise of competition between σS strength and σS selectivity. However, it was not absolute that enhanced self-inducible promoters have moderate A+T content. For example, the PficII-33 promoter, which had a low A+T content (18.75%), showed both high σS strength and σS selectivity.
As mentioned earlier, a mutation occurring in the discriminator can enhance σS strength without reducing σS selectivity. Almost all PficIII promoters were enhanced self-inducible promoters. As the strength of the promoter increased, the number of A+T in the discriminator’s first five bases showed an increasing trend. The weakest promoter had one A+T base, while the strongest promoter had five (Figure 6B). The preferred sequence in the first three oligonucleotides of the discriminator region in this experiment was XAA (Figure 5C), which was similar to the “TAA” proposed by the previous study [31]. The high A+T content present in the discriminator of the enhanced self-inducible promoter can be explained by the fact that each A-T pair has only two hydrogen bonds and is therefore easily opened by σS to form an open complex structure.
In summary, two laws were outlined: firstly, promoter regions that interact strongly with σS show preferred sequences in the enhanced self-induced promoters, while other regions show different A+T contents; secondly, enhanced self-induced promoter sequences are a mutual compromise between optimal sequences, and are non-dependent on σ70, as well as a compromise between σS strength and σS selectivity.

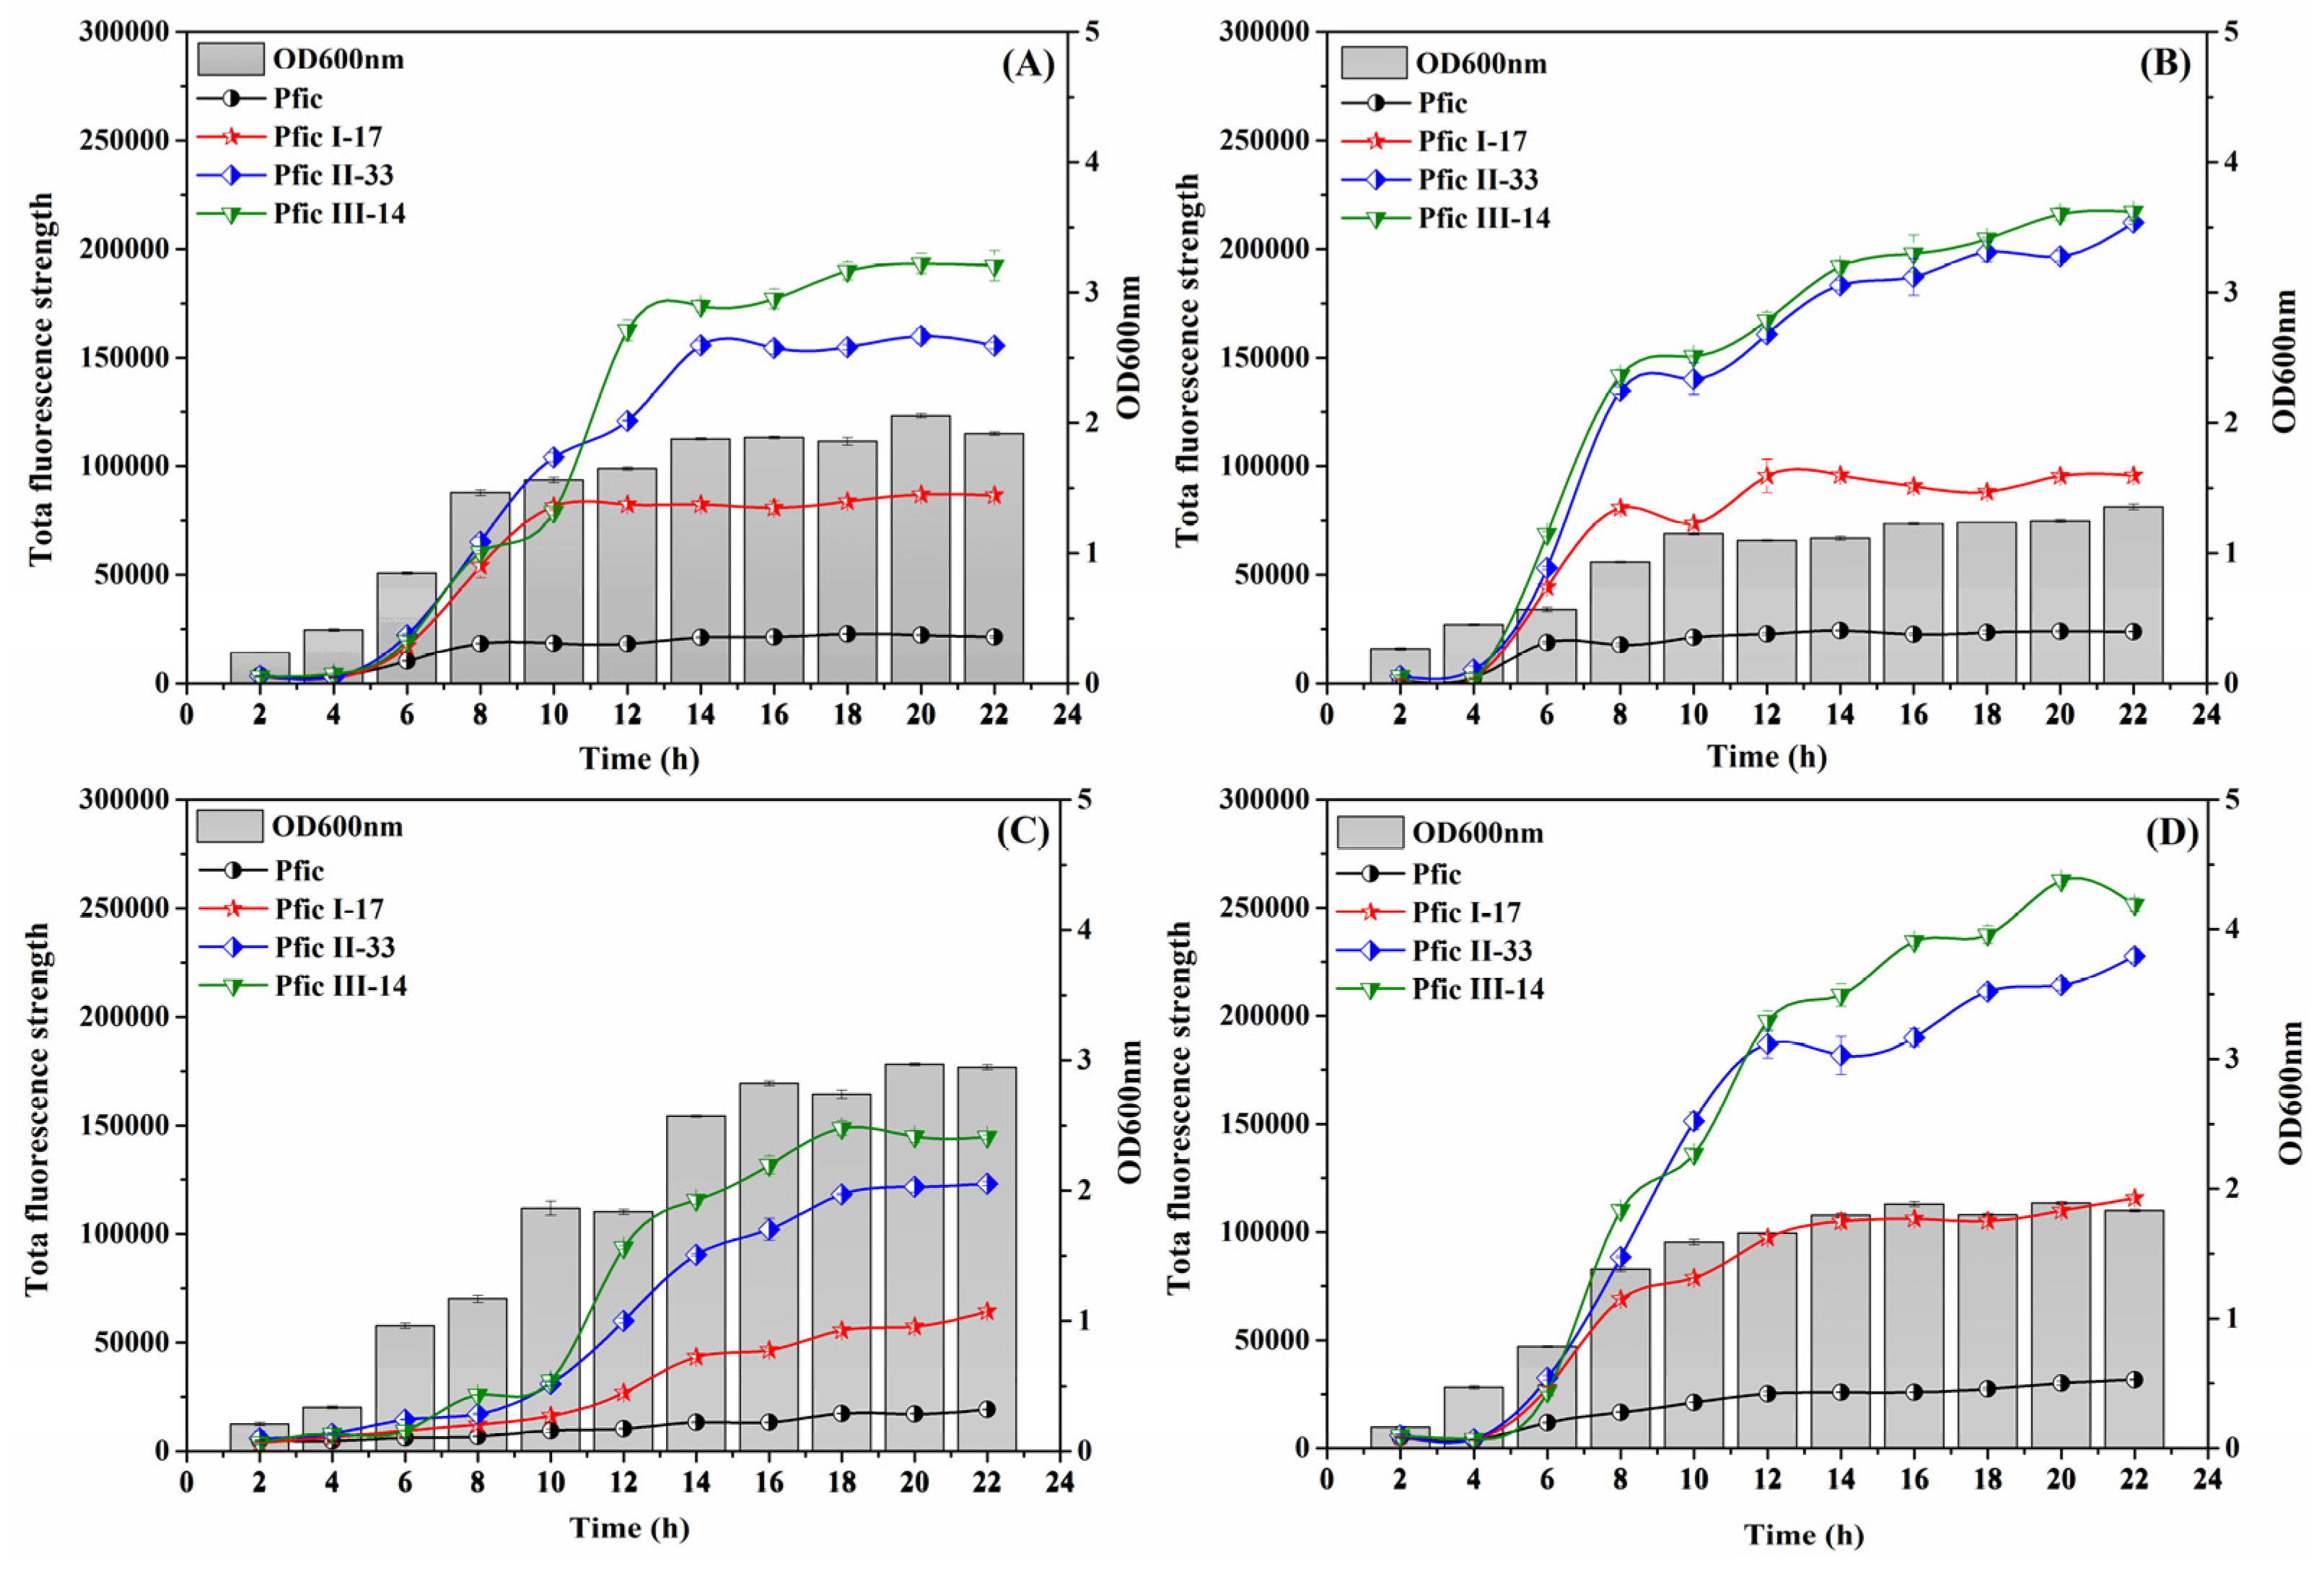
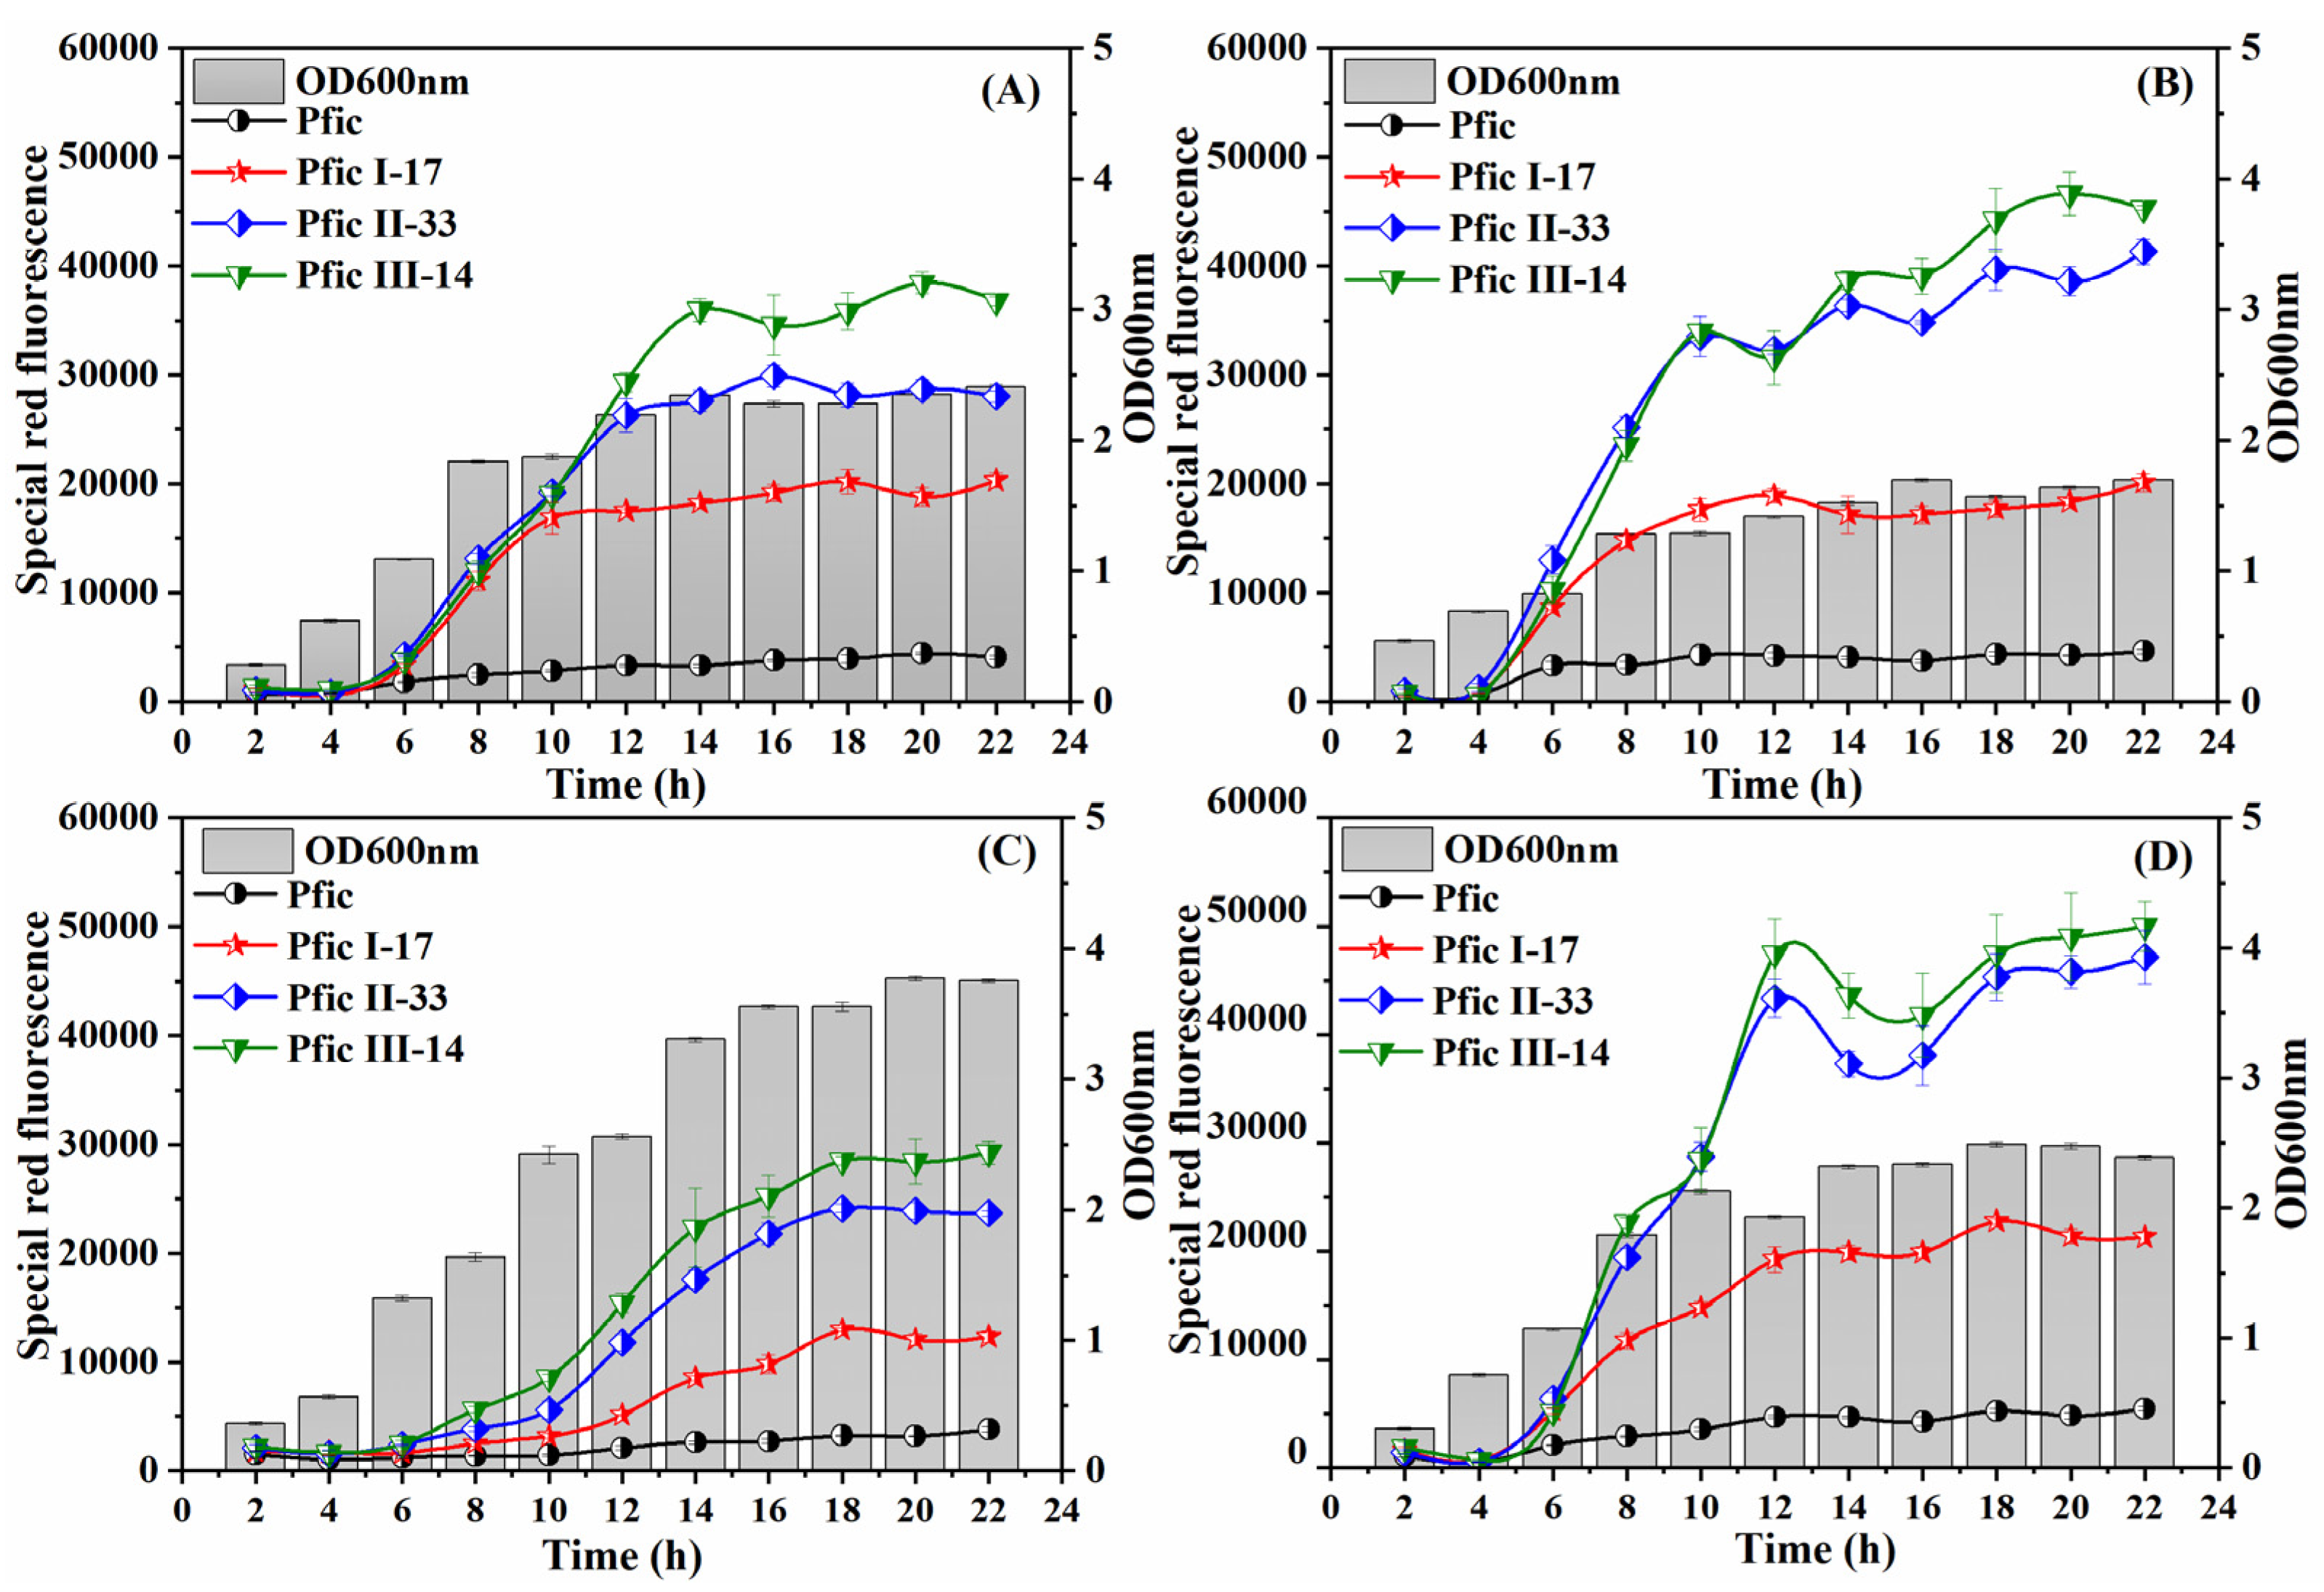
3.5. Dynamics under Different Fermentation Patterns

Some promoters under stress conditions in previous research are shown in Table S3. These promoters exhibited varying levels of response to different types of stress conditions [58,59,60].
In this study, the four strains showed consistent strength order and initial expression time, indicating that both nutrients and osmolality had equal effects on all four promoters. Specifically, PficIII-14 had the strongest response, followed by PficII-33, PficI-17, and finally the wild-fic promoter (Pfic). This is depicted in Figure 7.
We compared the effects of different media, such as LB medium (0.5× nutrient), LB medium (2× nutrient), and LB medium (1.5× NaCl), on the individual promoters in terms of endpoint OD600nm, initial induction time, and endpoint total fluorescence strength. The values for endpoint OD600nm in LB medium (0.5× nutrient), LB medium (2× nutrient), and LB medium (1.5× NaCl) were 0.71×, 1.54×, and 0.96×, respectively, compared to LB medium. The initial induction time of LB medium (0.5× nutrient), LB medium (2× nutrient), and LB medium (1.5× NaCl) in comparison to LB medium was 2 h earlier, 4 h later, and 2 h earlier, respectively. Moreover, the endpoint total fluorescence strength of LB medium (0.5× nutrient), LB medium (2× nutrient), and LB medium (1.5× NaCl) was 1.1×, 0.75×, and 1.35×, respectively, compared to LB medium. Notably, adverse conditions such as LB medium (0.5× nutrient) and LB medium (1.5× NaCl) resulted in enhanced promoter strength but reduced biomass, whereas favorable conditions such as LB medium (2× nutrient) had the opposite effect. This is a finding of interest because large-scale fermentation, nutrients, and osmotic pressure typically undergo changes from favorable to adverse conditions. Thus, an enhanced self-inducible promoter could be useful in a “first-growth, postproduction” fermentation model, as it would enable IPTG-inducible promoter regulation through endogenous mechanisms.

3.6. Validation of Promoters

The endpoint OD600nm, initial induction time, and endpoint special red fluorescence of the four tested promoters showed a consistent trend under different media, as compared to rfp with egfp (shown in Figure 8). Therefore, it is suggested that the promoters developed in this experiment can be utilized for the expression of various proteins.

4. Conclusions

The available self-inducible promoters were inadequate for addressing the issue of target gene expression in the stationary phase in E. coli. To address this problem, a 51-member promoter library was constructed with a σS strength range of 1-fold to 21-fold for the wild-fic promoter. Moreover, the strength of the promoters was further enhanced by the activation of low nutrients and high osmolality. The egfp and rfp were used as the reported genes to confirm the effect of the promoters developed in this experiment on the expression of different proteins. In the future, saturation mutations in the UP element and a combination of enhanced self-inducible promoters are expected to obtain a stronger promoter. Overall, this paper offers several practical endogenous regulatory promoters for E. coli to express target products.

Supplementary Materials

The following supporting information can be downloaded at: https://www.mdpi.com/article/10.3390/fermentation9050468/s1. Table S1: All the primers in this experiment; Table S2: All the promoters screened in this experiment; Table S3: The promoter’s improvement under stress conditions in other experiments.

Author Contributions

Conceptualization, J.L. and S.T.; methodology, J.L. and S.T.; formal analysis, J.L.; investigation, J.L.; validation, J.L., K.C. and X.Z.; data curation, J.L.; writing—original draft, J.L.; writing—review and editing, S.T., F.R.A., H.K., J.C. and D.L.; project administration, S.T., J.C. and D.L.; supervision, J.C. and D.L.; funding acquisition, D.L. All authors have read and agreed to the published version of the manuscript.

Funding

This work was supported by the National Key Research and Development Program of MOST (2019YFA0904900), the Strategic Pilot Science and Technology Project of the Chinese Academy of Sciences (XDA28030301), and the Tianjin Synthetic Biology Improvement Action Plan (TSBI-CIP-KJGG-005, TSBICIP-IJCP-001-04).

Institutional Review Board Statement

Not applicable.

Informed Consent Statement

Not applicable.

Data Availability Statement

All data are included in the manuscript.

Conflicts of Interest

The authors declare no conflict of interest.

References

  1. Connor, A.; Wigham, C.; Bai, Y.; Rai, M.; Nassifa, S.; Koffas, M.; Zha, R.H. Novel insights into construct toxicity, strain optimization, and primary sequence design for producing recombinant silk fibroin and elastin-like peptide in E. coli. Metab. Eng. Commun. 2023, 16, e00219. [Google Scholar] [CrossRef] [PubMed]
  2. Zhao, X.; Wei, W.; Zong, Y.; Bai, C.; Guo, X.; Zhu, H.; Lou, C. Novel switchable ECF sigma factor transcription system for improving thaxtomin A production in Streptomyces. Synth. Syst. Biotechnol. 2022, 7, 972–981. [Google Scholar] [CrossRef]
  3. Kaur, J.; Kumar, A.; Kaur, J. Strategies for optimization of heterologous protein expression in E. coli: Roadblocks and reinforcements. Int. J. Biol. Macromol. 2018, 106, 803–822. [Google Scholar] [CrossRef]
  4. Pasini, M.; Fernandez-Castane, A.; Jaramillo, A.; Mas, C.d.; Caminal, G.; Ferrer, P. Using promoter libraries to reduce metabolic burden due to plasmid-encoded proteins in recombinant Escherichia coli. New Biotechnol. 2016, 33, 78–90. [Google Scholar] [CrossRef]
  5. Averina, O.; Alekseeva, M.; Shkoporov, A.; Danilenko, V. Functional analysis of the type II toxin-antitoxin systems of the MazEF and RelBE families in Bifidobacterium longum subsp. infantis ATCC 15697. Anaerobe 2015, 35, 59–67. [Google Scholar] [CrossRef]
  6. Ahmad, I.; Nawaz, N.; Darwesh, N.M.; Rahman, S.u.; Mustafa, M.Z.; Khan, S.B.; Patching, S.G. Overcoming challenges for amplified expression of recombinant proteins using Escherichia coli. Protein Expr. Purif. 2018, 144, 12–18. [Google Scholar] [CrossRef]
  7. Kwon, S.-K.; Kim, S.K.; Lee, D.-H.; Kim, J.F. Comparative genomics and experimental evolution of Escherichia coli BL21(DE3) strains reveal the landscape of toxicity escape from membrane protein overproduction. Sci. Rep. 2015, 5, 16076. [Google Scholar] [CrossRef]
  8. Erbakan, M.; Curtis, B.S.; Nixon, B.T.; Kumar, M.; Curtis, W.R. Advancing Rhodobacter sphaeroides as a platform for expression of functional membrane proteins. Protein Expr. Purif. 2015, 115, 109–117. [Google Scholar] [CrossRef]
  9. Xu, Y.; Wu, Y.; Liu, Y.; Li, J.; Du, G.; Chen, J.; Lv, X.; Liu, L. Sustainable bioproduction of natural sugar substitutes: Strategies and challenges. Trends Food Sci. Technol. 2022, 129, 512–527. [Google Scholar] [CrossRef]
  10. Cardoso, V.; Brás, J.L.A.; Costa, I.F.; Ferreira, L.M.A.; Gama, L.T.; Vincentelli, R.; Henrissat, B.; Fontes, C.M.G.A. Generation of a Library of Carbohydrate-Active Enzymes for Plant Biomass Deconstruction. Int. J. Mol. Sci. 2022, 23, 4024. [Google Scholar] [CrossRef]
  11. Zhu, L.; Huang, J.; Wang, Y.; Yang, Z.; Chen, X. Chemerin causes lipid metabolic imbalance and induces passive lipid accumulation in human hepatoma cell line via the receptor GPR1. Life Sci. 2021, 278, 119530. [Google Scholar] [CrossRef] [PubMed]
  12. Korpys-Wozniak, P.; Celinska, E. Global transcriptome profiling reveals genes responding to overproduction of a small secretory, a high cysteine- and a high glycosylation-bearing protein in Yarrowia lipolytica. Biotechnol. Rep. 2021, 31, e00646. [Google Scholar] [CrossRef] [PubMed]
  13. Ma, C.; Kojima, K.; Xu, N.; Mobley, J.; Zhou, L.; Yang, S.-T.; Liu, X.M. Comparative proteomics analysis of high n-butanol producing metabolically engineered Clostridium tyrobutyricum. J. Biotechnol. 2015, 193, 108–119. [Google Scholar] [CrossRef] [PubMed]
  14. Ma, S.M.; Garcia, D.E.; Redding-Johanson, A.M.; Friedland, G.D.; Chan, R.; Batth, T.S.; Haliburton, J.R.; Chivian, D.; Keasling, J.D.; Petzold, C.J.; et al. Optimization of a heterologous mevalonate pathway through the use of variant HMG-CoA reductases. Metab. Eng. 2011, 13, 588–597. [Google Scholar] [CrossRef] [PubMed]
  15. D’Huys, P.-J.; Lule, I.; Hove, S.V.; Vercammen, D.; Wouters, C.; Bernaerts, K.; Anné, J.; Impe, J.F.M.V. Amino acid uptake profiling of wild type and recombinant Streptomyces lividans TK24 batch fermentations. J. Biotechnol. 2011, 152, 132–143. [Google Scholar] [CrossRef]
  16. Zhao, M.; Huang, D.; Zhang, X.; Koffas, M.A.G.; Zhou, J.; Deng, Y. Metabolic engineering of Escherichia coli for producing adipic acid through the reverse adipate-degradation pathway. Metab. Eng. 2018, 47, 254–262. [Google Scholar] [CrossRef]
  17. Marbach, A.; Bettenbrock, K. lac operon induction in Escherichia coli: Systematic comparison of IPTG and TMG induction and influence of the transacetylase LacA. J. Biotechnol. 2012, 157, 82–88. [Google Scholar] [CrossRef]
  18. Baptista, I.S.C.; Kandavalli, V.; Chauhan, V.; Bahrudeen, M.N.M.; Almeida, B.L.B.; Palma, C.S.D.; Dash, S.; Ribeiro, A.S. Sequence-dependent model of genes with dual σ factor preference. Biochim. Biophys. Acta—Gene Regul. Mech. 2022, 1865, 194812. [Google Scholar] [CrossRef]
  19. Morichaud, Z.; Chaloin, L.; Brodolin, K. Regions 1.2 and 3.2 of the RNA Polymerase σ Subunit Promote DNA Melting and Attenuate Action of the Antibiotic Lipiarmycin. J. Mol. Biol. 2016, 428, 463–476. [Google Scholar] [CrossRef]
  20. Wang, Z.; Zhao, S.; Li, Y.; Zhang, K.; Mo, F.; Zhang, J.; Hou, Y.; He, L.; Liu, Z.; Wang, Y.; et al. RssB-mediated σS Activation is Regulated by a Two-Tier Mechanism via Phosphorylation and Adaptor Protein—IraD. J. Mol. Biol. 2021, 433, 166757. [Google Scholar] [CrossRef]
  21. Micevski, D.; Zeth, K.; Mulhern, T.D.; Schuenemann, V.J.; Zammit, J.E.; Truscott, K.N.; Dougan, D.A. Insight into the RssB-Mediated Recognition and Delivery of σS to the AAA+ Protease, ClpXP. Biomolecules 2020, 10, 615. [Google Scholar] [CrossRef]
  22. Dorich, V.; Brugger, C.; Tripathi, A.; Hoskins, J.R.; Tong, S.; Suhanovsky, M.M.; Sastry, A.; Wickner, S.; Gottesman, S.; Deaconescu, A.M. Structural basis for inhibition of a response regulator of σS stability by a ClpXP antiadaptor. Genes Dev. 2019, 33, 718–732. [Google Scholar] [CrossRef] [PubMed]
  23. Cartagena, A.J.; Banta, A.B.; Sathyan, N.; Ross, W.; Gourse, R.L.; Campbell, E.A.; Darst, S.A. Structural basis for transcription activation by Crl through tethering of σS and RNA polymerase. Proc. Natl. Acad. Sci. USA 2019, 116, 18923–18927. [Google Scholar] [CrossRef] [PubMed]
  24. Lago, M.; Monteil, V.; Douche, T.; Guglielmini, J.; Criscuolo, A.; Maufrais, C.; Matondo, M.; Norel, F. Proteome remodelling by the stress sigma factor RpoS/σS in Salmonella: Identification of small proteins and evidence for post-transcriptional regulation. Sci. Rep. 2017, 7, 2127. [Google Scholar] [CrossRef] [PubMed]
  25. Levi-Meyrueis, C.; Monteil, V.e.; Sismeiro, O.; Dillies, M.-A.; Kolb, A.; Monot, M.; Dupuy, B.; Duarte, S.S.; Jagla, B.; Coppee, J.-Y.; et al. Repressor activity of the RpoS/σS-dependent RNA polymerase requires DNA binding. Nucleic Acids Res. 2015, 43, 1456–1468. [Google Scholar] [CrossRef]
  26. Burda, W.N.; Miller, H.K.; Krute, C.N.; Leighton, S.L.; Shaw, R.K.C.a.L.N. Investigating the genetic regulation of the ECF sigma factor σS in Staphylococcus aureus. BMC Microbiol. 2014, 14, 1471–2180. [Google Scholar] [CrossRef]
  27. Gottesman, S. Trouble is coming: Signaling pathways that regulate general stress responses in bacteria. J. Biol. Chem. 2019, 294, 11685–11700. [Google Scholar] [CrossRef]
  28. Matin, A. Stress, Bacterial: General and Specific. In Encyclopedia of Microbiology; Elsevier: Amsterdam, The Netherlands, 2014. [Google Scholar] [CrossRef]
  29. Adams, J.; Hoang, J.; Petroni, E.; Ashby, E.; Hardin, J.; Stoebel, D.M. The timing of transcription of RpoS-dependent genes varies across multiple stresses. bioRxiv 2023. [Google Scholar] [CrossRef]
  30. Wong, G.T.; Bonocora, R.P.; Schep, A.N.; Beeler, S.M.; Fong, A.J.L.; Shull, L.M.; Batachari, L.E.; Dillon, M.; Evans, C.; Becker, C.J.; et al. Genome-Wide Transcriptional Response to Varying RpoS Levels in Escherichia coli K-12. J. Bacteriol. 2017, 199, e00755-16. [Google Scholar] [CrossRef]
  31. Weber, H.; Polen, T.; Heuveling, J.; Wendisch, V.F.; Hengge, R. Genome-wide analysis of the general stress response network in Escherichia coli: σS-dependent genes, promoters, and sigma factor selectivity. J. Bacteriol. 2005, 187, 1591–1603. [Google Scholar] [CrossRef]
  32. Schellhorn, H.E. Function, Evolution, and Composition of the RpoS Regulon in Escherichia coli. Front. Microbiol. 2020, 11, 560099. [Google Scholar] [CrossRef] [PubMed]
  33. Fernández-Gómez, P.; López, M.; Prieto, M.; González-Raurich, M.; Alvarez-Ordóñez, A. The role of the general stress response regulator RpoS in Cronobacter sakazakii biofilm formation. Food Res. Int. 2020, 136, 109508. [Google Scholar] [CrossRef] [PubMed]
  34. Alattas, H.; Wong, S.; Slavcev, R.A. Identification of Escherichia coli Host Genes That Influence the Bacteriophage Lambda (λ) T4rII Exclusion (Rex) Phenotype. Genetics 2020, 216, 1087–1102. [Google Scholar] [CrossRef]
  35. Guo, Y.; Li, Y.; Zhan, W.; Wood, T.K.; Wang, X. Resistance to oxidative stress by inner membrane protein ElaB is regulated by OxyR and RpoS. Microbical Biotechnol. 2019, 12, 392–404. [Google Scholar] [CrossRef]
  36. Bouillet, S.; Genest, O.; Méjean, V.; Iobbi-Nivol, C. Protection of the general stress response σS factor by the CrsR regulator allows a rapid and efficient adaptation of Shewanella oneidensis. J. Biol. Chem. 2017, 292, 14921–14928. [Google Scholar] [CrossRef]
  37. Liu, X.; Wu, Y.; Chen, Y.; Xu, F.; Halliday, N.; Gao, K.; Chan, K.G.; Cámara, M. RpoS differentially affects the general stress response and biofilm formation in the endophytic Serratia plymuthica G3. Res. Microbiol. 2016, 167, 168–177. [Google Scholar] [CrossRef]
  38. Campos-Gomez, J.; Benitez, J.A. A simple cell-based high throughput screening (HTS) assay for inhibitors of Salmonella enterica RNA polymerase containing the general stress response regulator RpoS (σS). J. Microbiol. Methods 2018, 150, 1–4. [Google Scholar] [CrossRef]
  39. Chen, J.; Wassarman, K.M.; Feng, S.; Walz, T.; Campbell, E.A.; Darst, S.A. 6S RNA Mimics B-Form DNA to Regulate Escherichia coli RNA Polymerase. Mol. Cell 2017, 68, 388–397.e6. [Google Scholar] [CrossRef]
  40. Samuels, D.S.; Lybecker, M.C.; Yang, X.F.; Ouyang, Z.; Bourret, T.J.; Boyle, W.K.; Stevenson, B.; Drecktrah, D.; Caimano, M.J. Gene Regulation and Transcriptomics. Curr. Issues Mol. Biol. 2021, 42, 223–266. [Google Scholar] [CrossRef]
  41. Oguienko, A.; Petushkov, I.; Pupov, D.; Esyunina, D.; Kulbachinskiy, A. Universal functions of the σ finger in alternative sigma factors during transcription initiation by bacterial RNA polymerase. RNA Biol. 2021, 18, 2028–2037. [Google Scholar] [CrossRef]
  42. Gaal, T.; Ross, W.; Estrem, S.T.; Nguyen, L.H.; Burgess, R.R.; Gourse, R.L. Promoter recognition and discrimination by EσS RNA polymerase. Mol. Microbiol. 2001, 42, 939–954. [Google Scholar] [CrossRef] [PubMed]
  43. Jaishankar, J.; Srivastava, P. Molecular Basis of Stationary Phase Survival and Applications. Front. Microbiol. 2017, 8, 2000. [Google Scholar] [CrossRef] [PubMed]
  44. Yu, X.; Xu, J.; Liu, X.; Chu, X.; Wang, P.; Tian, J.; Wu, N.; Fan, Y. Identification of a highly efficient stationary phase promoter in Bacillus subtili. Sci. Rep. 2015, 5, 1–13. [Google Scholar] [CrossRef] [PubMed]
  45. Utsumi, R.; Kusafuka, S.; Nakayama, T.; Tanaka, K.; Takayanagi, Y.; Takahashi, H.; Noda, M.; Kawamukai, M. Stationary phase-specific expression of the fic gene in Escherichia coli K-12 is controlled by the rpoS gene product (σ38). FEMS Microbiol. Lett. 1993, 113, 273–278. [Google Scholar] [CrossRef] [PubMed]
  46. Logel, D.Y.; Trofimova, E.; Jaschke, P.R. Codon-Restrained Method for Both Eliminating and Creating Intragenic Bacterial Promoters. ACS Synth. Biol. 2022, 11, 689–699. [Google Scholar] [CrossRef]
  47. Yin, K.; Guan, Y.; Ma, R.; Wei, L.; Liu, B.; Liu, X.; Zhou, X.; Ma, Y.; Zhang, Y.; Waldor, M.K.; et al. Critical role for a promorter discriminator in RpoS control of virulence in Edwardsiella piscicida. PLoS Pathog. 2018, 14, e1007272. [Google Scholar] [CrossRef]
  48. Dudin, O.; Lacour, S.; Geiselmann, J. Expression dynamics of RpoS/Crl-dependent genes in Escherichia coli. Res. Microbiol. 2013, 164, 838–847. [Google Scholar] [CrossRef]
  49. Typas, A.; Hengge, R. Role of the spacer between the −35 and −10 regions in sigmas promoter selectivity in Escherichia coli. Mol. Microbiol. 2006, 59, 1037–1051. [Google Scholar] [CrossRef]
  50. Rosenthal, A.Z.; Hu, M.; Gralla, J.D. Osmolyte-induced transcription: −35 region elements and recognition by sigma38 (rpoS). Mol. Microbiol. 2006, 59, 1052–1061. [Google Scholar] [CrossRef]
  51. Hengge-Aronis, R. Stationary phase gene regulation: What makes an Escherichia coli promoter σS-selective? Curr. Opin. Microbiol. 2002, 5, 591–595. [Google Scholar] [CrossRef]
  52. Miksch, G.; Bettenworth, F.; Friehs, K.; Flaschel, E. The sequence upstream of the −10 consensus sequence modulates the strength and induction time of stationary-phase promoters in Escherichia coli. Appl. Microbiol. Biotechnol. 2005, 69, 312–320. [Google Scholar] [CrossRef]
  53. Labun, K.; Montague, T.G.; Krause, M.; Cleuren, Y.N.T.; Tjeldne, H.; Valen, E. CHOPCHOP v3: Expanding the CRISPR web toolbox beyond genome editing. Nucleic Acids Res. 2019, 47, W171–W174. [Google Scholar] [CrossRef]
  54. Todor, H.; Osadnik, H.; Campbell, E.A.; Myers, K.S.; Li, H.; Donohue, T.J.; Gross, C.A. Rewiring the specificity of extracytoplasmic function sigma factors. Proc. Natl. Acad. Sci. USA 2020, 117, 33496–33506. [Google Scholar] [CrossRef]
  55. Ionescu, M.; Belkin, S. Overproduction of exopolysaccharides by an Escherichia coli K-12 rpoS mutant in response to osmotic stress. Appl. Environ. Microbiol. 2009, 75, 483–492. [Google Scholar] [CrossRef]
  56. Patange, O.; Schwall, C.; Jones, M.; Villava, C.; Griffith, D.A.; Phillips, A.; Locke, J.C.W. Escherichia coli can survive stress by noisy growth modulation. Nat. Commun. 2018, 9, 5333. [Google Scholar] [CrossRef]
  57. Utsumia, R.; Nakayamaa, T.; Iwamotoa, N.; Kohdaa, K.; Kawamukaib, M.; Tanabea, H.; Tanakac, K.; Takahashic, H.; Nodaa, M. Mutational analysis of the fic promoter recognized by RpoS (σ38) in Escherichia coli. Biosci. Biotechnol. Biochem. 1995, 59, 1573–1575. [Google Scholar] [CrossRef]
  58. Gao, L.; Wu, X.; Li, C.; Xia, X. Exploitation of strong constitutive and stress-driven promoters from Acetobacter pasteurianus for improving acetic acid tolerance. J. Biotechnol. 2022, 350, 24–30. [Google Scholar] [CrossRef]
  59. Song, Y.; Nikoloff, J.M.; Fu, G.; Chen, J.; Li, Q.; Xie, N.; Zheng, P.; Sun, J.; Zhang, D. Promoter Screening from Bacillus subtilis in Various Conditions Hunting for Synthetic Biology and Industrial Applications. PLoS ONE 2016, 11, e0158447. [Google Scholar] [CrossRef]
  60. Wang, Y.; Liu, Q.; Weng, H.; Shi, Y.; Chen, J.; Du, G.; Kang, Z. Construction of Synthetic Promoters by Assembling the Sigma Factor Binding −35 and −10 Boxes. Biotechnol. J. 2019, 14, e1800298. [Google Scholar] [CrossRef]
Figure 1. Schematic diagram of the screening process. Only Eσ70 was present in the JM109-ΔrpoS strain, while both Eσ70 and EσS were present in the JM109 strain. Single strains were given an electrical charge by the flow cytometer, based on the amount of fluorescent protein, and were subsequently sorted in an electric field. The promoters, that are not transcribed by Eσ70 were collected in the JM109-ΔrpoS strain, and then those that are transcribed by EσS were collected in the JM109 strain.
Fermentation 09 00468 g001
Figure 2. The JM109-ΔrpoS strain was obtained through gene editing techniques. (A) Schematic diagram of the rpoS gene knockout; (B) gel electrophoresis diagram of the DNA marker (lane 1) and rpoS gene in the JM109 strain (lane 2) and the mutant rpoS gene in the JM109-ΔrpoS strain (lane 3). The primers YrpoS-F/YrpoS-R were on the outside of the rpoS gene, and the lengths of the PCR products in the JM109 strain and the JM109-ΔrpoS strain were 1165 bp and 814 bp, respectively.
Fermentation 09 00468 g002
Figure 3. Fluorescence distribution of all the samples on flow cytometry. (A) JM109-ΔrpoS/pET28a-Pfic-egfp; (B) JM109/pET28a-Pfic-egfp; (C) JM109-ΔrpoS/pET28a-PficI-egfp; (D) JM109-ΔrpoS/pET28a-PficII-egfp; (E) JM109-ΔrpoS/pET28a-PficIII-egfp; (F) JM109-ΔrpoS/pET28a-PficI*-egfp; (G) JM109-ΔrpoS/pET28a-PficII*-egfp; (H) JM109-ΔrpoS/pET28a-PficIII*-egfp; (I) JM109/pET28a-Pfic-egfp; (J) JM109/pET28a-Pfic-egfp; (K) JM109/pET28a-Pfic-egfp. PficN* is PficN with low activity in the JM109-ΔrpoS strain. The abscissa axis GFP-A represents the amount of green fluorescence that can be used to describe the strength of the promoter. The vertical axis SSC-A represents the side scatter, which reflects the complexity of the cell. A, B, C, and D in each figure represent the four thresholds divided by the abscissa axis GFP-A. Each dot in the plot area represents a cell, and the color change from blue to red represents an increase in cell concentration.
Fermentation 09 00468 g003
Figure 4. Fluorescence strength detection of colonies at 12 h. (A) The PficI library was mutated in the −35 hexamer; (B) the PficII library was mutated in the spacer region; (C) the PficIII library was mutated in the discriminator.
Fermentation 09 00468 g004
Figure 5. Sequence preference analysis of mutation regions was performed using WebLogo. (A) Base pair content of the −35 hexamer (from −39 to −34); (B) base pair content of the spacer region (from −33 to −17); (C) base pair content of the discriminator (from −10 to −1).
Fermentation 09 00468 g005
Figure 6. A+T content analysis in different regions. (A) The A+T content between −33 and −18 of enhanced self-inducible promoters was generally higher than that of the wild-fic promoter; (B) the A+T number in the discriminator’s first five bases showed an increasing trend with increased promoter strength.
Fermentation 09 00468 g006
Figure 7. Dynamics of fluorescence and OD600 nm under different conditions. JM109/pET28a-Pfic-egfp, JM109/pET28a-PficI-17 -egfp, JM109/pET28a-PficII-33-egfp, and JM109/pET28a-PficIII-14-egfp were incubated in LB medium (A); LB medium with 0.5× nutrient (B); LB medium with 2× nutrient (C); and LB medium with 1.5× osmotic pressure (D).
Fermentation 09 00468 g007
Figure 8. Dynamics of red fluorescence and OD600nm under different conditions. (A) LB medium; (B) LB medium with 0.5× nutrient; (C) LB medium with 2× nutrient; and (D) LB medium with 1.5× osmotic pressure.
Fermentation 09 00468 g008
Disclaimer/Publisher’s Note: The statements, opinions and data contained in all publications are solely those of the individual author(s) and contributor(s) and not of MDPI and/or the editor(s). MDPI and/or the editor(s) disclaim responsibility for any injury to people or property resulting from any ideas, methods, instructions or products referred to in the content.

