1. Introduction
The search for raw materials with high protein content that do not compete for land with crops for human consumption is of vital importance for the survival of the food and feed ingredient production sector. The increase in demand for protein is occurring mainly due to the growth of the world’s population, socio-economic changes such as the growth of urban centres and incomes, and the recent association of protein with a healthy lifestyle [
1,
2]. By the year 2050, the world’s need for protein-rich food sources will have increased by 70%. This fact, combined with the scarcity of water and energy, the effects of climate change, and the competition between crops for consumption and crops for biofuel production, constitutes a major challenge for the food and feed industry and for society at large. Therefore, it is essential both to minimise the use of resources and to valorise all those food fractions currently in states of disuse which can be used as sources of protein and as growth substrates for producing protein-rich organisms [
3].
Several microalgae biorefinery processes have been developed in recent years as methods to obtain value-added ingredients (fatty acids, amino acids, vitamins, pigments, etc.), with applications in many sectors (food, feed, health, cosmetics, agriculture and energy) [
4,
5,
6]. Specifically, the production of microalgae for use as an alternative protein source, as opposed to the generation of conventional plants, crops, or animal sources, is a possibility that has aroused the greatest levels of interest among the scientific community as well as among microalgae producers [
7,
8,
9]. The production of this, together with the production of other added-value products such as fatty acids, pigments and/or bioactive compounds, would make the existing facilities more profitable [
10,
11,
12].
Autotrophic cultivation of microalgae requires large facilities due to the need for a uniform light supply throughout the biomass and due to the high levels of CO
2 consumption. Despite developments in the design of photobioreactors, the densities obtained are still very low (between 1 and 5 g L
−1), a factor which prevents them from becoming real alternatives to other sources of protein from an industrial point of view. On the other hand, the heterotrophic production of microalgae allows for the development of easily scalable conventional fermentation processes with lower land requirements while also generating much higher biomass yields [
2]. However, only a few microalgal species are able to adapt their growth to heterotrophic conditions and this process requires an additional carbon source (mainly glucose, but also acetate or glycerol), making it more expensive and also presenting contamination problems [
13,
14,
15].
Chlorella protothecoides (previously
Auxenochlorella protothecoides) is a versatile microalgae species that can grow in autotrophic, mixotrophic and heterotrophic conditions using several carbon sources, such as glucose, glycerol or volatile fatty acids [
13]. In addition,
Chlorella protothecoides can produce high concentrations of lipids or proteins if the growth conditions and medium composition are effectively controlled and modified (mainly C/N/P relations) [
16]. Protein concentrations of approximately 50% and even up to 65% have been achieved, as described in patent WO2017137668A1 [
17].
Nevertheless, the high level of nutrients required to support such a high production yield can be an inconvenience that reduces the economic feasibility of industrial production. Indeed, raw materials in heterotrophic production account for 23–40% of the total production costs [
18]. In this context, the use of various side streams or by-products as sources of nutrients is one of the main alternatives with which to make this type of process profitable and to reduce the environmental impact of by-products or wastewaters [
19,
20,
21,
22,
23,
24,
25,
26]. However, when using many of these by-products, pretreatments are needed prior to their use as culture media, increasing production costs. For this reason, the use of sugar-rich liquid by-products such as expired juices would present a clear advantage as a technique because the sugars are soluble and readily available, without the need for prior hydrolysis processes.
Apart from being rich in protein and other nutrients, microalgae are also natural sources of bioactive compounds of different natures, such as peptides, pigments, polyphenols, and polysaccharides, among others. These possess diverse activities such as antioxidant, antihypertensive, and antimicrobial capacities [
27,
28,
29]. Furthermore,
C. protothecoides grown in heterotrophic conditions has been studied as suitable producers of pigments such as lutein, which is considered to be a valuable antioxidant agent [
30]. The need to increase the shelf life of food products while guaranteeing food safety has intensified in recent years. In addition, consumers are asking for the use of more natural compounds and fewer additives in food formulation [
31]. In fact, one of the largest challenges facing humanity is antibiotic resistance. This has arisen due to an abuse in the use of traditional antibiotics, leading to the development of resistant bacteria. Thus, finding new antimicrobial compounds is also of great interest for the food and feed sectors.
However, the cell walls of microalgae, composed mainly of hemicelluloses and polysaccharides, have high thicknesses that make them poorly digestible in general and hinder the release of bioactive compounds. Therefore, the combined use of the most suitable extraction technologies is needed in order to improve the efficiency and profitability of the processes [
7]. Ultra-high-pressure homogenisation (UHPH) is a technology of mechanical cell disruption that is based on forcing the biomass to pass through a narrow opening under high pressure, which induces cells to break down, even in those organisms with resistant cell walls. Compared to other methods of cell disruption, UHPH is one of the most efficient methods for releasing protein from microalgae [
32,
33].
The aim of this study is to achieve high levels of protein and biomass production from the C. protothecoides strain through heterotrophic cultivation using expired juices as an alternative carbon source. In doing so, we aim to contribute to the circular economy and to reduce the cost of the process. At the same time, we aim to analyze the diversity of applications of both the biomass and of the different fractions obtained after cell disruption for use in a preliminary assessment of the most technically and economically viable roadmap. The ultimate aim is to further scale up and industrially exploit these processes.
2. Materials and Methods
2.1. Microorganisms and Culture Medium
C. protothecoides was obtained from the UTEX collection (UTEX 205) and grown at 28 °C, with stirring conducted at 250 rpm in a liquid-modified Bristol (MB) medium with additional modifications [
34]. This medium contained (g L
−1) 15 glucose, 3 NaNO
3, 1 yeast extract (YE), 0.3 KH
2PO
4, 0.7 K
2HPO
4, 0.3 MgSO
4·7H
2O, 0.075 CaCl
2·2H
2O, 0.025 NaCl, 0.02 chloramphenicol and 0.1 of antifoam 204 (A6426 Sigma-Aldrich, Steinheim, Germany). The inoculum samples were incubated for 4 days before the experiments and inoculated in 10% (
v/
v) in total volume.
For the fed-batch strategy, concentrated solutions were prepared. The solution in Bottle 1 was composed of glucose or expired juices and salts (g L−1): 350 reducing sugars, 3 MgSO4·7H2O, 0.75 CaCl2·2H2O, and 0.25 NaCl. The solution in Bottle 2 was composed of nitrogen components and phosphates (g L−1): YE 150, NaNO3 100, KH2PO4 4, and K2HPO4 9.4.
2.2. Concentration of Expired Fruit and Vegetable Juices
The expired fruit and vegetable juices (FVJ) provided by several juice producers were used as alternative sources of carbon and other nutrients in order to compare their viability to the glucose-based process. The juice mixture was a representative blend of the juices discarded by the juice companies based on the manufacturing percentage provided by several companies in the sector. It was composed of tomato juice (13.0%); pineapple, apple, and grape juice (1.8%); orange juice (8.9%); apple juice (16.0%); mandarin juice (3.6%); pineapple juice (24.6%); orange and carrot juice (3.6%); peach juice (14.3%); banana, grape, pomegranate, and beetroot juice (4.5%); mango, orange, and maracuja juice (2.7%); grape juice (1.8%); pear juice (1.8%); clementine juice (1.8%); and melon juice (1.8%).
The raw mixture of FVJ was conditioned by centrifugation at 1950 rpm in a vertical-axis centrifuge with a filter bag (Comteifa, Vilassar de -Dalt, Spain) in order to remove the larger solids (<400 micra). Subsequently, the clarified juice obtained was concentrated by a factor of 2 using reverse osmosis membranes, its concentration changing from 66 g L−1 to 130 g L−1 of reducing sugars. In order to increase the sugar content to a concentration similar to that used in the stock glucose solution of the MB medium, a further concentration step was carried out by vacuum evaporation in a rotatory evaporator (Heidolph rotatory evaporator, Sigma-Aldrich) at 65 °C. When the juice reached 40 ° Brix, the process was ended, and the concentrated juice was collected at 350 g reducing sugars L−1 for further use in the fed-batch tests.
The final mixture composition is presented in
Table 1.
2.3. Batch Trials
The first batch trial was conducted for the selection of a nitrogen source in order to increase protein concentration in biomass. For this trial, MB (15 g glucose L−1) was used as the medium, containing proteose peptone (PP 1 and 3 g L−1) and YE (3 g L−1). Previous experiments have shown there to be a higher level of biomass production when using these nitrogen sources compared to urea (results not shown). The second trial was established to compare MB and FVJ as media once the nitrogen source was selected. In this trial, MB was compared with the FVJ medium at different concentrations (providing 15 and 30 g of reducing sugars L−1).
Both trials were carried out in 1 L Pyrex bottles with a total volume of 300 mL, orbital shaking of 175 rpm, 28 °C, and darkness for 6 and 9 days, respectively. The pH was manually adjusted every 2–3 days by adding NaOH 1M. Experiments were carried out in duplicate.
2.4. Fed-Batch Strategy
2.4.1. Bottle Experiments
With the aim of optimizing biomass and protein at the same time, fed-batch trials were carried out in 1 L bottles before a switch was made to the 5 L reactor.
The first experiments were carried out in conditions of 300 mL working volume, orbital shaking at 175 rpm, 28 °C and 12 days’ darkness. Different combinations of sugar concentration (15 and 30 g L
−1) and YE (3 and 10 g L
−1) were tested using both BM and FVJ as media (Experiments A–D) (
Table 2). An extra trial was carried out in bottles, using only FVJ as a carbon source as well as a different combination of reducing sugars and YE (Experiment E) (
Table 2). All the experiments were carried out in triplicate.
2.4.2. Reactor Experiments
For the fed-batch culture in a 5 L jacketed stirred tank reactor (BIOSTAT BPLUS-5L CC, Sartorius, Goettingen, Germany), 4 L of medium (MB or FVJ) was added and inoculated with C. protothecoides. The combination was grown for 4 days in a 1 L Pyrex bottle with 400 mL of MB medium at p H 6.8, maintained at 28 °C and placed under agitation at 250 rpm in the dark.
The tank reactor was equipped with a stirrer shaft, which was coupled with a 6-blade disk impeller, and a microporous sparger for aeration, which was connected to a controller. The dissolved O2, temperature, and pH were measured with specific probes, namely, a polarographic DO2 sensor (VisiFermDO ECS 325, Hamilton, Reno, Nevada) and a classic pH sensor, respectively (EasyFerm PlusK8325, Hamilton). The temperature of the reactor was maintained at 28 ± 2 °C, the pH was kept between 6.5 and 7 (6.8), and the agitation was sustained at 250 rpm. The culture was continuously mixed with air at a flow rate of 2 vvm and protected from the light. The dissolved O2 was maintained at a rate higher than 60%.
The medium conditions were selected from previous bottle assays. Starting point: (g L−1) 15 reducing sugars, 3 NaNO3, 8 YE, 0.3 KH2PO4, 0.7 K2HPO4, 0.3 MgSO4·7H2O, 0.075 CaCl2·2H2O, 0.025 NaCl, 0.02 chloramphenicol, and 0.1 of antifoam 204.
Daily monitoring was carried out by means of data collection in the equipment program and periodic samples were taken (every 2–3 days) to monitor the control parameters (optical density, biomass production and reductions in sugar, nitrogen and phosphorus concentrations). The corresponding withdrawals and additions of new media were periodically carried out to gradually increase the feeding sugar concentration from 15 g L
−1 to 20, 25, 30 and 40 g L
−1 when the glucose content decreased to below 10 g L
−1. The nitrogen concentration was also maintained at a higher level than 1 g L
−1 to obtain a C/N ratio lower than 10 in order to boost protein production. This strategy aimed to achieve an adaptation of microalgae biomass to high sugar consumption, which was in accordance with previous results in bottle assays (
Table 2). Nitrogen addition was carried out by extrapolating the reducing sugar addition, using the initial relation between both components.
Two different trials were carried out: one was performed with MB and one was carried out with FVJ.
2.5. Analytical Determinations
2.5.1. Determination of Cellular Concentration
The cell concentration was checked every 48 h over a period of approximately 12 days until the early stationary phase of growth was reached, which was when an OD was constantly maintained. The growth monitoring was performed by measuring the absorbance at λ = 540 nm in a spectrophotometer (Genesys 20, Thermo Fisher Scientific, Roskilde, Denmark). To quantify the biomass, a known volume of culture was filtered through 45 μm pore filters (47 mm, Sartorius), and the obtained biomass was oven-dried at 100 °C and quantified by weight.
2.5.2. Growth Parameters
The productivity of
C. protothecoides was calculated for each day compared to that of day zero. The maximum value obtained was defined as the maximum biomass productivity. Biomass productivity (
BP) was obtained using Equation (1). The specific growth rate (µ) was defined by Equation (2) for the heterotrophic routes. Biomass yield (
BY) and protein yield (
PY) were obtained by Equations (3) and (4), respectively.
where:
DWf: biomass production (g L−1)
DWi: biomass production at the beginning (g L−1)
Tf: measuring time (d)
Ti: initial time (d)
R.S c.: reducing sugar consumption (g L−1)
PC: protein concentration in biomass (% DM)
2.5.3. Chemical Analysis
The chemical composition of the microalgae samples was measured by applying the Association of Official Analytical Chemists (AOAC) official methods [
35]. Samples were dried at 100 °C down to a constant weight (method 934.01) to determine the moisture content. The Kjeldahl methodology, which uses a nitrogen-to-protein conversion factor of N × 6.25 (method 955.04), was applied for crude protein content determination. Crude fat content was determined using the Bligh and Dyer method [
36].
The total sugar reduction was determined using the Dinitrosalicylic (DNS) acid reagent method [
37], which we adjusted to a microplate (Thermo Fisher Scientific, Roskilde, Denmark) assay procedure [
38].
The total nitrogen and phosphorus levels in the growing medium during reactor experiments were determined using Spectroquant cell test kits (namely, the nitrogen (total) cell test kit 1.14763.0001 and the phosphate cell test kit (o-phosphate) 1.14546.0001, respectively) (Merck, Darmstadt, Germany).
In the initial MB and FVJ media, phosphorus was determined by the spectrophotometric method (molybdate–vanadate reagent) and sodium, potassium, calcium, magnesium, copper, iron, cobalt, manganese, and zinc levels were determined via the use of flame atomisation spectroscopy.
The amino acid (AA) profile was determined by liquid chromatography and fluorescence detection after performing sample derivatisation using the AccQ-Fluor Reagent Kit (WATO52880, Waters, Milford, CT, USA), as described previously [
39]. The amino acid score (AAS) was determined from the difference between the concentration of essential amino acids (EAA) in the samples and the FAO/WHO pattern [
40]. Fatty acid (FA) profiles were determined as methyl esters and analysed with GC-FID, as described previously [
39].
2.6. Antibacterial Activity
The antibacterial activity of the extracts was determined using the agar diffusion method as modified by San Martin et al. [
41]. A total of five bacterial species were used as test microorganisms, namely,
Salmonella enterica (CECT 4156),
Escherichia coli (CECT 516),
Staphylococcus aureus (CECT 435),
Aeromonas salmonicida (CECT 5173), and
Bacillus subtilis (CECT 39).
Test organisms were inoculated in Mueller–Hinton broth (10 mL) at a 0.30 optical density (approx. 108 cfu mL−1). Then, 200 µL of microorganism suspension was incubated in 8 mL of Mueller–Hinton soft agar (0.7% bacteriological agar w/v) at 48 °C; then, it was vortexed and cast in a Mueller–Hinton Petri plate. Once the plates were solidified, extracts were included (10 µL) and incubated at 37 °C for 24 h. The diameters of the growth inhibition zones of pathogens were compared to a positive antibacterial control (2 mg mL−1 gentamicin; >98% Sigma-Aldrich, Steinheim, Germany) and a negative control (sodium phosphate buffer, 0.01 M, pH 7.5).
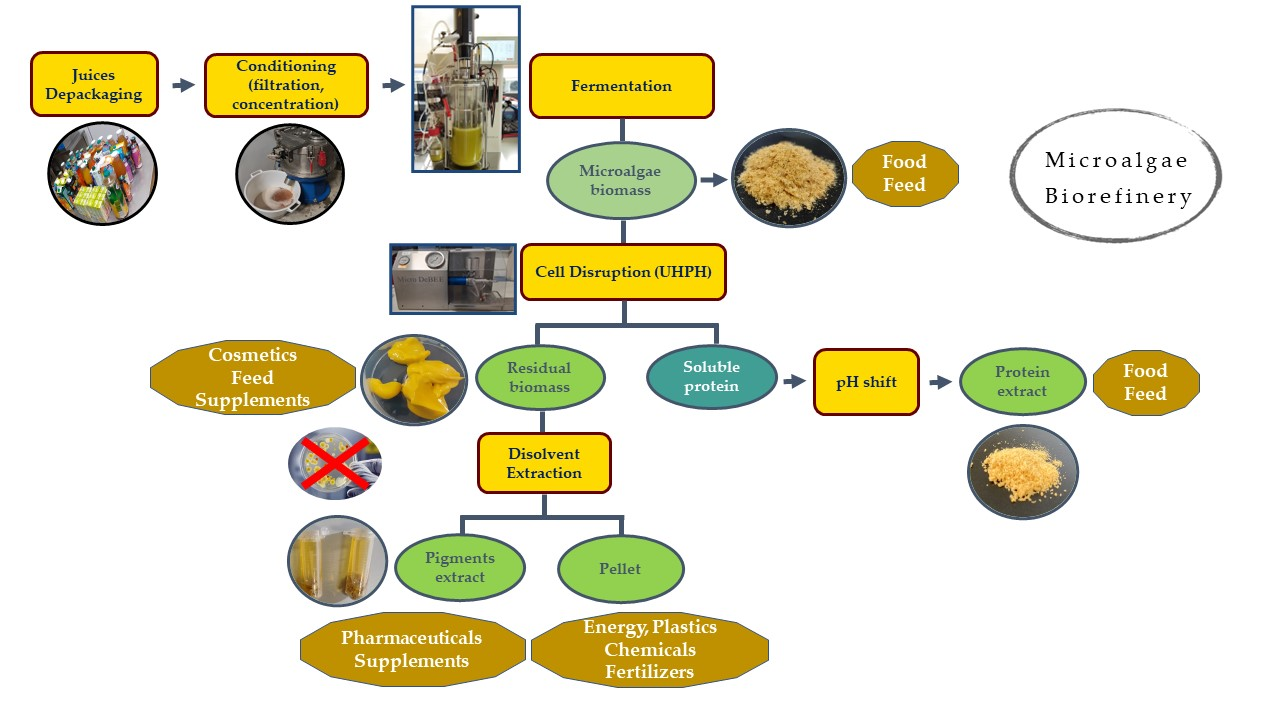
2.7. Biorefinery Scheme
2.7.1. Protein Extraction
A suspension of microalgae at a 10% dry weight was prepared and adjusted to pH 12 with NaOH 10 M. The suspension was vacuum-filtered through 100 µm filters to avoid problems with the UHPH (MicroDeBEE, Bee International, South Easton, MA, USA) equipment; the suspension was stored in the cold and in the dark to avoid deterioration.
The applied UHPH conditions were 250 MPa, 250 µm orifice, and 3 cycles. The samples were stored in an ice bath in order to control the increase in temperature.
After UHPH processing, the samples were centrifuged at 10,000× g, for 10 min at 4 °C (avoiding direct light). Soluble proteins were collected in the supernatant and pigments, lipids, and carbohydrates were collected as a pellet. This pellet or “residual biomass” was frozen for further processing (as explained in the following section).
The soluble proteins in the supernatant were precipitated by adding 6 M HCl until a pH of 3.3 was obtained. Samples were again centrifuged at 10,000× g, for 10 min at 4 °C and the pellet was resuspended in the phosphate buffer at pH 7 0.1M.
2.7.2. Extraction from Residual Biomass
The residual biomass was further processed for use in the extraction of pigments and antibacterial compounds. The residual biomass (0.5 g) was mixed with 1 mL of extraction agent (acetone) for 30 min at room temperature conditions in a mixer (150 rpm). After 30 min, the samples were centrifuged at 4500× g for 10 min. The supernatant was collected for further processing. The pellet was subjected to a new extraction process under the same conditions. Both supernatants were collected and maintained at—80 °C. The process was carried out by keeping the samples in the dark to avoid the deterioration of photosensitive compounds.
After the extractions, a determination of total carotenoids was performed according to a UV–Vis spectrophotometric method using the equations of Lichtenthaler and Buschmann [
42] for acetone. In this process, we measured the absorption values at the specified wavelengths.
where:
Ca is chlorophyll a, Cb is chlorophyll b, and Ct is total carotenoids.
For specific pigment determination, the supernatant was filtered through a syringe filter with a 0.22 µm pore size and introduced into the HPLC.
The corresponding volume of 90% acetone (10 mL for microalgae) was added back into the discarded pellet and allowed to stand for 24 h, and the same procedure was performed again the next day. This was repeated until no signal was seen in the pigment analysis. The whole procedure was carried out in low levels of light and the sample was kept at 4 °C.
The chromatographic equipment was equipped with a diode array detector (1.2 nm optical resolution) and a 474 fluorescence detector. The method followed was that described by Seoane et al. [
43]. The column used was a Waters Symmetry C8, with 150 × 4.6 mm, 3.5 μm particle size, and 100 Å pore size. Pigments were identified by their retention time and absorption spectra. Absorption chromatograms were extracted at 440 nm. The retention times were compared with those observed in the analyses of commercial standards (DHI pigments) and with those reported in articles [
44,
45]. Calibration was carried out with chlorophylls (a, b, and c2) and carotenoids (peridinin, fucoxanthin, violaxanthin, alloxanthin, zeaxanthin, and lutein). The molar coefficients obtained by Jeffrey [
45] were used for the quantification of pigments not calibrated with standards.
2.8. Statistical Analysis
Experimental factors were analysed via ANOVA (analysis of variance) and or t tests and were considered significant when their probability (p value) was less than 0.05. Normal data distribution was verified after using the Shapiro–Wilk test and Levene’s test to assess the equality of variances. When equal variances were not assumed or data were not adjusted to a normal distribution, the Kruskal–Wallis statistic was used to compare the samples. Multiple comparisons were carried out using Tukey’s HSD test. All statistical analyses were performed using the Statgraphics software (Statgraphics Centurion XVI software package, 16.2.04 version: Statgraphics Technologies, Inc., The Plains, VA, USA).
3. Results and Discussion
3.1. Batch Trials
In the first batch trials, comparisons were carried out between PP 1 and 3 g L
−1 and YE 3 g L
−1 (
Table 3).
Statistically significant (
p < 0.05) differences in protein concentration were found in the
C. protothecoides biomass grown in media with PP 1, 3 g L
−1 and YE 3 g L
−1. Increasing the nitrogen source (3 g PP L
−1) increased the protein concentration in biomass (
p < 0.05) (20.58 ± 2.49% DM with 3 g PP L
−1 and 11.27 ± 0.41% with 1 g PP L
−1); however, no differences were found in biomass production (g DM L
−1). Regarding the effect of nutrient source, no differences in biomass production were found between using PP or YE at 3 g L
−1 (3.32 ± 0.15 g DM L
−1 with PP and 4.55 ± 1.53 g DM L
−1 with YE). On the contrary, statistically significant differences (
p < 0.05) were found in protein concentrations (% DM) when using either PP or YE at 3 g L
−1 (20.58 ± 2.49% with PP and 30.45 ± 2.47% with YE). Therefore, YE was selected for use in further nutrient optimisation. Other authors have found a higher lipid accumulation in nitrogen depletion conditions in the medium with
C. protothecoides algae [
46]. This demonstrates that, during heterotrophic cultivation of microalgae, C/N ratios and sources have a significant effect on the regulation of cell growth and on the biomass composition [
47]. A recent review about microalgae as a protein source also stressed the importance of nitrogen as a critical macronutrient that regulates the metabolism and, consequently, the growth and biochemical composition of microalgae [
48].
In the second batch trial, comparisons were conducted between MB and FVJ media at low sugar concentrations (15 g L
−1) and with the FVJ medium at high reducing sugar concentrations (30 g L
−1) (
Table 4). MB led to significantly (
p < 0.05) lower levels of biomass production (6.59 ± 0.13 g DM L
−1) compared to high reducing sugar FVJ medium (11.7± 1.27 g DM L
−1), while no differences were found between MB and low reducing sugar FVJ media.
Protein concentration was statistically lower in the biomass grown in the medium with the highest reducing sugar concentration (16.9 ± 0.01% DM). The highest protein concentration, by contrast, was found in low reducing sugar FVJ medium (21.6 ± 0.11% DM). Differences were found between three groups. Park et al. [
25] also found a higher biomass production when glucose source was increased in batch trials using orange peel as a carbon source. In addition, they also showed a higher accumulation of lipids in biomass at higher sugar concentrations.
No differences were found regarding the BY between medium conditions (from 0.29 to 0.33 g DM g
−1 sugar consumption). However, regarding PY, the use of the FVJ medium at high reducing sugar concentrations led to higher values (1.98 ± 0.22 g protein L
−1) compared to the MB medium (1.24 ± 0.06 g protein L
−1). No differences were found between low reducing sugar FVJ medium (1.56 ± 0.01 g protein L
−1) and the other two conditions (
Table 4).
FVJ is a promising sugar source with positive results in PY, biomass, and protein production; however, depending on the concentration added, either protein or biomass production is promoted. Higher sugar concentration led to higher biomass production but to a lower protein concentration in the biomass, which was mainly due to an increase in the C/N ratio in high reducing sugar concentrations (
Table 4). In order to maximize protein and biomass production, thus avoiding substrate inhibition while obtaining high cell density growth, several C/N ratios have been tested under the fed-batch strategy [
13].
3.2. Fed-Batch Optimisation in Bottles
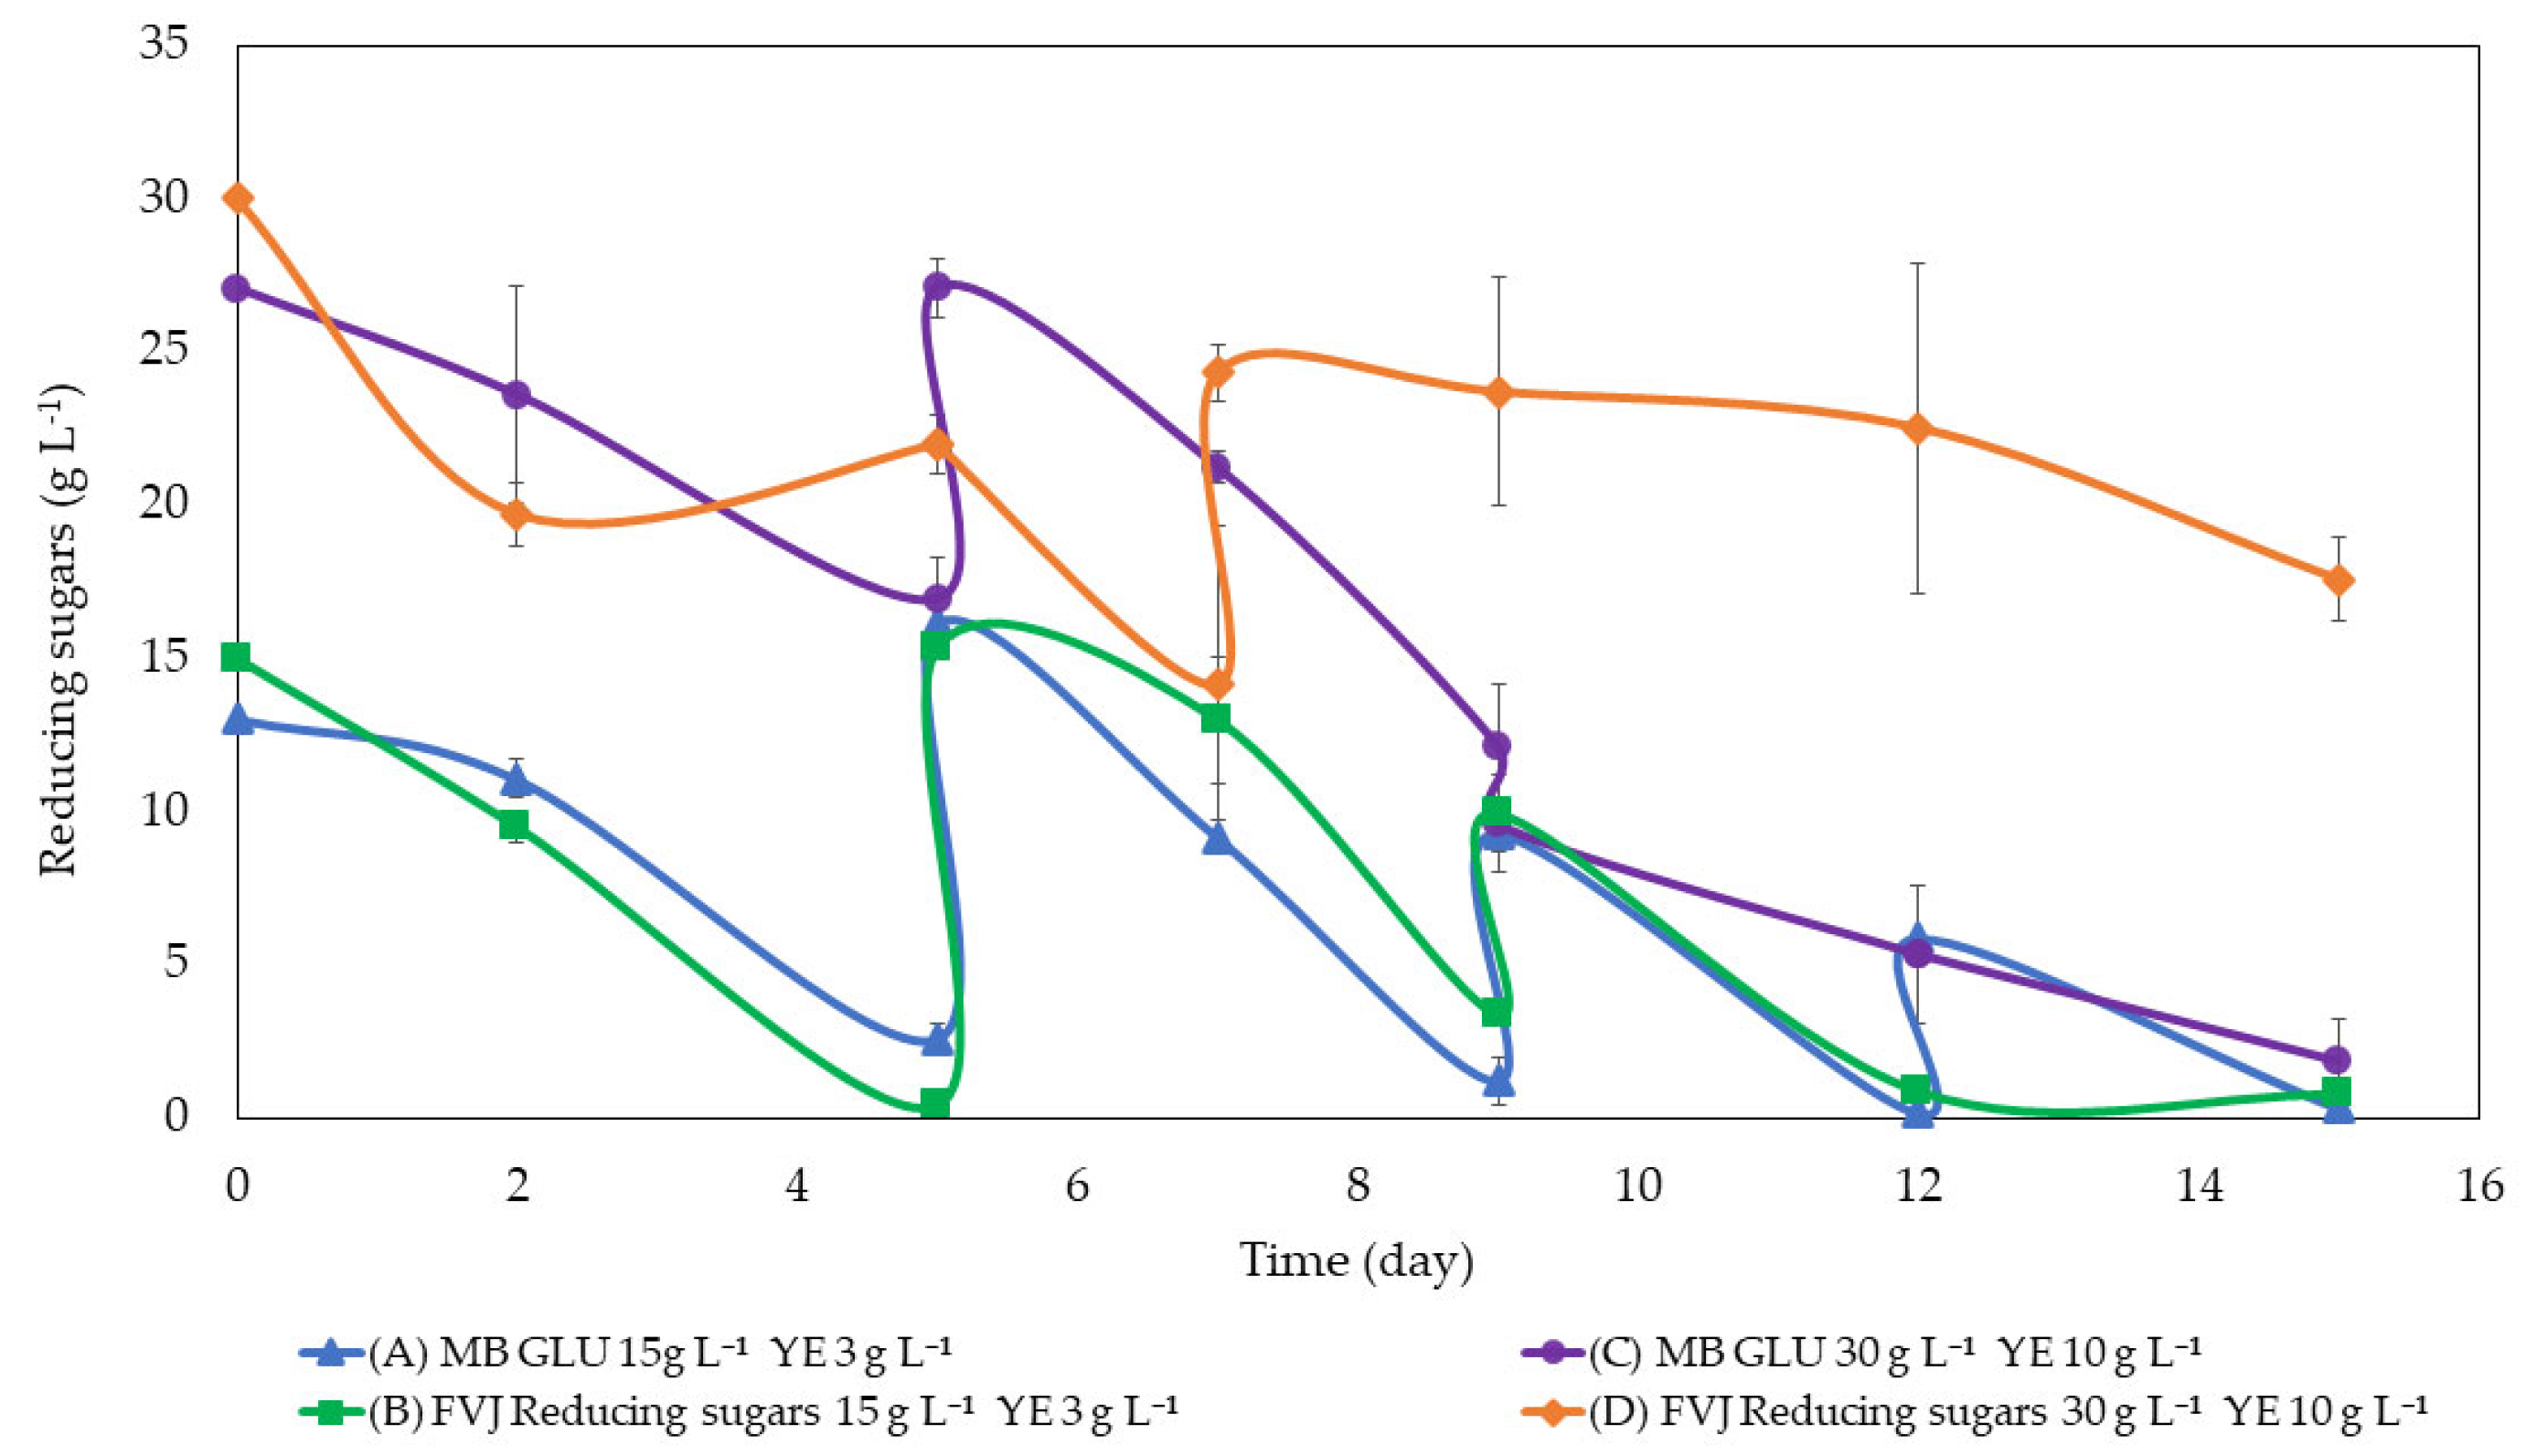
The following graph (
Figure 1) shows the consumption of reducing sugars during the bottle fed-batch assay (
Table 2).
In both cases, MB and FVJ, the total reducing sugar consumption was significantly (
p < 0.05) higher at lower initial sugar concentrations. However, there were no statistically significant (
p > 0.05) variations detected in overall sugar consumption when using glucose and FVJ as the sources of reducing sugars, regardless of whether the concentration of reducing sugars was low or high. The main reason for the lower sugar consumption could be the high oxygen requirement, which cannot be achieved by established orbital shaking. Alternatively, it may have been due to some saturation or inhibition effect from the excess of nutrients as, in addition to sugars, the juice provided different macro- and micronutrients. This could have affected the growth of the microalgae and thus, the consumption of sugars [
26].
Regarding BY (g biomass DM g
−1 consumed sugars), no significant differences were found (
p > 0.05) between groups. Even so, a clear tendency towards a higher PY was seen when using FVJ media (
Table 5).
For a better assimilation of sugar addition, and to optimise the protein content in the FVJ medium, a reduction of initial sugar (15 g L
−1) and an increase in YE (8 g L
−1) was established (Experiment E).
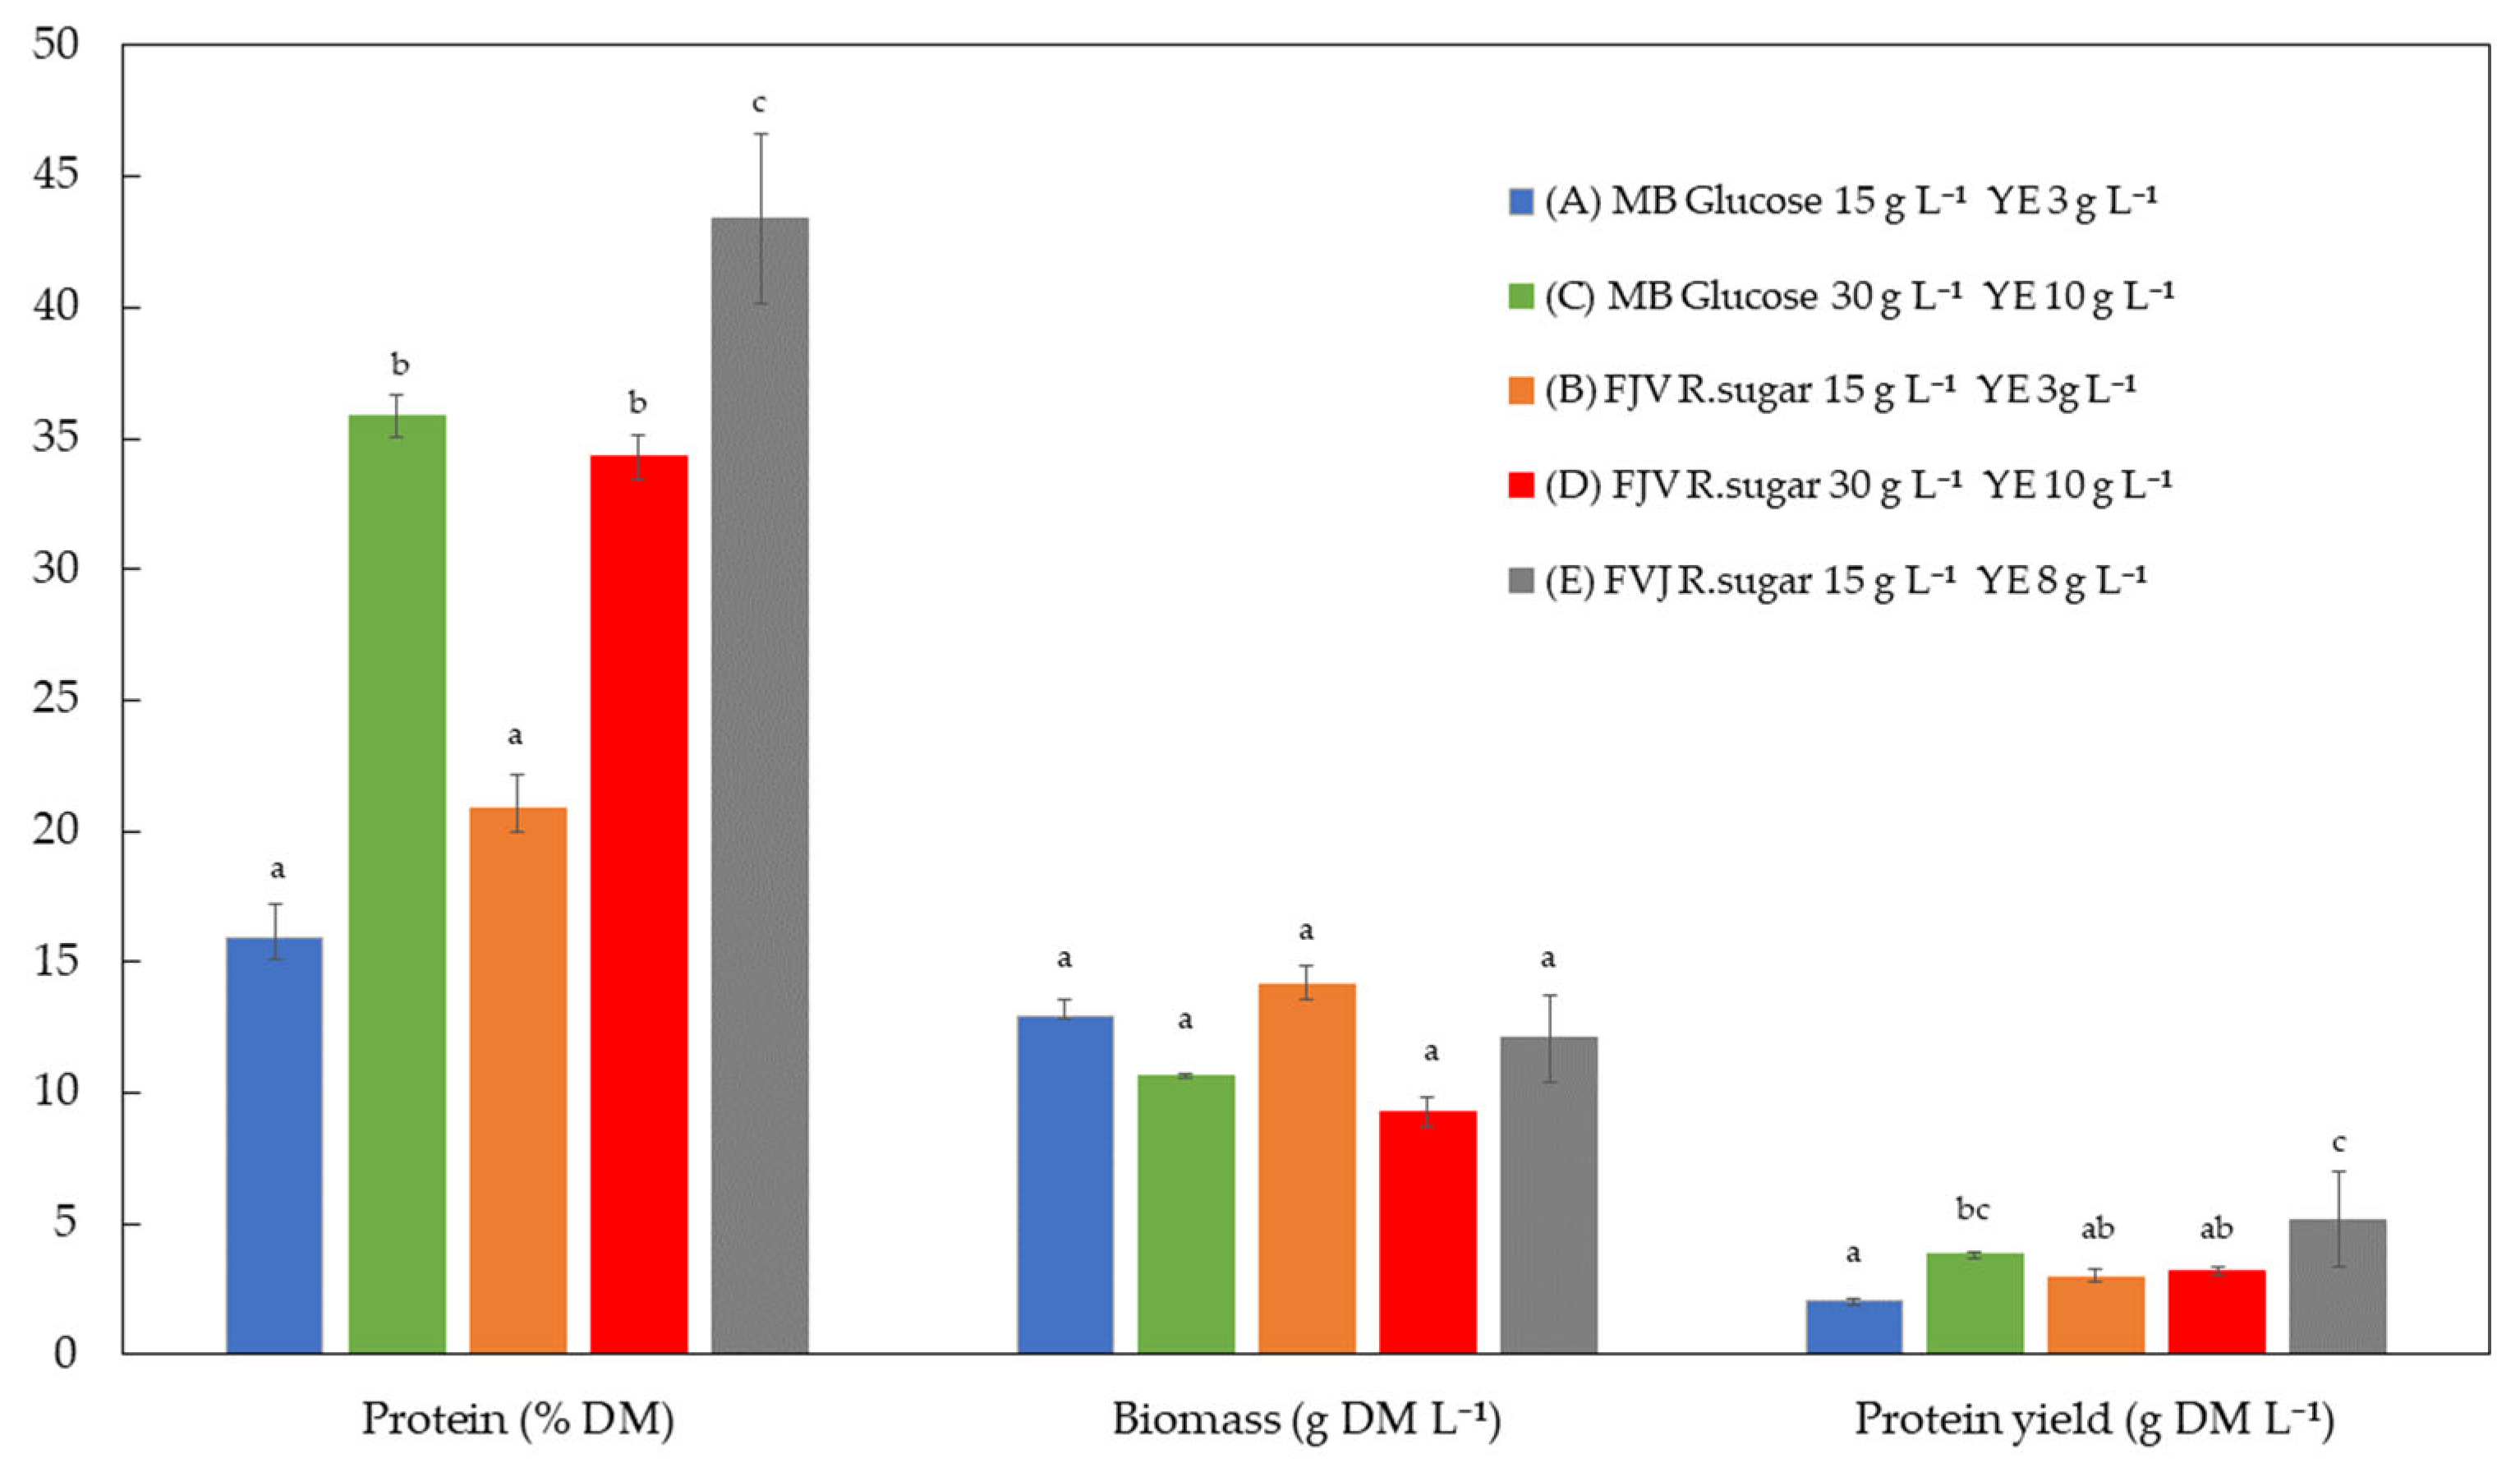
Figure 2 compares the protein concentration, biomass production, and PY across the five experiments (A–E).
The medium composition did not have a statistically significant (
p > 0.05) impact on biomass production (g DM L
−1). However, there was a trend toward biomass reduction when high sugars and high YE combinations were used, occurring both in the MB and in FVJ groups (
Figure 2). This phenomenon could have occurred due to a substrate inhibition effect. Russo et al. [
26] reported that a high sugar concentration (>60 g L
−1) negatively affected the production of
Pythium irregulare biomass when expired orange juice was used as the carbon source.
However, protein content (% DM) was significantly (p > 0.05) higher at high sugar levels and YE concentrations compared to the lower concentrations (15 and 3 g L−1 sugars and YE, respectively), with the same effect being observed regardless of the medium (MB or FVJ) used. Nevertheless, the most significant (p < 0.05) protein content of the biomass was obtained when the combination of lowest sugars (15 g L−1) and medium YE (8 g L−1) was used (43.37 ± 3.24%), which was mainly due to there being a lower C/N ratio.
Regarding the PY (g protein per litre of medium), as occurs with protein concentration, the combination of lower glucose content (15 g L−1) and middle YE (8 g L−1) produced a significantly higher (p < 0.05) value compared to the other conditions. Therefore, this combination was selected for use in the 5 L reactor trials.
The effect of nutrient combination on microalgae biomass has been previously studied with the aim of increasing lipid accumulation. Shen et al. [
49] found that nitrogen starvation conditions significantly increased the lipid content of
Chlorella vulgaris biomass. A similar effect was found in the heterotrophic production of
Scenedesmus obliquus NIES-2280, in which the lipid accumulation was higher with the correct combination of phosphorus and nitrogen starvation [
50]. In addition, the carbon source and the carbon-to-nitrogen ratio also had significant effects on the nutrient composition of heterotrophically cultivated microalgae biomass. High C/N ratios usually lead to higher lipid and lower protein accumulation [
47]. Furthermore, high substrate concentration can inhibit cell growth, thus decreasing the biomass productivity [
26].
3.3. Fed-Batch in Reactor Trials
Nutrient supply is one of the main factors in microalgae growth that affects the biomass production and biomass composition. This is due to its effect on lipid and sugar metabolism [
41]. Both the media tested, the MB medium with glucose and the FVJ medium, ensured high levels of biomass production (40 and 27 g DM L
−1, respectively). Other authors have found similar levels of biomass production (38.47 g DM L
−1). However, the initial glucose concentration was higher than in our case (100 g glucose L
−1) and the batch strategy was used [
46].
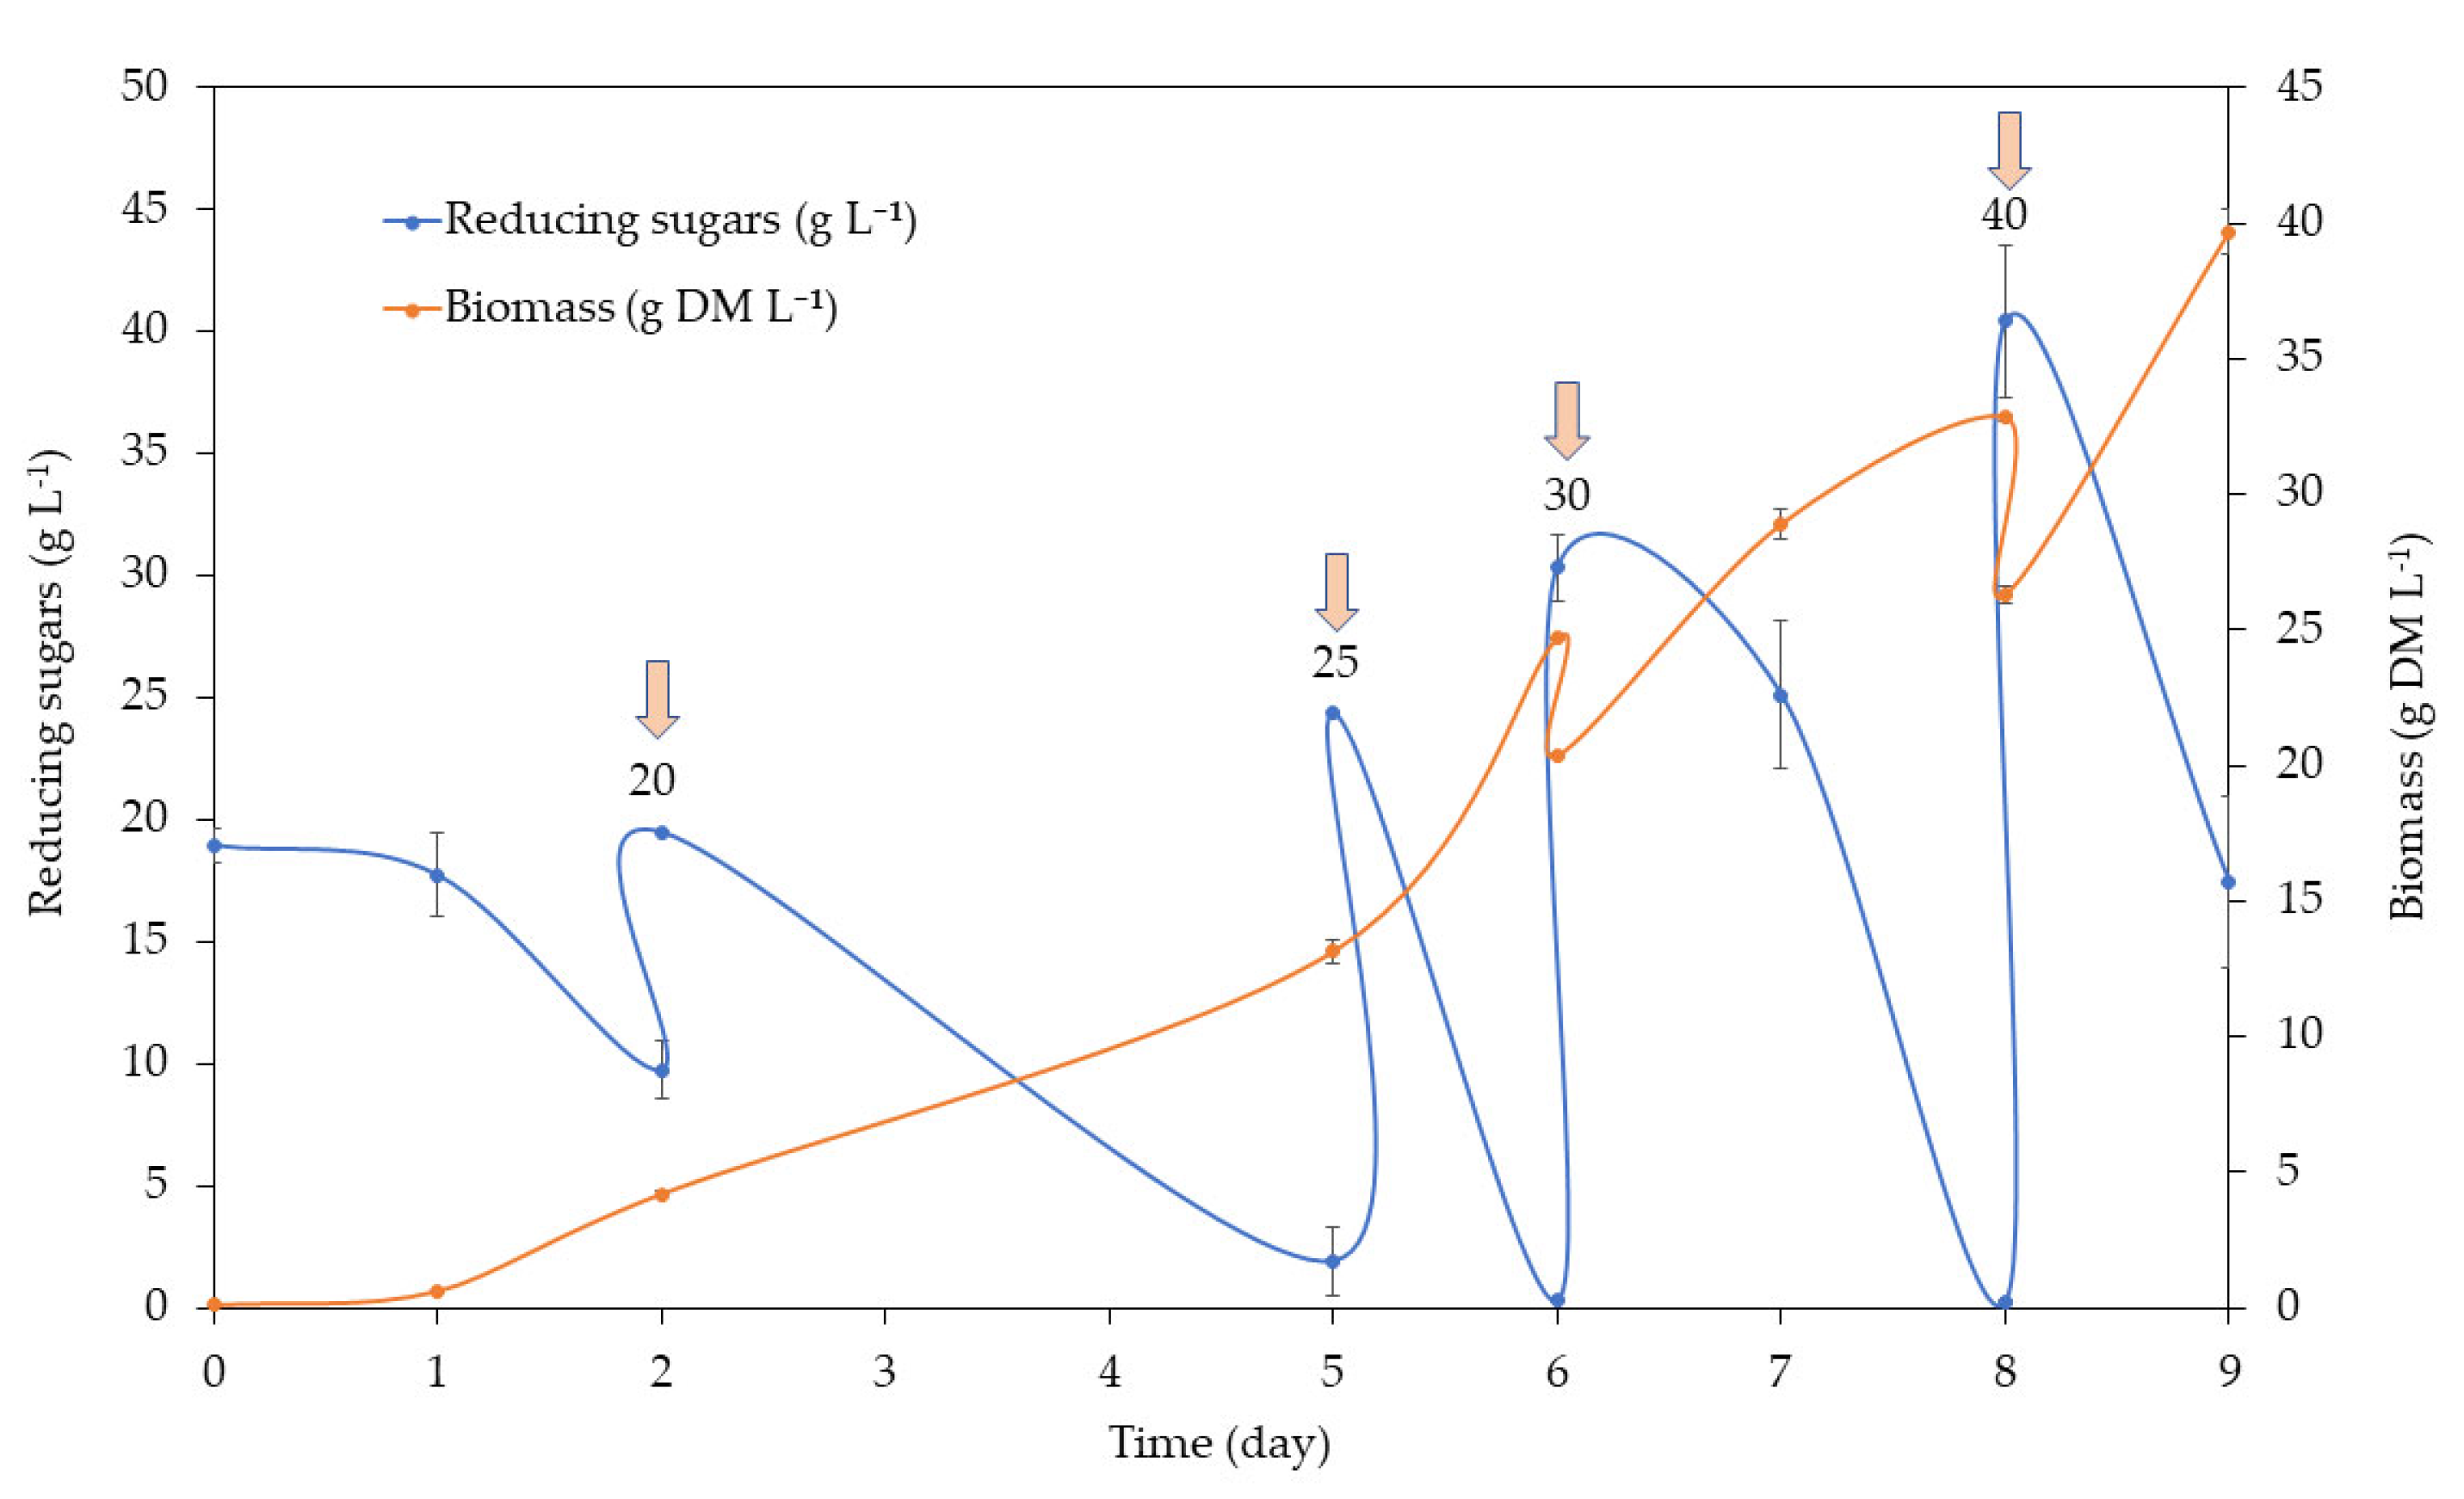
In the MB medium, sugars were consumed rapidly (
Figure 3). A total of four feedings were carried out, adding up to 40 g reducing sugars L
−1 on day 8. The biomass obtained reached almost 40 g DM L
−1.
The biomass yield was of 0.43 ± 0.06 g biomass g
−1 consumed sugar, and the biomass productivity (g L
−1 d
−1) and specific growth rate µ (d
−1) were 3.47 ± 0.48 and 1.06 ± 0.06, respectively (
Table 6).
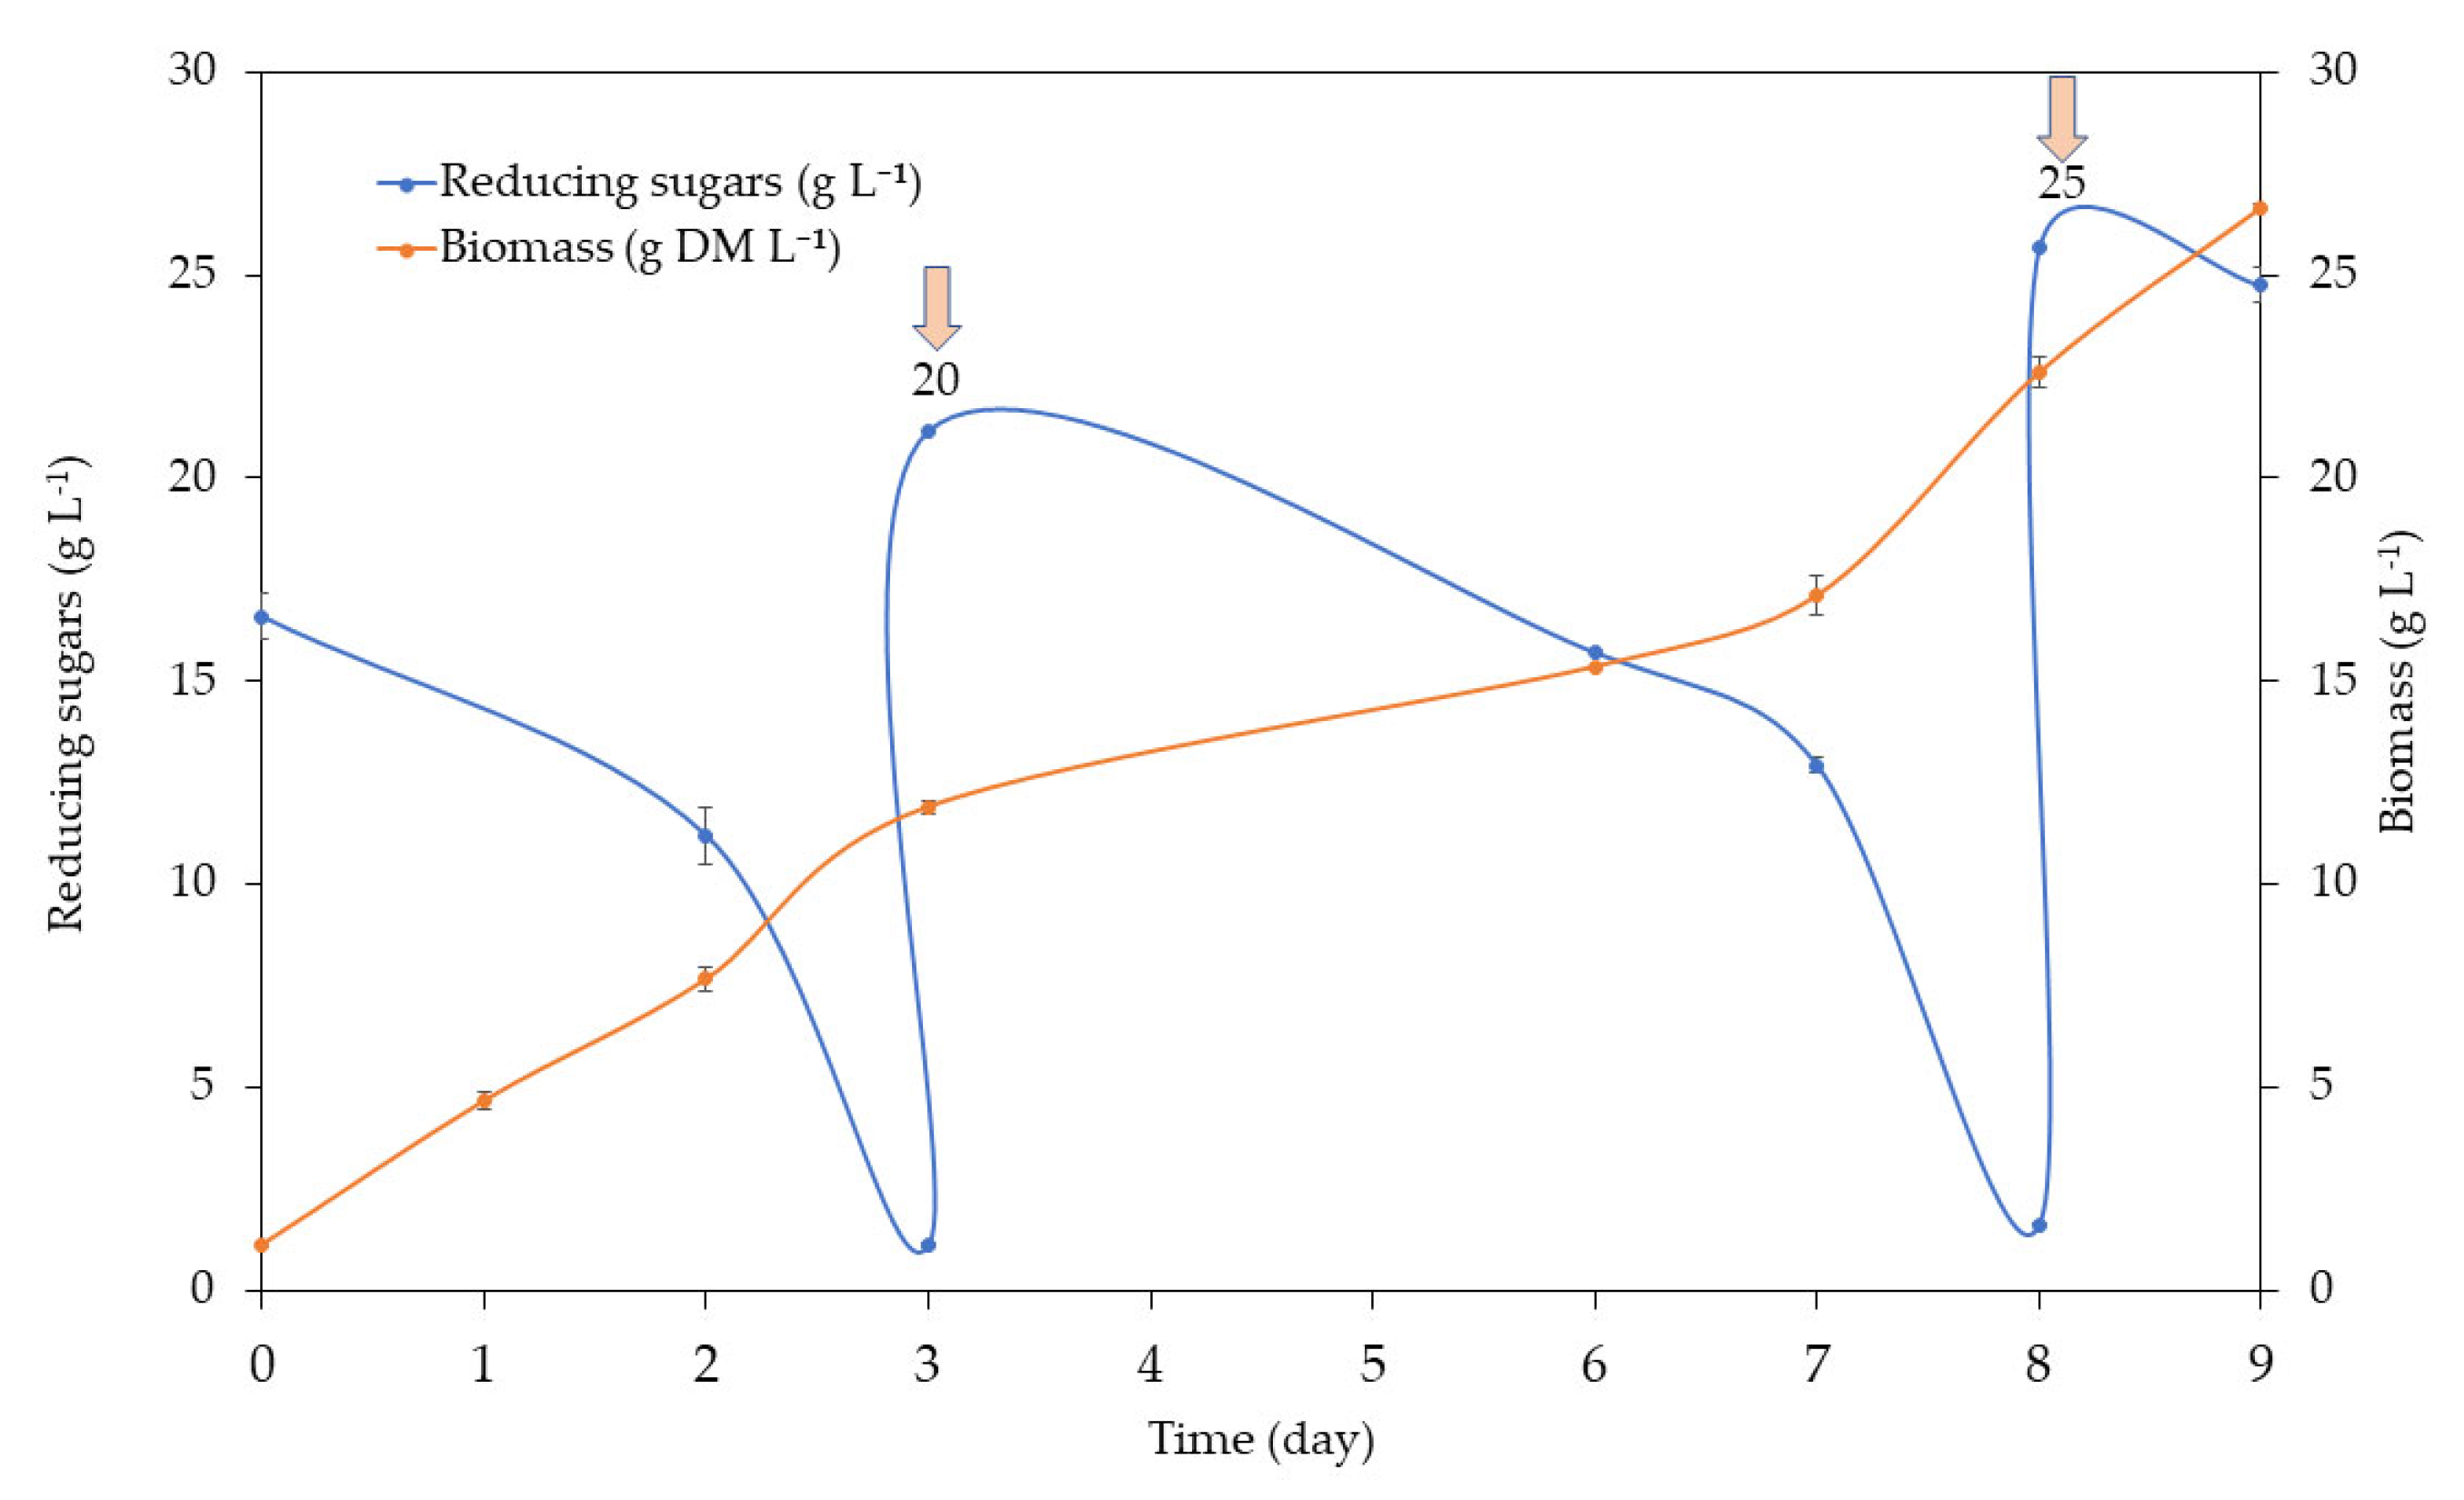
In the case of FVJ, sugar consumption was slower compared to the MB medium (
Figure 3), adding up to 25 g reducing sugar L
−1 and obtaining 27 g DM biomass L
−1 (
Figure 4).
In both cases, nitrogen was kept above 1.3 g L−1, always maintaining a C/N ratio below 10, and close to 4.
No statistically significant differences (
p > 0.05) were found between MB and FVJ media regarding the BP (3.08 ± 0.20 g L
−1 d
−1) and BY (0.68 ± 0.09 g DM g
−1). However, a lower µ was obtained with FVJ as the medium (0.62 ± 0.07 d
−1), compared to when MB was the medium (1.06 ± 0.06 d
−1) (
Table 6).
In both media, BY, BP and µ were similar to those found in other papers [
47]. Nevertheless, the vast majority of articles using this strain seek to maximize lipid production, meaning the nutritional strategies are usually totally different.
Growth parameters are highly dependent on growth conditions, added nutrients, and/or growing modes. Therefore, a comparison between published results is not always possible. However, the values obtained in the reactor experiments with MB and FVJ were similar to those reported in the literature. As an example, Feng et al. [
51] achieved a 14.83 g L
−1 of biomass using a mixture of waste as substrates, with an accumulated biomass productivity of 2.12 g L
−1 d
−1. Wang et al. [
46], by contrast, obtained a maximum biomass production of 38.74 g L
−1 and a µmax 0.034 h
−1. Both groups worked with a batch strategy. In addition, using the fed-batch strategy, they obtained a BY of 0.528 g g
−1; this is higher than the BY obtained in this work with MB medium but lower than that produced using the FVJ medium.
The initial nitrogen values were 1.82 and 1.57 g L−1 for FVJ and MB, respectively. The final values were lower for the MB medium with 3.8 g L−1 and with 5.6 g L−1 for the FVJ medium. Regarding phosphates (PO4), the starting amounts were 778 and 987 mg L−1 PO4 for the MB and FVJ media, respectively. Consumption was observed in intermediate measurements (153 mg L−1 PO4 in the MB medium at day 5 and 540 mg L−1 PO4 in the FVJ medium at day 2). Even so, at the end of the process there was an accumulation of phosphates, with 1466 mg L−1 PO4 in the MB medium and 1196 mg L−1 PO4 in the FVJ medium.
The lower sugar consumption when using FVJ could be due to the fact that, when adding a juice concentrate, other nutrients are also added at high concentration, such as minerals and polyphenols, and this could negatively affect microalgae growth. In particular, a strong accumulation of nitrogen and phosphates (above 5 and 1 g L−1, respectively) was observed at the end of the FVJ trial, indicating that further monitoring of these compounds is necessary. In addition, organic acids and other organic compounds may also have been utilised when grown in the FVJ medium. Therefore, a thorough analysis of the components that are added together with the sugars in the juice concentrate would be necessary to determine if the dilution or removal of specific compounds is necessary.
3.4. Biomass Nutritional Composition
Although
C. protothecoides is known to produce a large amount of lipids (in some cases over 40–50%) [
34,
49,
52], an optimisation of the medium composition made it possible to reduce this concentration to below 15%, favouring the production of protein above 40% on a dry matter basis (
Table 7). Grossmann et al. [
53] and Le Ruyet et al. [
17] also achieved high protein concentrations in
C. protothecoides biomass (48–50%). However, most articles focus on increasing the yield of fat production for its use in biodiesel production [
47,
51].
In terms of nutritional composition, there was no difference in protein, lipid, ash, or carbohydrate content between the two biomasses (
Table 7).
C. protohecoides grown in the MB medium was composed of 42.93 ± 1.11% protein, 14.71 ± 0.80% fat, 6.08 ± 1.36% ash, and 36.61 ± 0.62% carbohydrates. The biomass grown in the FVJ medium was composed of 42.69 ± 1.69% protein, 14.50 ± 0.30% fat, 2.61 ± 0.76% of ash, and 40.27 ± 2.05% carbohydrates.
One of the main differences between microalgae protein content is related to the microalgae species and occurs due to different genetic traits. However, final protein contents are the consequences of a large number of effects, including method, cultivation environment, and growth phase, among others [
48]. In general, the protein content in different microalgae species ranges from 20 to 65% of biomass dry matter [
54].
Chlorella vulgaris and
Arthrospira platensis (Spirulina) are the most commonly exploited industrial species due to their high protein content (51–58% of dry matter) and good profile of EAAs [
55]. The growth process developed in this work could result in biomasses of comparable composition to those already being marketed as protein sources.
An analysis of the FA profile indicates that when using FVJ as a sugar source, the percentage of monounsaturated FA (MUFA) was significantly (
p < 0.05) reduced (from 48.61 ± 3.39% in MB to 41.04 ± 0.47% in FVJ) while the proportion of polyunsaturated FA (PUFA) significantly (
p < 0.05) increased (from 27.78 ± 4.69% in MB to 40.30 ± 0.57% in FVJ); this occurred mainly due to an increase in linoleic acid (C18:2, from 25.85 ± 5.33% in MB to 37.07 ± 0.64% in FVJ) and a reduction in oleic acid (C18:1, from 46.33 ± 3.80% in MB to 37.20 ± 0.25% in FVJ) (
Table 8). However, in both biomasses, oleic and linoleic acid were the main FAs.
Singhasuwan et al. [
47] found higher proportions of palmitic acid C16:0 (from 20 to 24%) and linoleic acid C18:2 (from 45 to 51%), and a lower proportion of oleic acid C18:1 (from 22 to 24%), in the FA profile compared to our results, reporting that a longer period under nitrogen depletion conditions increased PUFA and decreased MUFA proportions. Sim et al. [
2], by contrast, found a very different profile from
C. protothecoides grown using different strategies, ranging from biomasses with more than 60% of C18:1 in heterotrophic growth, to biomasses with 28% of C16:3 and 57% of C183n6 in autotrophic growth. In addition, light intensity also affects the FA profile [
56], with C16 to C18 FAs increasing from 76.97% to 90.24% of total FAs under low-intensity light and the content of linolenic acid decreasing with a higher culture irradiance. Therefore, the growth system and medium can have a significant effect on the lipid profile ratio. From a nutritional point of view, a decrease in saturated FAs and an increase in MUFAs and PUFAs is of great interest [
57]. Specifically, PUFA intake is associated with several health benefits [
58].
The AA profile of proteins is an interesting determination used to evaluate the quality of a given protein. Essential amino acids (EAA) are those that our body cannot synthesize, and which we must therefore obtain through our diet. There are several studies in which AA profiles of different microalgae species are analysed [
48,
54]. A well-balanced AA profile in diet, rich in EAAs, has a great impact on health [
59]. Therefore, a reference protein with desired EAA (mg/g protein) quantities was established by the Food and Agriculture Organization (FAO/WHO) [
40] for human consumption. Those values are shown in
Table 9.
Regarding EAA content,
C. protothecoides biomass is poor in sulphur AAs, methionine and tyrosine. We may determine this if we compare the values obtained with the FAO/WHO pattern or even with reference proteins for human food and animal feed, such as egg or soybean meal (
Table 9). Overall, the total quantity of EAAs in
C. protothecoides was higher in MB (34.17 ± 0.37%) and similar in FVJ (27.10 ± 2.54%) media, as compared to the FAO/WHO reference (27.46% respect protein). Between biomasses, statistically significant (
p < 0.05) differences were found in valine and isoleucine, in which biomass grown in the MB medium had higher quantities compared to biomass grown in the FVJ medium. In the case of AAs, biomass grown only in the MB medium did not reach the reference values in the case of sulphur AAs. Regarding biomass grown in FVJ, an AAS of less than 1 was obtained in Val, Ile, Leu, Lys and sulphur AAs; therefore, protein quality would be lower than the reference and would require complementing with other proteins rich in the AAs in which
C. protothecoides biomass is deficient.
3.5. Biorefinery Scheme
3.5.1. Protein Extracts
Microalgae proteins are in general comparable to reference proteins. However, the recalcitrant cell wall is normally a great challenge which decreases the digestibility and, in some cases, the ability to utilise microalgae proteins. Therefore, the development of low-cost downstream processing for improving protein and AA availability is of great interest [
54].
After the cell rupture process, a soluble protein (precipitated by pH shift) was obtained. The initial protein concentration in the biomass was 42.93 ± 1.11% DM for MB and 42.69 ± 1.69% DM for FVJ. Conversely, after the disruption process, values of 43.73 ± 1.28% and 41.11 ± 4.55% DM were obtained in biomasses from MB and FVJ, respectively. Similar extraction yields were obtained in
C. protothecoides biomass by applying a lower-pressure treatment (150 MPa compared to the 250 MPa applied in our case), albeit one with more cycles (six cycles instead of three cycles) [
60]. They obtained a protein concentration of 46.1% from an initial biomass with 48.2% protein. Carullo et al. [
61], by contrast, achieved a lower extraction yield using UHPH (150 MPa, five passes) for the disruption of
Chlorella vulgaris biomass, obtaining the release of a 54.1% protein (approximately 33.0% DW biomass).
In the previous section, we analysed the EAA composition of
C. protothecoides biomasses grown in the MB and FVJ media. In the biorefinery scheme, we could compare the EAA profile of the proteins before and after UHPH treatment. Regarding EAA content, there was not a statistically significant (
p > 0.05) difference for protein concentrated from the MB medium biomass compared to the biomass prior to the concentration step. However, an increasing trend was found in the AAS, resulting in higher values being obtained after the UHPH process. In the case of the FVJ medium, statistically significantly (
p < 0.05) higher values were found in the concentrated extract compared to the biomass before the concentration step. Higher values were found in the case of valine and leucine. Regarding the AAS values, after the UHPH process FVJ biomass scored higher than one in nearly all cases, except for sulphur AAs and isoleucine (
Table 9). Kumar et al. [
54] compared the EAA of several microalgae proteins. The highest EAA contents were found in
Astrospira platensis, (44.9%),
Chlorella vulgaris (40%),
Dunaliella bardawill (44%),
Nanochloropsis granulate (52.4%)
Nanochloropsis oculata (42.2%),
Tretaselmis suecica (41.4%),
Porphyridium aerugineum (55.3%),
Phaedodactylum tricornutum (41.3%) and
Pavlova salina (40.7%). Lower values were found in the
C. protothecoides biomass grown in the FVJ and MB media (
Table 9). However, concentration methods improved their profiles, making them similar to those mentioned above.
3.5.2. Residual Biomass
Residual biomasses were also assessed as being possible sources of valuable compounds such as proteins (33.26 ± 6.39% in MB and 28.82 ± 0.69% in FVJ), lipids (13.13 ± 1.33% in MB and 10.88 ± 2.80% in FVJ), and pigments.
Regarding total carotenoid content (
Table 10), biomass grown in the FVJ medium presented higher concentrations than biomass grown in the MB medium. However, both contents were low when compared with the total content of biomasses of
C. protothecoides grown in autotrophic conditions (about 8 mg g
−1) due to the drastic reduction in chlorophyll production in heterotrophic growth [
62]. Nevertheless, these data were related to the whole biomass, as no references were found about the content of carotenoids in the residual biomass after protein extraction. It is therefore expected that some pigments deteriorated or were lost during the disruption procedure.
In general, a low content of pigments is shown in both types of residual biomasses; this is probably due to the use of processing procedures that degrade pigments (
Table 10). Lutein is the main pigment found in pellets, especially in the case of those obtained from biomasses grown in the FVJ medium. These pellets represent around 0.20 mg g DM
−1 of lutein, similar to the concentration obtained from marigold flower (0.19 mg g DM
−1), the latter being the current source of this pigment. Nevertheless, this content is still lower than the maximum concentration reported by Shi et al. This was obtained [
63] through the direct extraction of
C. protothecoides biomasses grown in fermenters, which reached 4.4 mg g DM
−1. Further optimisation of the extraction conditions and yields is therefore needed to increase productivity, although these data show that the growth of
C. protothecoides in the FVJ medium seems to boost lutein production in comparison to the synthetic medium (MB).
An additional interesting application of the obtained residual biomass is its potential use as a source of antimicrobial agents. The antimicrobial capacity of an ingredient could be related to different molecules. In the case of microalgae, linoleic acid, oleic acid, docosahexaenoic acid (DHA) and eicosapentaenoic acid (EPA) [
64], as well as saturated fatty acids, unsaturated fatty acids, long-chain alcohols, glycides, and glycerols [
65], were found to be antimicrobial agents in
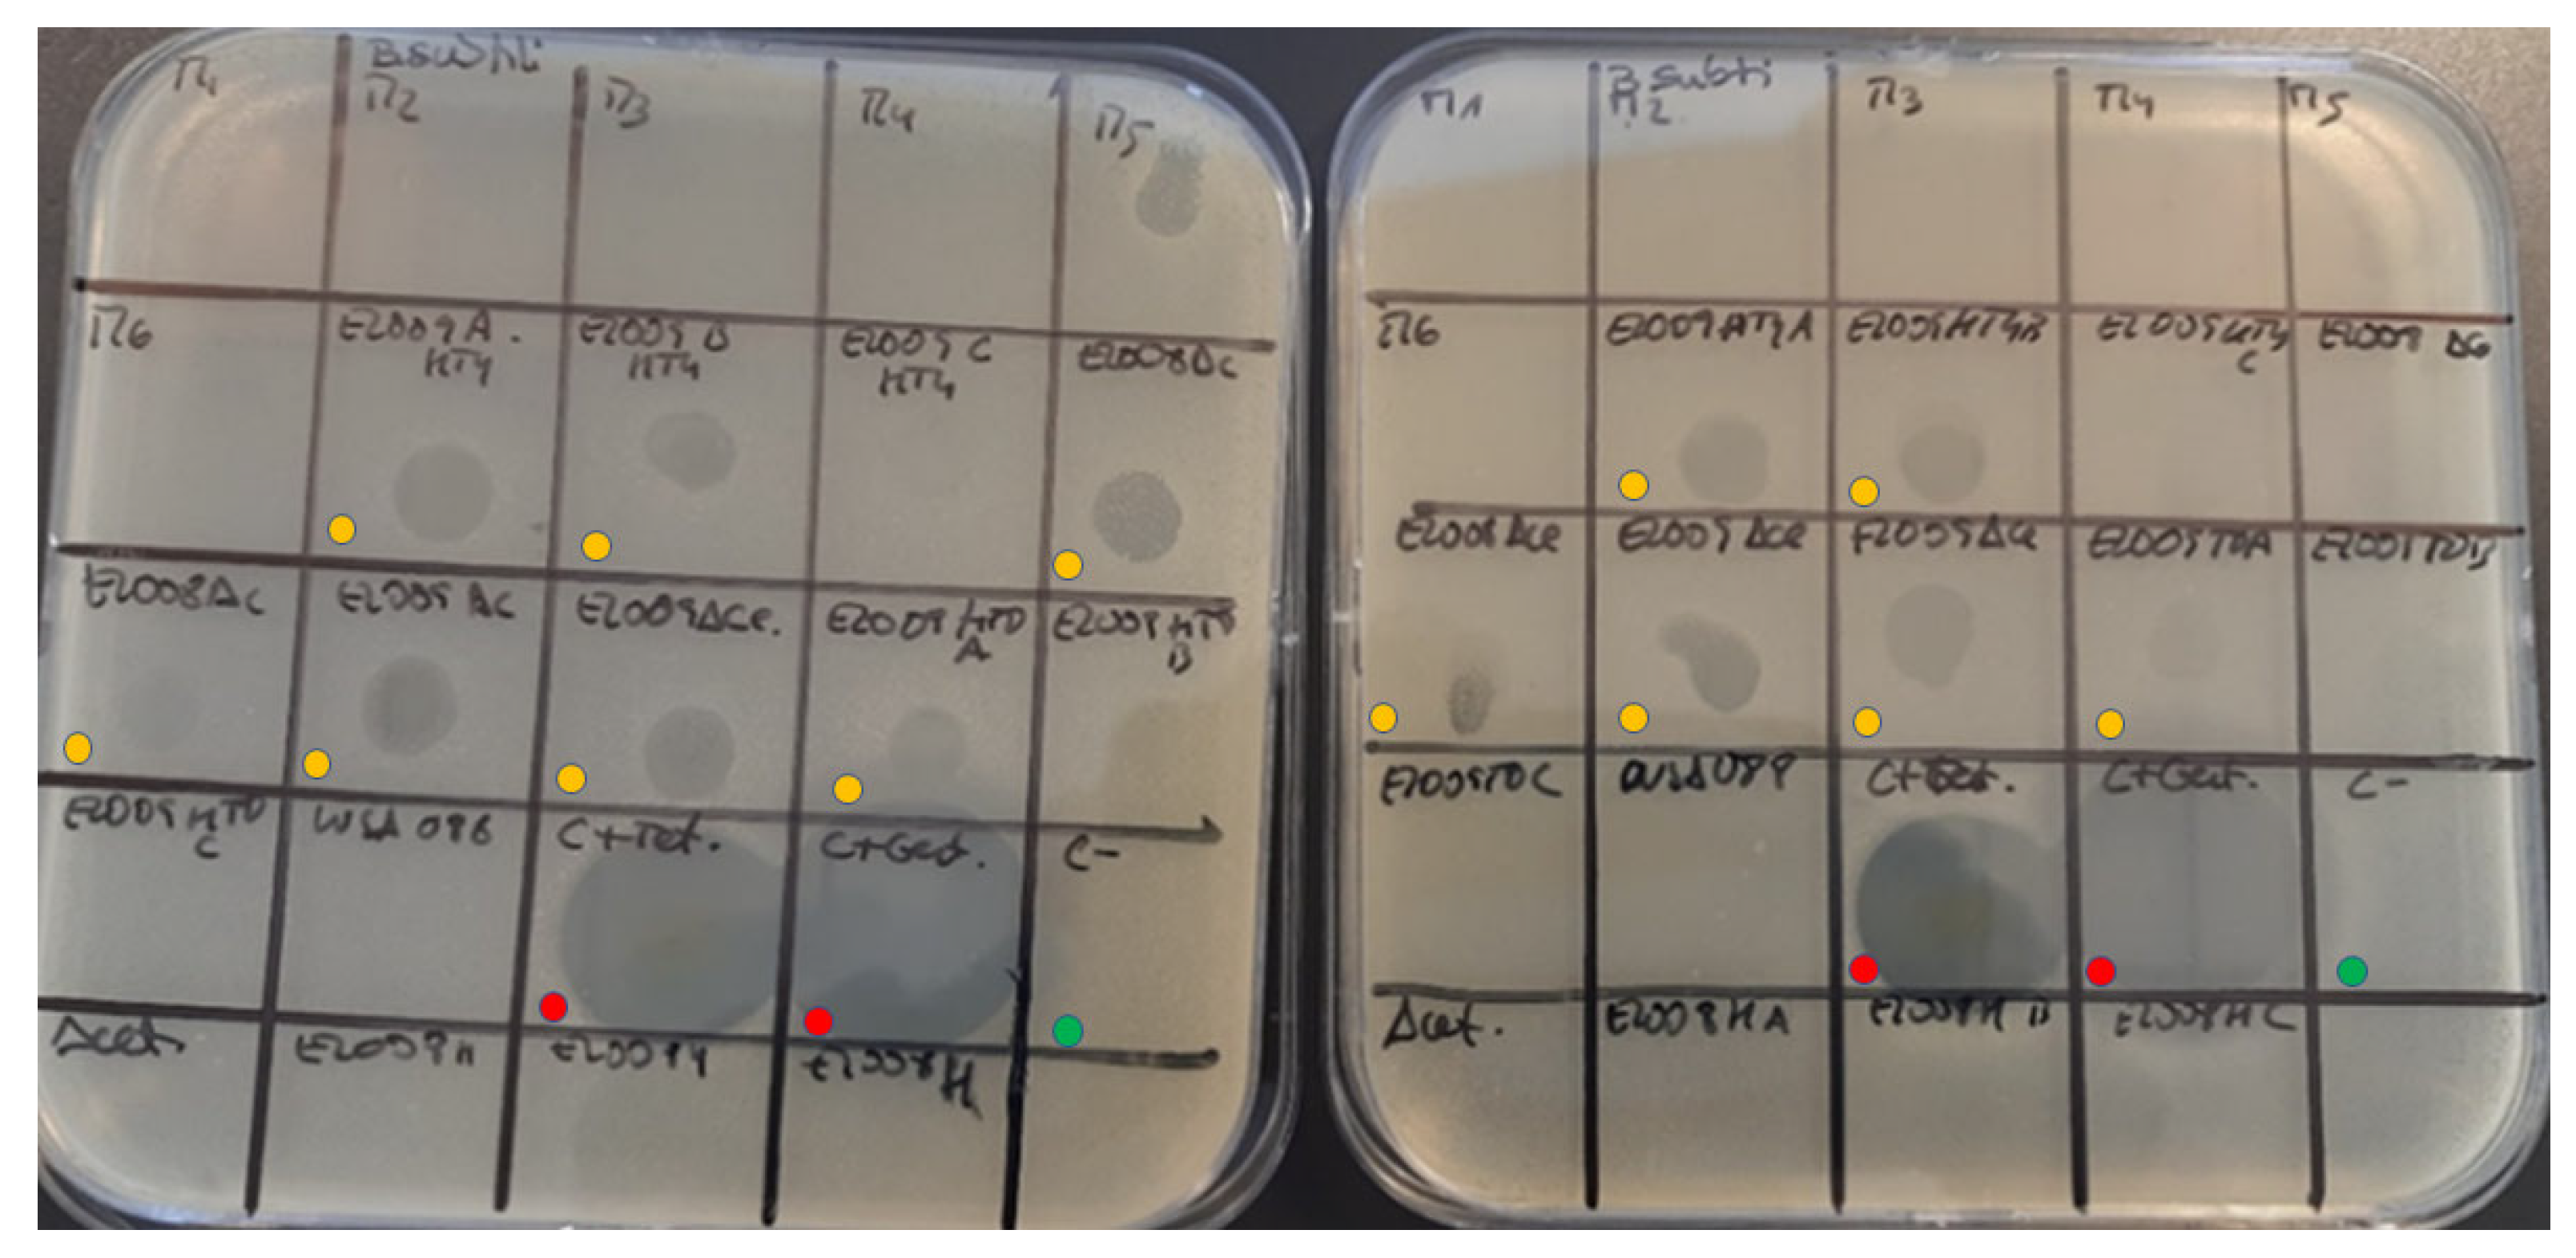
Chlorella vulgaris strains. In the present research, acetone extracts of the residual biomasses with 13.86 ± 0.20% and 10.43 ± 0.07% of solids, in the MB and FVJ media, respectively, showed a broad antimicrobial activity spectrum against
Staphylococcus aureus,
Bacillus subtilis,
Aeromonas salmonicida and
E.coli (
Figure 5). Alsenani, et al. [
64] found that the extraction method and solvent both had significant effects on the antimicrobial activity of the obtained extracts.
Chlorella sp. extracts presented inhibition against
Listeria monocytogenes (ATCC 7644),
Staphylococcus aureus (ATCC 25925 and ATCC 9144),
Bacillus subtilis (ATCC 6633 and ATCC 6051),
Clavibacter michiganensis,
Staphylococcus epidermidis and
Enterococcus faecalis. In general, Gram-positive bacteria are more susceptible and less resistant to antibiotics than Gram-negative bacteria, which is mainly due to the difference in the structure of their cell walls [
66]. However, in the present study,
C. protothecoides extracts had a positive antimicrobial effect against
Aeromonas salmonicida and
E.coli, which are Gram-negative bacteria. Shaima et al. [
67] also discovered antimicrobial activity of
Chlorella sp. methanol extracts against methicillin-resistant
S. aureus,
Staphylococcus epidermidis,
B. thuringiensis,
Pseudomonas aeruginosa,
E. coli and two clinical strains of
Bacillus subtilis.
These preliminary results indicate the potential use of microalgae and their antimicrobial compounds as biocontrol agents against food and plant pathogens, as well as their capacity to provide immunostimulant benefits that prevent disease and thus reduce the use of antibiotics in animal feeding. However, more comprehensive studies regarding the characterisation of the extracts are required, and the minimum inhibitory concentration (MIC) for bacterial growth inhibition should be calculated.
4. Conclusions
This study proposed a biorefinery scheme based on the cultivation of C. protothecoides as a highly productive microalgae strain that easily adapts to heterotrophic growth, making use of food industry by-products as alternative sources of nutrients. This scheme allowed us to produce biomass at high density levels, analogous to those obtained in synthetic media and with interesting protein content. Besides that, the process also allowed us to valorise some residual fractions from the food industry, obtaining added-value products and reducing the treatment costs associated with the management of these products as waste.
The results of the fine-tuning of the feeding procedures and control of the main parameters improved both the biomass (30–40 g DM L−1) and protein concentration (>40%), meaning that these results already will allow the subsequent scaling up of the process for its possible industrial implementation. The microalgae biomasses obtained had good nutritional properties for their use in both animal feed and human food, with very interesting FA and EAA profiles. In addition, the application of UHPH for cell disruption and further protein concentration improved the AA profile of microalgae grown in the FVJ medium, resulting in higher values than those obtained by the FAO. This process also allowed us to obtain residual biomasses which present antimicrobial properties and, in the case of the biomass obtained from FVJ, have potential uses as sources of lutein.
These results open the possibility of using expired fruit and vegetable juices for the production of C. protothecoides in a heterotrophic regimen. Additionally, they suggest it may be possible to use the derived products in such sectors as food and feed, as well as in the nutraceutical or cosmetics industries. In any case, more exhaustive analysis and complementary studies are required to better determine the applicability of the different products and to define the desired composition of the medium in order to direct the process towards the targeted final compounds. This would permit the validation of the process at the pilot scale and the development of a cost-effective analysis.


