Article

Feasible Utilization of Waste Limestone as a Calcium Source for Microbially Induced Carbonate Precipitation (MICP)

1
Key Laboratory of Forestry Genetics and Biotechnology of Chinese Ministry of Education, Nanjing Forestry University, Nanjing 210037, China
2
College of Chemical Engineering, Nanjing Forestry University, Nanjing 210037, China
3
Deep Earth Energy Research Lab, Department of Civil Engineering, Monash University, Melbourne, VIC 3800, Australia
4
Hangzhou Global Scientific and Technological Innovation Center, Zhejiang University, Hangzhou 311215, China
5
College of Chemical and Biological Engineering, Zhejiang University, Hangzhou 310027, China
6
School of Mathematical Science, Faculty of Science, Queensland University of Technology, Brisbane, QLD 4000, Australia
*
Authors to whom correspondence should be addressed.
Fermentation 2023, 9(3), 307; https://doi.org/10.3390/fermentation9030307
Submission received: 23 February 2023 / Revised: 18 March 2023 / Accepted: 20 March 2023 / Published: 21 March 2023

Abstract

:
Microbial-induced CaCO3 precipitation (MICP) is an innovative and rapidly developing technology for sand solidification. The idea for this research project was built based on the concept of sustainable development and environmental protection. The specific material used for solidification was soluble calcium ions generated by the reaction of limestone waste, a kind of calcium-rich industrial waste from a quarry, and acetic acid. Using Ca(CH3COO)2 (prepared from limestone waste) as a calcium source resulted in a 31.87% lower MICP cost compared to using CaCl2. An unconfined compressive strength (UCS) test was conducted to characterize the macroscopic mechanical properties of bio-cured sand columns. The mineral composition and the microstructure of sand columns were examined by using X-ray diffraction (XRD) and environmental scanning electron microscopy (ESEM). After response surface optimization, the optimal conditions for the reaction of limestone and CH3COOH were determined, and the calcium acetate yield was up to 96.81%. The UCS of sand samples treated with limestone/acetic acid was 10.61% higher than that of samples treated with calcium chloride. This research confirmed the feasibility of cheap limestone waste and soluble calcium ions generated by acetic acid as a calcium source, instead of calcium chloride, for solidifying sand columns in the MICP process.

Graphical Abstract

1. Introduction

Desertification, as one of the most major social and environmental problems in the world, not only brings severe challenges to the security of the ecological environment but also restricts the sustainable development of the national economy and affects social stability [1,2]. According to the assessment of global desertification by the United Nations Environment Program (UNEP), approximately two-thirds of the world’s countries and regions are adversely affected by varying degrees of desertification. The annual direct economic losses are estimated to be greater than $USD 400 trillion [3]. Desertification is one of the most pressing environmental issues facing China [4]. Most of the regions affected by desertification in China are located in arid, semi-arid, and semi-humid areas in the north. The ecological environment in these areas is fragile, and the combination of an arid climate and irrational human activities has led to serious desertification [5]. If sand could be used in a more effective way, it would result in a reduction in construction costs, as well as an improvement in the ecological environment [6,7,8].
In the field of geotechnical engineering, there are two main soil improvement methods: mechanical compaction and chemical grouting. Mechanical compaction requires large mechanical equipment with a high cost, so it is suitable for large-scale construction. In addition, the powerful shock waves generated in the construction process destroy the original soil structure, and the exhaust gas generated when the diesel used in the equipment is burned also causes damage to the environment [7,9,10]. On the other hand, the chemical grouting method increases the mechanical strength of the soil by adding organic polymers such as epoxy, polyester fiber, polycarboxylate, and sodium silicate [11,12,13,14,15,16]. However, most of the materials used in the chemical grouting method are synthetic and toxic and are not conducive to ecologically sustainable development [17]. Conversely, MICP is a kind of calcium-carbonate-precipitated solidified sand prepared using a biological method. Its preparation process is green, protects the environment, and has broad industrial application and development prospects.
MICP, a biological mineralization process that is prevalent in nature [18], slowly cements loose mineral debris in the environment to form rocks through microbial growth and metabolism. MICP has different pathways to produce calcium carbonate, depending on the types of microbial species [19], among which urea hydrolysis is the most common. By adding a bacterial liquid containing urease and a cementing fluid containing calcium ions and urea to loose sand, calcium carbonate crystals are induced to form between sand particles by the mineralization of microorganisms, thus cementing sand soil [20]. Because of its simple process, low energy consumption, and environmental friendliness, MICP technology is regarded as the most promising soil improvement technology [21,22,23]. In addition, it also has great potential for improving the performance of recycled aggregate, repairing concrete cracks, and removing heavy metal ions [24,25,26,27,28,29,30,31].
On the one hand, because of the heavy usage of calcium ions during the implementation of MICP, a chemical analysis of calcium is usually conducted in the current studies, with CaCl2 usually used as the calcium source [32]. However, the chemical analysis of calcium is usually expensive, and the chloride ions produced during MICP are also corrosive to a certain degree [33]. Therefore, the sources of calcium in MICP have been explored. Zhang et al. [34] compared and analyzed the grouting effects of three calcium sources and found that calcium acetate showed a better curing effect than the others. Cheng et al. [35] put forward a new idea in this regard: sand columns with good strength can be obtained using seawater for sand fixation when the scour times are sufficient. Choi et al. [33] used calcium ions obtained by dissolving eggshells with vinegar as a calcium source and measured values of unconfined compressive strength (UCS) up to 400 KPa. In addition, other calcium-rich materials such as various shells, limestone, bone meal, and steel slag were also used as calcium sources [36,37,38,39,40,41]. In previous studies, researchers did not systematically study the yield of calcium acetate. They only directly applied the calcium acetate generated by the reaction of an acid with calcium-containing substances to the MICP process [33,36]. Limestone is a common nonmetallic mineral that is widely distributed in nature and easy to obtain. China’s limestone distribution area accounts for about 5% of China’s territory, and its limestone reserves account for more than 64% of the world’s total reserves. Cheng et al. [42] and Choi et al. [36] verified the feasibility of MICP sand consolidation with limestone powder as the calcium source through mechanical and microstructure analyses. Cheng et al. [42] measured that the UCS of a sand sample prepared with limestone powder as the calcium source was about 4 MPa, which met the requirements of foundation treatment for engineering construction, and UCS was 60.64% higher than that of a sand sample prepared with the calcium chloride as a calcium source. Hence, calcium-rich industrial waste may be a promising calcium source, but there is still a lack of systematic research on this possibility. To adjust this research gap, we conducted in-depth and systematic research on this issue and verified the practical application of calcium-containing waste as the MICP calcium source, which has important theoretical guiding significance for reducing the cost of raw MICP materials [43,44].
On the other hand, NH3 is released in the MICP process, so reducing the emission of NH3 would improve the practicability of MICP and achieve green production [38,45]. Yu et al. [46] proposed that microbially induced struvite precipitation (MISP) could also reduce NH3 emissions and that its intensity could meet the engineering requirements. Mohsenzadeh et al. [47] proposed a green and sustainable method for recycling ammonium into struvite through a two-stage treatment process, but this method may not work for all soils and can add some cost. Keykha et al. [48] used natural zeolite to prepare ammonia-free carbonate for a curing test. CaCO3 crystals (calcite) were evenly distributed in the soil samples, and the UCS values of the samples were enhanced. Xiang et al. [49] pointed out that since NH3 can react with acetic acid to generate ammonium acetate and solidify in cement, calcium acetate as a calcium source can dramatically lower NH3 emissions.
The purpose of this study is to consolidate loose sandy soil by using urease produced by Sporosarcina pasteurii for biomineralization precipitation, which is a fermentation process. The mechanical properties of the sand column were evaluated by dry density, permeability coefficient, calcium carbonate content, and UCS, using calcium acetate prepared from low-priced limestone waste as a calcium source. The mineral composition and the microstructure of the sand columns were using X-ray diffraction (XRD) and environmental scanning electron microscopy (ESEM) and were compared with sand columns treated with the same concentration of calcium chloride.

2. Materials and Methods

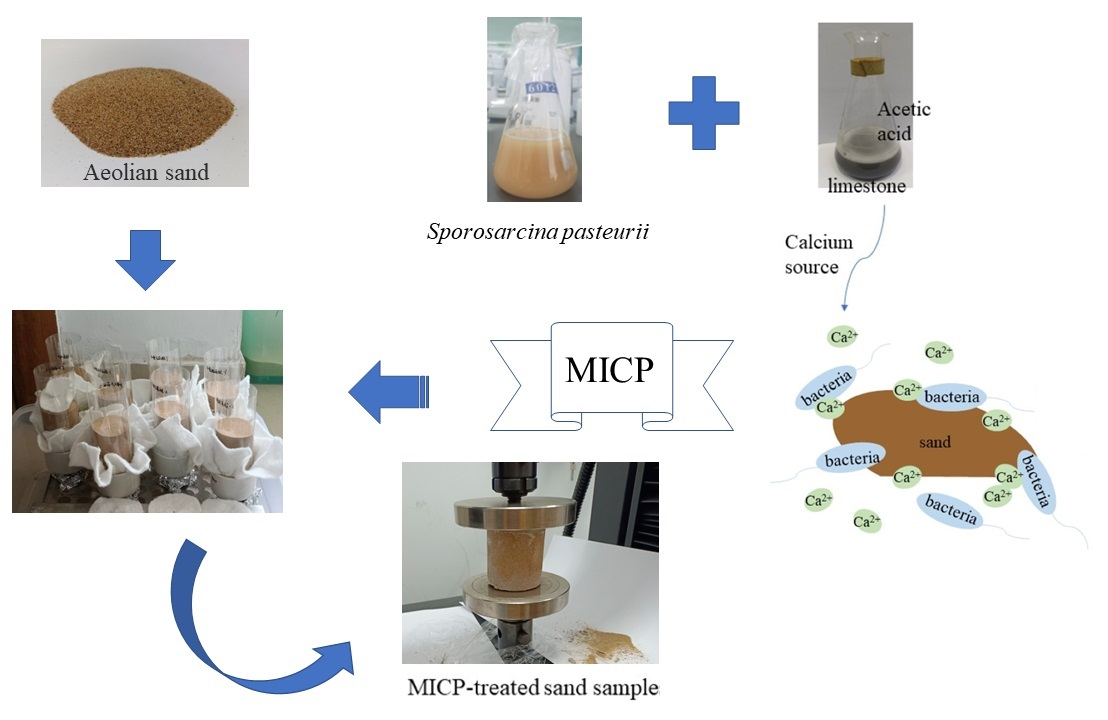
2.1. Preparation of Bacteria Solution

Sporosarcina pasteurii (ATCC 11859) was selected to be the urease-producing bacterium in this study and was purchased from Shanghai Huzheng Biotechnology Co., Ltd. (Shanghai, China). Different from the previously used NH4-YE medium, this bacterium was cultured in an activated medium (pH 7.3) consisting of 5 g/L peptone from soya, 15 g/L casein peptone, 5 g/L NaCl, and 20 g/L urea for 24 h [50,51]. Then, the precipitate obtained after 5 min of centrifugation at 8000 rpm/min was added to a fermentation medium (pH 8.0) consisting of 15 g/L peptone from soya, 30 g/L corn pulp powder, 3 g/L NaH2PO4, and 10 g/L urea for 48 h [52]. Centrifugation was carried out under the same conditions, and the bacterial weight was added to the fermentation medium for the re-suspension of bacteria, which did not contain corn pulp powder. As a low-cost industrial by-product, corn pulp powder has a high nutrient content. Its high protein content gives the bacteria a higher urease activity, and it is more suitable for the growth of the bacteria used in the MICP process than yeast extract [53,54]. Chen et al. [52] found that in this fresh substrate, the activity of bacterial urease may enhance by 24.21 percent, and the culture medium price was down by 50.5 percent. In addition, the UCS of the sand solidified by MICP with the bacteria cultured in this medium was increased by 21.32 percent. All media should be autoclaved before inoculation (sterilization at 121 °C for 15 min). The cultures were aerobically cultured in a shaking flask at 30 °C with a speed of 200 rpm. The cell concentration was obtained by measuring the optical density at 600 nm (OD600).

2.2. Preparation of Cementing Fluid

The cementing fluid was a mixture of calcium salts and urea. The calcium source used in this work was a limestone powder from a quarry, which was cleaned and dried to screen out a particle size of about 0.282 mm (50 mesh). Limestone is mainly composed of calcium carbonate, with small amounts of aluminum, silicon, iron, magnesium, and other minerals [36,55]. Xu et al. [56] found that the addition of magnesium ions, Ca(CH3COO)2, and urea to MICP samples inhibited the formation of rhomboid calcite, and the presence of magnesium ions increased the UCS values of samples by 40–200%. Lv et al. [57] also found that adding a small amount of magnesium ions (0.05 M) in cementation was beneficial to the improvement of the mechanical properties of MICP-treated samples. Acetic acid was added to dissolve the calcium and was shaken in a water bath for 3 h before filtration, and the calcium acetate obtained after drying the solution was collected for subsequent tests. Since calcium chloride has always been considered the first-rate calcium source for MICP, the two calcium sources were compared in this work. As the concentration and pH of the cementing solution affect its curing effect, the calcium carbonate production was taken as an indicator, and urea and calcium ion solutions with different concentrations and pH values were added for small centrifuge tube tests. The molar concentration ratio of the calcium ion solution and the urea solution was finally determined to be 1:2.6, and the volume ratio was 1:1. During filling, the two solutions were evenly mixed, and the pH was adjusted to 8.1.

2.3. Preparation of Calcium Acetate

2.3.1. Single-Factor Test

The control variable method was used to investigate the effects of different factors on the calcium acetate yield. On the basis of this study, the reaction process of acetic acid and limestone was mainly affected by the concentration and dosage of acid. Therefore, this experiment determined the optimal dosage of each factor by changing the reaction temperature (25, 35, 45, 55, and 65 °C), solid-liquid ratio (1:8, 1:10, 1:12, 1:14, and 1:16), and acetic acid dosage (100%, 120%, 140%, 160%, and 180%) in turn.

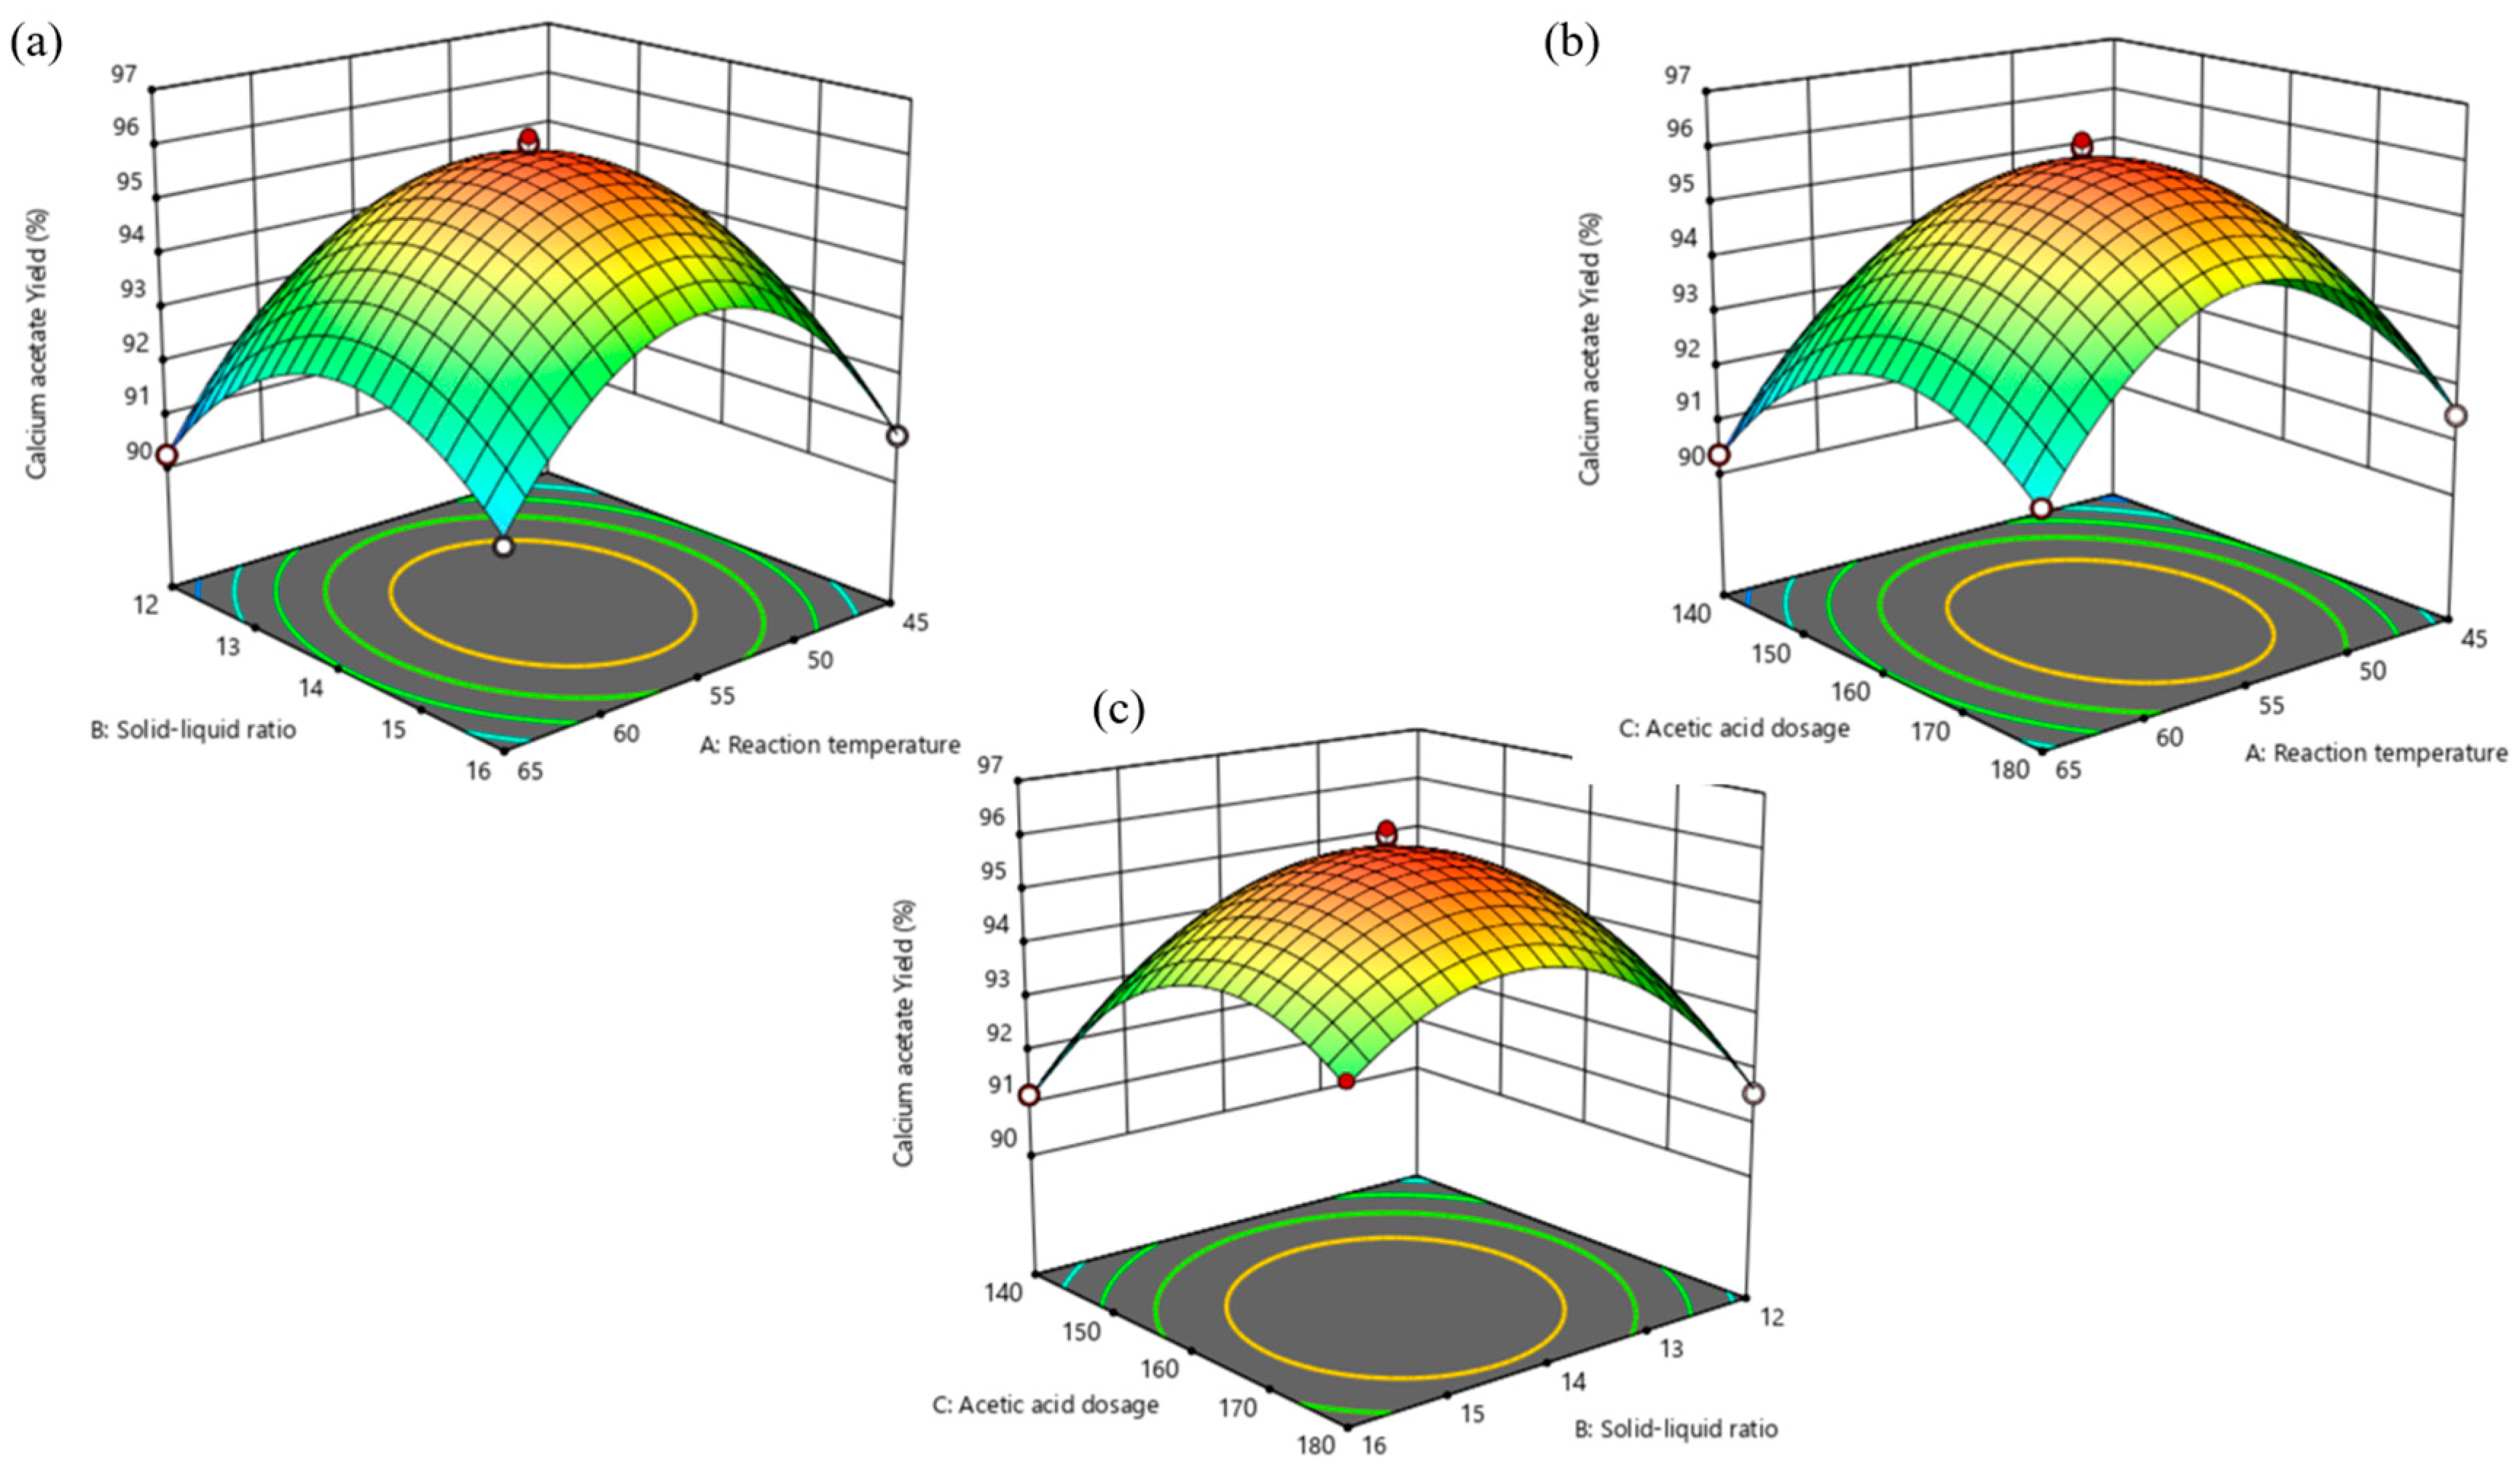
2.3.2. Response Surface Methodology to Optimize the Calcium Acetate Yield

All statistical analyses were performed using Design Expert 11 software. Design Expert 11 is a very practical response surface analysis software that is mainly used for experimental-design-related aspects; this software can make breakthrough improvements to products or processes.
The optimal selection interval of influencing factors was determined with a single-factor experiment. Taking the reaction temperature (A), the solid-liquid ratio (B), and the acetic acid dosage (C) as factors, the codes −1, 0, and 1 represented the experimental levels of their respective variables, in which −1 represented the low-level parameters, 0 was the center point, 1 represented the high-level parameters, and the yield of calcium acetate was the evaluation index. RSM was used to carry out the experiment (three factors and three levels), with a total of 17 groups of samples. The specific parameters are listed in Table 1.

2.3.3. Date Processing

In the single-factor experiment, each group of experiments was repeated 3 times, and the final result was expressed as an average. The test data were analyzed and mapped by Origin 2021 and Excel 2019, and the response surface test results were analyzed by Design-Expert 11. In order to evaluate the accuracy and reliability of the quadratic response surface regression model, analysis of variance (ANOVA) was proposed to examine the significance of the source of model error [58], with p < 0.05 as the significance test standard.

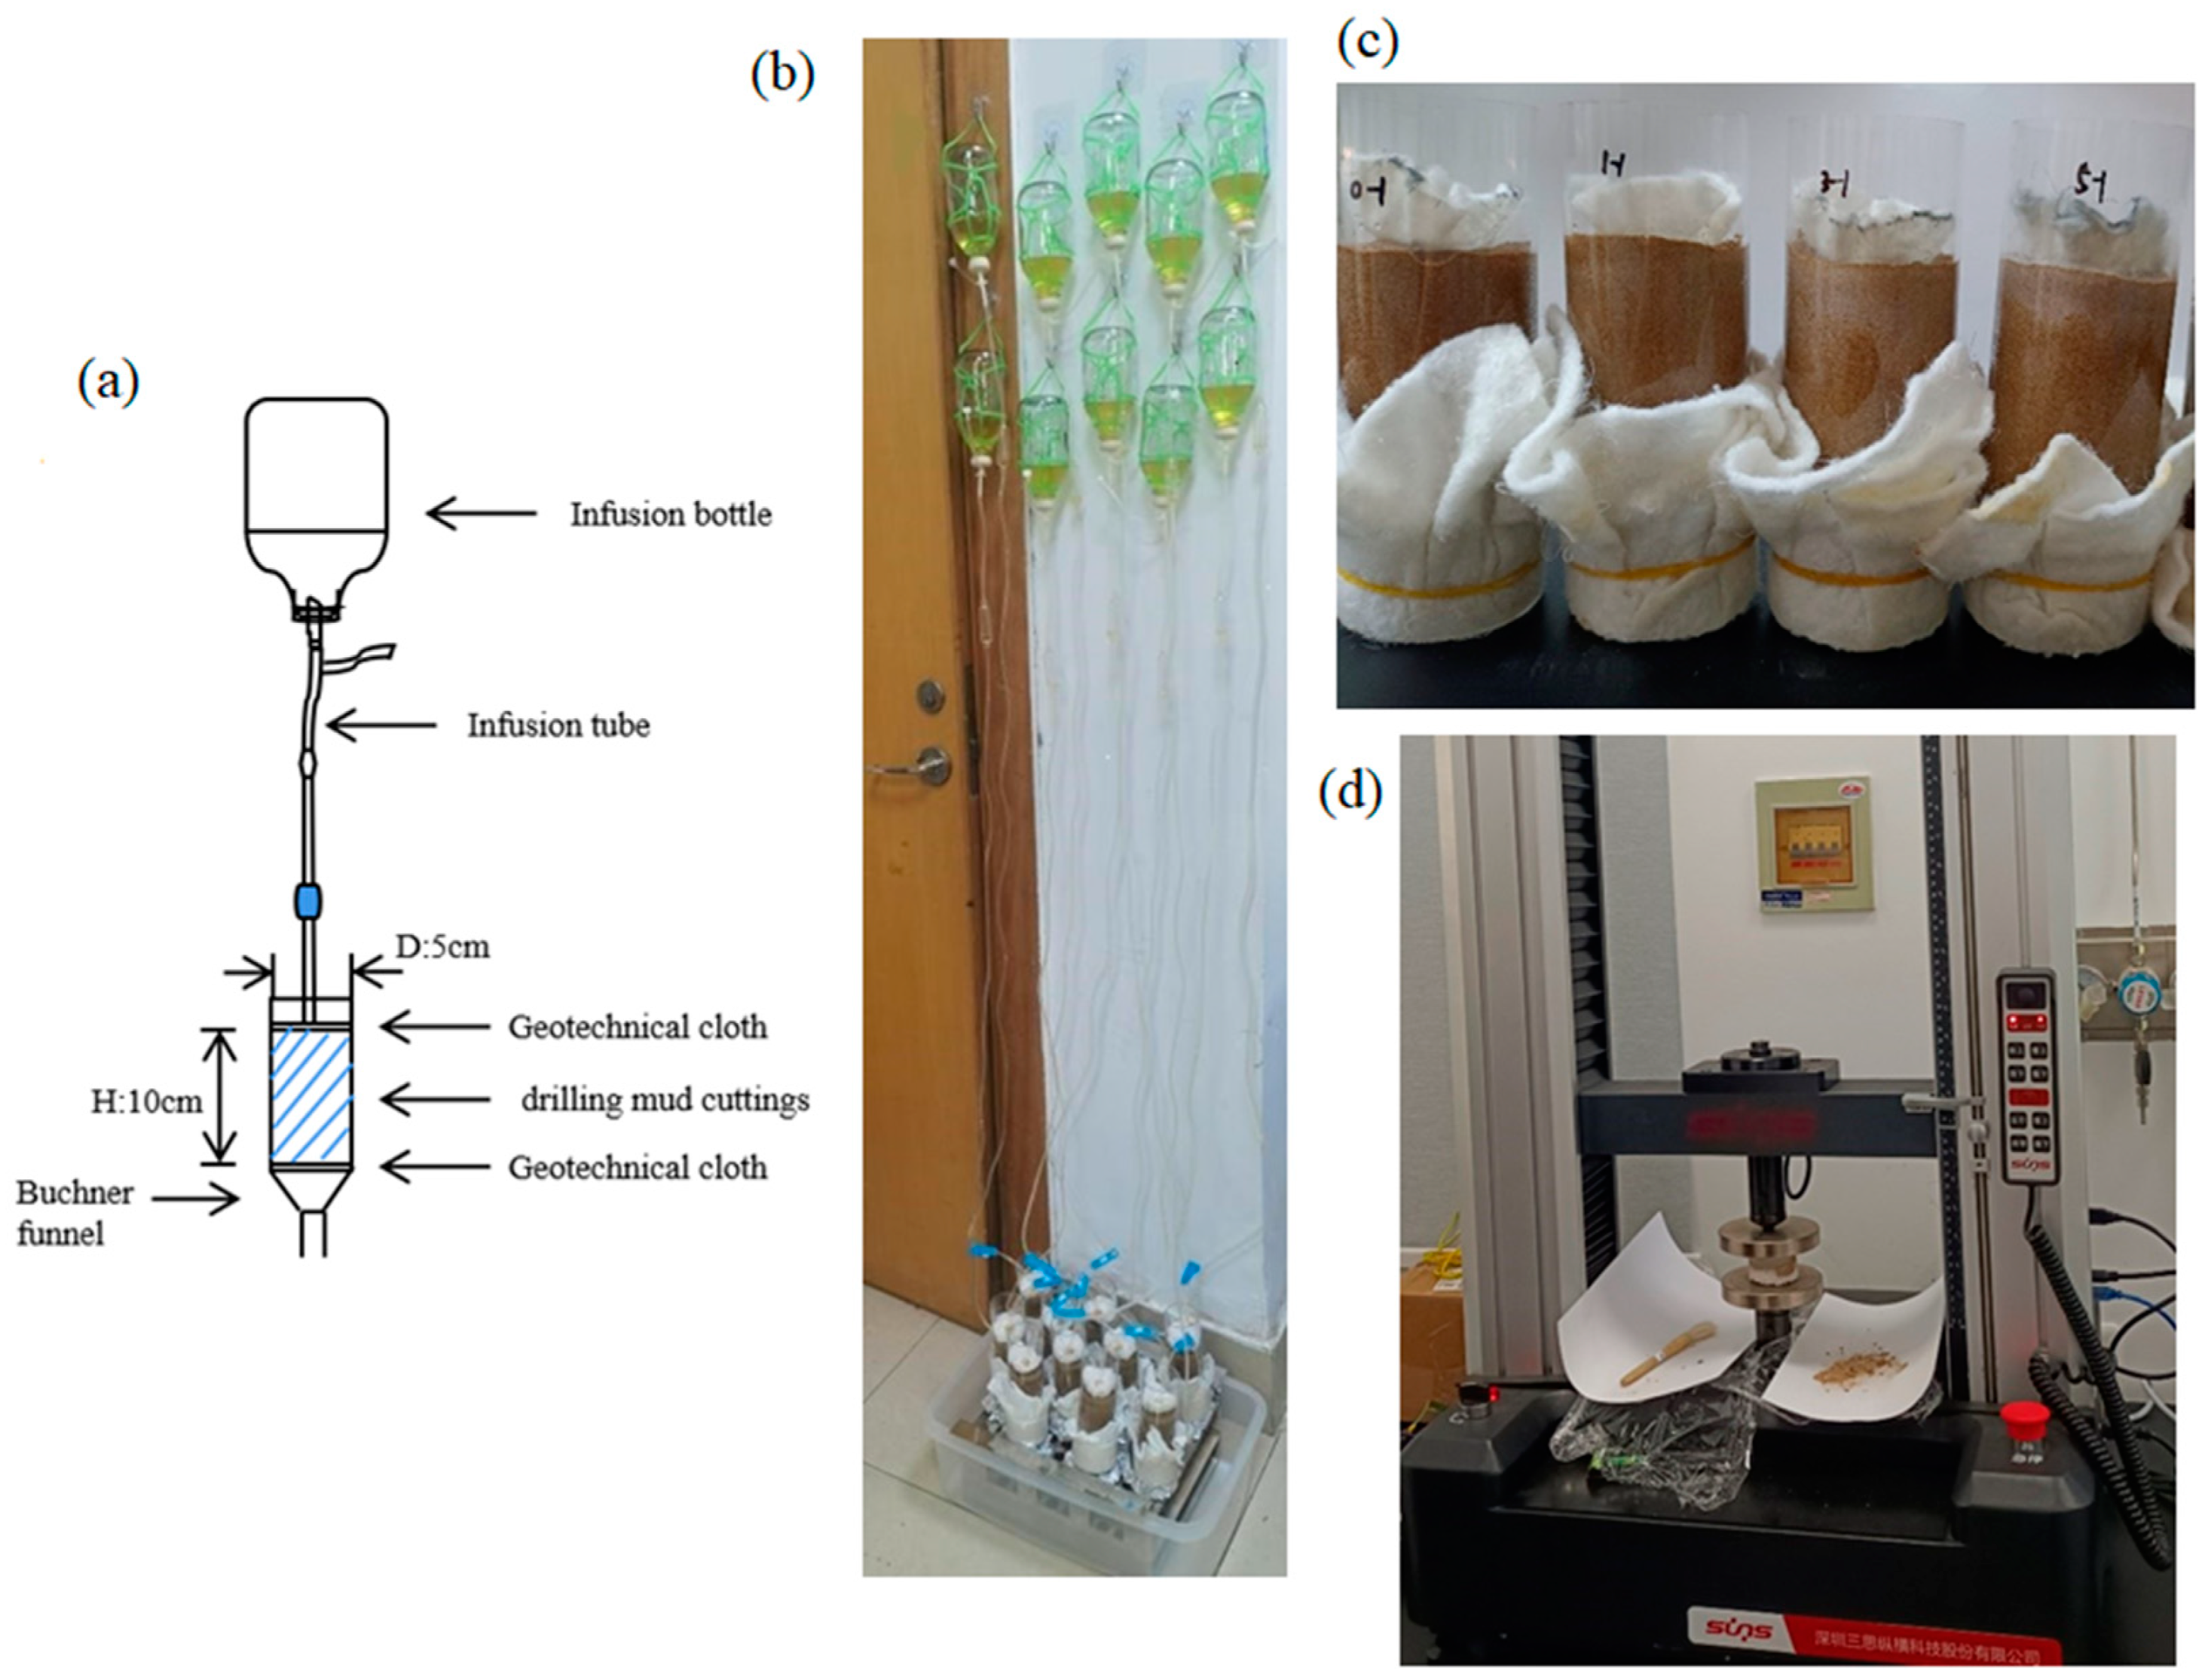
2.4. Preparation of MICP-Treated Sand Columns

A PVC mold with a diameter of D = 50 mm and a height of H = 150 mm was used to prepare sand samples in this test. The sand samples were eolian sand from the Tengger Desert in Gansu, with particle sizes ranging from 0.106 (80 mesh) to 0.178 mm (150 mesh). The height of the sand columns was about 80 mm. The device is shown in Figure 1a,b. The specific steps were as follows: First, we slowly added 10 mL of bacterial liquid. The concentration of the bacterial liquid (OD600) was about 5.9, and the urease activity was about 95 mM urea/min. The flow rate of the addition needed to be less than the maximum osmotic volume. Then, we let the sample stand for half an hour after the completion of dripping. Next, we added 90 mL of cementing fluid, request as above. A sand column could be effectively consolidated after repeating it six times (Figure 1c).

2.5. Mechanical Test Procedure of MICP-Treated Sand Column

2.5.1. Dry Density

A sand column treated with MICP was immersed in distilled water for 24 h. After drying and demolding, the two ends were polished smooth. The quality (M, g), height (L, cm), and diameter (D, cm) of the samples were recorded, and the dry density (ρ, g/cm3) was determined according to Formula (1).
ρ = 4 M π LD 2

2.5.2. Permeability

The permeability coefficient of the sand column was measured by the variable water level method [59]. The specific methods are as follows: The sand column is placed in the penetrant container. When the water level reaches a certain height, the water stop clip is opened so that the water passes through the sample from bottom to top. When the water on the top of the sample overflows, record the head height of the water pipe at the beginning and the time currently, and take a certain time interval to record the head height of the water pipe at the end. The permeability coefficient of the sand sample is calculated according to Formula (2).
K = 2.3 aL A Δ t lg h 0 h 1
where K is the permeability coefficient of the sand sample, cm/s; a is the cross-sectional area of the water pipe, cm2; L is the height of the sand sample, cm; A is the cross-sectional area of the sand sample, cm2; Delta t is the time interval, s; h0 and h1 are the beginning and ending head heights respectively, cm.

2.5.3. UCS

The UCS test was performed using an electronic universal testing machine, UTM6503 (Figure 1d), in accordance with the ASTM D4219 [60]. The loading rate of UTM6503 was set to 1 mm/min. All tests are triplicate, and the results are shown as averages. The crushed samples were collected for calcium carbonate content determination and microstructure analysis.

2.5.4. The Content of Calcium Carbonate

The content of CaCO3 in the sand column was determined according to ASTM D4373 [61]. Specific operations are as follows: First, the electronic universal testing machine UTM6503 broken soil sample is put into the oven to dry until its weight is constant, then ground into powder. Then the W1 weight of the soil sample powder is measured and then reacted with the hydrochloric acid standard solution. The reaction process is stirred appropriately. When there are no bubbles in the reaction, the reaction is judged to be over. The reaction soil sample was cleaned with deionized water, filtered, and dried, and the mass W2 of the reaction soil sample was obtained. The weight of calcium carbonate is the difference between W1 and W2.

2.5.5. Microstructure Analysis

XRD was used to analyze the mineral phase components of the samples. The scanning range (2θ) was 20–70°, and the step length was 0.02°/step. MDI Jade 6 software was used to analyze the XRD patterns of the test samples to determine the crystal types contained in the solidified sand sample block.
The size, morphology, and distribution of calcium carbonate precipitates in microbial solidified sand samples were observed by ESEM. The dried sample was polished into a cube of 10 × 10 × 5 mm, then ensured the surface to be tested was smooth before the gold spraying treatment was performed.

3. Results and Discussion

3.1. Optimization of Calcium Acetate Yield

3.1.1. Single-Factor Analysis

Limestone was used as a raw material to explore the effects of the reaction temperature (25, 35, 45, 55, and 65 °C), solid-liquid ratio (1:8, 1:10, 1:12, 1:14, and 1:16), and acetic acid dosage (100%, 120%, 140%, 160%, and 180%) on the calcium acetate yield. There was an obvious association. As shown in Figure 2a, the calcium acetate yield was the highest when the reaction temperature reached 55 °C. With the increase in the reaction temperature, the calcium acetate yield showed a trend of an inverted U curve. The reason might be that a low temperature caused an inadequate reaction and a high temperature accelerated evaporation, resulting in a loss of acetic acid and water, or that a high temperature caused product degradation. Figure 2b demonstrates that the calcium acetate had the highest yield at the solid-liquid ratio of 1:14. If the solid-liquid ratio was too small, it was difficult for the limestone to fully react with the acetic acid, which was not conducive to the formation of calcium acetate. If the solid-liquid ratio was too large, then the ratio not only prolonged the later concentration time and increased the energy consumption but also caused a large loss of calcium acetate in the crystallization filtration process and reduced the calcium acetate yield. Figure 2c indicates that when the dosage of acetic acid was 160%, the calcium acetate yield was the highest. In the reaction process, part of the acetic acid was hydrolyzed, and some was volatilized. If the amount of acetic acid was small, the reaction did not finish, and the yield was reduced. An excessive amount of acetic acid not only wasted raw materials and caused acid pollution but also increased the difficulty of the subsequent treatment.

3.1.2. Optimization Using Response Surface Methodology

In this research, optimization of the operating parameters was performed using response surface methodology (RSM), which has not been used before. In a general way, optimization is performed by controlling for the effect of a particular factor on the experimental effect. Although one parameter with significant effects is changed, the other parameters are kept constant at conventional levels. RSM is an effective method to deal with multivariable problems that are based on a mathematical statistics analysis and were originally applied in the field of production and processing. RSM has the advantages of a strong generalization ability and high prediction accuracy and is the most widely used test optimization method in China and overseas [62]. Recently, the combination of RSM and the Design of Experiment (DOE) has been recognized as an effective statistical design method [63]. A rational experimental design method is adopted to extract certain experimental data, and multiple quadratic regression equations are constructed to fit factors and response values. A continuously varying surface model is established, the elements and interactions that affect the test are comprehensively assessed, and the optimal horizontal range is determined. RSM can be expressed as follows:
T   = ( α 1 ,   α 2 ,   , α i ,   x 1 ,   x 2 ,   ,   x j ) + ε
where T is the dependent variable; xi (1, 2, …, j) is the design variable; £is the response surface model, which is generally polynomial; ε is the systematic error; and αi (1, 2, …, i) is an unknown parameter.
RSM is an effective tool to optimize the yield of calcium acetate. There are interactions between the influencing factors during the preparation process of calcium acetate. Therefore, it is necessary to use RSM to evaluate the interaction relationship and optimize the conditions. In general, there are three main steps to establish an RSM: the first step is to determine the individual variables and their variation levels; secondly, the experimental design scheme needs to be selected to establish the response surface model of the dependent parameter and the design variable; and the final step is the verification of the effectiveness of the generated model. The response surface data should meet at least the following two requirements: first, the regression model should be significant, and second, the lack of fit item should be insignificant. If the accuracy does not meet the requirements, it is necessary to redesign the test.
A list of the experimental scheme and the results can be found in Table 2. Design Expert 11 software was used to analyze the test results, and a regression equation was obtained, as shown in Formula (4):
Y = 95.93 + 0.0412 A + 0.3000 B + 0.5838 C + 0.2625 AB + 0.1050 AC + 0.5875 BC 3.02 A 2 2.09 B 2 1.89 C 2
where Y is the calcium acetate yield, A is the reaction temperature, B is the solid-liquid ratio, and C is the acetic acid dosage.
The ANOVA results of the regression model are listed in Table 3.
In order to analyze the degree of model fit, the F-value and p-value in the results of the ANOVA were mainly investigated. An F-value is obtained by an F-test comparing experimental and predicted values, and a p-value is a decreasing index indicating the credibility of a result. When the F-value is larger, and the p-value is smaller, the regression model is more significant. The p-value of the model was <0.0001, demonstrating that the regression model was highly significant. The p-value of the lack of fit term was 0.7136 (>0.05), which was not significant. Adequate precision of >4 indicated the high accuracy of this model. The R2 of a model explains the degree of difference between responses and actual values. R2 ranges from 0 to 1, and the closer its value is to 1, the closer the model test value is to the predicted value, and the more reliable the model is. In this experiment, R2 was 0.9957, which indicated that the model could explain 99.57% of the variation in response values. We also obtained the values of the adjusted R2, which considers the number of independent variables used to predict the target variable. The adjusted coefficient of determination (R2Adj) was 0.9902, close to R2, indicating that the model fits well. CV was 0.2463, indicating that the test results had high precision and reliability [64,65,66]. In general, the regression model, with a high degree of fit, a small error, and high reliability, could be used to optimize the calcium acetate yield. According to the value of F, the influence on the calcium acetate yield was C > B > A, that is, acetic acid dosage > solid-liquid ratio > reaction temperature.
The influence of the interaction between the test factors on the calcium acetate yield is shown in Figure 3. A contour shape can show the strength of an interaction between variables [67]. When a contour line tends to be oval, it means that the two-factor interaction is significant, while when a contour line tends to be round, it shows a non-significant interaction between the two factors. The color of the 3D drawings, from blue to green and red, shows the change in the production rate of calcium acetate from small to large. The larger the slope, the faster the change. The effect on the experimental results was more significant. It is shown in Figure 3 that the influences of the two factors had a parabolic relationship and that both had a maximum point.
According to the obtained model, it was predicted that the optimal process conditions for extracting calcium acetate from limestone and acetic acid were as follows: the reaction temperature was 54.997 °C, the solid-liquid ratio was 1:14.191, the acetic acid dosage was 163.384%, and the calcium acetate yield was 95.994%. Taking into account the feasibility under real operating conditions, the optimized process of calcium acetate extraction by the reaction between limestone and acetic acid was modified as follows: the reaction temperature was 55 °C, the solid-liquid ratio was 1:14, and the acetic acid dosage was 163%. The experiment was repeated three times under its modified conditions, and the error between the predicted and actual values was compared to test the practicability of the model. The results are listed in Table 4 below. It was found that the errors between the actual measurements and the predicted values of the three experimental results were all less than 5%, indicating that the obtained regression model fit well with the actual situation. The model was reasonable and effective.

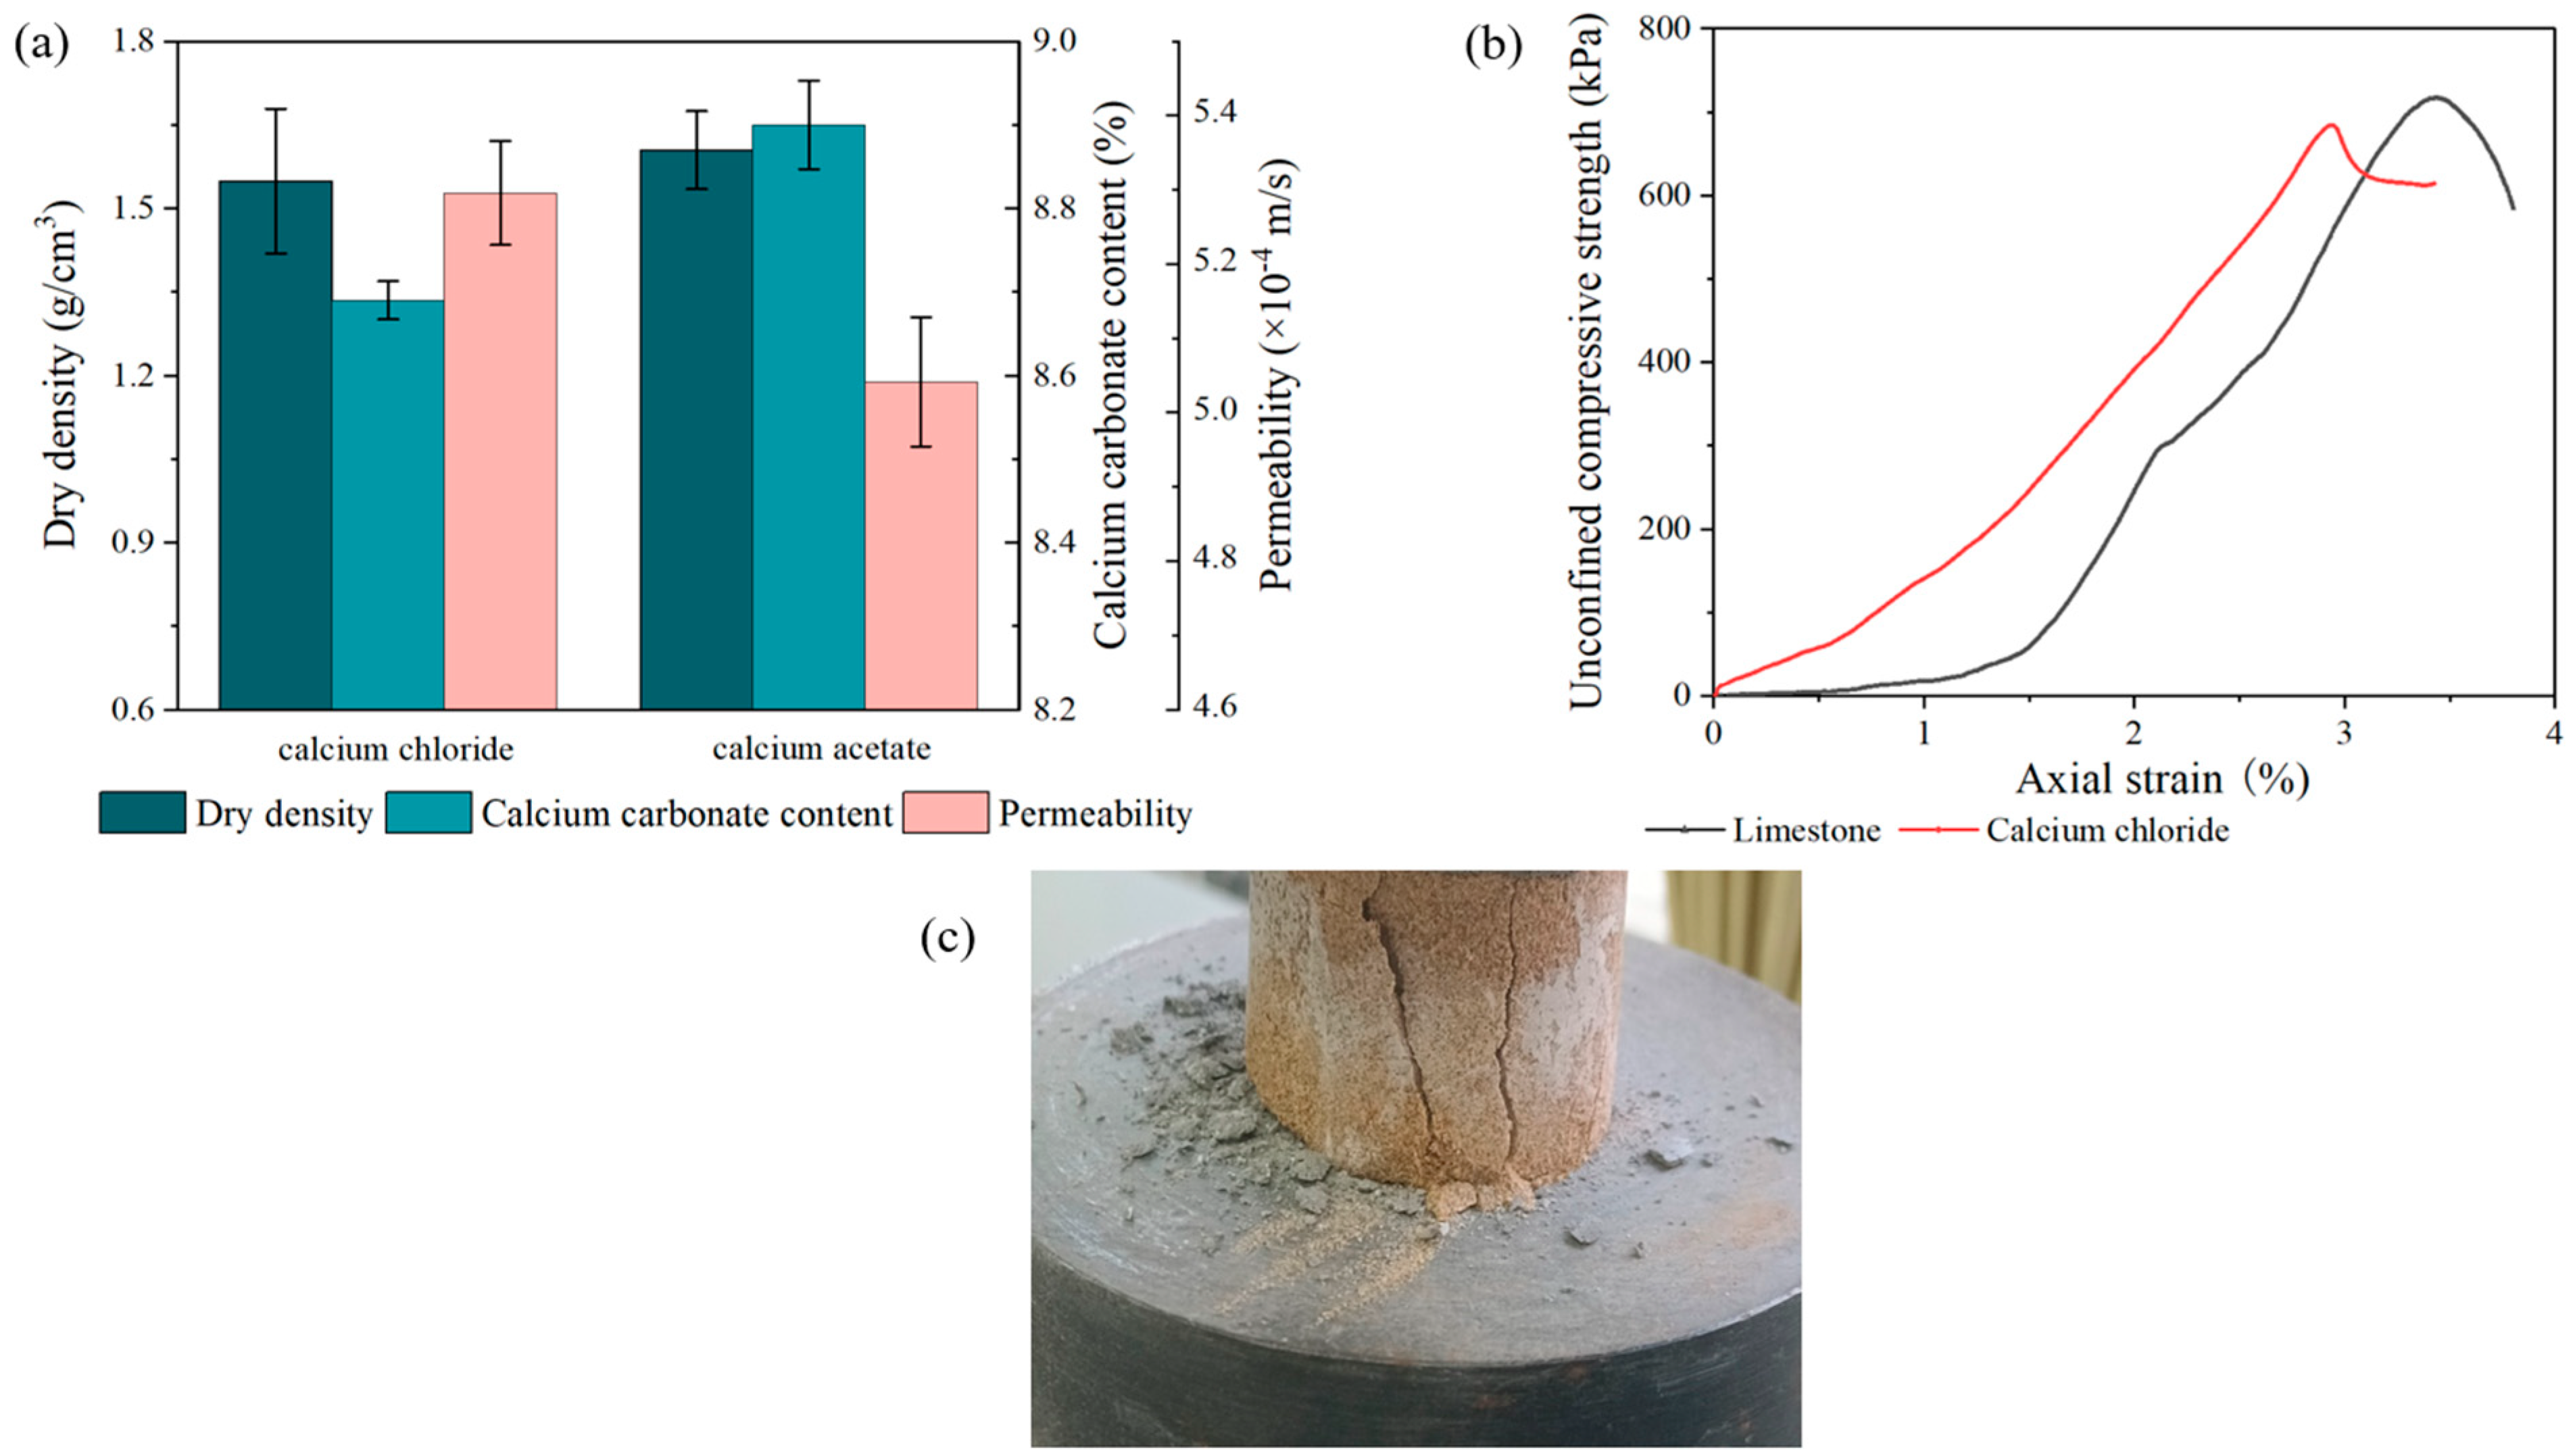
3.2. Macroscopic Mechanical Behavior of MICP-Cured Sand Columns

Figure 4 shows the macromechanical performance of sand samples treated using MICP with different calcium sources. The calcium carbonate content induced by the microorganisms was one of the important indexes to evaluate the effect of MICP. As shown in Figure 4a, the dry density and the content of CaCO3 of the sand specimens treated with limestone as a calcium source (later called limestone samples) were 1.6045 g/cm3 and 8.9%, respectively, which were 4.26% and 2.42% higher than those of the sand sample treated with the calcium chloride (later called calcium chloride samples). The permeability coefficient was 5.0415 × 10⁻⁴ m/s, which was 4.80% lower than that of the calcium chloride sand samples. This was consistent with the conclusion of Zhang et al. [34].
A lower permeability coefficient meant that when the sand was solidified in the desert, rainwater seeped down slowly so that plants could grow on the desert surface [22]. If the permeability was high, the surface of the desert remained too dry for plants to grow as the rain seeped down. Plants are constantly photosynthesizing and producing oxygen, which effectively reduces the greenhouse effect. In addition, this technology can be applied to the fracture repair of rock surrounding dams or tunnels to prevent dam seepage or tunnel water inrush [68].
UCS was considered a simple and quick way to evaluate the solidification of the sand columns, and a plot of the results is shown in Figure 4b. The cracks in the sand sample were vertical joint cracks, which are typical brittle failure characteristics (Figure 4c). There is an obvious pattern in Figure 4b. UCS increased with the increased strain and then decreased rapidly after reaching the peak value, and brittle failure occurred in the sample, which is a very typical pattern in MICP-cured sand samples [32,36]. The UCS of the limestone sample was 0.73 MPa, which was 10.61% higher than that of the calcium chloride sample. This may have been caused by the different sources of calcium used. The types of calcium carbonate crystals induced by the microorganisms were also different, which led to different cementation strengths between the calcium carbonate and sand particles. In addition, CH3COO was alkaline. The microorganisms grew well in an alkaline environment and had higher urease activity, and MICP could generate more calcium carbonate precipitation in alkaline conditions [69,70]. However, this strength was lower than that observed by Sotoudehfar et al. [71], which may have been caused by the short curing days in this experiment. Some researchers have found a strong linear relationship between the UCS of solidified sand columns and the amount of CaCO3 deposition [72]. However, this linear relationship is not absolute because there was no uniform distribution of CaCO3 in the sand columns, but there is no doubt that adding calcium carbonate increases the strength of a sample. The higher the content, the more effectively the pores between the sand grains can be filled and bonded and the tighter the sand skeleton [34,35].
The size of Young’s modulus indicates the rigidity of a material. The larger the Young’s modulus, the less deformation of the material. According to the stress-strain curve, Young’s modulus at 50 percent of peak stress (E50) was determined using the graph method. The Young’s moduli at the E50 values of the calcium chloride and limestone samples were 17.4 MPa and 15.7 MPa, respectively. These results were higher than those of Stróżyk and Tankiewicz because of the different soil types, calcium sources, operating steps, and environmental factors [73].
In conclusion, limestone is considered a good source of calcium because of its low cost, wide range of sources, and good MICP performance.

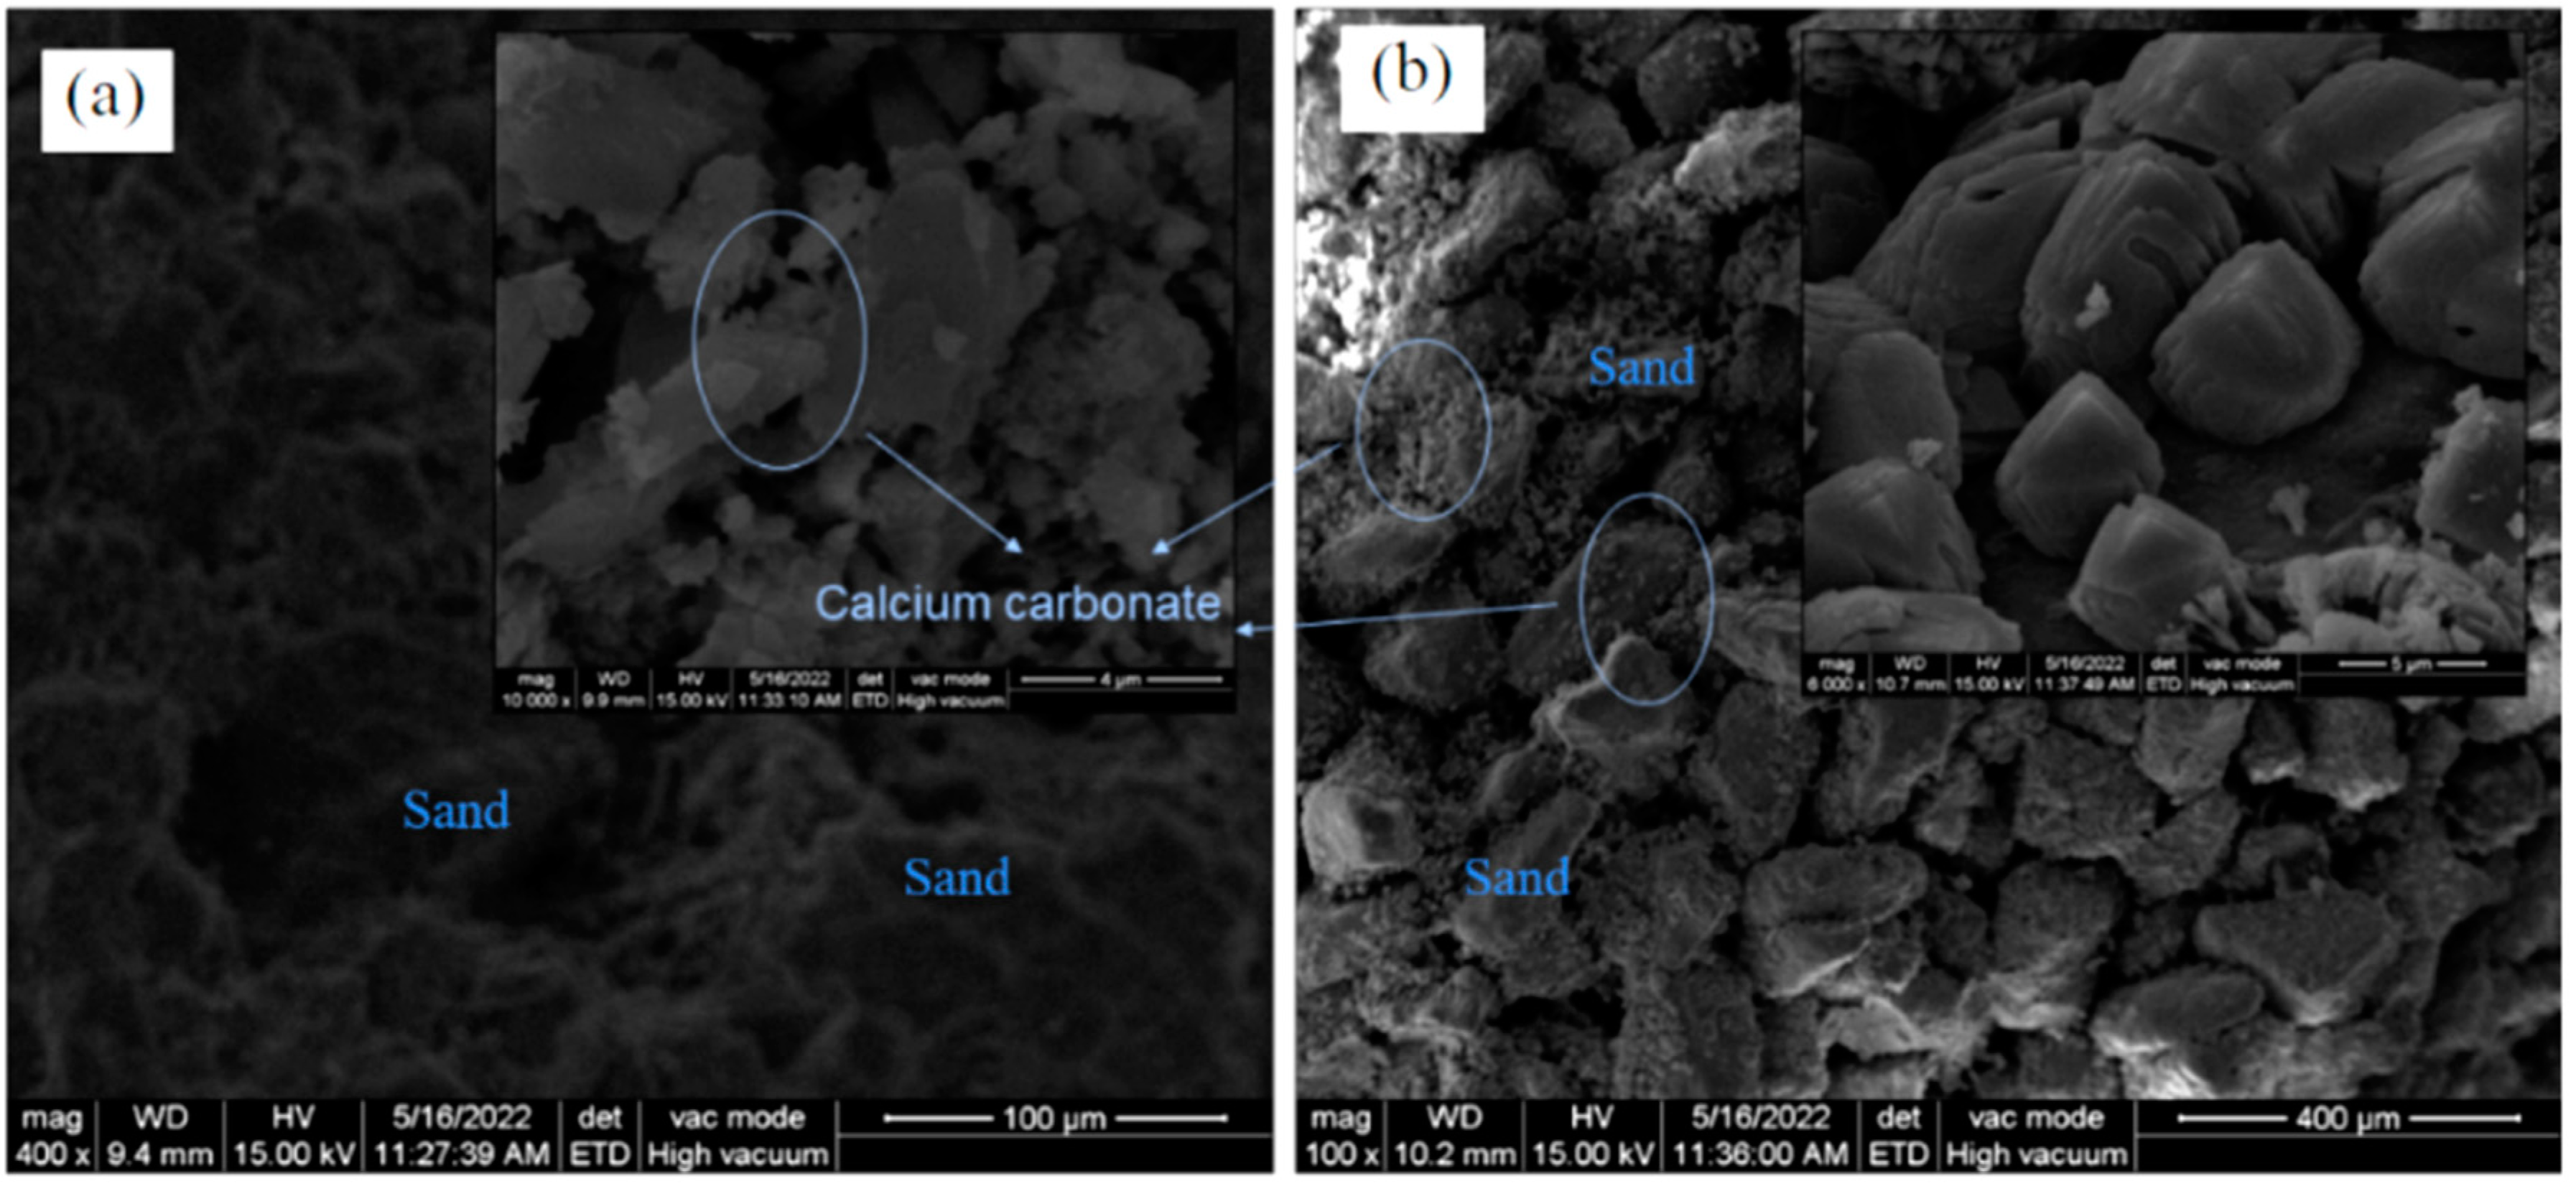
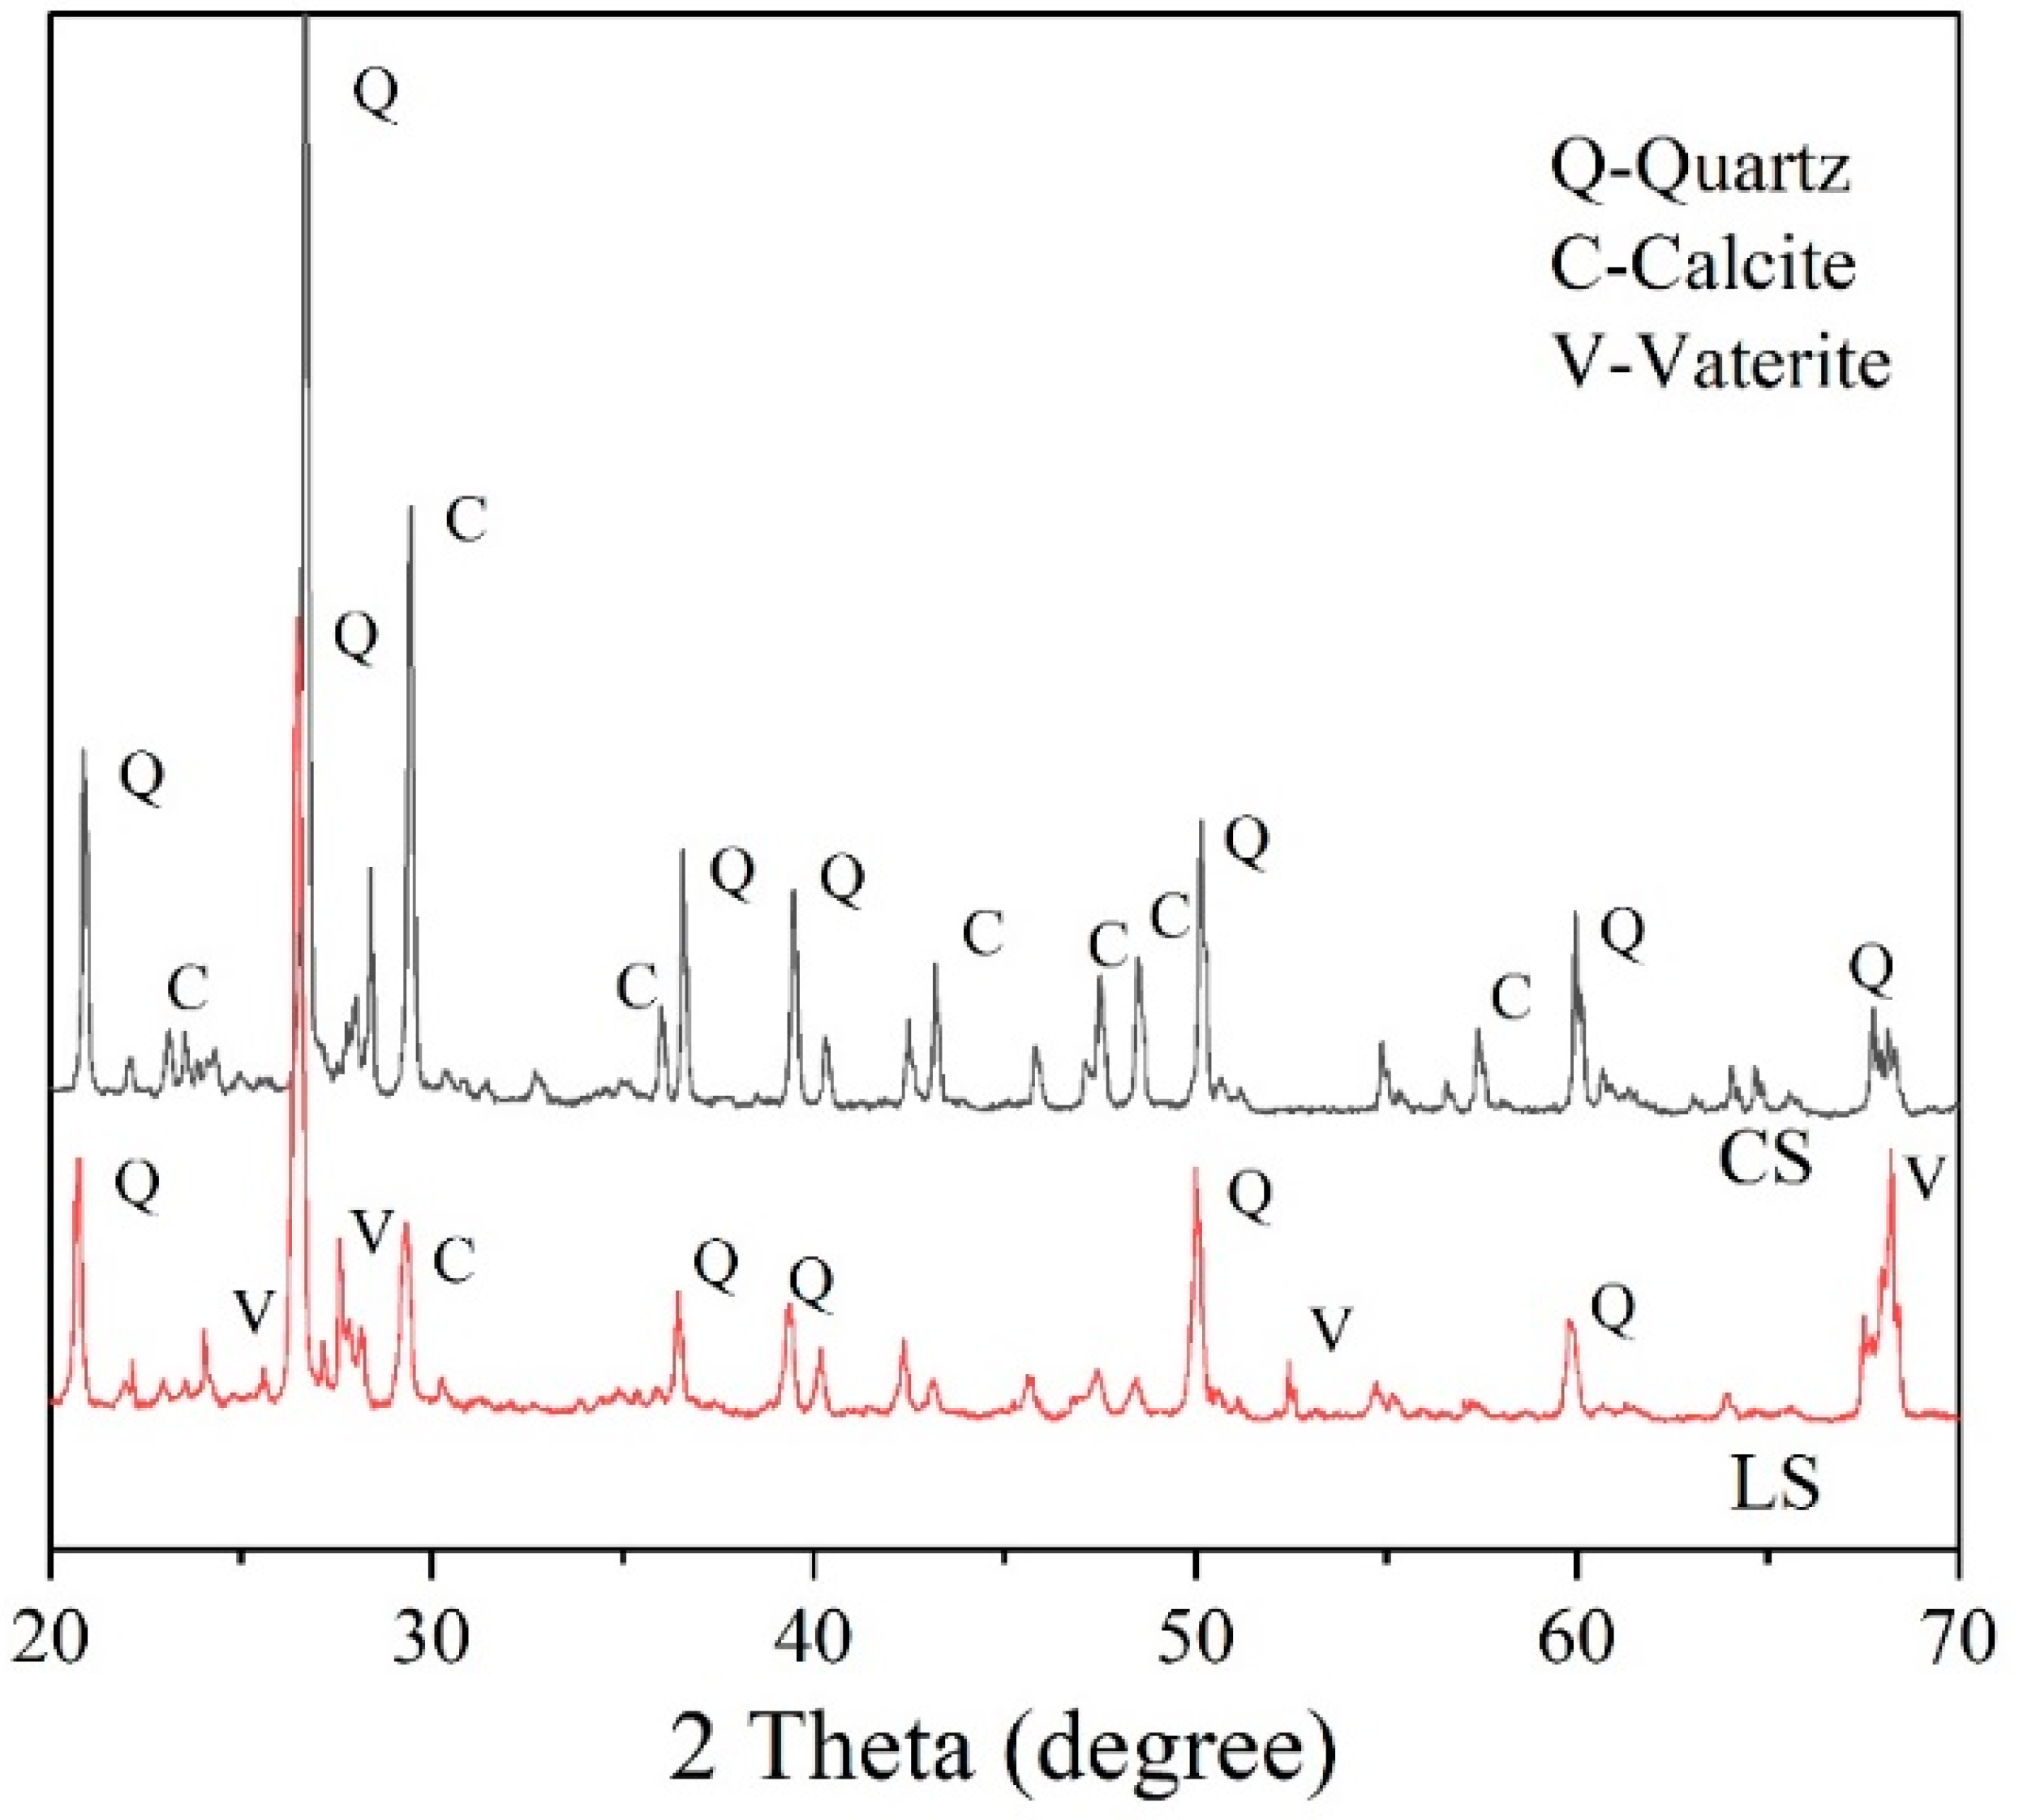
3.3. Microstructure and Mineral Analyses Using ESEM and XRD

Figure 5 illustrates the microscopic morphologies of sand samples treated with two sources of calcium. The surface of the solidified sand columns with different calcium sources was found to contain substantial levels of crystals, but their crystal forms were quite different [40,74]. The precipitation of the calcium chloride sand samples was rhomboid (a typical characteristic of calcite). These crystal particles were of different sizes. After further magnification, it was found that these crystals were not closely arranged and that there were still large pores. A large number of irregular lamellar particles were found on the limestone sand column surfaces. To further determine the mineral compositions in the sand columns, the XRD spectra of the MICP-treated sand samples were compared with normative spectra (Figure 6). The results suggested that the crystal structure in the calcium chloride sample was calcite, while that in the limestone sample was mainly vaterite, and there was also a small amount of calcite. These calcite crystals were closely combined with vaterite crystals, which made the cementation effect better than the effect when using calcium chloride as the calcium source. This was the reason for the mechanical properties of the limestone sand columns being higher than those of the calcium chloride sand columns.
Many studies have shown that the type of calcium salt has a great influence on the type, shape, size, and spatial distribution of calcium carbonate crystals [33,36,40,57,75]. Zhang et al. [75] used three different calcium sources. In terms of the morphology of cementation, the crystals generated from chloride samples were hexahedrons with smooth surfaces, while for nitrate samples they were standard hexahedrons with rough surfaces. For the acetate samples, the crystals were needle-like. Lv et al. [57] also used these three calcium sources and found through an XRD analysis that when CaCl2 and Ca(NO3)2 were selected as calcium sources, the generated calcium carbonate crystals were mainly calcite crystals. When Ca(CH3COO)2 was selected as the calcium source, the crystal phase of calcium carbonate was mainly aragonite crystal. Meanwhile, depending on the functional groups contained in different calcium sources, the water-soluble organic matter (SM) produced by microbial metabolism was selectively adsorbed on specific crystal planes, thus forming different crystal shapes [76].

3.4. Analysis of the Cost of MICP

The current price of limestone is $USD 300/ton, and the price of acetic acid is $USD 860/ton. The cost of obtaining one ton of calcium acetate, based on the rate of calcium acetate obtained in this paper, is $USD 2265. Based on the amount of calcium acetate required by the MICP process, the cost of the calcium acetate to treat one ton of sand is about $USD 10,872. Analytical-grade calcium chloride costs $USD 5700 per ton while treating a ton of sand with the same concentration of calcium ions costs $USD 15,960. In contrast, using Ca(CH3COO)2 (prepared from limestone waste) as a calcium source resulted in a 31.87% lower MICP cost compared to using CaCl2.

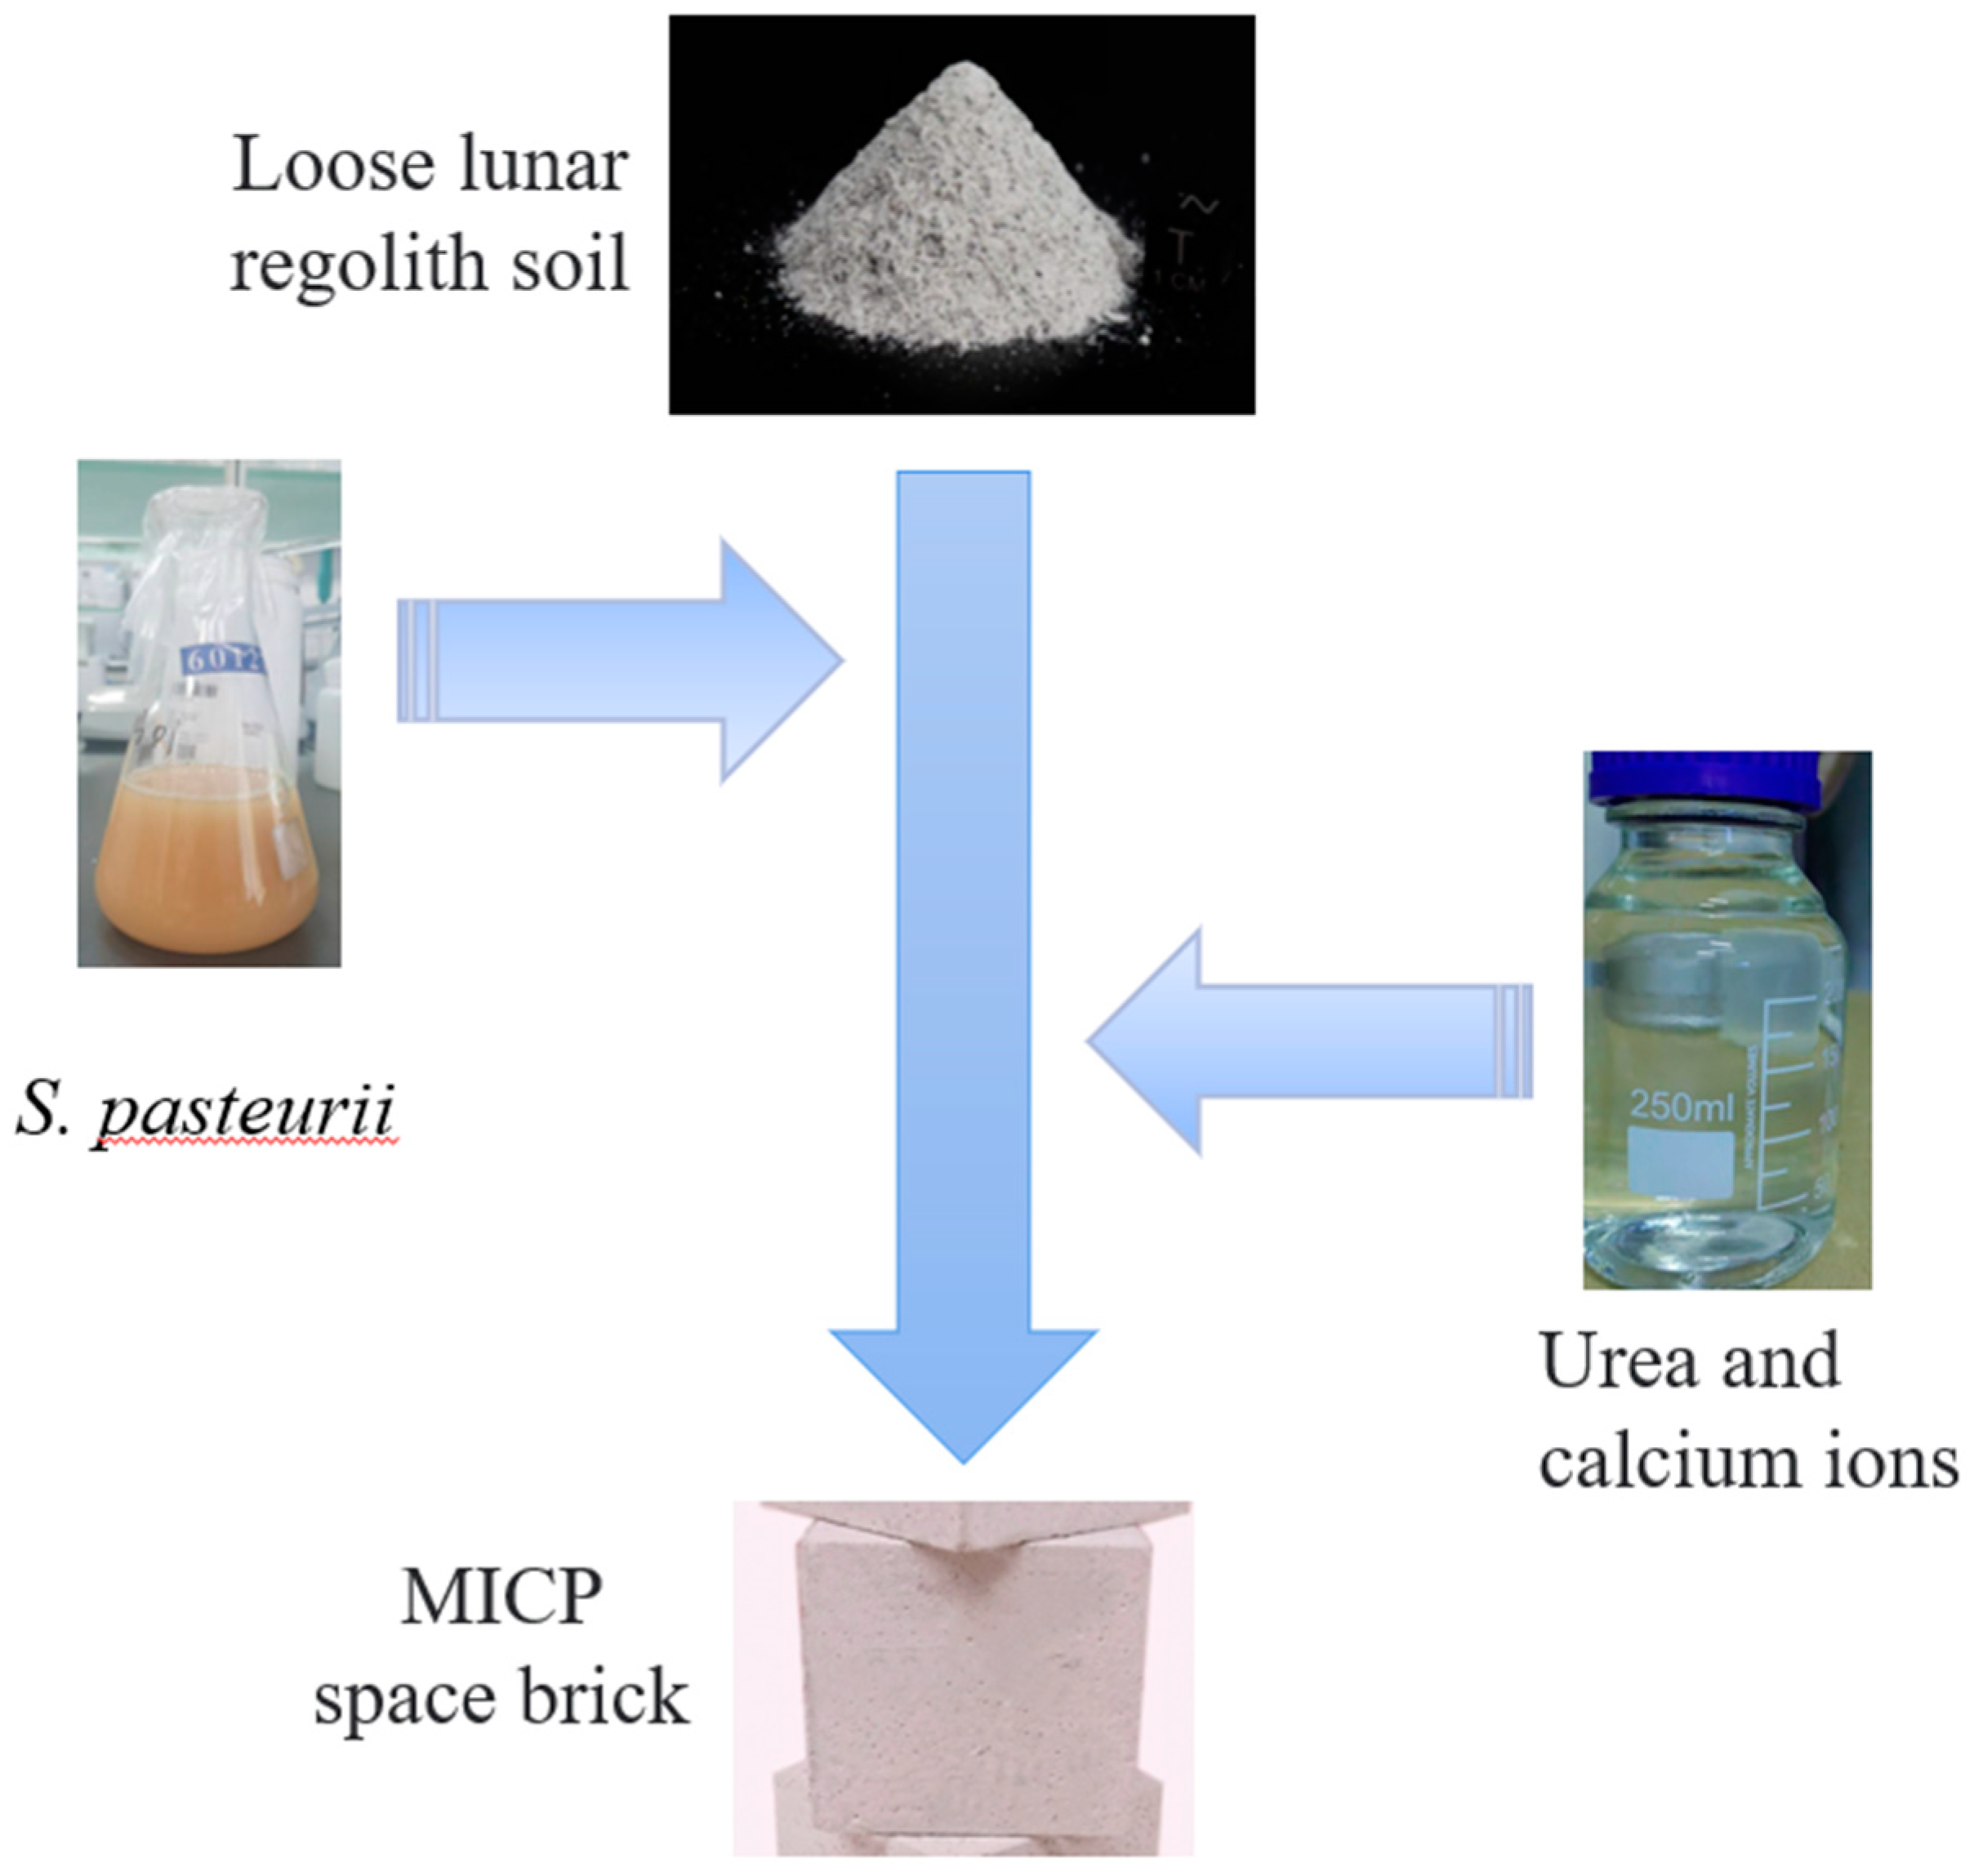
4. Future Directions Regarding MICP

This study used a small system with a distributed grouting method for the curing test. The simulation method of the MICP curing part was relatively simple. Due to the small experimental device, the distribution of calcium carbonate was more uniform, but this may not reflect the actual working condition. A curing test with an extensive volume is needed as a follow-up. This also dramatically restricts the possibility of the large-scale application of MICP [77] because the bacterial solution injected first will be washed away by the cementing solution injected later, resulting in an uneven distribution of bacteria. In addition, the bacteria and the cementing solution will react quickly to precipitate upon contact. After the repeated process, the upper calcium carbonate will accumulate continuously, and the strength will continuously improve. However, the cement will not reach a deep depth, resulting in a low strength in the underlying layer, which will be unable to be used in engineering construction. Furthermore, a laboratory environment is relatively controllable, but a practical construction project is diverse. Maintaining or even improving the curing effect of MICP in an uncontrollable external environment is also a direction for subsequent efforts.
As seen in Figure 4c, the brittle fracture of the MICP samples in the UCS experiment was obvious. Therefore, determining how to reduce the generation of these cracks needs our attention. Research has shown that adding fibers could significantly improve the strength of MICP patterns [78,79]. If these fibers are placed in the vertical direction of these brittle fracture cracks, the fracture toughness of MICP samples may be increased.
In addition, as early as 1959 and 1962, people explored the Moon and Mars, respectively, and the premise of various activities on the Moon and Mars was to establish a base. Figure 7 briefly summarizes the exploration process of the Moon and Mars. Due to the high cost of Earth-Moon and Earth-Mars transportation, the in-situ resource utilization (ISRU) of loose regolith soil on the Moon and Mars for the MICP-fabrication of bio-bricks for base construction could significantly reduce the cost [80]. Astronaut urine, a troublesome contaminant for lunar bases, could be an ideal source of MICP urea for environmentally friendly recycling [81,82,83]. Figure 8 gives a rough description of the MICP space-brick preparation process [84]. Another advantage is that even if a building needs to be rebuilt later, the MICP space bricks can be recycled using an acid solution to make new bio-bricks, enabling the recycling and regeneration of construction and building materials on the Moon.
For a microscopic insight into the fermentation process of the MICP process, we can also expect to conduct molecular dynamics simulations of the calcium carbonate precipitation reaction between particles. This can explain why the resulting precipitation is mostly calcite and no other types of calcium carbonate. In addition, based on the above kinetic model, we can also discuss how to control the fermentation process of S. pasteurii to generate calcite precipitation, the most stable form, to improve the strength of MICP samples.

5. Conclusions

In this study, a MICP sand fixation test was carried out using calcium acetate produced by an acetic acid and limestone reaction as a calcium source. The following conclusions could be made:
  • According to a response surface analysis, the optimal process conditions for extracting calcium acetate from limestone and acetic acid were as follows: the reaction temperature was 55 °C, the solid-liquid ratio was 1:14, the acetic acid dosage was 163%, and the calcium acetate yield was 96.81%.
  • In the MICP sand fixation experiment with limestone as the calcium source, the mechanical indexes of the calcium carbonate content, dry density, and permeability coefficient of the sand column were better than those obtained with the calcium chloride samples, and the UCS also increased by 10.61% compared with the calcium chloride samples. This was due to the different crystal phases of the calcium carbonate produced by the microorganisms in different nutrient environments, resulting in different cementation strengths between the calcium carbonate and sand particles, which was further confirmed using SEM and XRD. However, the microbial-induced cement of both calcium sources was calcium carbonate. In contrast, the calcium carbonate precipitates obtained from calcium chloride were calcite crystals, while the calcium carbonate precipitates obtained from limestone/acetic acid were a cluster mixture of vaterite and calcite.
  • Limestone is widely available and cheap, and the cost reduction is 31.87% compared to using calcium chloride as a calcium source. The experimental results also showed that limestone is an ideal calcium source for sand-solidified sand MICP.

Author Contributions

Conceptualization, Y.S.; validation, L.C.; data curation, Qian Feng; writing—original draft, Q.F.; writing—review and editing, Y.S., C.L., H.F., Y.H. and X.S.; Supervision, X.S.; Funding acquisition, Y.S. and X.S. All authors have read and agreed to the published version of the manuscript.

Funding

We gratefully acknowledge Nanjing Forestry University Key Laboratory of Forest Genetics and Biotechnology. This study was supported by the Natural Science Foundation of Jiangsu Province for Youth (BK20150874) and the National Natural Science Foundation for Youth (31600463). We thank the Priority Academic Program Development of Jiangsu Higher Education Institution (PAPD) for supporting the study. This research was also supported by the China Scholarship Council-Monash University Faculty of Engineering International Postgraduate Research Scholarship (CSC-Monash FEIPRS) joint project (Grant number: 201708320284).

Institutional Review Board Statement

Not applicable.

Informed Consent Statement

This article does not contain any studies with human participants or animals performed by any of the authors.

Data Availability Statement

Data is presented in the manuscript.

Conflicts of Interest

The author declares no conflict of interest.

References

  1. An, H.; Tang, Z.; Keesstra, S.; Shangguan, Z. Impact of desertification on soil and plant nutrient stoichiometry in a desert grassland. Sci. Rep. 2019, 9, 9422. [Google Scholar] [CrossRef] [Green Version]
  2. Kirkby, M. Desertification and development: Some broader contexts. J. Arid Environ. 2021, 193, 104575. [Google Scholar] [CrossRef]
  3. Stiles, D. Desertification: The time for action. Environmentalist 1984, 4, 93. [Google Scholar] [CrossRef]
  4. Liu, J.; Diamond, J. China’s environment in a globalizing world. Nature 2005, 435, 1179. [Google Scholar] [CrossRef]
  5. Xu, D.; Wang, Y.; Wang, Z. Linking priority areas and land restoration options to support desertification control in northern China. Ecol. Indic. 2022, 137, 108747. [Google Scholar] [CrossRef]
  6. Al-Taie, A.J.; Al-Shakarchi, Y.J.; Mohammed, A.A. Investigation of Geotechnical Specifications of Sand Dune Soil: A Case Study around Baiji in Iraq. Int. J. Sustain. Built Environ. 2013, 1, 208. [Google Scholar] [CrossRef] [Green Version]
  7. Chen, L.; Song, Y.; Huang, J.; Lai, C.; Jiao, H.; Fang, H.; Zhu, J.; Song, X. Critical Review of Solidification of Sandy Soil by Microbially Induced Carbonate Precipitation (MICP). Crystals 2021, 11, 1439. [Google Scholar] [CrossRef]
  8. Elipe, M.G.M.; López-Querol, S. Aeolian sands: Characterization, options of improvement and possible employment in construction—The state-of-the-art. Constr. Build. Mater. 2014, 73, 728. [Google Scholar] [CrossRef]
  9. Karnati, V.R.; Munaga, T.; Gonavaram, K.K.; Amitava, B. Study on strength and leaching behavior of biogeochemical cemented sand. Geomicrobiol. J. 2020, 37, 670. [Google Scholar] [CrossRef]
  10. Punnoi, B.; Arpajirakul, S.; Pungrasmi, W.; Chompoorat, T.; Likitlersuang, S. Use of microbially induced calcite precipitation for soil improvement in compacted clays. Int. J. Geosynth. Ground Eng. 2021, 7, 86. [Google Scholar] [CrossRef]
  11. Bessaies-Bey, H.; Massoussi, N.; Mulik, S.; Baumann, R.; Schmitz, M.; Radler, M.; Gelardi, G.; Flatt, R.J.; Roussel, N. Polycarboxylate ester adsorption on cement grains: Influence of polydispersity. Cem. Concr. Res. 2021, 143, 106383. [Google Scholar] [CrossRef]
  12. Drochytka, R.; Hodul, J.; Mészárosová, L.; Jakubík, A. Chemically resistant polymeric jointing grout with environmental impact. Constr. Build. Mater. 2021, 292, 123454. [Google Scholar] [CrossRef]
  13. Kholghifard, M.; Amini Behbahani, B. Shear strength of clayey sand treated by nanoclay mixed with recycled polyester fiber. J. Cent. South Univ. 2022, 29, 259. [Google Scholar] [CrossRef]
  14. Pan, T.; Jiang, Y.; Ji, X. Interlayer bonding investigation of 3D printing cementitious materials with fluidity-retaining polycarboxylate superplasticizer and high-dispersion polycarboxylate superplasticizer. Constr. Build. Mater. 2022, 330, 127151. [Google Scholar] [CrossRef]
  15. Selvakumar, S.; Kulanthaivel, P.; Soundara, B. Influence of nano-silica and sodium silicate on the strength characteristics of clay soil. Nanotechnol. Environ. Eng. 2021, 6, 46. [Google Scholar] [CrossRef]
  16. Wang, Y.; Liu, Q. Investigation on fundamental properties and chemical characterization of water-soluble epoxy resin modified cement grout. Constr. Build. Mater. 2021, 299, 123877. [Google Scholar] [CrossRef]
  17. Dejong, J.T.; Mortensen, B.M.; Martinez, B.C.; Nelson, D.C. Bio-mediated soil improvement. Ecol. Eng. 2010, 36, 197. [Google Scholar] [CrossRef]
  18. Boquet, E.; Boronat, A.; Ramos-Cormenzana, A. Production of calcite (calcium carbonate) crystals by soil bacteria is a general phenomenon. Nature 1973, 246, 527. [Google Scholar] [CrossRef]
  19. Zhu, T.; Dittrich, M. Carbonate precipitation through microbial activities in natural environment, and their potential in biotechnology: A review. Front. Bioeng. Biotechnol. 2016, 4, 4. [Google Scholar] [CrossRef] [Green Version]
  20. Mujah, D.; Shahin, M.A.; Cheng, L. State-of-the-art review of biocementation by microbially induced calcite precipitation (MICP) for soil stabilization. Geomicrobiol. J. 2017, 34, 524. [Google Scholar] [CrossRef]
  21. Li, C.; Yao, D.; Liu, S.; Zhou, T.; Bai, S.; Gao, Y.; Li, L. Improvement of Geomechanical Properties of Bio-remediated Aeolian Sand. Geomicrobiol. J. 2018, 35, 132. [Google Scholar] [CrossRef]
  22. Seifan, M.; Berenjian, A. Microbially induced calcium carbonate precipitation: A widespread phenomenon in the biological world. Appl. Microbiol. Biotechnol. 2019, 103, 4693. [Google Scholar] [CrossRef]
  23. Tang, C.; Yin, L.; Jiang, N.; Zhu, C.; Zeng, H.; Li, H.; Shi, B. Factors affecting the performance of microbial-induced carbonate precipitation (MICP) treated soil: A review. Environ. Earth Sci. 2020, 79, 94. [Google Scholar] [CrossRef]
  24. Ahmed, H.; Tiznobaik, M.; Huda, S.B.; Islam, M.S.; Alam, M.S. Recycled aggregate concrete from large-scale production to sustainable field application. Constr. Build. Mater. 2020, 262, 119979. [Google Scholar] [CrossRef]
  25. Jonkers, H.M.; Thijssen, A.; Muyzer, G.; Copuroglu, O.; Schlangen, E. Application of bacteria as self-healing agent for the development of sustainable concrete. Ecol. Eng. 2010, 36, 230. [Google Scholar] [CrossRef]
  26. Su, Z.; Deng, Z.; Wang, Y.; Ji, C.; Li, F.; Yang, G.; Huang, L. Effects of the Sr/Ca ratio on the bioremediation of strontium based on microbially-induced carbonate precipitation. J. Environ. Chem. Eng. 2023, 11, 108990. [Google Scholar] [CrossRef]
  27. Xue, Z.; Cheng, W.; Wang, L.; Qin, P.; Zhang, B. Revealing degradation and enhancement mechanisms affecting copper (Cu) immobilization using microbial-induced carbonate precipitation (MICP). J. Environ. Chem. Eng. 2022, 10, 108479. [Google Scholar] [CrossRef]
  28. Xiang, J.; Qiu, J.; Yuan, J.; Fu, H.; Yang, Y.; Gu, X. Study on denitrifying biogrout to immobilize heavy metals in bottom ash in an anaerobic environment and its immobilization mechanism. J. Environ. Chem. Eng. 2022, 10, 108084. [Google Scholar] [CrossRef]
  29. Song, H.; Wang, C.; Kumar, A.; Ding, Y.; Li, S.; Bai, X.; Liu, T.; Wang, J.; Zhang, Y. Removal of pb2+ and Cd2+ from contaminated water using novel microbial material (scoria@uf1). J. Environ. Chem. Eng. 2021, 9, 106495. [Google Scholar] [CrossRef]
  30. Chen, B.; Sun, W.; Sun, X.; Cui, C.; Lai, J.; Wang, Y.; Feng, J. Crack sealing evaluation of self-healing mortar with Sporosarcina pasteurii: Influence of bacterial concentration and air-entraining agent. Process Biochem. 2021, 107, 100. [Google Scholar] [CrossRef]
  31. Xu, J.; Tang, Y.; Wang, X. A correlation study on optimum conditions of microbial precipitation and prerequisites for self-healing concrete. Process Biochem. 2020, 94, 266. [Google Scholar] [CrossRef]
  32. Chung, J.; Kim, B.; Kim, I. A case study on chloride corrosion for the end zone of concrete deck subjected to de-icing salts added calcium chloride. J. Korean Soc. Saf. 2014, 29, 87. [Google Scholar] [CrossRef] [Green Version]
  33. Choi, S.; Wu, S.; Chu, J. Biocementation for sand using an eggshell as calcium source. J. Geotech. Geoenviron. Eng. 2016, 142, 6016010. [Google Scholar] [CrossRef]
  34. Zhang, Y.; Guo, H.X.; Cheng, X.H. Role of calcium sources in the strength and microstructure of microbial mortar. Constr. Build. Mater. 2015, 77, 160. [Google Scholar] [CrossRef]
  35. Cheng, L.; Shahin, M.A.; Cord-Ruwisch, R. Bio-cementation of sandy soil using microbially induced carbonate precipitation for marine environments. Geotechnique 2014, 64, 1010. [Google Scholar] [CrossRef] [Green Version]
  36. Choi, S.G.; Chu, J.; Brown, R.C.; Wang, K.; Wen, Z. Sustainable Biocement Production via Microbially Induced Calcium Carbonate Precipitation: Use of limestone and acetic acid derived from pyrolysis of lignocellulosic biomass. ACS Sustain. Chem. Eng. 2017, 5, 7449. [Google Scholar] [CrossRef] [Green Version]
  37. Gowthaman, S.; Chen, M.; Nakashima, K.; Kawasaki, S. Effect of scallop powder addition on micp treatment of amorphous peat. Front. Environ. Sci. 2021, 9, 690376. [Google Scholar] [CrossRef]
  38. Gowthaman, S.; Yamamoto, M.; Nakashima, K.; Ivanov, V.; Kawasaki, S. Calcium phosphate biocement using bone meal and acid urease: An eco-friendly approach for soil improvement. J. Clean. Prod. 2021, 319, 128782. [Google Scholar] [CrossRef]
  39. Jin, P.; Zhang, S.; Liu, Y.; Zhang, W.; Wang, R. Application of Bacillus mucilaginosus in the carbonation of steel slag. Appl. Microbiol. Biotechnol. 2021, 105, 8663. [Google Scholar] [CrossRef]
  40. Liang, S.; Chen, J.; Niu, J.; Gong, X.; Feng, D. Using recycled calcium sources to solidify sandy soil through microbial induced carbonate precipitation. Mar. Geores. Geotechnol. 2020, 38, 393. [Google Scholar] [CrossRef]
  41. Peng, D.; Qiao, S.; Luo, Y.; Ma, H.; Zhang, L.; Hou, S.; Wu, B.; Xu, H. Performance of microbial induced carbonate precipitation for immobilizing cd in water and soil. Hazard. Mater. 2020, 400, 123116. [Google Scholar] [CrossRef] [PubMed]
  42. Cheng, Y.; Chaosheng, T.; Bo, L.; Xiaohua, P.; Dianlong, W.; Chao, L.; Hao, L. Experimental study on microbial solidified sand based on calcium source extracted from limestone powder. Geol. J. Chin. Univ. 2021, 27, 746. [Google Scholar] [CrossRef]
  43. Mansy, A.E.; El-Desouky, E.; El-Gendi, H.; Abu-Saied, M.A.; Taha, T.H.; Amer, R.A. Cellulosic fiber waste feedstock for bioethanol production via bioreactor-dependent fermentation. Fermentation 2023, 9, 176. [Google Scholar] [CrossRef]
  44. Cutzu, R.; Bardi, L. Production of bioethanol from agricultural wastes using residual thermal energy of a cogeneration plant in the distillation phase. Fermentation 2017, 3, 24. [Google Scholar] [CrossRef] [Green Version]
  45. Su, F.; Yang, Y.; Qi, Y.; Zhang, H. Combining microbially induced calcite precipitation (MICP) with zeolite: A new technique to reduce ammonia emission and enhance soil treatment ability of MICP technology. J. Environ. Chem. Eng. 2022, 10, 107770. [Google Scholar] [CrossRef]
  46. Yu, X.; Chu, J.; Yang, Y.; Qian, C. Reduction of ammonia production in the biocementation process for sand using a new biocement. J. Clean. Prod. 2021, 286, 124928. [Google Scholar] [CrossRef]
  47. Mohsenzadeh, A.; Aflaki, E.; Gowthaman, S.; Nakashima, K.; Kawasaki, S.; Ebadi, T. A two-stage treatment process for the management of produced ammonium by-products in ureolytic bio-cementation process. Int. J. Environ. Sci. Technol. 2022, 19, 449. [Google Scholar] [CrossRef]
  48. Keykha, H.A.; Mohamadzadeh, H.; Asadi, A.; Kawasaki, S. Ammonium-free carbonate-producing bacteria as an ecofriendly soil biostabilizer. Geotech. Test. J. 2019, 42, 19. [Google Scholar] [CrossRef]
  49. Xiang, J.; Qiu, J.; Wang, Y.; Gu, X. Calcium acetate as calcium source used to biocement for improving performance and reducing ammonia emission. J. Clean. Prod. 2022, 348, 131286. [Google Scholar] [CrossRef]
  50. Duo, L.; Kan-Liang, T.; Hui-Li, Z.; Yu-Yao, W.; Kang-Yi, N.; Shi-Can, Z. Experimental investigation of solidifying desert aeolian sand using microbially induced calcite precipitation. Constr. Build. Mater. 2018, 172, 251. [Google Scholar] [CrossRef]
  51. Zhang, Z.; Tong, K.; Hu, L.; Yu, Q.; Wu, L. Experimental study on solidification of tailings by MICP under the regulation of organic matrix. Constr. Build. Mater. 2020, 265, 120303. [Google Scholar] [CrossRef]
  52. Chen, L.; Song, Y.; Fang, H.; Feng, Q.; Lai, C.; Song, X. Systematic optimization of a novel, cost-effective fermentation medium of Sporosarcina pasteurii for microbially induced calcite precipitation (MICP). Constr. Build. Mater. 2022, 348, 128632. [Google Scholar] [CrossRef]
  53. Liberato, V.; Benevenuti, C.; Coelho, F.; Botelho, A.; Ferreira, T. Clostridium sp. As bio-catalyst for fuels and chemicals production in a biorefinery context. Catalysts 2019, 9, 962. [Google Scholar] [CrossRef] [Green Version]
  54. Amiri, A.; Bundur, Z.B. Use of corn-steep liquor as an alternative carbon source for biomineralization in cement-based materials and its impact on performance. Constr. Build. Mater. 2018, 165, 655. [Google Scholar] [CrossRef]
  55. Sd, M.K.V.; Babu, C.N.; VijayaKumar, V.T.; Vasumathi, N. Beneficiation of low-grade limestone by flotation. Mater. Today Proc. 2023, 72, 181. [Google Scholar] [CrossRef]
  56. Xu, X.C.; Guo, H.X.; Cheng, X.H.; Li, M. The promotion of magnesium ions on aragonite precipitation in MICP process. Constr. Build. Mater. 2020, 263, 120057. [Google Scholar] [CrossRef]
  57. Lv, C.; Tang, C.S.; Zhang, J.Z.; Pan, X.H.; Liu, H. Effects of calcium sources and magnesium ions on the mechanical behavior of MICP-treated calcareous sand: Experimental evidence and precipitated crystal insights. Acta Geotech. 2022, 1–15. [Google Scholar] [CrossRef]
  58. Sathyanarayanan, S.; Suresh, S.; Saravanan, C.G.; Vikneswaran, M.; Dhamodaran, G.; Sonthalia, A.; Josephin, J.S.F.; Varuvel, E.G. Experimental investigation and performance prediction of gasoline engine operating parameters fueled with diisopropyl ether-gasoline blends: Response surface methodology based optimization. J. Clean. Prod. 2022, 375, 133941. [Google Scholar] [CrossRef]
  59. Yang, D.; Xu, G.; Duan, Y.; Dong, S. Self-healing cement composites based on bleaching earth immobilized bacteria. J. Clean. Prod. 2022, 358, 132045. [Google Scholar] [CrossRef]
  60. ASTM D4219; Standard Test Method for Unconfined Compressive Strength Index of Chemical-Grouted Soils. ASTM International: West Conshohocken, PA, USA, 2008.
  61. ASTM D4373; Standard Test Method for Rapid Determination of Carbonate Content of Soils. ASTM International: West Conshohocken, PA, USA, 2014.
  62. M-Ridha, M.J.; Hussein, S.I.; Alismaeel, Z.T.; Atiya, M.A.; Aziz, G.M. Biodegradation of reactive dyes by some bacteria using response surface methodology as an optimization technique. Alex. Eng. J. 2020, 59, 3551. [Google Scholar] [CrossRef]
  63. Pereira, L.M.S.; Milan, T.M.; Tapia-Blácido, D.R. Using response surface methodology (RSM) to optimize 2G bioethanol production: A review. Biomass Bioenergy 2021, 151, 106166. [Google Scholar] [CrossRef]
  64. Song, W.; Li, Z.; Liu, F.; Ding, Y.; Qi, P.; You, H.; Jin, C. Effective removal of ammonia nitrogen from waste seawater using crystal seed enhanced struvite precipitation technology with response surface methodology for process optimization. Environ. Sci. Pollut. Res. 2018, 25, 628. [Google Scholar] [CrossRef] [PubMed]
  65. Kahani, M.; Kalantary, F.; Soudi, M.R.; Pakdel, L.; Aghaalizadeh, S. Optimization of cost effective culture medium for Sporosarcina pasteurii as biocementing agent using response surface methodology: Up cycling dairy waste and seawater. J. Clean. Prod. 2020, 253, 120022. [Google Scholar] [CrossRef]
  66. Alzaeemi, S.A.; Noman, E.A.; Al-Shaibani, M.M.; Al-Gheethi, A.; Mohamed, R.M.; Almoheer, R.; Seif, M.; Tay, K.G.; Zin, N.M.; El Enshasy, H.A. Improvement of L-asparaginase, an Anticancer Agent of Aspergillus arenarioides EAN603 in Submerged Fermentation Using a Radial Basis Function Neural Network with a Specific Genetic Algorithm (RBFNN-GA). Fermentation 2023, 9, 200. [Google Scholar] [CrossRef]
  67. Yang, L.; Geng, Y.; Cui, D.; Liu, Z.; Xiong, Z.; Pavlostathis, S.G.; Shao, P.; Luo, X. Corrected response surface methodology for microalgae towards optimized ammonia nitrogen removal: A case of rare earth mining tailings wastewater in Southern Jiangxi, China. J. Clean. Prod. 2022, 343, 130998. [Google Scholar] [CrossRef]
  68. Xu, J.; Wang, X.; Wang, B. Biochemical process of ureolysis-based microbial caco3 precipitation and its application in self-healing concrete. Appl. Microbiol. Biotechnol. 2018, 102, 3121. [Google Scholar] [CrossRef]
  69. Pan, X.; Achal, V. Influence of calcium sources on Microbially Induced Calcium Carbonate Precipitation by Bacillus sp. CR2. Appl. Biochem. Biotechnol. 2014, 173, 307. [Google Scholar] [CrossRef]
  70. Mori, D.; Uday, K.V. A review on qualitative interaction among the parameters affecting ureolytic microbial-induced calcite precipitation. Environ. Earth Sci. 2021, 80, 329. [Google Scholar] [CrossRef]
  71. Sotoudehfar, A.R.; Mirmohammad Sadeghi, M.; Mokhtari, E.; Shafiei, F. Assessment of the Parameters Influencing Microbially Calcite Precipitation in Injection Experiments Using Taguchi Methodology. Geomicrobiol. J. 2016, 33, 163. [Google Scholar] [CrossRef]
  72. Chu, J.; Ivanov, V.; Naeimi, M.; Stabnikov, V.; Liu, H. Optimization of calcium-based bioclogging and biocementation of sand. Acta Geotech. 2014, 9, 277. [Google Scholar] [CrossRef]
  73. Stróżyk, J.; Tankiewicz, M. The elastic undrained modulus e for stiff consolidated clays related to the concept of stress history and normalized soil properties. Stud. Geotech. Mech. 2016, 38, 67. [Google Scholar] [CrossRef] [Green Version]
  74. Pan, L.; Li, Q.; Zhou, Y.; Song, N.; Yu, L.; Wang, X.; Xiong, K.; Yap, L.S.; Huo, J. Effects of different calcium sources on the mineralization and sand curing of CaCO3 by carbonic anhydrase-producing bacteria. RSC Adv. 2019, 9, 40827. [Google Scholar] [CrossRef] [PubMed] [Green Version]
  75. Zhang, Y.; Guo, H.X.; Cheng, X.H. Influences of calcium sources on microbially induced carbonate precipitation in porous media. Mater. Res. Innov. 2014, 18, 79. [Google Scholar] [CrossRef]
  76. Chen, Y.; Wang, S.; Tong, X.; Kang, X. Crystal transformation and self-assembly theory of microbially induced calcium carbonate precipitation. Appl. Microbiol. Biotechnol. 2022, 106, 3555. [Google Scholar] [CrossRef]
  77. Portugal, C.R.M.E.; Fonyo, C.; Machado, C.C.; Meganck, R.; Jarvis, T. Microbiologically Induced Calcite Precipitation biocementation, green alternative for roads—Is this the breakthrough? A critical review. J. Clean. Prod. 2020, 262, 121372. [Google Scholar] [CrossRef]
  78. Shan, Y.; Liang, J.; Tong, H.; Yuan, J.; Zhao, J. Effect of different fibers on small-strain dynamic properties of microbially induced calcite precipitation—Fiber combined reinforced calcareous sand. Constr. Build. Mater. 2022, 322, 126343. [Google Scholar] [CrossRef]
  79. Imran, M.A.; Nakashima, K.; Evelpidou, N.; Kawasaki, S. Durability Improvement of Biocemented Sand by Fiber-Reinforced MICP for Coastal Erosion Protection. Materials 2022, 15, 2389. [Google Scholar] [CrossRef]
  80. Dikshit, R.; Dey, A.; Gupta, N.; Varma, S.C.; Venugopal, I.; Viswanathan, K.; Kumar, A. Space bricks: From LSS to machinable structures via MICP. Ceram. Int. 2021, 47, 14892. [Google Scholar] [CrossRef]
  81. Lambert, S.E.; Randall, D.G. Manufacturing bio-bricks using microbial induced calcium carbonate precipitation and human urine. Water Res. 2019, 160, 158. [Google Scholar] [CrossRef] [Green Version]
  82. Yang, Y.; Chu, J.; Cheng, L.; Liu, H. Utilization of carbide sludge and urine for sustainable biocement production. Environ. Chem. Eng. 2022, 10, 107443. [Google Scholar] [CrossRef]
  83. Crane, L.; Ray, H.; Hamdan, N.; Boyer, T.H. Enzyme-induced carbonate precipitation utilizing fresh urine and calcium-rich zeolites. J. Environ. Chem. Eng. 2022, 10, 107238. [Google Scholar] [CrossRef]
  84. Farajnia, A.; Shafaat, A.; Farajnia, S.; Sartipipour, M.; Khodadadi Tirkolaei, H. The efficiency of ureolytic bacteria isolated from historical adobe structures in the production of bio-bricks. Constr. Build. Mater. 2022, 317, 125868. [Google Scholar] [CrossRef]
Figure 1. (a) Schematic of the experimental setup, (b) photo of the grouting equipment, (c) sand samples treated with MICP for six days, (d) the unconfined compression tester.
Fermentation 09 00307 g001
Figure 2. Yields of calcium acetate under a different (a) reaction temperature, (b) solid-liquid ratio, and (c) acetic acid dosage conditions, showing that when the other two factors were fixed, the yield of calcium acetate reached a peak when the temperature, solid-liquid ratio, and acetic acid dosage were 55 °C, 1:14, 160%, respectively. The acetic acid dosage had the greatest influence on the calcium acetate yield, while the temperature had relatively little influence, which was the same as the result of the response surface analysis below.
Fermentation 09 00307 g002
Figure 3. Three-dimensional response surface diagram of the interaction of various factors on the calcium acetate yield. (a) Temperature and Solid-liquid ratio, (b) Temperature and Acetic acid dosage, (c) Solid-liquid ratio and Acetic acid dosage.
Fermentation 09 00307 g003
Figure 4. Macromechanical behavior of sand cured using two sources of calcium. (a) Dry density, calcium carbonate content, and permeability, (b) stress-strain curves of samples after grouting, and (c) sand column after stress failure.
Fermentation 09 00307 g004
Figure 5. ESEM images of CaCO3 induced by different calcium sources: (a) calcium chloride (400× and 10,000× magnification) and (b) limestone (100× and 6000× magnification).
Fermentation 09 00307 g005
Figure 6. XRD patterns of sand samples treated with different calcium sources (CS: calcium chloride sample, LS: Limestone sample).
Fermentation 09 00307 g006
Figure 7. The exploration processes of the Moon (above) and Mars (below).
Fermentation 09 00307 g007
Figure 8. Preparation processes of MICP space brick.
Fermentation 09 00307 g008
Table 1. Response surface test factor levels.
LevelFactors
A Reaction Temperature/°CB Solid-Liquid RatioC Acetic Acid Dosage/%
−1451:12140
0551:14160
1651:16180
Table 2. Test design and results of RSM.
Run.A (°C)BC (%)Y (%)
Actual ValuePredicted Value
1551: 1416096.2595.93
2551: 1618093.5193.42
3551: 1416095.7995.93
4451: 1418091.4791.54
5651: 1616092.1991.34
6451: 1616090.8891.9
7651: 1216090.2490.22
8451: 1414090.5290.58
9551: 1416095.8795.93
10551: 1416096.1395.53
11551: 1416095.6195.53
12551: 1214091.5691.65
13651: 1414090.3690.29
14651: 1418091.7391.67
15451: 1216090.9890.83
16551: 1614091.1691.08
17551: 1218091.5691.64
Table 3. ANOVA for quadratic response surface regression model.
SourceSum of SquaresdfMean SquareF-Valuep-Value
Model84.9199.43181.19<0.0001significant
A0.013610.01360.26140.6249
B0.720010.720013.830.0075
C2.7312.7352.360.0002
AB0.275610.27565.290.0549
AC0.044110.04410.84700.3880
BC1.3811.3826.520.0013
38.34138.34736.31<0.0001
18.39118.39353.23<0.0001
15.08115.08289.63<0.0001
Residual0.364570.0521
Lack of Fit0.096530.03220.48000.7136Not significant
Pure Error0.268040.0670
Cor Total83.2716
Std. Dev.0.2282R20.9957
Mean92.64Adjusted R20.9902
C.V.%0.2463Predicted R20.9770
Adeq Precision32.6340
Table 4. Comparison of predicted value and actual values under optimal conditions.
ProjectPredicted ValueActual ValueError/%
Calcium acetate yield/%95.99496.810.84
95.290.74
94.431.66
Disclaimer/Publisher’s Note: The statements, opinions and data contained in all publications are solely those of the individual author(s) and contributor(s) and not of MDPI and/or the editor(s). MDPI and/or the editor(s) disclaim responsibility for any injury to people or property resulting from any ideas, methods, instructions or products referred to in the content.

