Article

Bacterial Diversity Analysis of Chaozhou Sauerkraut Based on High-Throughput Sequencing of Different Production Methods

1
Department of Cuisine and Nutrition, Hanshan Normal University, Chaozhou 521000, China
2
College of Food Science and Engineering, Yangzhou University, Yangzhou 225000, China
3
Tenting Center, Yangzhou University, Yangzhou 225000, China
*
Authors to whom correspondence should be addressed.
Fermentation 2023, 9(3), 282; https://doi.org/10.3390/fermentation9030282
Submission received: 18 February 2023 / Revised: 9 March 2023 / Accepted: 10 March 2023 / Published: 13 March 2023
(This article belongs to the Special Issue Nutrition and Health of Fermented Foods, 2nd Edition)

Abstract

:
In this study, high-throughput sequencing technology was used to analyze the bacterial diversity of sauerkraut produced at home and in factories in Chaozhou. The differences in bacterial community structure among different sauerkraut samples were studied by diversity analysis and heat map analysis, and the dominant bacterial genera were analyzed. The results showed that 54 phyla and 622 genera were identified from 10 Chaozhou sauerkraut samples. The bacterial community structures of Chaozhou sauerkraut produced by five factories were similar, and the dominant bacterial genera were the same, which were Lactobacillus, Pediococcus and Weissella. The dominant genus in the sauerkraut samples produced by three families was similar to that in samples produced by the factories. However, the samples from two other families were quite different, and there may be environmental pollution. The samples may also contain possible pathogenic microorganisms such as Pseudomonas and Vibrio. Overall, there were still some differences in the bacterial community structure of Chaozhou sauerkraut factory-produced and household-handmade samples. To the best of our knowledge, this paper is the first to compare the bacterial diversity of homemade and factory-produced Chaozhou sauerkraut, laying the foundation for further research on Chaozhou sauerkraut.

1. Introduction

Vegetable fermentation was originally developed for long-term preservation, and fermented vegetables have a long history in China. Sichuan pickles, for example, are a typical representative of traditional Chinese fermented food whose history can be traced back to the ancient Shang Dynasty [1]. Sauerkraut fermented by mustard is a popular processed vegetable with a unique flavor [2]. As a condiment, it is widely used in the preparation of various local dishes, such as sauerkraut fish, sauerkraut soup and sauerkraut hot pot [3]. Mustard is an important raw material in sauerkraut that is rich in chlorophyll, dietary fiber, vitamin C, flavonoids and other nutrients and bioactive substances [2,4,5]. During the fermentation process, mustard not only produces a unique flavor [6] but also produces organic acids and enzymes other than the nutritional components of mustard that have the effects of promoting digestion and regulating physiological functions [7,8,9].
Among fermented mustards, sauerkraut (Brassica juncea (L.) Czerniak.) is an obvious feature. It is naturally fermented from the raw material Brassica juncea. Fermented Chaozhou sauerkraut, golden in color, pleasing to the eye, fragrant and refreshing, can be eaten both raw and cooked, and is the most classic sauerkraut for Chaoshan people to eat in white porridge. It is also an essential dish that many Chaozhou Chinese carry with them on trips overseas. At present, Chaozhou pickles are factory-produced or handmade by households. Chaozhou sauerkraut can be produced by natural fermentation of fresh vegetables with natural microorganisms or by adding aged sauerkraut brine. In short, after the mustard is harvested, the old and yellow leaves are removed, the sediment is washed off, and then the leaves are exposed to the sun for half a day to soften them and reduce the surface moisture. Coarse salt is added (the weight ratio of mustard to coarse salt is about 7:1), and the leaves are then kneaded and marinated. The marinated mustard greens are then put into a large ceramic vats and pressed tightly with heavy stones. After two or three days, the mustard greens are marinated to produce vegetable juice, and then an appropriate amount of hot rice soup is added to the vat to help fermentation. After waiting for more than 10 days, the pickled vegetables in the vat develop a strong, sour smell and are ready to be eaten or sold.
Microorganisms, as a key factor in sauerkraut fermentation, have attracted much attention from scholars at home and abroad in recent years. Studies on microbial diversity in fermented sauerkraut are traditionally carried out by culture methods, but in fact, there are a large number of uncultured microorganisms in fermented sauerkraut. Thanks to the continuous development of modern molecular biology methods, high-throughput sequencing technology has been widely used in the study of microbial diversity in a variety of ecosystems [10]. The method has the characteristics of high accuracy, high throughput, high sensitivity and low operating cost and is very suitable for the study of microbial diversity in fermented sauerkraut [11]. AN et al. [12] compared and analyzed the microbial community structure of 22 pickles from domestic and industrial sources in northeastern China through Illumina MiSeq sequencing. Rao et al. [13] analyzed the microbial community characteristics of Sichuan pickles through high-throughput sequencing technology. At present, the research is mainly focused on the northeastern sauerkraut [14] and Sichuan pickles [15]. However, there are few, if any, studies of Chaozhou sauerkraut. Therefore, this study used high-throughput sequencing technology to analyze and compare the differences in microbial diversity in Chaozhou sauerkraut made by different manufacturers and households. This paper provides basic support for further research on Chaozhou sauerkraut.

2. Materials and Methods

2.1. Sample Collection

Chaozhou sauerkraut samples were mainly collected from mature sauerkraut fermented for 20–25 days, and they were all similarly fermented according to the formula described in the introduction. However, factory-made samples had rice soup added once during the production process, whereas homemade samples had rice soup added multiple times every 1 to 2 days. Among them, samples F1 and F2 produced by factories (group F) were collected from Nanqiao Market in Chaozhou City, Guangdong Province, China, and F3–F5 were collected from Fengchun Market. Homemade (group H) Chaozhou sauerkraut samples were collected from Jiangdong Town, a suburb of Chaozhou City, and labeled H1–H5. In short, the same amount of sour soup was taken from the upper, middle and lower parts of the fermentation container, mixed evenly and put into a sterile container for one sampling. All samples were stored at −80 °C until detection.

2.2. DNA Extraction and PCR Amplification

Total genomic DNA from samples was extracted using the CTAB method [16]. DNA concentration and purity were monitored on 1% agarose gels. According to the concentration, DNA was diluted to 1 ng/µL using sterile water.
16S rRNA genes of distinct regions (16S V3-V4) were amplified using specific primers (341F (5′-CCTAYGGGRBGCASCAG-3′) and 806R (5′-GGACTACNNGGGTATCTAAT-3′)) with barcodes. All PCRs were carried out with 15 µL of Phusion® High-Fidelity PCR Master Mix (New England Biolabs, Ipswich, MA, USA), 2 µM forward and reverse primers, and approximately 10 ng of template DNA. Thermal cycling consisted of initial denaturation at 98 °C for 1 min, followed by 30 cycles of denaturation at 98 °C for 10 s, annealing at 50 °C for 30 s, elongation at 72 °C for 30 s, and finally, 72 °C for 5 min.
The same volume of 1X TAE buffer was mixed with PCR products, and electrophoresis was performed on a 2% agarose gel for detection. PCR products were mixed in equidensity ratios. Then, the mixed PCR products were purified with a Qiagen Gel Extraction Kit (Qiagen, Hilden, North Rhine-Westphalia, Germany).

2.3. Illumina NovaSeq Sequencing

Sequencing libraries were generated using the TruSeq® DNA PCR-Free Sample Preparation Kit (Illumina, San Diego, CA, USA) following the manufacturer’s recommendations, and index codes were added. The library quality was assessed on a Qubit@ 2.0 Fluorometer (Thermo Scientific, Waltham, MA, USA). Finally, the library was sequenced on an Illumina NovaSeq platform, and 250 bp paired-end reads were generated.

2.4. Bioinformatics Analysis

The analysis was conducted by following the “Atacama soil microbiome tutorial” of Qiime2docs along with customized program scripts (https://docs.qiime2.org/2019.1/ accessed on 10 February 2023). Briefly, raw data FASTQ files were imported into the format that could be operated by the QIIME2 system using the qiime tools import program. Demultiplexed sequences from each sample were quality-filtered and trimmed, denoised, and merged, and then the chimeric sequences were identified and removed using the QIIME2 dada2 plugin to obtain the feature table of amplicon sequence variants (ASVs) [17]. The QIIME2 feature-classifier plugin was then used to align ASV sequences to a pretrained SILVA 138 99% database (trimmed to the V3–V4 region bound by the 341F/806R primer pair) to generate the taxonomy table [18]. Any contamination including mitochondrial and chloroplast sequences was filtered using the QIIME2 feature-table plugin. Appropriate methods, including ANCOM, ANOVA, Kruskal–Wallis, LEfSe and DEseq2, were employed to identify bacteria with different abundances among samples and groups [19,20]. Diversity metrics were calculated using the core-diversity plugin within QIIME2. Feature-level alpha diversity indices, such as observed OTUs, Chao1 richness estimator, Shannon diversity index, and Faith’s phylogenetics diversity index, were calculated to estimate the microbial diversity within an individual sample. Beta diversity distance measurements, including Bray Curtis, unweighted UniFrac and weighted UniFrac, were performed to investigate the structural variation of microbial communities across samples and then visualized via principal coordinate analysis (PCoA) and nonmetric multidimensional scaling (NMDS) [21]. PLS-DA (partial least squares discriminant analysis) was also introduced as a supervised model to reveal the microbiota variation among groups using the “plsda” function in the R package “mixOmics” [22]. Redundancy analysis (RDA) was performed to reveal the association of microbial communities in relation to environmental factors based on the relative abundances of microbial species at different taxa levels using the R package “vegan”. Co-occurrence analysis was performed by calculating Spearman’s rank correlations between predominant taxa, and the network plot was used to display the associations among taxa. In addition, the potential KEGG Ortholog (KO) functional profiles of microbial communities were predicted with PICRUSt [23]. Unless specified above, the parameters used in the analysis were set as default.

2.5. Detection and Statistical Analysis of pH Value and Nitrite Content and Reducing Sugar Content

The pH value was measured by an FE20 pH meter (METTLER TOLEDO Int. Ltd., Greifensee, Switzerland). Nitrite content and reducing sugar content were determined using a commercial kit (Nanjing Jiancheng Biological Engineering Research Institute Co., Ltd., Nanjing, China) and according to its instructions. Statistical analysis was performed using SPSS 22 (Statistical Package for the Social Science, SPSS Ins., Chicago, IL, USA). The results are presented as the means ± SD, and the difference between the mean values of the two groups of samples was tested by t test. Values of p < 0.05 or p < 0.01 were considered statistically significant.

3. Results and Discussion

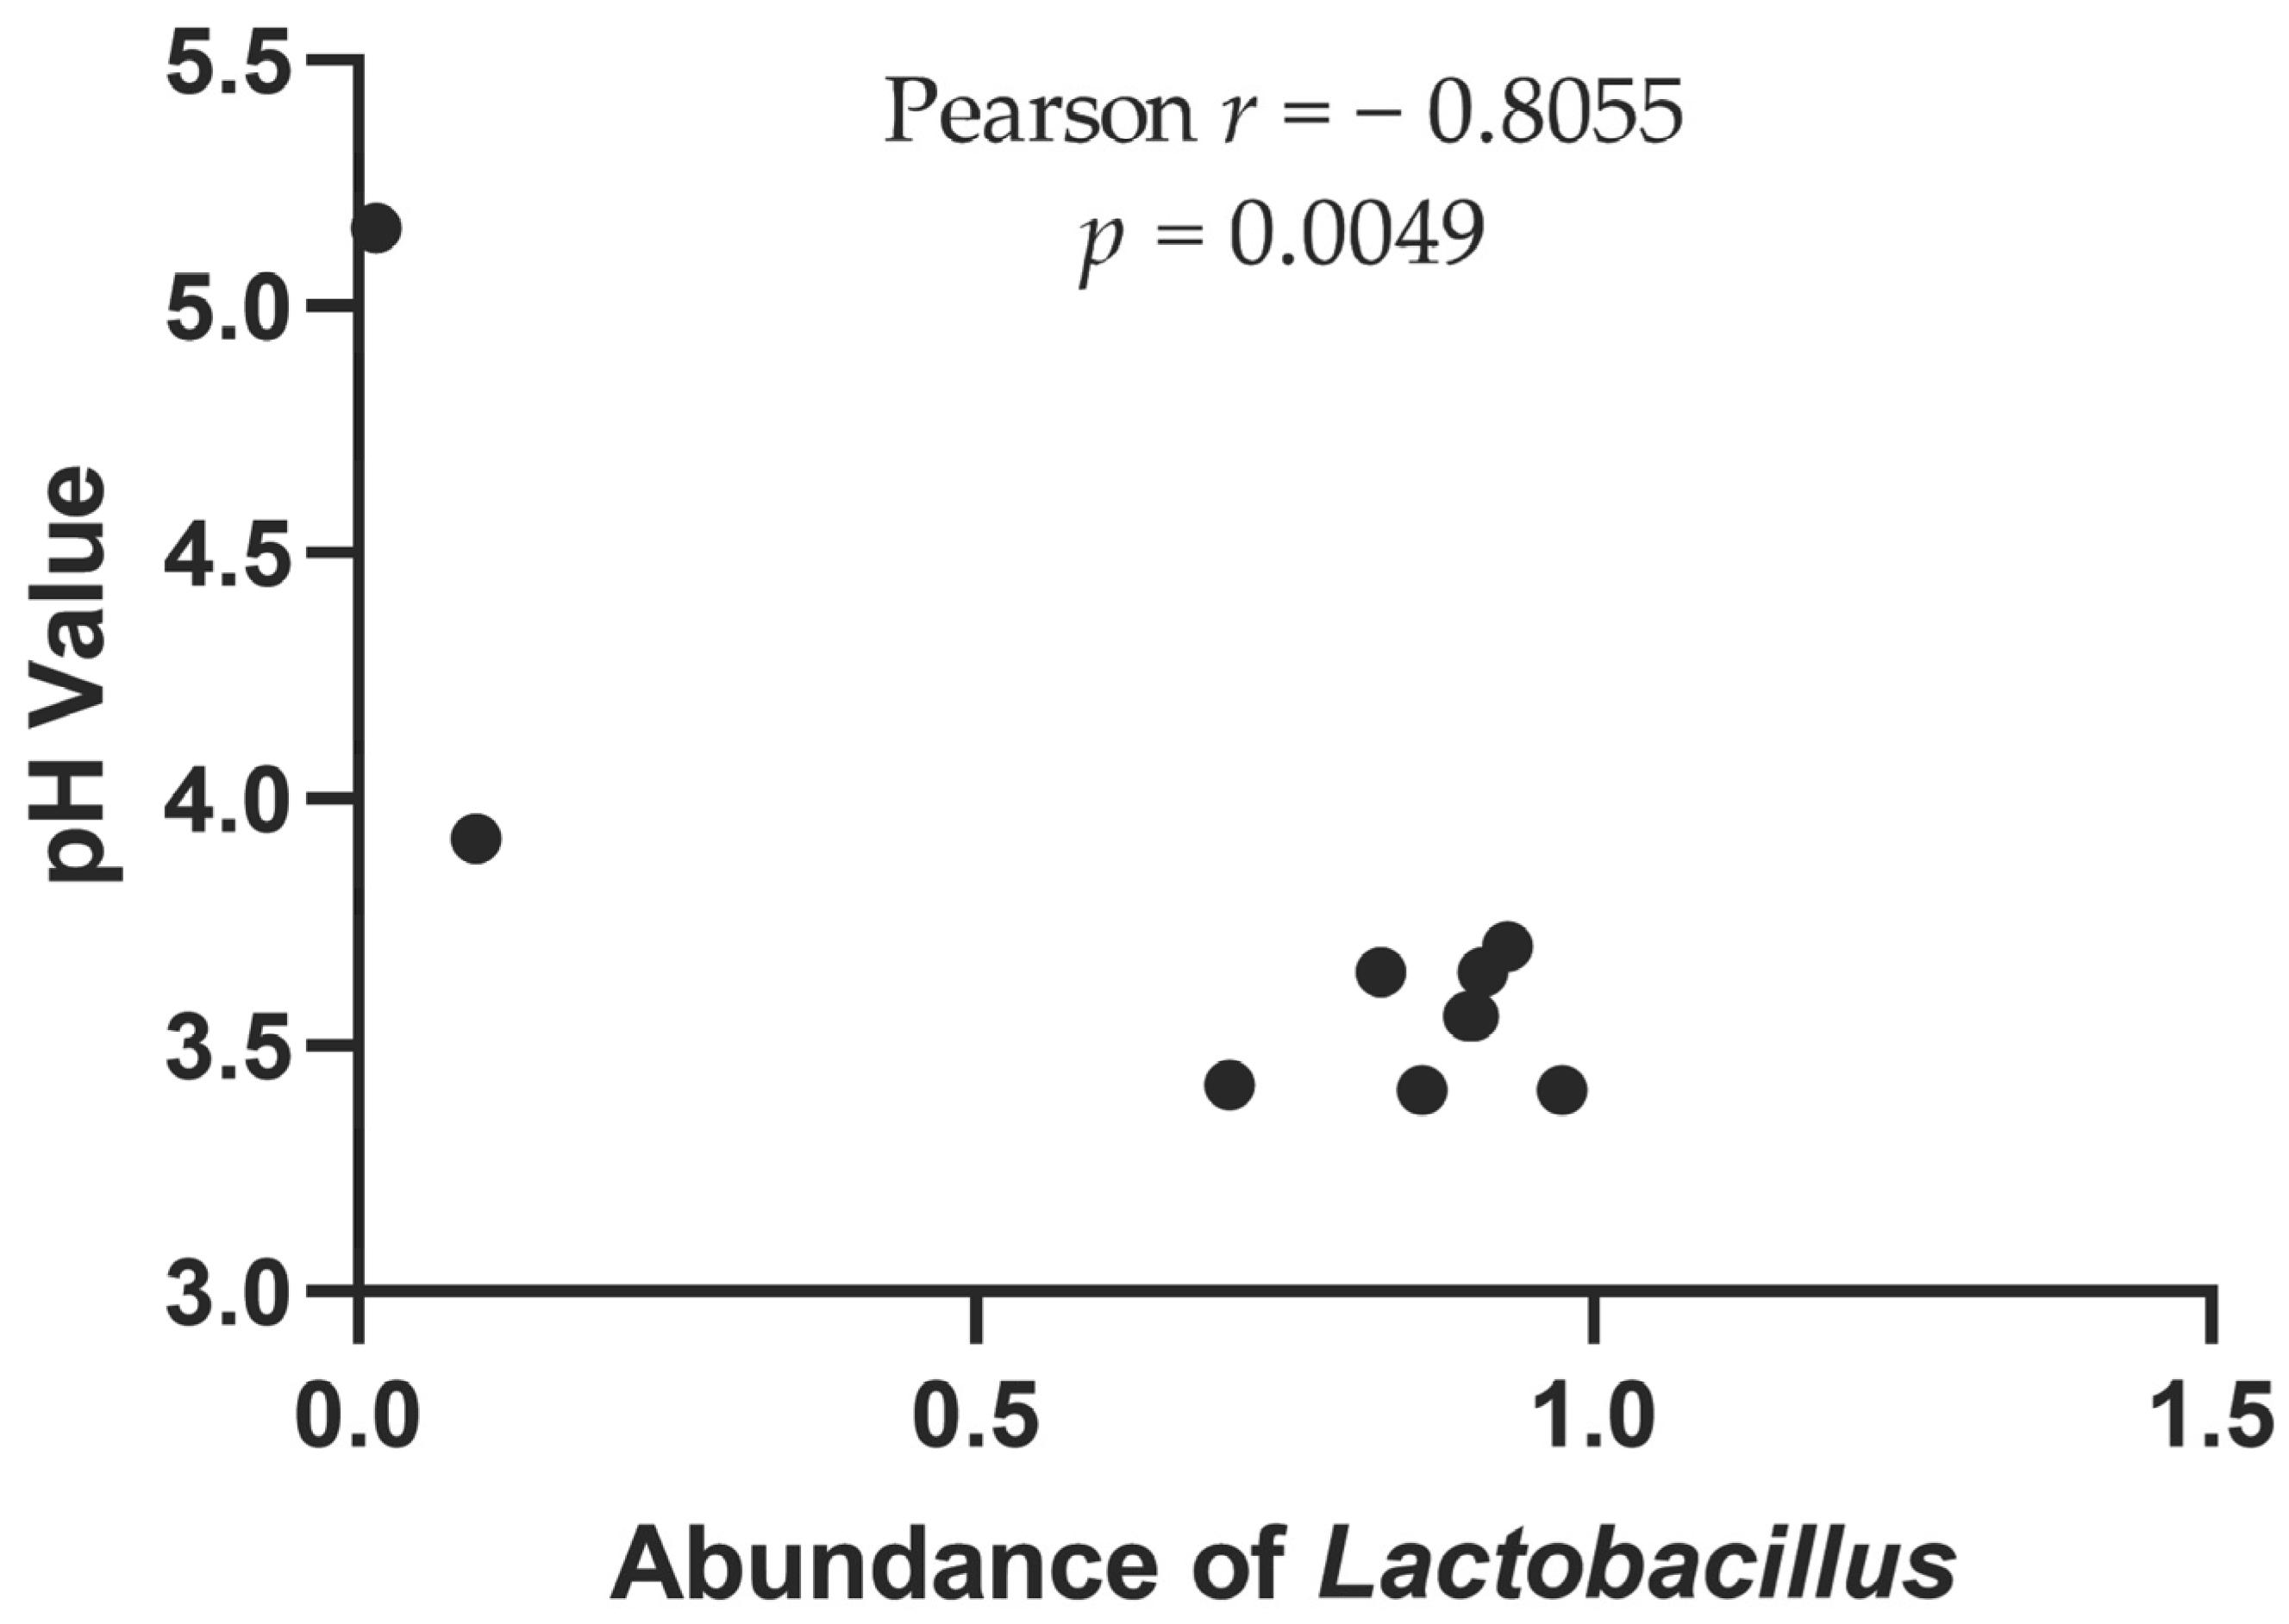
3.1. pH Value, Nitrite Content and Reducing Sugar Content

pH value and reducing sugar content are important indicators to measure the fermentation situation. Nitrite content is an important indicator of food safety. The test results (Table 1) showed that the pH values of the samples in group F were all below 3.7, and the standard deviation was small. The pH value of group H varied greatly among the samples, among which the pH value of H4 was 5.16, which deviated the most. The average nitrite content in both groups of samples was 0.35 mg/kg, but the H4 sample had the largest value, at 1.12 mg/kg. However, all samples were within the normal standard for nitrite content in pickled and fermented products. The reducing sugar content in the samples in group F was relatively close, fluctuating around 0.098 mg/mL. The reducing sugar content in the H group samples was relatively high, with the highest, of 0.86 mg/mL, in the H4 sample, which may be related to the method of adding cooked rice soup multiple times in the homemade process.

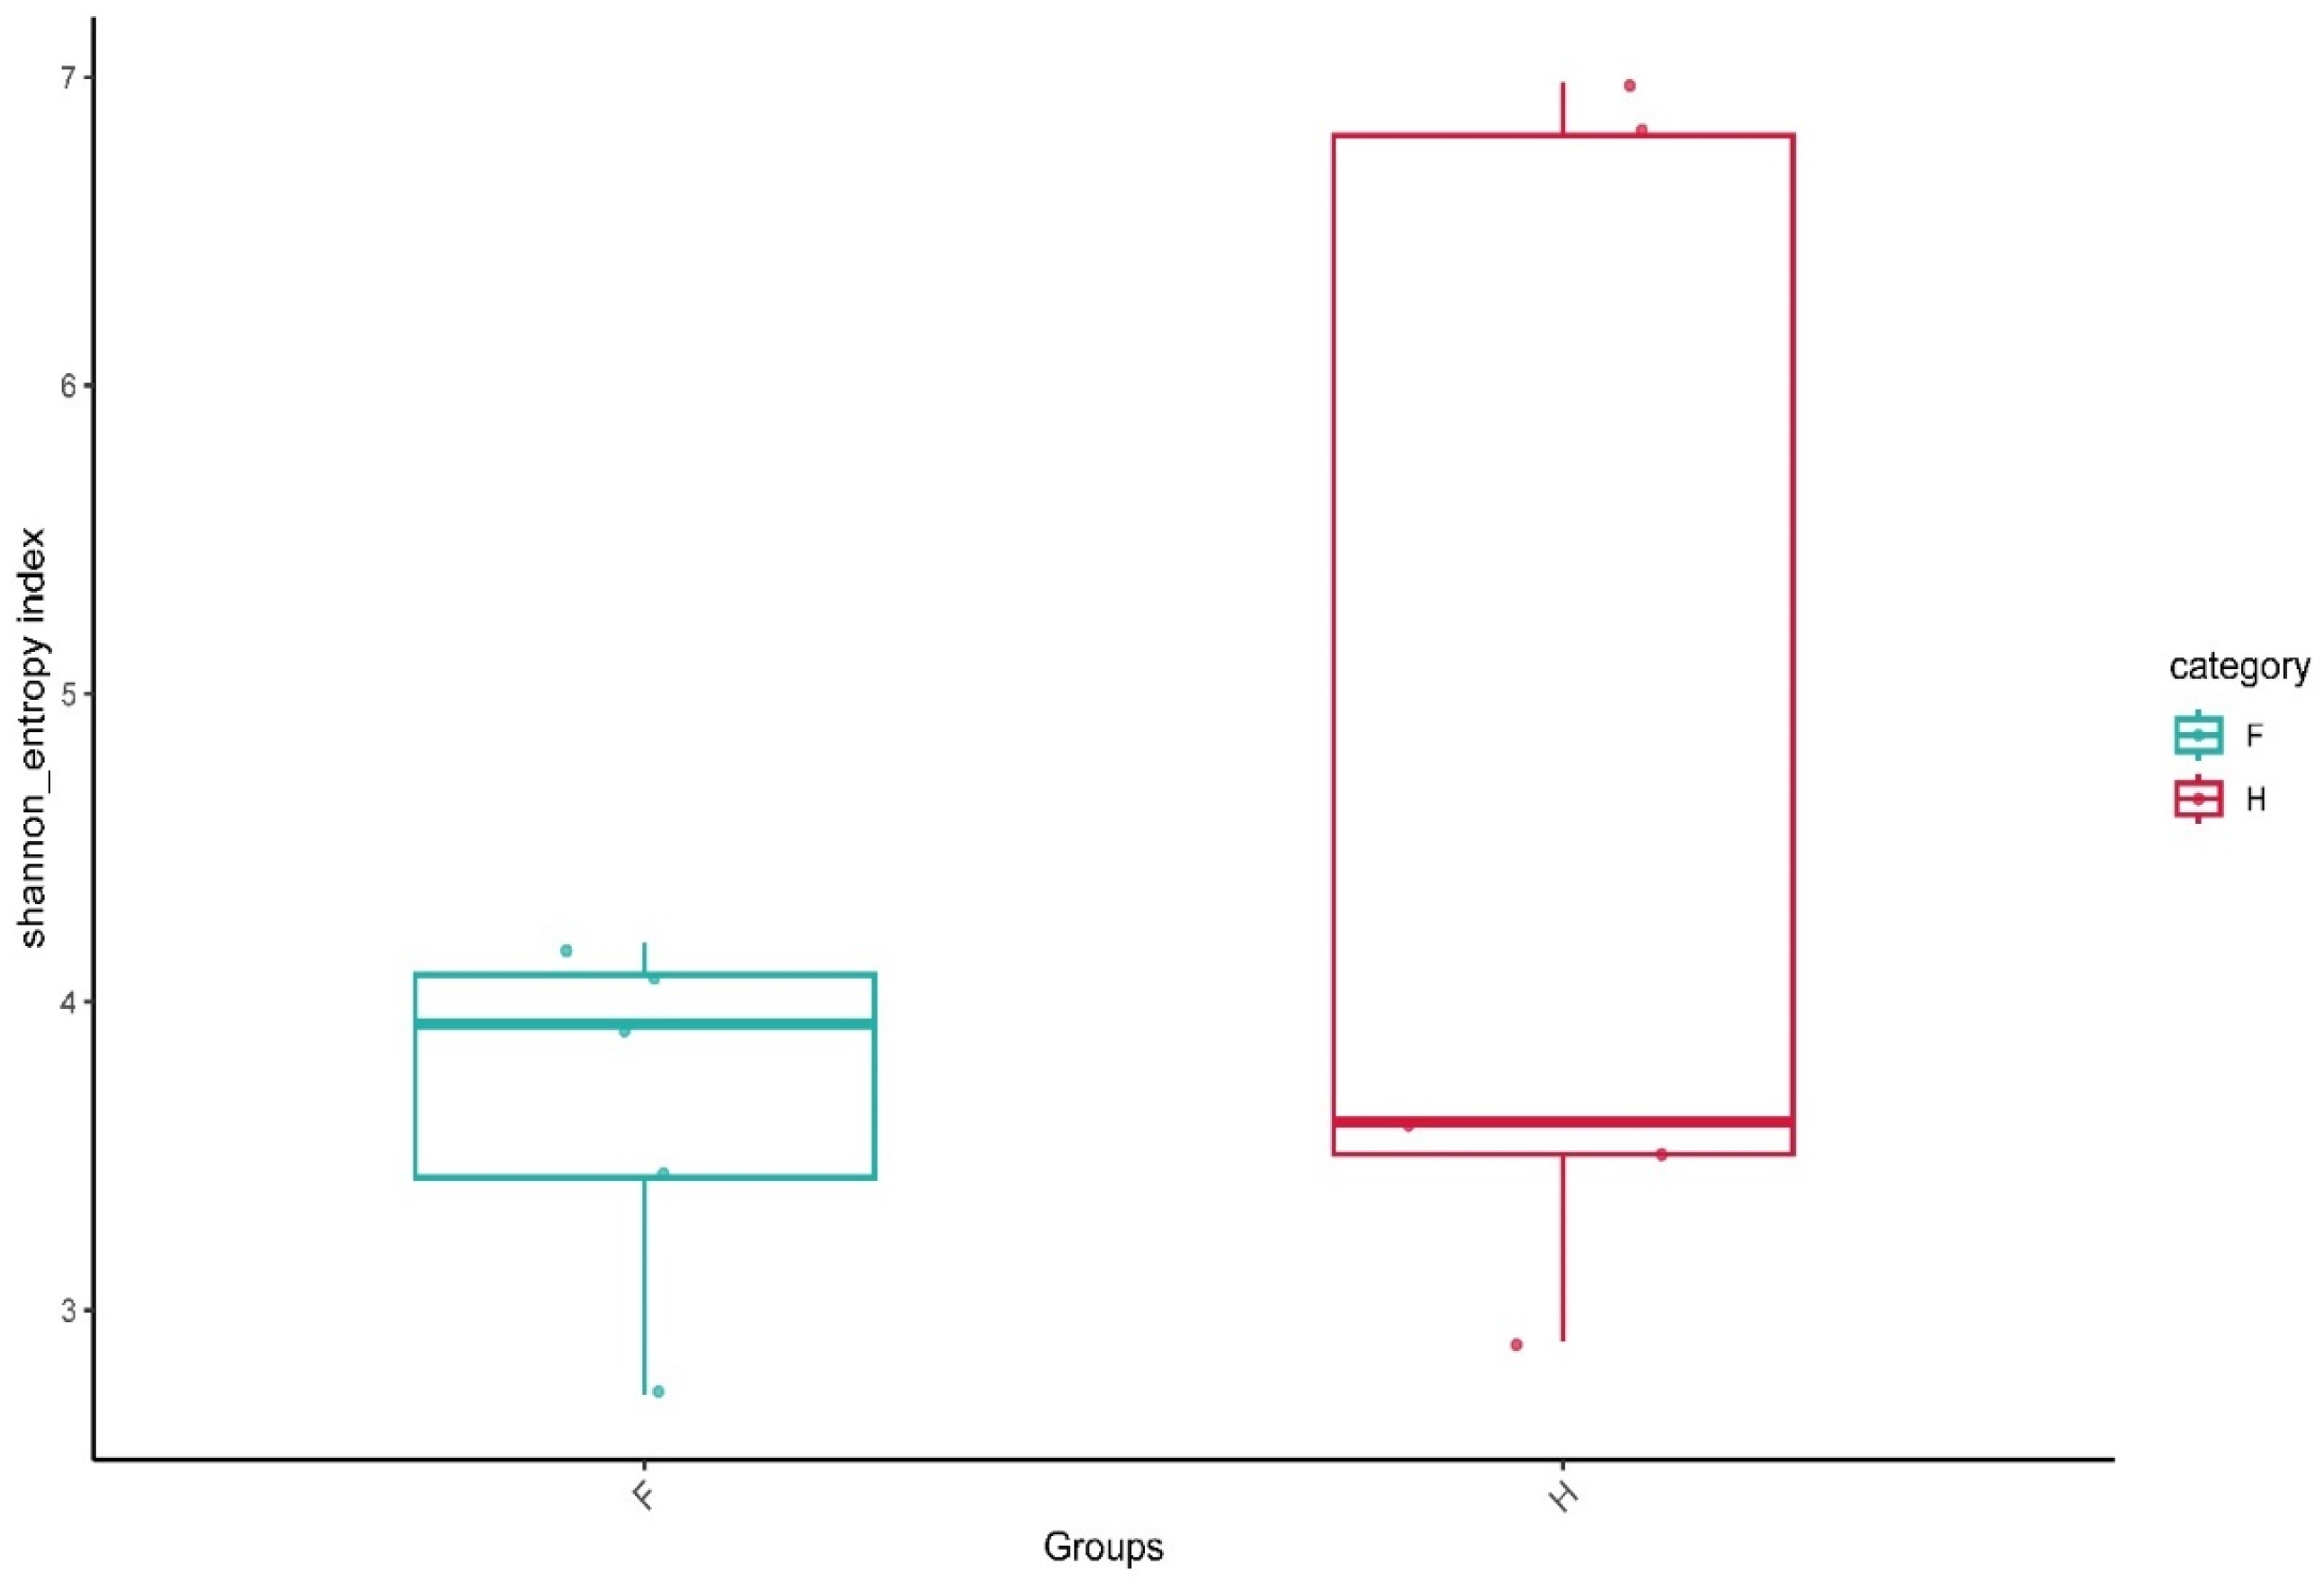
3.2. Statistical Analysis of the Alpha Diversity Index

The alpha diversity index is the analysis of species diversity in samples, including the richness and evenness of species composition in samples. The observed OTUs (observed features) and Shannon and Faith’s phylogenetic diversity are usually used to evaluate the species diversity of a sample. The higher the index, the more complex the diversity of the sample. As shown in Figure 1, the average Shannon index of Group F was lower than that of Group H, which seems to indicate that the bacterial community diversity of homemade sauerkraut is higher than that of factory-produced sauerkraut. The similarity of the samples in group F was relatively high, and the distribution of each sample point was relatively concentrated, while the samples in group H had relatively large differences, and the distribution of sample points was relatively scattered, especially that of two sample points that were far away from the median line. The difference between the two groups was, therefore, not significant. The reason may be related to large differences in the production environment of different families in the H group.

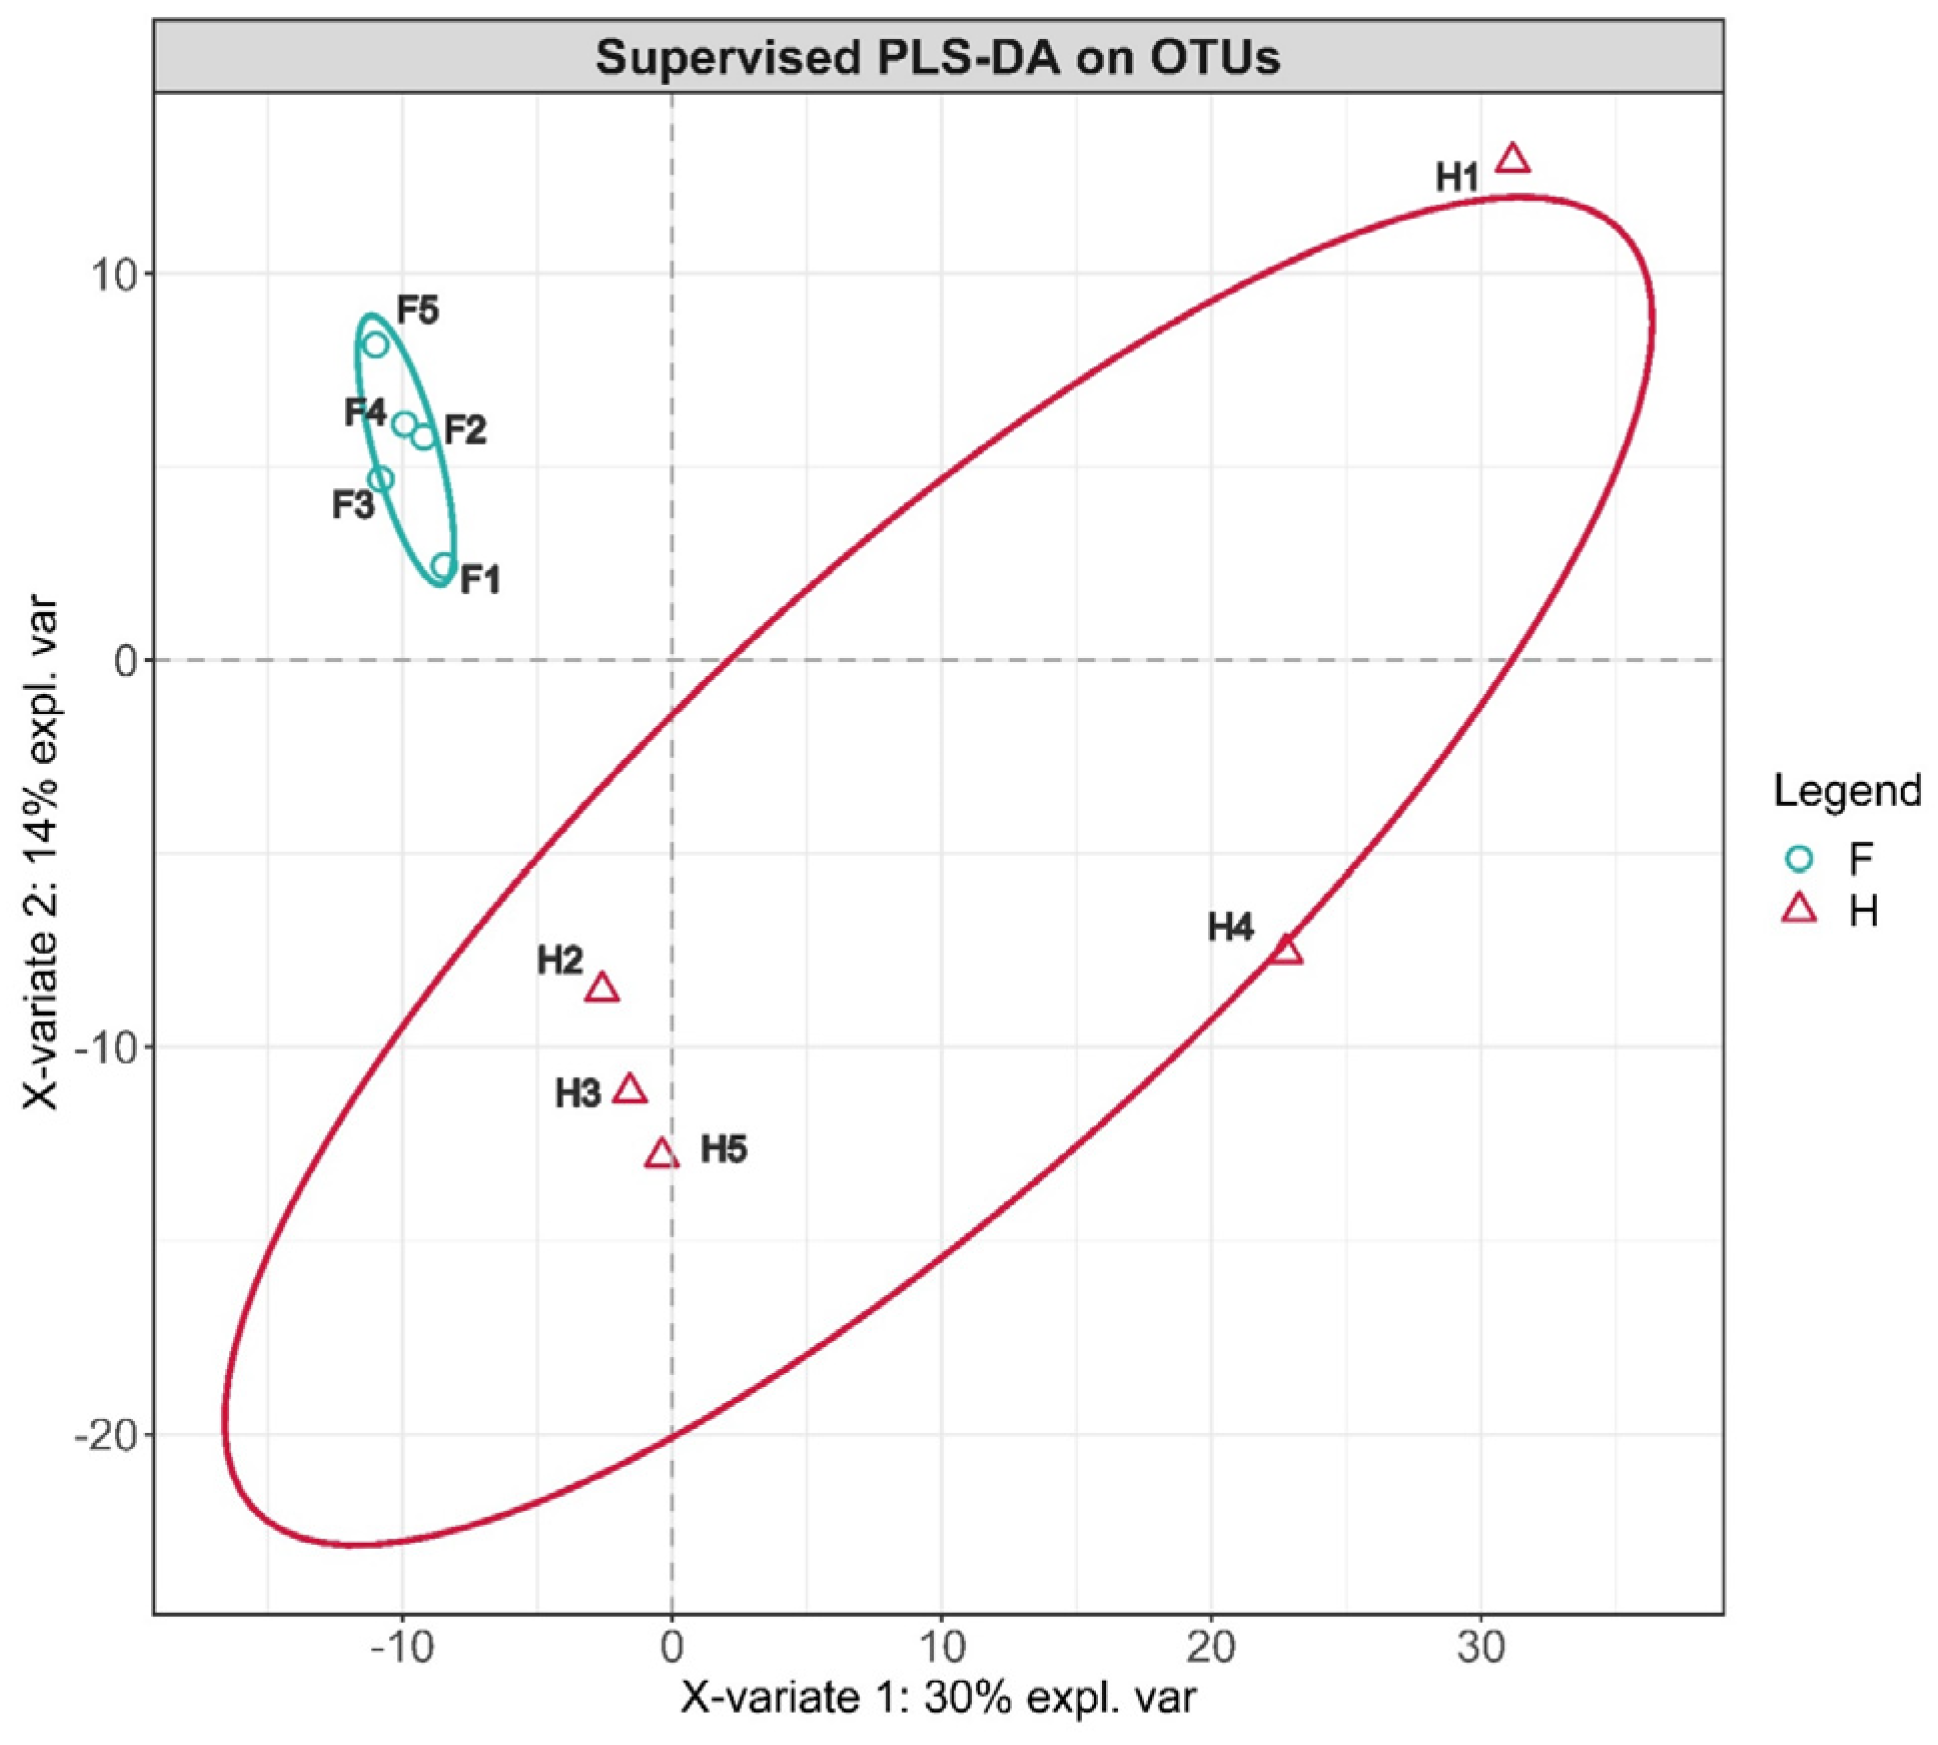
3.3. Beta Diversity Analysis

Beta diversity is a comparison of microbial community composition between different samples. Partial least squares discriminant analysis (PLS–DA) is a multivariate statistical analysis method for discriminant analysis. It is necessary to group the tested samples according to the category. When calculating the mathematical model, each group is distinguished, ignoring the random differences within the group and highlighting the systematic differences between groups. It has better sample discrimination performance when the observation factor is much larger than the number of samples. Based on all OTUs with abundance greater than 10, we performed PLS–DA analysis. As shown in Figure 2, it was found that the separation effect of the factory-processed Chaozhou sauerkraut and home-made Chaozhou sauerkraut samples along the two coordinates was obvious, indicating that the production method had a significant impact on the microbial community composition of the pickles. Among them, Group F was relatively concentrated, but H1 and H4 of Group H were far from the remaining three samples. This situation was consistent with the phenomenon shown in Figure 1.

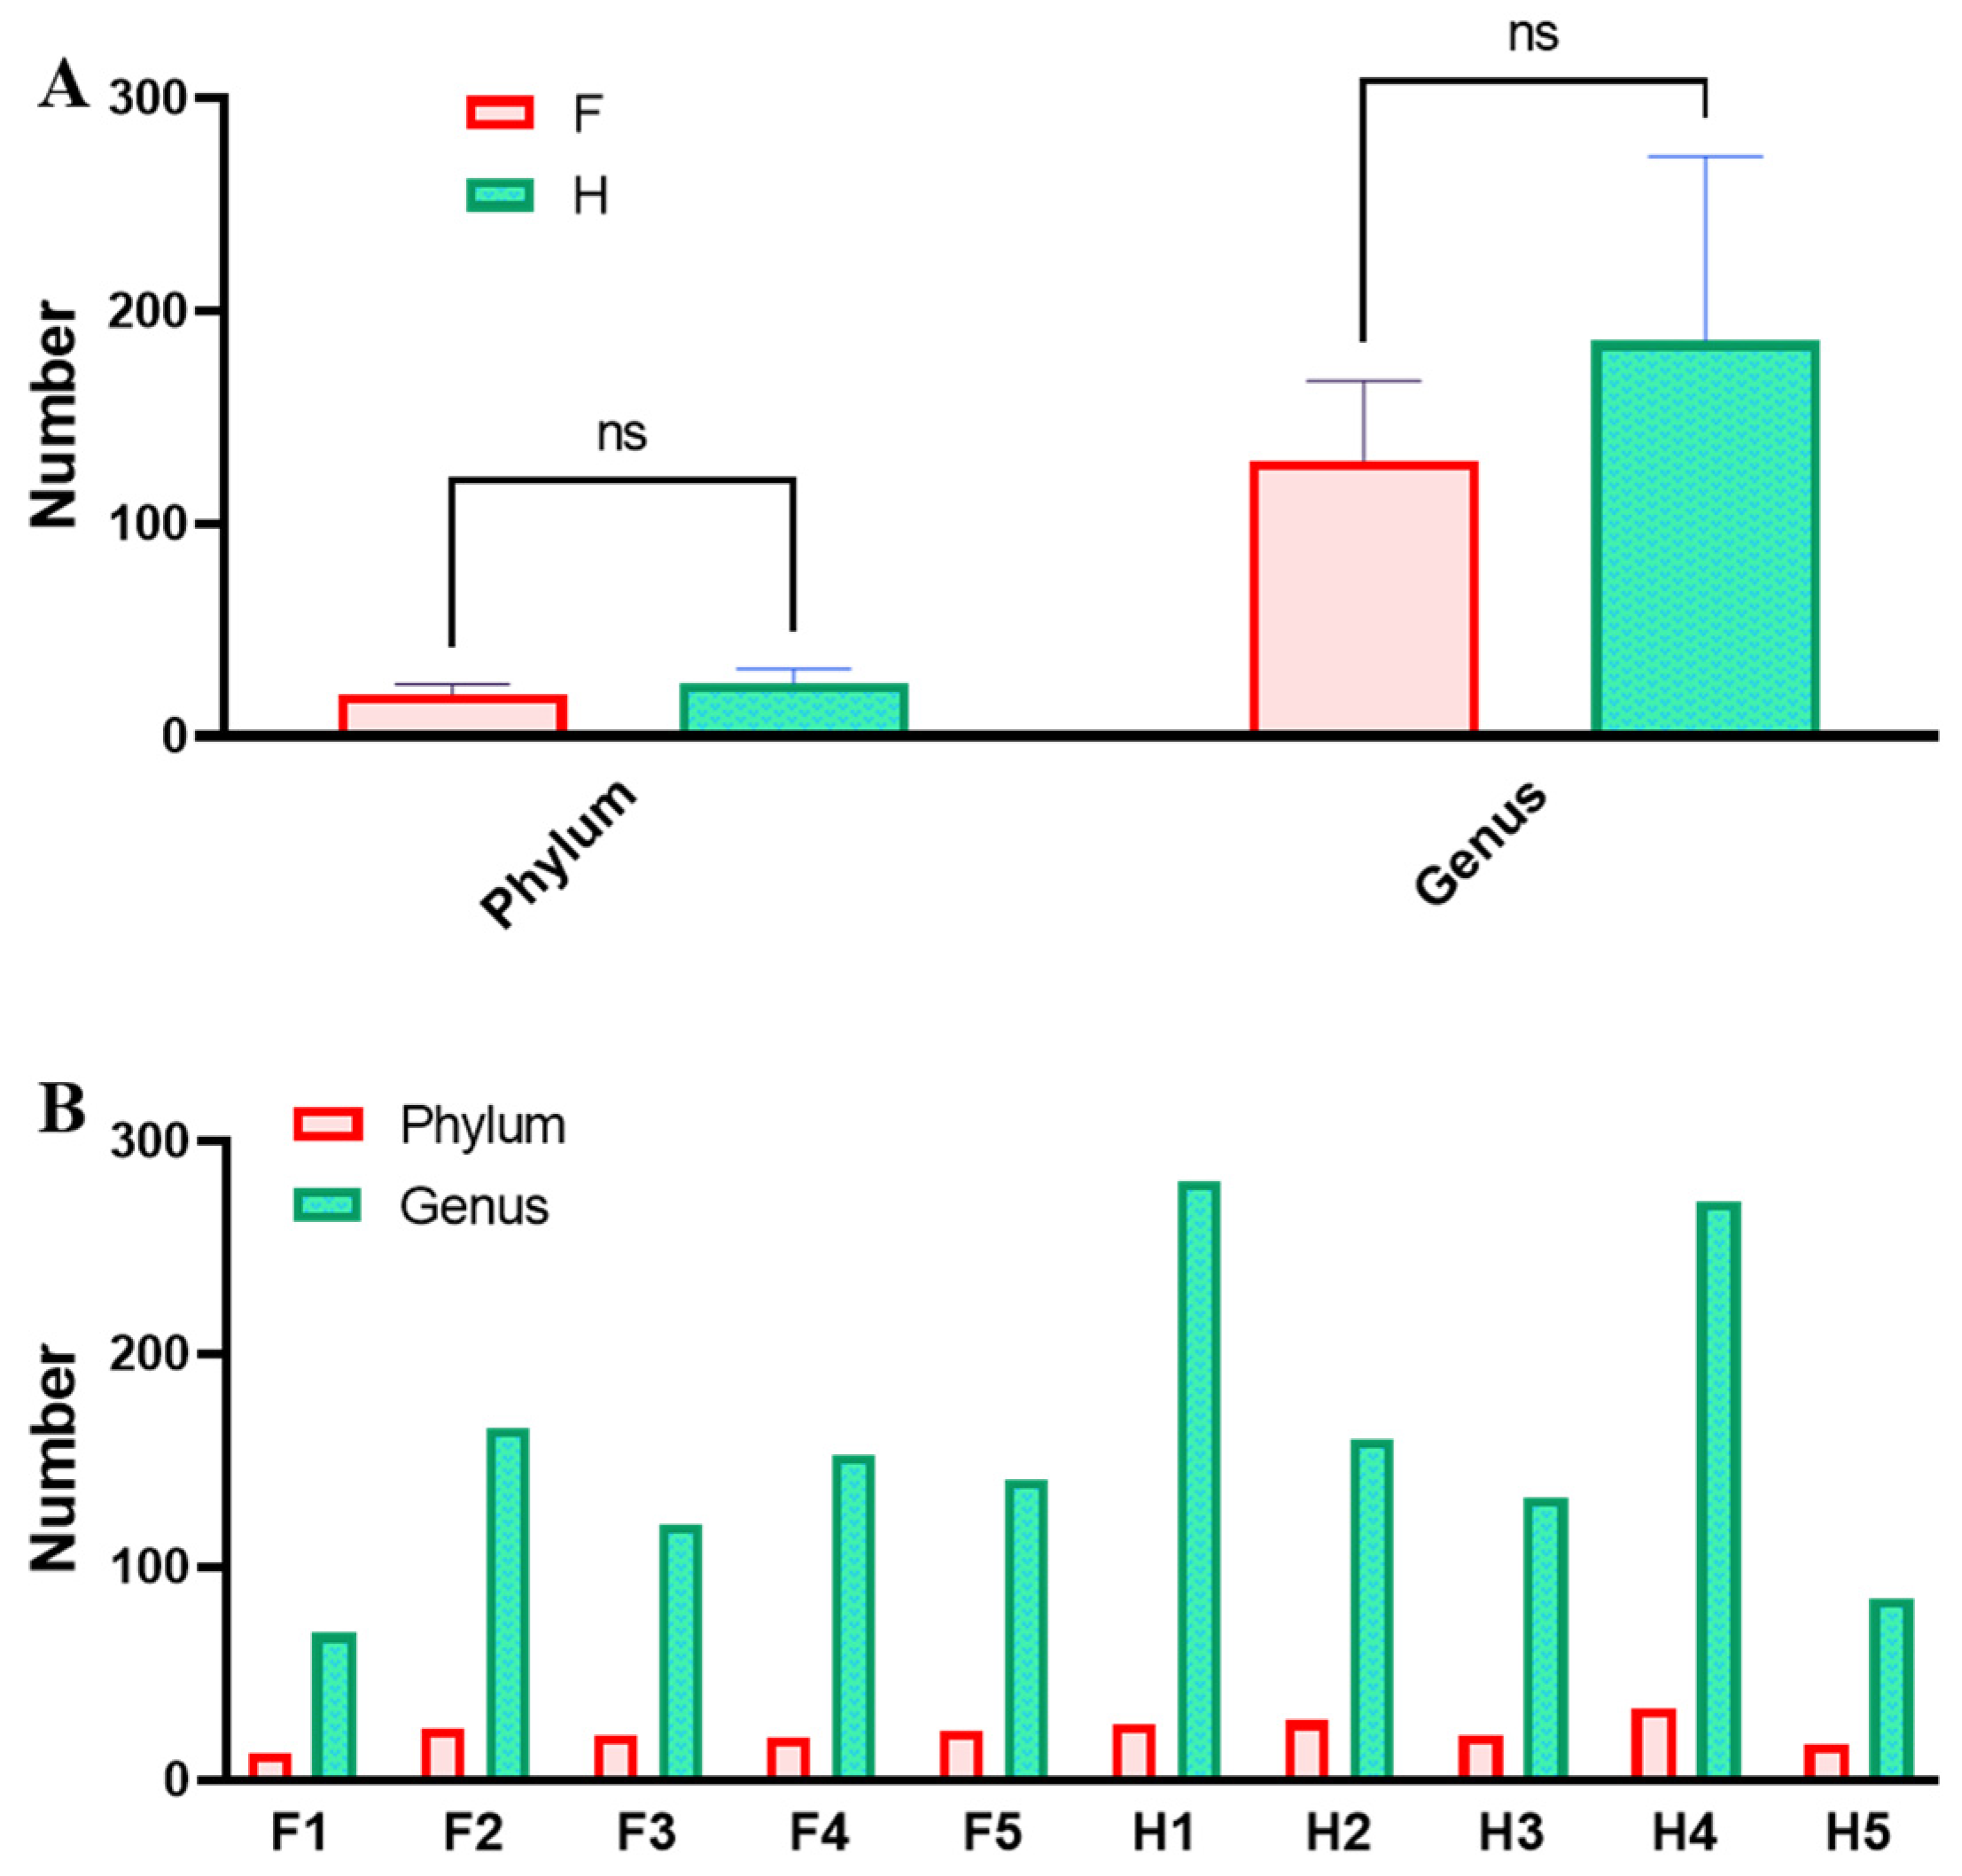
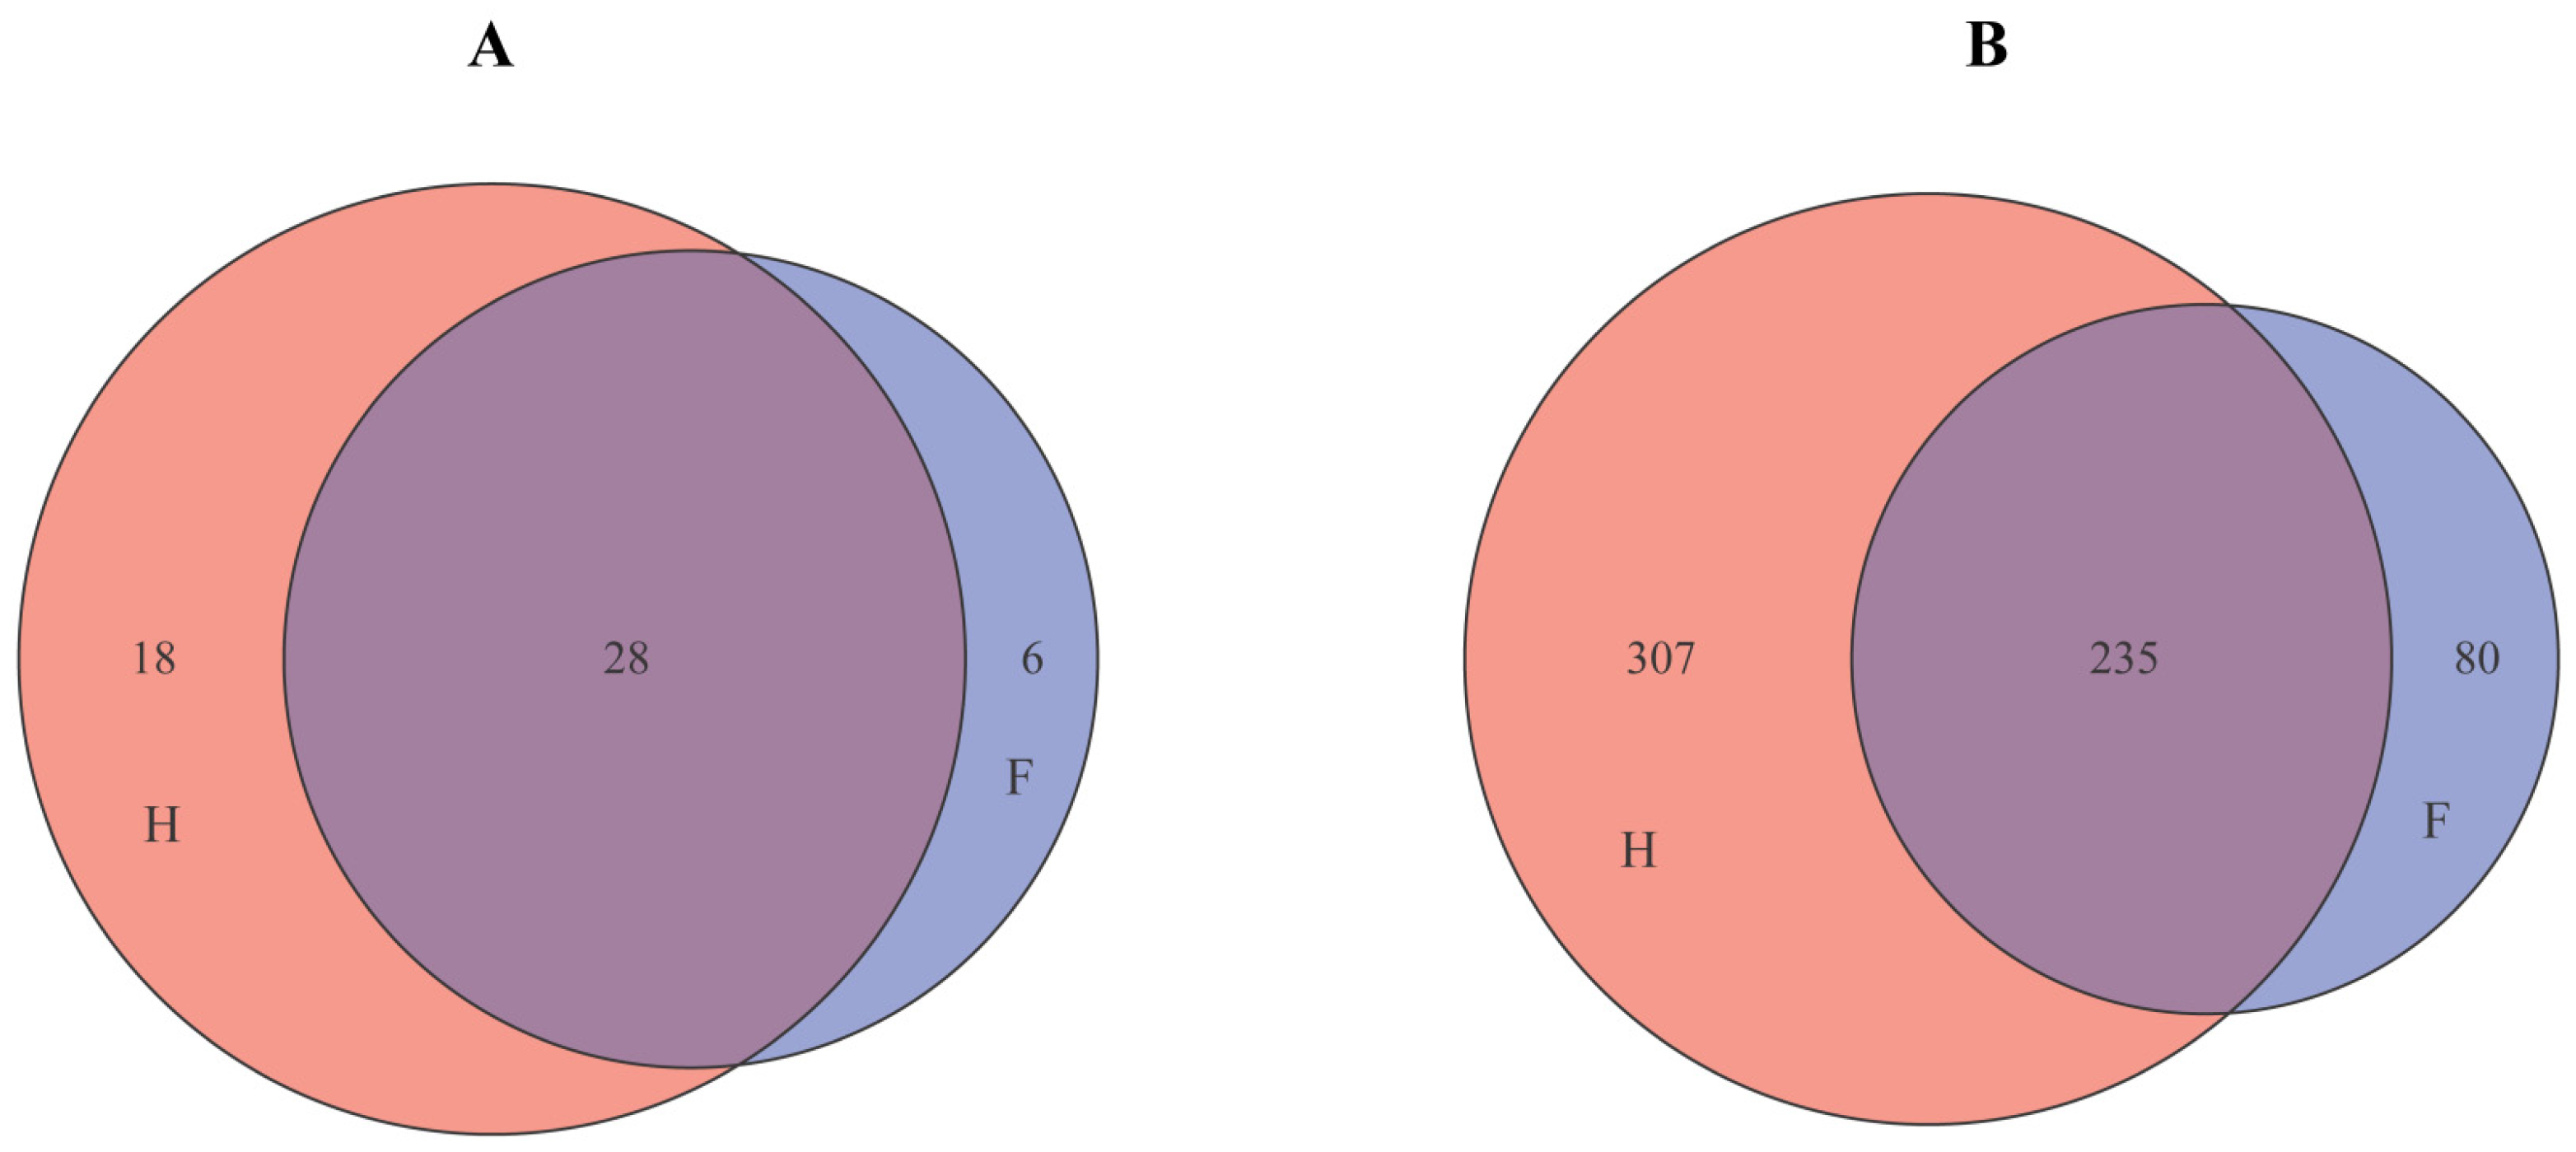
3.4. Analysis of Bacterial Community Structure Based on Phylum and Genus Levels

Phylum and genus levels are commonly used to analyze microbial composition. Through high-throughput sequencing analysis, 52 phyla and 622 genera of bacteria were identified from 10 Chaozhou sauerkraut samples. As shown in Figure 3, an average of 20.2 ± 4.32 phyla and 129.6 ± 37.73 genera were identified in group F. In group H, an average of 25.2 ± 6.53 phyla and 186.2 ± 86.76 genera were identified. The average number of bacteria in group F was lower than that in group H, indicating that the number of bacterial species in Chaozhou sauerkraut produced in factories was lower than that in Chaozhou sauerkraut produced by households in terms of phyla and genera. While the samples produced by different households showed great differences in terms of their numbers of phyla and genera, the bacteria in Chaozhou sauerkraut produced by the two methods showed no significant differences in numbers of phyla and genera (p > 0.05). Samples H1 and H4 had the highest number of genera, which may be the reason why they were different from other H samples. These findings are consistent with the results shown in Figure 2. The reason may be that the microorganisms in the environment of H1 and H4 were relatively complex, which caused a certain degree of contamination during the process of adding cooked rice soup many times.
A Venn diagram can intuitively reflect the similarity and overlap of bacterial composition in samples. Therefore, Venn diagram analysis was performed on the number of bacterial phyla and genera in the two groups of sauerkraut samples produced by factories or handmade by family households, and the results are shown in Figure 4. As shown in Figure 4A, there were 28 bacterial phyla in the two groups of sauerkraut samples, 18 bacterial phyla unique to the samples of household (H) sauerkraut, and only 6 bacterial phyla unique to the samples of factory (F) sauerkraut. From Figure 4B, it can be seen that at the genus level, there were 235 mutual bacterial genera in the two groups of sauerkraut samples, 307 unique bacterial genera in homemade (H) sauerkraut samples, and only 80 unique bacterial genera in the factory (F) produced sauerkraut samples. It can be seen that there are still some differences in the species and quantities of bacteria in Chaozhou sauerkraut in different production methods.

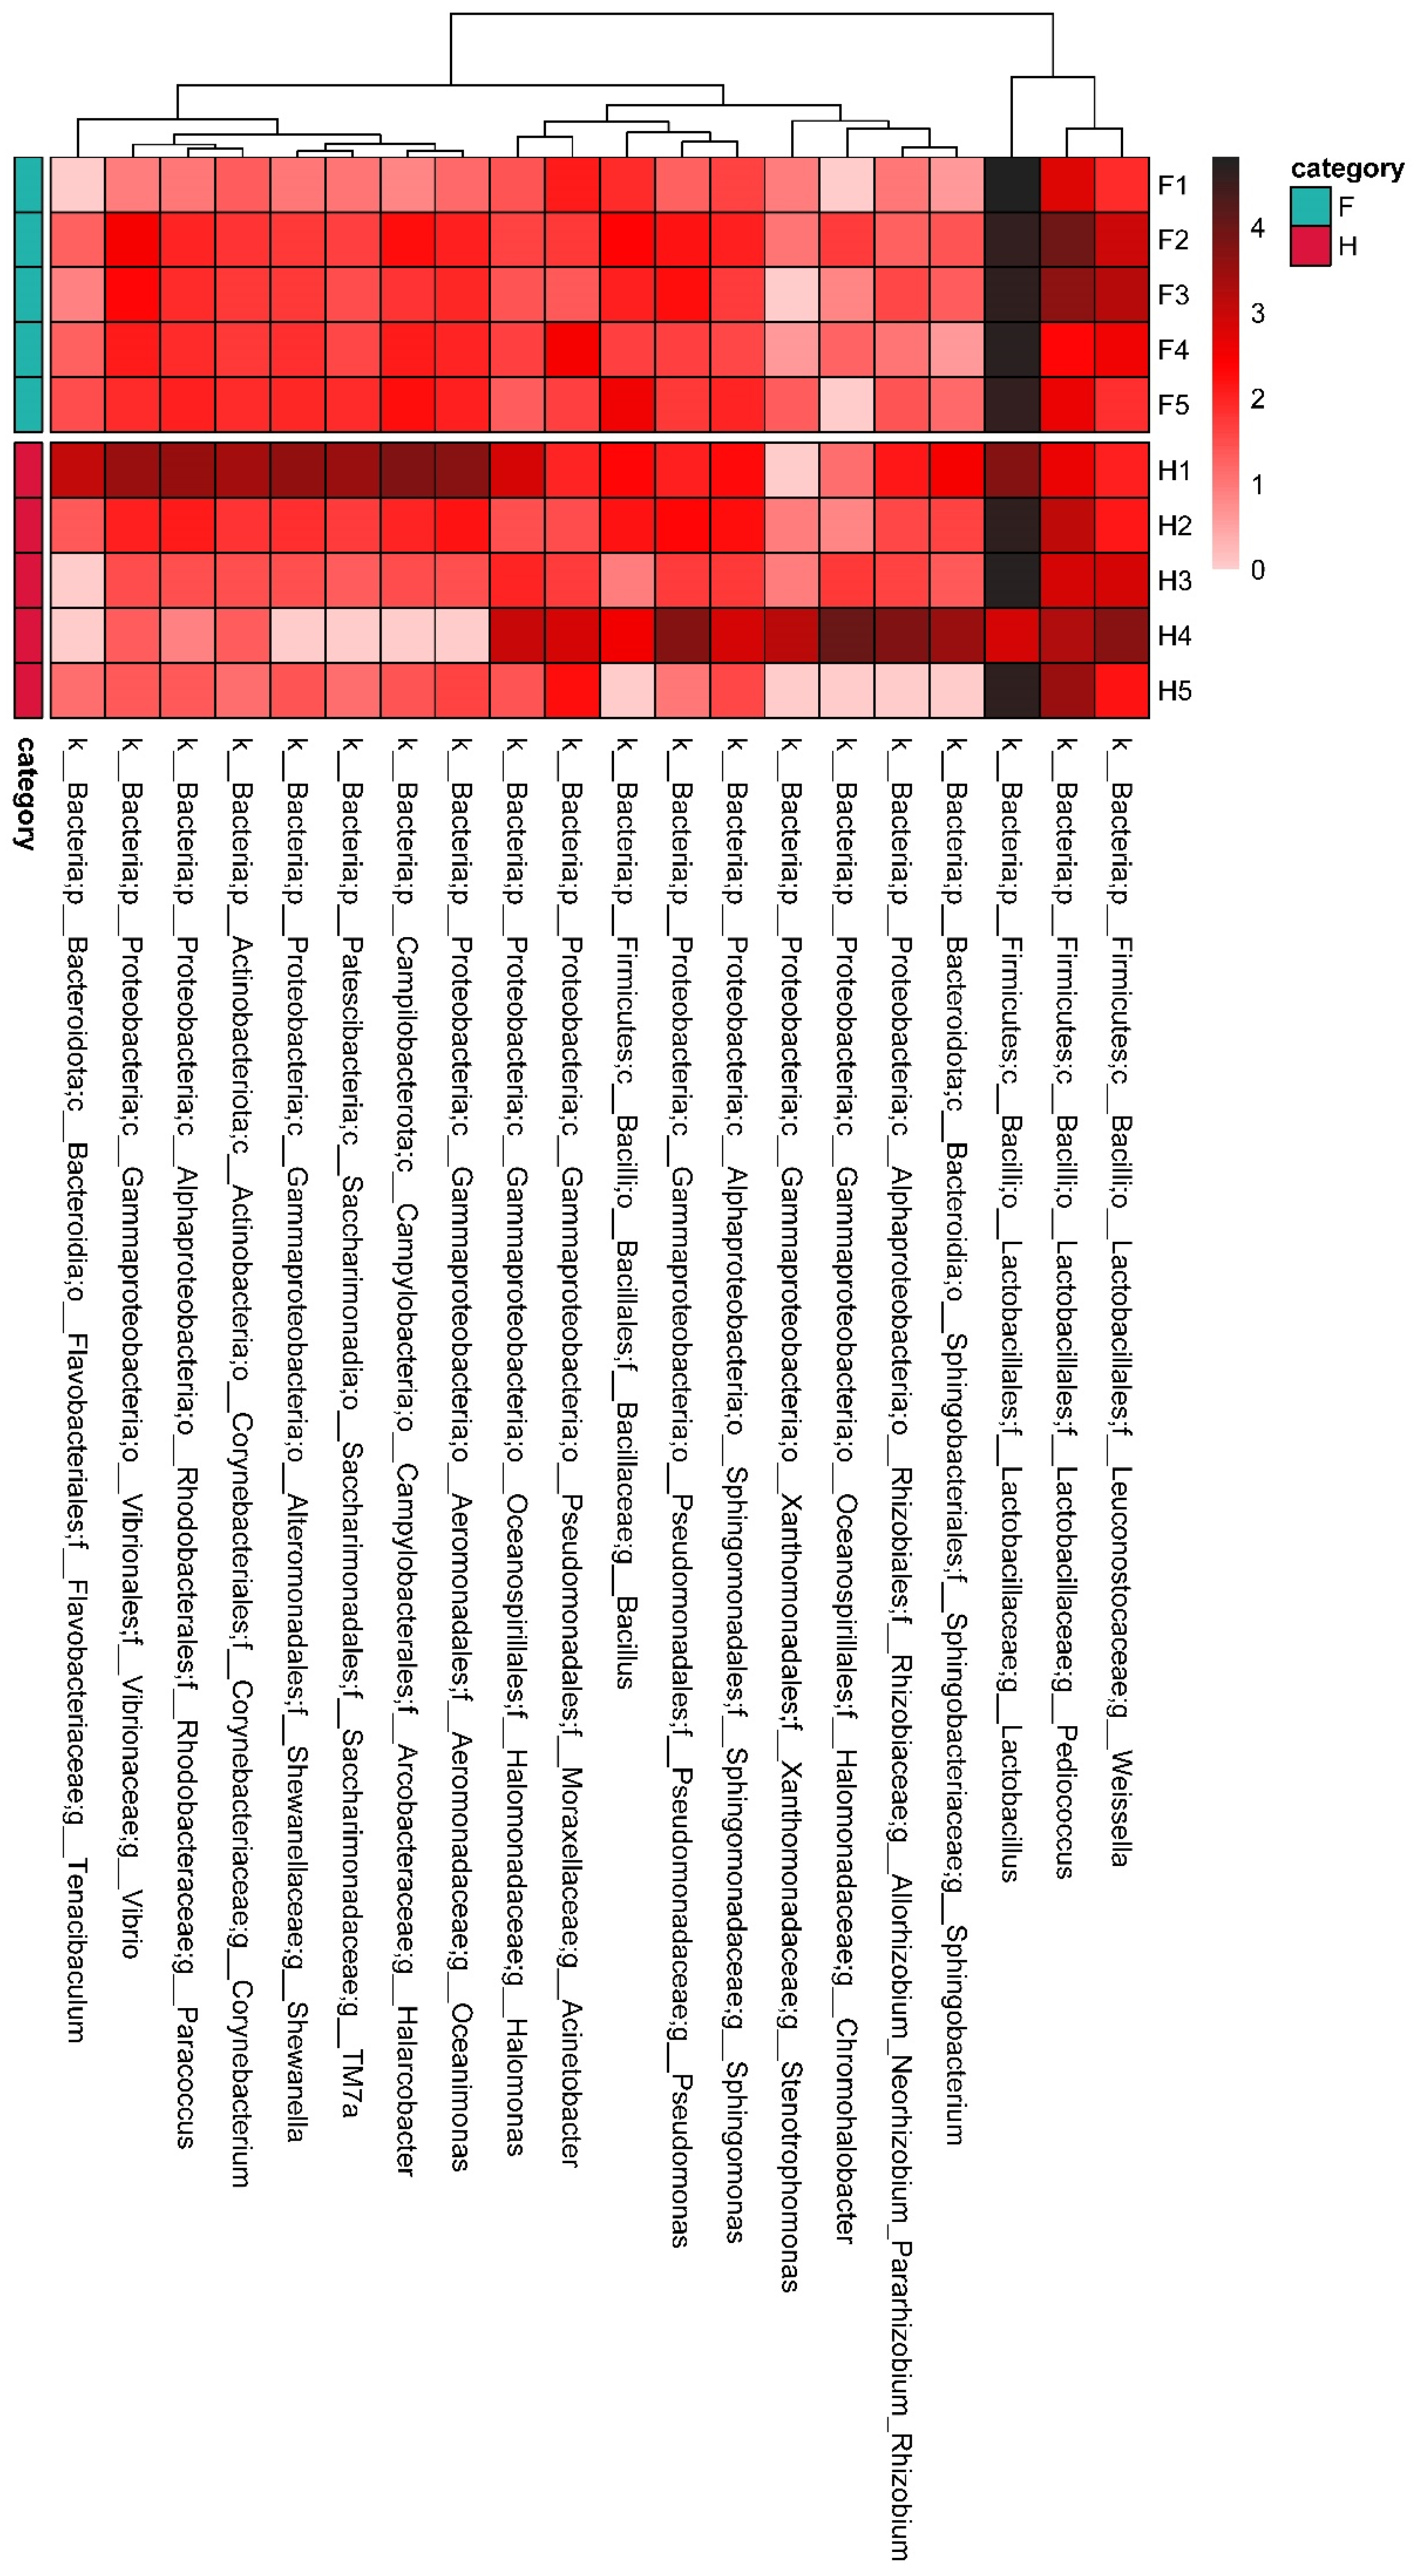
3.5. Cluster Analysis

In the heatmap diagram, a color block represents the abundance of a genus in a sample, reflecting the similarity of community composition of multiple samples at the genus level. In order to further explore the differences in the structure and relative abundance of bacteria at the genus level, the top 20 genera in terms of absolute abundance were selected for heat map analysis (Figure 5). The results showed that there were obvious inter-generic differences among the samples. Despite sharing the same dominant genera, their relative abundances varied widely. The dominant genera in sauerkraut samples were Lactobacillus, Pediococcus and Weissella, which belonged to Lactobacillales. Lactobacillus is an important acid-producing genus [24], and the abundance of Lactobacillus in H1 and H4 samples shown in the heat map was lower, which may be the reason for their higher pH values in Table 1.

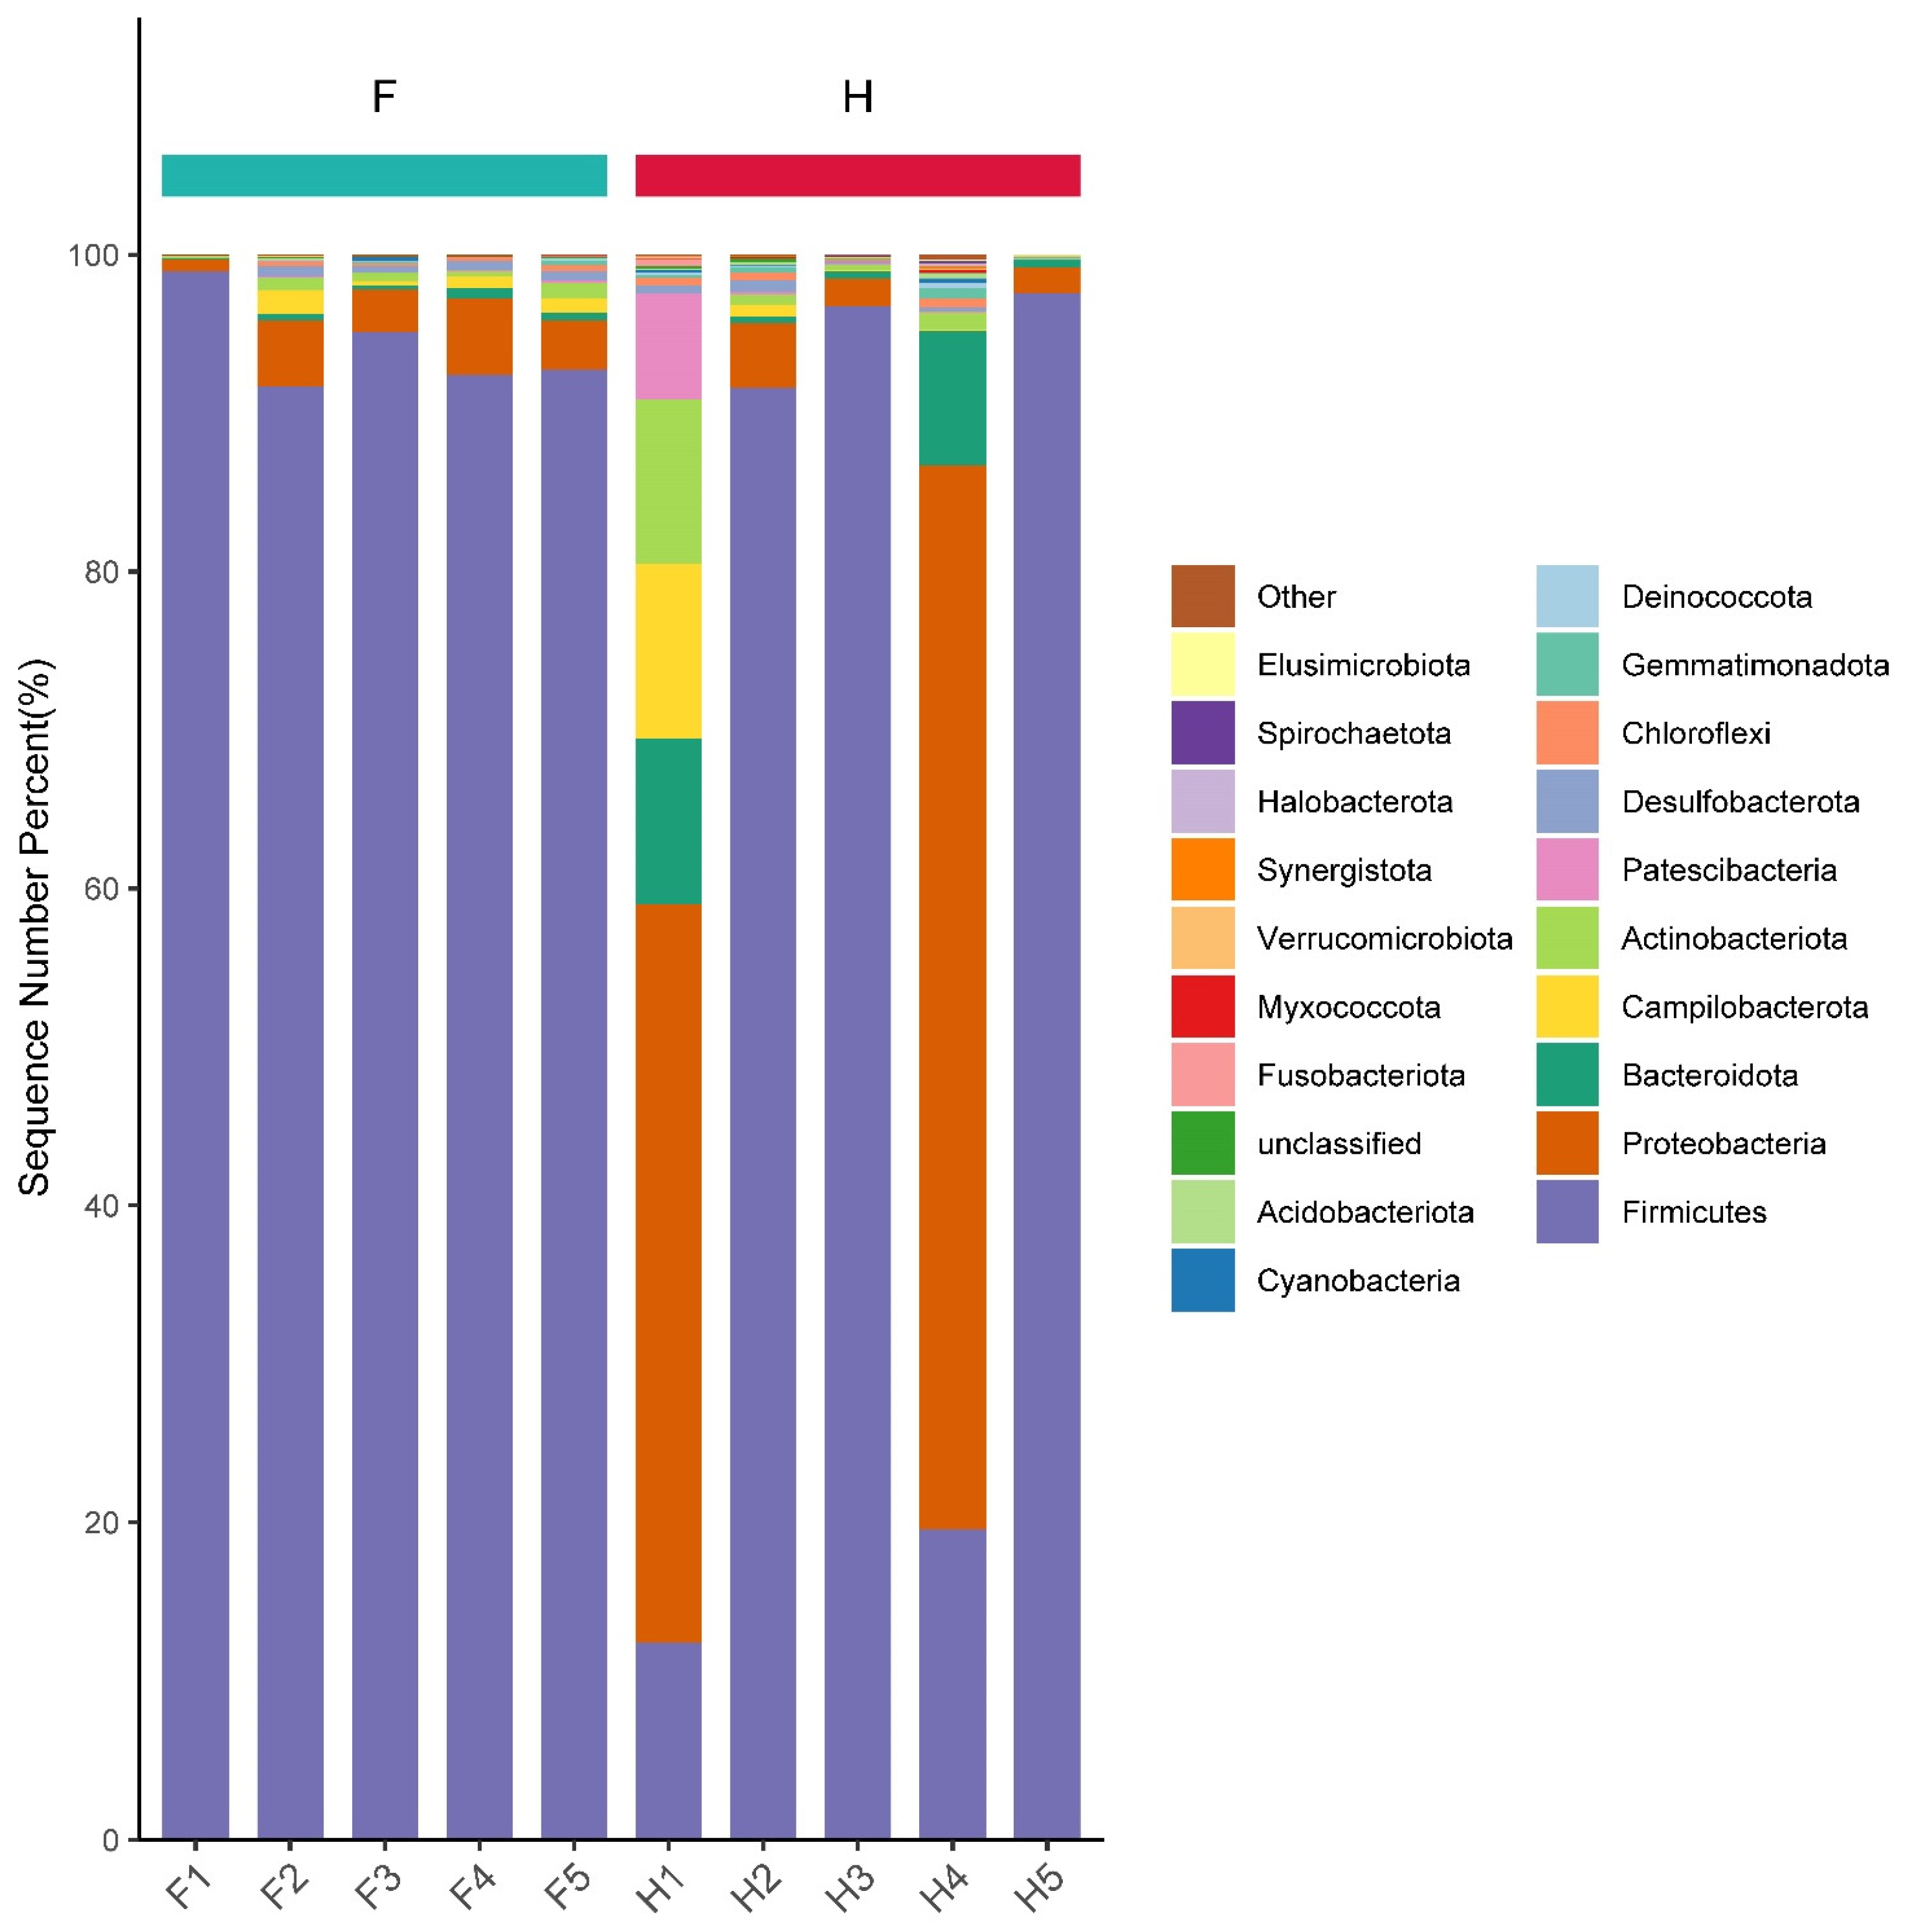
3.6. Analysis of Dominant Bacteria Based on Phylum Level

The sequences were identified as Firmicutes, Proteobacteria, Bacteroidetes, Campylobacterota, Actinobacteria, Patescibacteria, Desulfobacterota, Chloroflexi, Gemmatimonadetes, Deinococcota, Cyanobacteria, Acidobacteriota, unclassified, Fusobacteriota, Myxococcota, Verrucomicrobiota, Synergistota, Halobacterota, Spirochaetota, Elusimicrobiota and 21 other phyla. From Figure 6, it can be seen that Firmicutes bacteria were the dominant phylum in factory-produced (F) pickle samples, all of which reach more than 91%, among which F1 had the highest content of 98.96%. In the homemade sauerkraut samples, the most dominant phylum of H2, H3 and H5 was also Firmicutes, reaching more than 91%, of which H5 was as high as 97.54%. However, Proteobacteria was the most dominant phylum in the samples of H1 and H4, with 46.56% and 67.13%, respectively, while Firmicutes was the second most dominant phylum, with 12.4% and 19.57%, respectively, followed by Bacteroidetes, at 10.52% and 8.51% in the H1 and H4 samples, respectively. After that, Campylobacterota and Actinobacteria were the dominant phylum in these samples. Therefore, Firmicutes, Proteobacteria, Bacteroidetes, Campylobacterota and Actinobacteria were considered to be the dominant phyla in all samples. Firmicutes and Proteobacteria were the dominant phyla in samples from both Jiangshui [25] and Suan-cai [26] in northeastern China; these were similar to the results of this study. Sun [27] et al. found that the main bacterial phyla in kimchi in Jilin, China were Firmicutes, Cyanobacteria and Proteobacteria, which was different from this study.

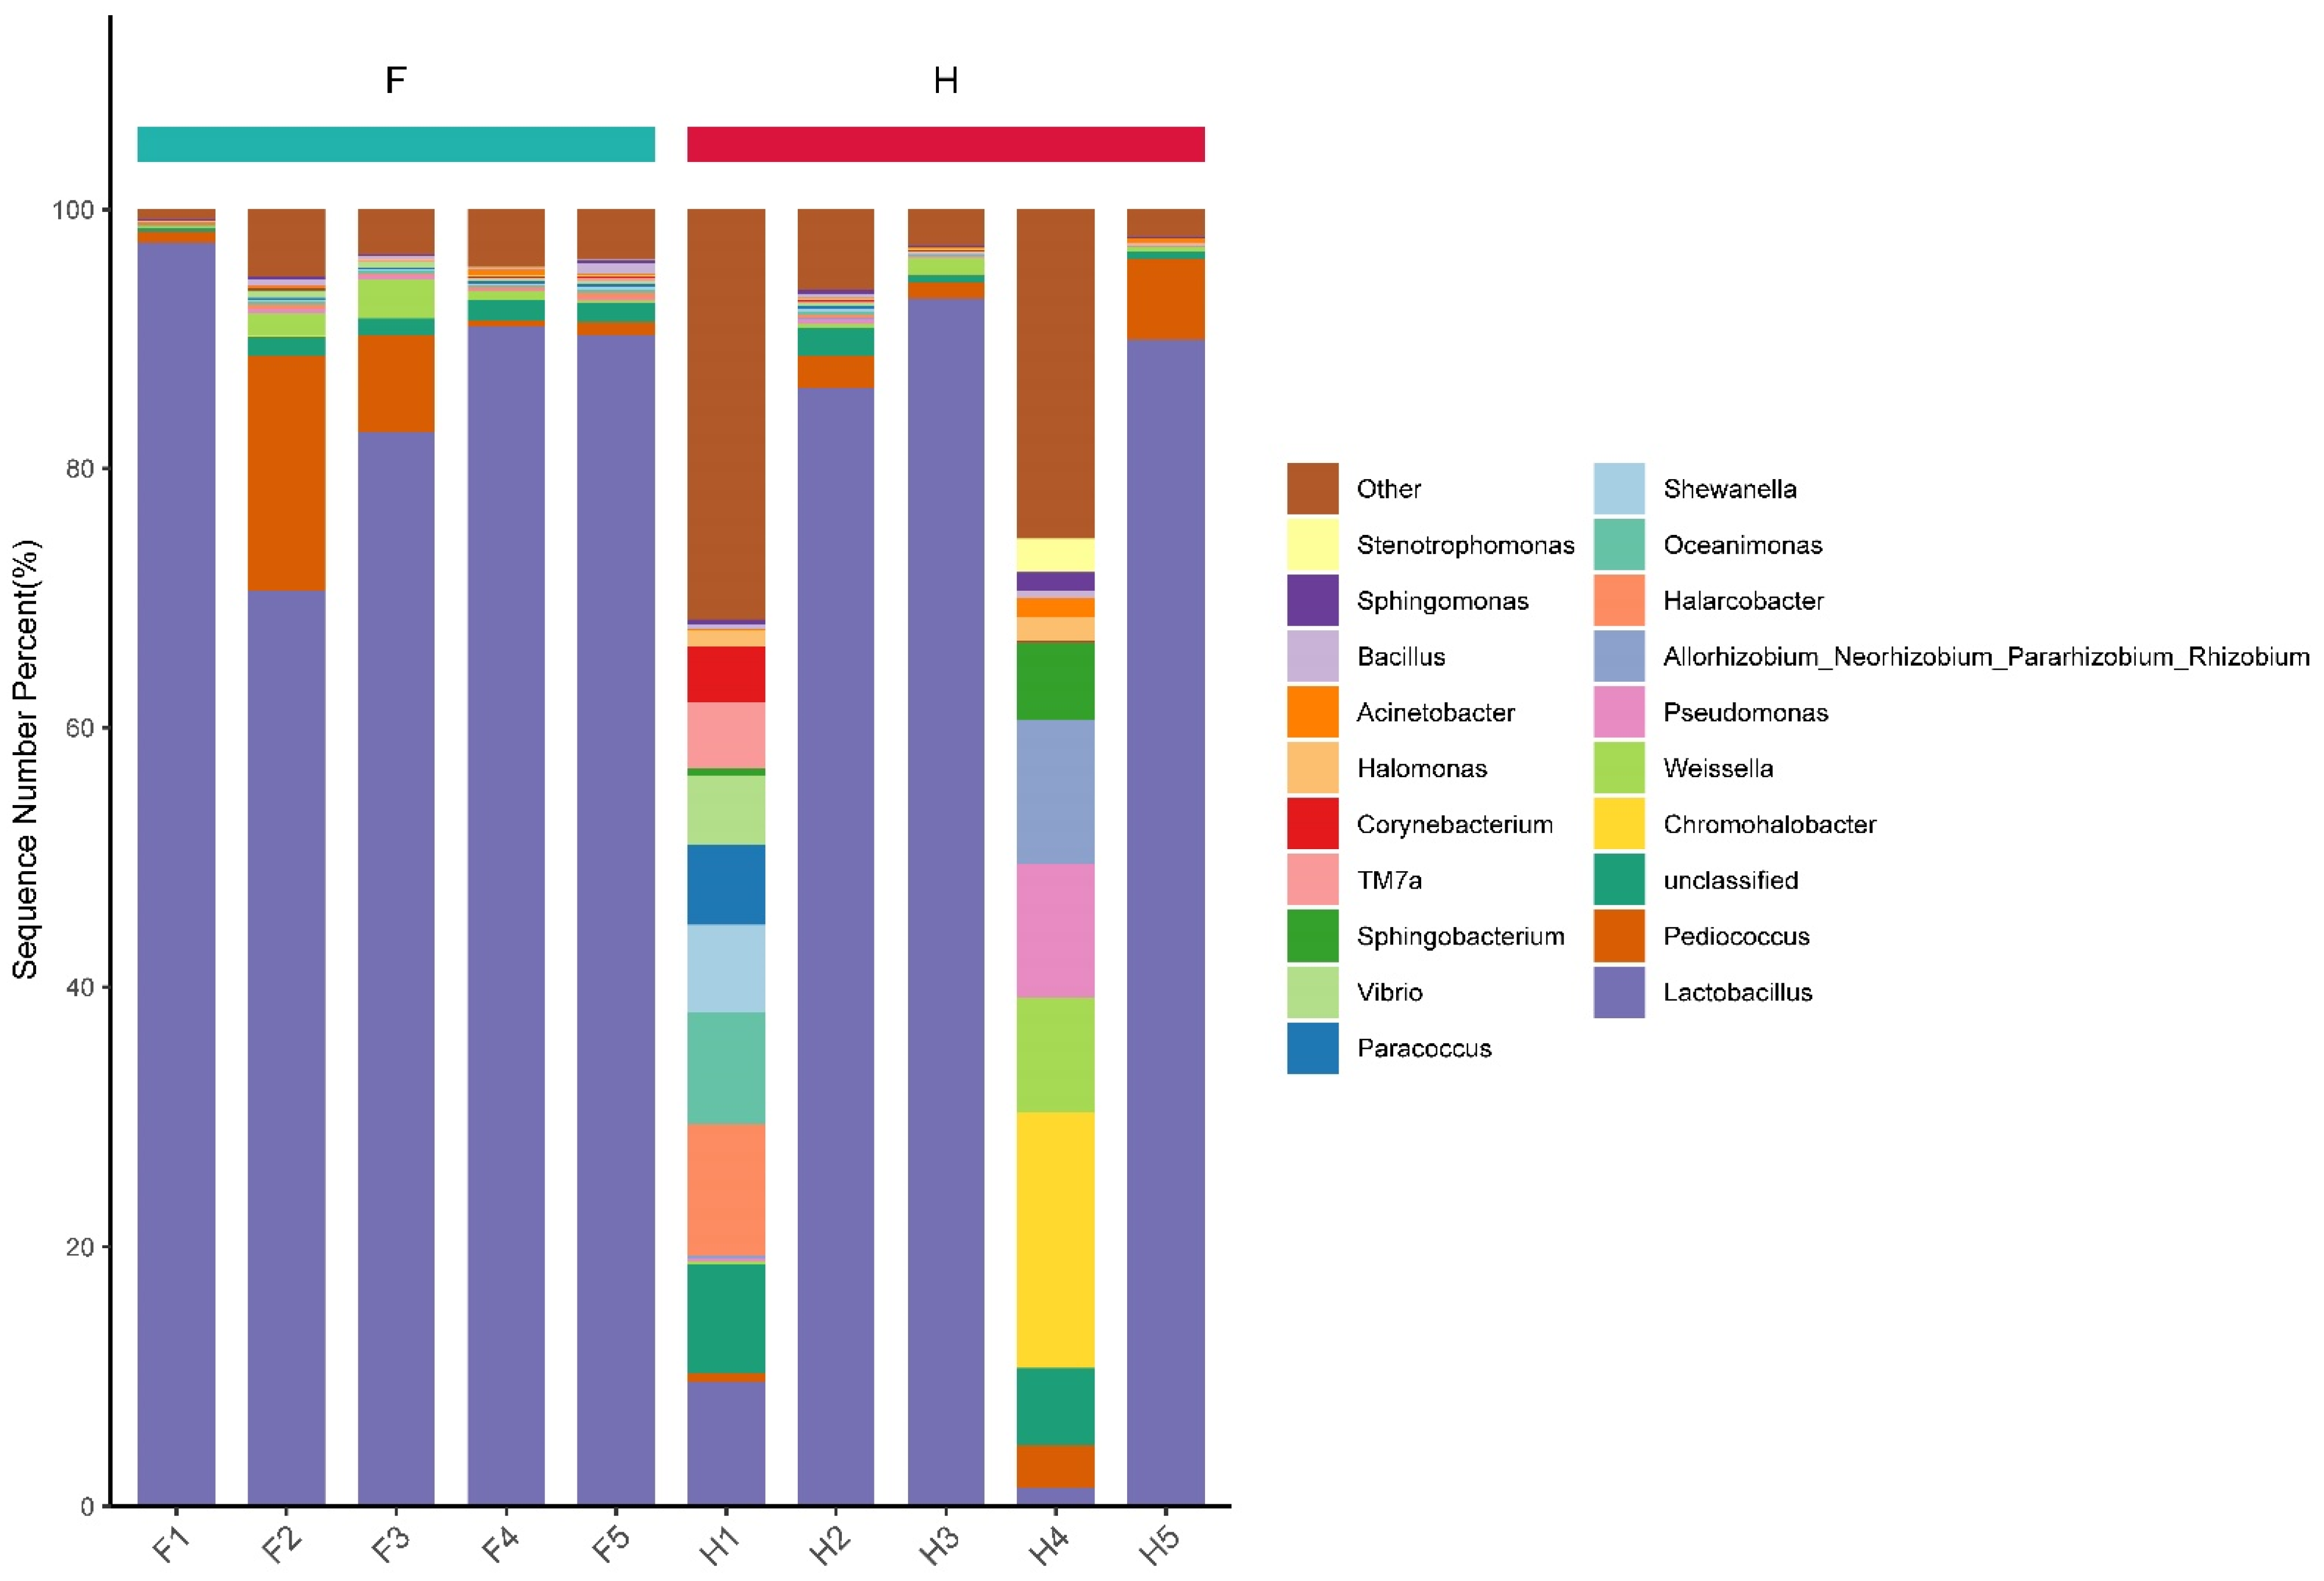
3.7. Analysis of Dominant Bacteria Based on Genus Level

The bacteria in the two types of Chaozhou sauerkraut were classified at the genus level, and their relative abundance was calculated. The top 20 bacterial genera with the highest abundance are presented in a bar chart (Figure 7). It can be seen that except for the other and unclassified genera, the dominant bacterial genera in sauerkraut samples of group F were similar, mainly Lactobacillus, Pediococcus and Weissella. This is similar to previous studies that found Weissella as the dominant genus in fermented chopped pepper [28] and traditional jiang-shui [25] in northwestern China. The relative abundance of Lactobacillus in samples F1, F4 and F5 was the highest, at 97.42%, 91.00% and 90.28%, respectively. The two genera Lactobacillus and Weissella were the most representative kimchi fermentation bacteria, which contributed to the formation of flavor during kimchi fermentation [12]. The genus with the second highest relative abundance in samples F2 and F3 was Pediococcus, accounting for 18.18% and 7.55%, respectively. Among the samples of group H, the dominant bacteria were different. The dominant bacterial genera of H2, H3 and H5 were Lactobacillus, Pediococcus and Weissella, which was the same as that of group F. However, the top six dominant bacterial genera in the H1 sample were Halarcobacter (10.11%), Lactobacillus (9.58%), Oceanimonas (8.57%), Shewanella (6.78%), Paracoccus (6.21%) and Vibrio (5.30%). This is quite different from the previously mentioned sample microbial genera. There may have been environmental pollution in this sample [29]. Weissella is the dominant bacterial genus in sauerkraut [12], which ensures food safety by producing acid and alcohol, thereby inhibiting the growth of pathogenic bacteria [30]. The top six dominant genera in H4 samples were Chromohalobacter (19.61%), Rhizobium (11.09%), Pseudomonas (10.23%), Weissella (8.94%), Sphingobacterium (6.02%), and Pediococcus (3.2%); however, Lactobacillus only accounted for 1.46%. It is well known that the type and quantity of core microorganisms affect the quality of pickled foods [12]. In Table 1, it can be seen that the pH value, nitrite content and reducing sugar content of H4 samples were the highest among all samples, which may have been affected by its bacterial genera due to the type and quantity of effects. It can be seen from the above that there were large inter-group differences in the genus level of home-made sauerkraut. Compared with commercial kimchi, the fermentation conditions of home kimchi are more variable [31], and may also be affected by the production environment [32]. The production of commercial sauerkraut strictly controls the sources and types of raw materials, fermentation conditions, etc., and the final product is usually packaged and stored under refrigerated conditions to ensure high quality standards [12]. These processes are more standardized relative to those used in homemade pickles. In addition, the aged sauerkraut brine added during fermentation is also an important factor influencing the microbial community. The age of the sauerkraut brine, the way it is stored, etc., can affect the initial composition of the microbial community.
Internal environmental factors such as pH and total acidity affect the microbial community structure in kimchi [12]. The organic acids produced by lactic acid bacteria can reduce the pH value of sauerkraut, which can effectively inhibit the growth of harmful bacteria [33]. It is evident from Figure 7 that samples H1 and H4 had the lowest abundance of Lactobacillus. Correlation analysis between Lactobacillus abundance and pH value (Figure 8) showed a significant negative correlation (p < 0.01). Therefore, the higher pH environment may have resulted in higher Vibrio (5.30%) in the H1 sample and higher Pseudomonas (10.23%) in the H4 sample. These genera may be pathogenic [29,34]. Therefore, there may be certain food safety hazards associated with direct consumption of this sauerkraut. In addition, the composition of microorganisms also changes dynamically during the time course of storage. In the future, the relationship between storage time and sample flora will also be one of our key research directions.

4. Conclusions

The bacterial diversity of Chaozhou sauerkraut samples produced by two different methods was analyzed by high-throughput sequencing technology. The results showed that 54 phyla and 622 genera were identified in 10 sauerkraut samples. Except for the shared ones, the unique bacterial phyla and genera in sauerkraut samples produced by households (H) were 18 and 307, respectively, while those in the samples produced by factories (F) numbered only 6 and 80, respectively. The bacterial community composition in samples of sauerkraut produced by factories was similar. At the genus level, the dominant bacterial genera in sauerkraut samples in group F were similar: mainly Lactobacillus, Pediococcus and Weissella. The dominant bacterial genera in most samples of group H were similar to those in samples of group F. However, there were a small number of samples in group H that were quite different, and they also may have contained potentially pathogenic microorganisms such as Pseudomonas and Vibrio. On the whole, there are still some differences in the bacterial community structure between factory-produced and home-made samples of Chaozhou sauerkraut, each with its own advantages and disadvantages.

Author Contributions

Conceptualization, X.Y.; Investigation, W.H., X.Y. and H.P.; Data curation, H.P. and Y.Z.; Funding acquisition, W.H. and X.Y.; Methodology, X.Y. and W.H.; Project administration, X.Y.; Supervision, J.C.; Writing—original draft, W.H. and J.C.; Writing—review and editing, X.Y. and Y.Z. All authors have read and agreed to the published version of the manuscript.

Funding

This research was funded by the Project of Guangdong Provincial Department of Culture and Tourism (20200012), Guangdong Provincial Department of Education Innovation and School Strengthening Project (2016KQNCX101), Cultural Research Fund Project of the Propaganda Department of the Chaozhou Municipal Party Committee (Chao Xuan Tong [2017] No. 97) and Key Research Project of Guangdong Provincial Department of Education (2018 WQNCX113).

Institutional Review Board Statement

Not applicable.

Informed Consent Statement

Not applicable.

Data Availability Statement

The data are available from the corresponding author.

Acknowledgments

Sequencing services and data analysis services were provided by Wekemo Tech Group Co., Ltd., Shenzhen, China.

Conflicts of Interest

The authors declare no conflict of interest.

References

  1. Rao, Y.; Chang, W.; Xiang, W.; Li, M.; Che, Z.; Tang, J. Screening and Performance of Lactobacillus plantarum E11 with Bacteriocin-Like Substance Secretion as Fermentation Starter of Sichuan Pickle. J. Food Saf. 2013, 33, 445–452. [Google Scholar] [CrossRef]
  2. Chen, X.; Zheng, M.; Liu, J.; Deng, Z.; Zhang, B.; Li, H. Selection and use of indigenous mixed starter cultures for mustard leaves fermentation and the improvement of cuocai characteristics. J. Sci. Food Agric. 2018, 98, 1773–1786. [Google Scholar] [CrossRef] [PubMed]
  3. Yoo, J.Y.; Cho, H.J.; Moon, S.; Choi, J.; Lee, S.; Ahn, C.; Yoo, K.Y.; Kim, I.; Ko, K.P.; Lee, J.E. Pickled Vegetable and Salted Fish Intake and the Risk of Gastric Cancer: Two Prospective Cohort Studies and a Meta-Analysis. Cancers 2020, 12, 996. [Google Scholar] [CrossRef] [PubMed]
  4. Frazie, M.D.; Kim, M.J.; Ku, K.M. Health-Promoting Phytochemicals from 11 Mustard Cultivars at Baby Leaf and Mature Stages. Molecules 2017, 22, 1749. [Google Scholar] [CrossRef] [Green Version]
  5. Park, S.Y.; Jang, H.L.; Lee, J.H.; Choi, Y.; Kim, H.; Hwang, J.; Seo, D.; Kim, S.; Nam, J.S. Changes in the phenolic compounds and antioxidant activities of mustard leaf (Brassica juncea) kimchi extracts during different fermentation periods. Food Sci. Biotechnol. 2017, 26, 105–112. [Google Scholar] [CrossRef]
  6. Di, H.; Ma, J.; Zhang, Y.; Wei, J.; Yang, J.; Ma, J.; Bian, J.; Xu, J.; Huang, Z.; Tang, Y. Correlations between flavor and glucosinolates and changes in quality-related physiochemical characteristics of Guizhou suancai during the fermentation process. Food Chem. 2023, 405, 134965. [Google Scholar] [CrossRef]
  7. Dimidi, E.; Cox, S.R.; Rossi, M.; Whelan, K. Fermented Foods: Definitions and Characteristics, Impact on the Gut Microbiota and Effects on Gastrointestinal Health and Disease. Nutrients 2019, 11, 1806. [Google Scholar] [CrossRef] [Green Version]
  8. Marco, M.L.; Heeney, D.; Binda, S.; Cifelli, C.J.; Cotter, P.D.; Foligne, B.; Ganzle, M.; Kort, R.; Pasin, G.; Pihlanto, A. Health benefits of fermented foods: Microbiota and beyond. Curr. Opin. Biotechnol. 2017, 44, 94–102. [Google Scholar] [CrossRef]
  9. Liu, B.; Zhang, J.; Yi, R.; Zhou, X.; Long, X.; Pan, Y.; Zhao, X. Preventive Effect of Lactobacillus fermentum CQPC08 on 4-Nitroquineline-1-Oxide Induced Tongue Cancer in C57BL/6 Mice. Foods 2019, 8, 93. [Google Scholar] [CrossRef] [Green Version]
  10. Wang, L.; Zhang, X.; Li, Y.; Sun, R.; Lin, Y.; Yu, H.; Xue, Y.; Zhou, X.; Liu, W.; Yan, L. The drivers of bacterial community underlying biogeographical pattern in Mollisol area of China. Ecotoxicol. Environ. Saf. 2019, 177, 93–99. [Google Scholar] [CrossRef]
  11. Zang, J.; Xu, Y.; Xia, W.; Yu, D.; Gao, P.; Jiang, Q.; Yang, F. Dynamics and diversity of microbial community succession during fermentation of Suan yu, a Chinese traditional fermented fish, determined by high throughput sequencing. Food Res. Int. 2018, 111, 565–573. [Google Scholar] [CrossRef]
  12. An, F.; Sun, H.; Wu, J.; Zhao, C.; Li, T.; Huang, H.; Fang, Q.; Mu, E.; Wu, R. Investigating the core microbiota and its influencing factors in traditional Chinese pickles. Food Res. Int. 2021, 147, 110543. [Google Scholar] [CrossRef]
  13. Rao, Y.; Qian, Y.; Tao, Y.; She, X.; Li, Y.; Chen, X.; Guo, S.; Xiang, W.; Liu, L.; Du, H. Characterization of the microbial communities and their correlations with chemical profiles in assorted vegetable Sichuan pickles. Food Control 2020, 113, 107174. [Google Scholar] [CrossRef]
  14. Yang, X.; Hu, W.; Xiu, Z.; Jiang, A.; Yang, X.; Sarengaowa; Ji, Y.; Guan, Y.; Feng, K. Comparison of northeast sauerkraut fermentation between single lactic acid bacteria strains and traditional fermentation. Food Res. Int. 2020, 137, 109553. [Google Scholar] [CrossRef]
  15. Ma, Q.; Zhu, Y.T.; Li, Y.D.; Zhang, Z.L.; Huang, J.; Zuo, Y. Quantification of heavy metals and health risk assessment in Sichuan pickle. J. Food Sci. 2022, 87, 2229–2244. [Google Scholar] [CrossRef]
  16. Pinaev, A.G.; Kichko, A.A.; Aksenova, T.S.; Safronova, V.I.; Kozhenkova, E.V.; Andronov, E.E. RIAM: A Universal Accessible Protocol for the Isolation of High Purity DNA from Various Soils and Other Humic Substances. Methods Protoc. 2022, 5, 99. [Google Scholar] [CrossRef]
  17. Callahan, B.J.; McMurdie, P.J.; Rosen, M.J.; Han, A.W.; Johnson, A.J.; Holmes, S.P. DADA2: High-resolution sample inference from Illumina amplicon data. Nat. Methods 2016, 13, 581–583. [Google Scholar] [CrossRef] [Green Version]
  18. Bokulich, N.A.; Kaehler, B.D.; Rideout, J.R.; Dillon, M.; Bolyen, E.; Knight, R.; Huttley, G.A.; Gregory Caporaso, J. Optimizing taxonomic classification of marker-gene amplicon sequences with QIIME 2’s q2-feature-classifier plugin. Microbiome 2018, 6, 90. [Google Scholar] [CrossRef]
  19. Love, M.I.; Huber, W.; Anders, S. Moderated estimation of fold change and dispersion for RNA-seq data with DESeq2. Genome Biol. 2014, 15, 550. [Google Scholar] [CrossRef] [Green Version]
  20. Mandal, S.; Van Treuren, W.; White, R.A.; Eggesbo, M.; Knight, R.; Peddada, S.D. Analysis of composition of microbiomes: A novel method for studying microbial composition. Microb. Ecol. Health Dis. 2015, 26, 27663. [Google Scholar] [CrossRef] [Green Version]
  21. Vázquez-Baeza, Y.; Pirrung, M.; Gonzalez, A.; Knight, R. EMPeror: A tool for visualizing high-throughput microbial community data. Gigascience 2013, 2, 16. [Google Scholar] [CrossRef] [PubMed] [Green Version]
  22. Rohart, F.; Gautier, B.; Singh, A.; Le Cao, K.A. mixOmics: An R package for ’omics feature selection and multiple data integration. PLoS Comput. Biol. 2017, 13, e1005752. [Google Scholar] [CrossRef] [PubMed] [Green Version]
  23. Langille, M.G.; Zaneveld, J.; Caporaso, J.G.; McDonald, D.; Knights, D.; Reyes, J.A.; Clemente, J.C.; Burkepile, D.E.; Vega Thurber, R.L.; Knight, R. Predictive functional profiling of microbial communities using 16S rRNA marker gene sequences. Nat. Biotechnol. 2013, 31, 814–821. [Google Scholar] [CrossRef] [PubMed]
  24. Li, J.; Ma, D.; Tian, J.; Sun, T.; Meng, Q.; Li, J.; Shan, A. The responses of organic acid production and microbial community to different carbon source additions during the anaerobic fermentation of Chinese cabbage waste. Bioresour. Technol. 2023, 371, 128624. [Google Scholar] [CrossRef] [PubMed]
  25. Liu, Z.; Peng, Z.; Huang, T.; Guan, Q.; Li, J.; Xie, M.; Xiong, T. Bacterial community dynamics and physicochemical characteristics in natural fermentation of jiang-shui, a traditional food made in northwest China. J. Sci. Food Agric. 2019, 99, 3391–3397. [Google Scholar] [CrossRef] [PubMed]
  26. Liu, Z.; Li, J.; Wei, B.; Huang, T.; Xiao, Y.; Peng, Z.; Xie, M.; Xiong, T. Bacterial community and composition in Jiang-shui and Suan-cai revealed by high-throughput sequencing of 16S rRNA. Int. J. Food Microbiol. 2019, 306, 108271. [Google Scholar] [CrossRef]
  27. Sun, X.H.; Qi, X.; Han, Y.D.; Guo, Z.J.; Cui, C.B.; Lin, C.Q. Characteristics of changes in volatile organic compounds and microbial communities during the storage of pickles. Food Chem. 2023, 409, 135285. [Google Scholar] [CrossRef]
  28. Wang, C.; Du, X.; Xie, T.; Li, H. Label- and modification-free-based in situ selection of bovine serum albumin specific aptamer. J. Sep. Sci. 2019, 42, 3571–3578. [Google Scholar] [CrossRef]
  29. Chien, H.-I.; Yen, Y.-F.; Lee, Y.-C.; Wei, P.-C.; Huang, C.-Y.; Tseng, C.-H.; Yen, F.-L.; Tsai, Y.-H. Determination of the Bacterial Community of Mustard Pickle Products and Their Microbial and Chemical Qualities. Biology 2023, 12, 258. [Google Scholar] [CrossRef]
  30. Chen, C.; Liu, Y.; Tian, H.; Ai, L.; Yu, H. Metagenomic analysis reveals the impact of JIUYAO microbial diversity on fermentation and the volatile profile of Shaoxing-jiu. Food Microbiol. 2020, 86, 103326. [Google Scholar] [CrossRef]
  31. He, Z.; Chen, H.; Wang, X.; Lin, X.; Ji, C.; Li, S.; Liang, H. Effects of different temperatures on bacterial diversity and volatile flavor compounds during the fermentation of suancai, a traditional fermented vegetable food from northeastern China. LWT 2020, 118, 108773. [Google Scholar] [CrossRef]
  32. Kwon, E.A.; Kim, M. Microbial evaluation of commercially packed Kimchi products. Food Sci. Biotechnol. 2007, 16, 615–620. [Google Scholar]
  33. Gu, C.T.; Li, C.Y.; Yang, L.J.; Huo, G.C. Lactobacillus heilongjiangensis sp. nov., isolated from Chinese pickle. Int. J. Syst. Evol. Microbiol. 2013, 63, 4094–4099. [Google Scholar] [CrossRef] [Green Version]
  34. Karruli, A.; Catalini, C.; D’Amore, C.; Foglia, F.; Mari, F.; Harxhi, A.; Galdiero, M.; Durante-Mangoni, E. Evidence-Based Treatment of Pseudomonas aeruginosa Infections: A Critical Reappraisal. Antibiotics 2023, 12, 399. [Google Scholar] [CrossRef]
Figure 1. Boxplot of Shannon index. F means factory production; H means household handmade.
Fermentation 09 00282 g001
Figure 2. Supervised PLS–DA on OTUs. F means factory production; H means household handmade.
Fermentation 09 00282 g002
Figure 3. (A) Number of intergroup phyla and genera. (B) Number of phyla and genera in samples. F means factory production; H means household handmade.
Fermentation 09 00282 g003
Figure 4. Venn diagram (A) is based on phylum level; (B) Based on genus level. F means factory production; H means household handmade. Orange stands for group H, blue stands for group F, and purple stands for both groups.
Fermentation 09 00282 g004
Figure 5. Genus-level relative abundance heatmap. F means factory production; H means household handmade. The vertical column is the sample name information. Annotation names for the genus level are classified horizontally. The clustering tree at the top of the figure clusters the similarity of species abundance distribution in all samples. The middle heatmap is a log10 (absolute abundance) heatmap.
Fermentation 09 00282 g005
Figure 6. Proportion of different bacteria at the phylum level in the samples. F means factory production; H means household handmade.
Fermentation 09 00282 g006
Figure 7. Proportion of different bacteria in samples at the genus level. F means factory production; H means household handmade.
Fermentation 09 00282 g007
Figure 8. Correlation between pH value and abundance of Lactobacillus.
Fermentation 09 00282 g008
Table 1. pH value, nitrite content and reducing sugar content.
LabelpH ValueNitrite Content
(mg/kg)
Reducing Sugar
Content (mg/mL)
F13.410.660.0976
F23.420.120.0980
F33.650.240.0976
F43.650.350.0981
F53.560.380.0985
F group3.54 ± 0.12 a0.35 ± 0.2 a0.098 ± 0.0004 a
H13.920.150.1022
H23.410.040.1945
H33.70.310.1020
H45.161.120.8639
H53.560.090.1015
H group3.95 ± 0.7 a0.34 ± 0.44 a0.273 ± 0.3329 a
Notes: F means factory production; H means household handmade. Data in the same column marked with the same letter indicate no significant difference between F group and H group (p > 0.05).
Disclaimer/Publisher’s Note: The statements, opinions and data contained in all publications are solely those of the individual author(s) and contributor(s) and not of MDPI and/or the editor(s). MDPI and/or the editor(s) disclaim responsibility for any injury to people or property resulting from any ideas, methods, instructions or products referred to in the content.

