Article

Effect of Salt Concentration on Flavor Characteristics and Physicochemical Quality of Pickled Brassica napus

1
College of Food Science and Technology, Hunan Agricultural University, Changsha 410128, China
2
Food and Strategic Research and Design Institute of Hunan Province, Changsha 410008, China
*
Authors to whom correspondence should be addressed.
Fermentation 2023, 9(3), 275; https://doi.org/10.3390/fermentation9030275
Submission received: 19 January 2023 / Revised: 18 February 2023 / Accepted: 7 March 2023 / Published: 11 March 2023
(This article belongs to the Section Fermentation for Food and Beverages)

Abstract

:
This study aimed to elaborate on the role of salt concentration on pickled Brassica napus leaf and stem (BLS); it also contributed to the development of low-salt and healthy Brassica napus products in the harvest period. Five sets of pickled BLS samples were prepared, and the physicochemical parameters, free amino acids (FAAs), and the volatile flavor components (VFCs) were analyzed after fermentation. Results showed that some antioxidants, FAAs, and VFCs underwent dynamic changes during fermentation. Nitrite increased with an increase in the salt concentration used for fermentation. Pickled BLS contained a wide range of FAAs; a total of 23 were detected, which might be used as a source of amino acid supplementation. The VFCs were analyzed via headspace solid-phase micro-extraction (HS-SPME) combined with gas chromatography and mass spectrometry (GC-MS). A total of 51 VFCs were tentatively identified. The contribution to flavor could be expressed by the relative odor activity value (ROAV). Salt is one of the important factors affecting the quality of vegetable fermentation. Therefore, for large-scale pickled BLS production, a key issue is to balance the low salt concentration and high fermentation quality. Under the action of salt and microorganisms, the fresh BLS fermented via dry pickling, which not only improved its FAAs and VFCs, endowed the production with a unique flavor, but also prolonged the shelf life.

1. Introduction

Brassica napus, also known as rape, oilseed rape, and Brassica rapa is among the world’s most important oilseed crops. Rape is grown for the production of animal feed, edible vegetable oils, and biodiesel. In 2020, both Canada and China produced more than 14 million tons of rapeseed. BLS is also edible. BLS is harvested under the premise of ensuring the rapeseed yield. BLS as a new type of fresh vegetable can increase additional economic benefits in recent years. BLS is rich in vitamin C, carotene, calcium, potassium, and mineral elements. The taste of BLS is crisp, tender, and unique. Since BLS has a short harvest season, fermentation can extend the time to eat BLS. By dry salting, BLS is dehydrated and affected by lactic acid bacteria and other microorganisms, so as to achieve the purpose of preservation [1]. Fermentation is one of the most common traditional vegetables processing and preservation methods, which contributes to increasing and diversifying the sensory properties of foodstuffs [2]. Fermented pickles are considered valuable sources of proteins, carbohydrates, minerals, vitamins, and fibers [3]. Fermented vegetables are rich in bioactive compounds, of which antioxidant and anti-inflammatory properties help alleviate the symptoms of Alzheimer’s disease [4]. Plant-based proteins are often lacking one or two of the essential amino acids, which have been regarded as “incomplete protein packages”. Soy proteins are recognized as the foremost source of plant-based proteins due to their high protein content and exceptional versatility in the development of various food products. [5]. Soy proteins can be decomposed into small peptides and amino acids through fermentation, thereby improving the bioavailability of protein [6,7]. Compared to other leafy vegetables, BLS is also abundant in protein, making it crucial to investigate the protein content and amino acid profile of fermented pickled BLS. Lactic acid bacteria (LAB) play a major role in the pickling process, contributing to the production of unique flavors and promoting overall health and fitness [8]. LABs are recognized as the most prominent probiotic strains, as some of the species inhabit the small intestine by resisting harsh environmental conditions, such as low pH and high osmotic pressure, etc. [9]. LABs have been widely applied in fermented food. The application of LABs can regulate intestinal flora and enhance immunity, etc. [10,11]. Furthermore, LABs have been found to improve the polyphenol content, antioxidant capacity, and flavor complexity of fermented products [12,13,14]. Salt promotes the growth of LABs in pickles and controls the growth of spoilage microorganisms [15]. More importantly, the concentration and type of salt affect the changes in microbial communities during fermentation [16,17,18]. During the fermentation of pickles, many microorganisms promote the production of metabolites. It has been difficult to prove the relationship between salt concentration and metabolites [19]. These metabolites may include sugars, acids, and amino acids, etc., which play a key role in the quality of the final product [20].
The salt could reduce the nitrite content during pickle fermentation and improve the safety of pickles [21]. On the other hand, the salt concentration could control the quality of pickles [22]. However, excess salt intake increases the risk of blood pressure and cardiovascular disease [23]. The key is to balance the salt concentration and pickle quality. At present, there are few studies on the effect of salt concentrations on vegetables with higher protein content after fermentation; especially, their flavor characteristics and amino acids are worth studying.
Therefore, the aim of this study was to examine the relationship between the salt concentration for fermentation and characteristics of pickled BLS, including total acidity (TA), soluble sugar, protein, fat, amino acid nitrogen, salinity, glucosinolate, nitrite, and FAAs. In addition, VFCs and some antioxidants were analyzed. The result would help to provide theoretical evidence for improving the comprehensive utilization value of Brassica napus.

2. Materials and Methods

2.1. Preparation of Pickled BLS

Brassica napus was obtained from the Hunan Crop Research Institute. Fresh BLS was cut into 3 cm lengths. The moisture content of BLS was controlled by an oven at about 60%. BLS was divided into five groups, and 4%, 5%, 6%, 7%, and 8% salt by BLS weight was added. The salt originated from commercially available refined salt (Hunan Salt Industry Co., Ltd., China), with a purity of ≥99.6% and an iodine content of 21–39 mg/kg. BLS and salt were mixed well and put into sterilized ceramic jars. Ceramic jars were sealed to create an oxygen-free environment. All samples were naturally fermented at 20 °C for 7 days. G1, G2, G3, G4, and G5 are used below to represent the samples of BLS pickled with a 4%, 5%, 6%, 7%, and 8% salt mass.

2.2. Determination of Physicochemical Parameters

2.2.1. Determination of TA

The TA content was determined according to the acid–base titration method. The sample was mixed with deionized water to form a homogeneous slurry. Then, 25.00 mL of the filtrate was taken and 3 drops of 10 g/L phenolphthalein indicator solution were added. The solution was titrated using 0.1 mol/L NaOH, until a light pink color appeared.

2.2.2. Determination of Soluble Sugar

The content of soluble sugar was determined using the anthrone colorimetric method [24], which was slightly modified. Here, 0.30 g of powder sample was accurately weighed, and 10 mL of distilled water was added to a boiling water bath for extraction. Then, 1 mL of supernatant was added to 0.2 mL of acetylacetone anthrone reagent and 2 mL of concentrated sulfuric acid. The mixture was heated in a boiling water bath for 7 min and then cooled down. The absorbance of the supernatant was measured at 620 nm. The results were calculated based on the standard curve obtained from a 0.00 to 0.15 mg/mL glucose solution.

2.2.3. Determination of Protein

The protein content was determined via the Kjeldahl method. The automatic Kjeldahl nitrogen analyzer (Shandong Haineng Scientific Instrument Co., Ltd., Jinan, China) was used to determine the crude protein content. Here, 1 g of the sample was accurately weighted and placed in a digestion tube. Then, 0.4 g of copper sulfate, 6 g of potassium sulfate, and 20 mL of sulfuric acid were added to the digestion furnace and digested for 1 h at 420 °C. After taking it out and cooling it, 50 mL of water was added, and automatic liquid addition, distillation, titration, and data recording were realized using the automatic Kjeldahl nitrogen analyzer.

2.2.4. Determination of Fat

Fat content was determined via Soxhlet extraction [25]. Petroleum ether was used as the extraction solvent; the solvent was removed via evaporation and then dried and weighed.

2.2.5. Determination of Amino Acid Nitrogen

Amino acid nitrogen content was determined via the titration method [26]. Two dilutions of the sample solution were prepared. One portion was titrated with 0.1 mol/L NaOH standard solution after adding three drops of neutral red reagent, until the color changed from red to amber. Another portion was treated with three drops of thymolphthalein indicator and 20 mL of neutral formaldehyde, was left to stand for 1 min, and then titrated with 0.1 mol/L NaOH until the color became light blue. The volumes of NaOH consumed in both titrations were recorded. Amino acid nitrogen content was calculated using the following formula:
A = V 2 V 1 × c × 0.014 × 100 / m
where A is the content of amino acid nitrogen, g/100 g; c is the concentration of the NaOH standard solution, mol/L; V1 is the volume of the NaOH standard solution consumed when using neutral red indicator, mL; V2 is the volume of NaOH consumed when using the bromothymol blue indicator, mL; and m is the mass of the sample solution equivalent to the sample, g.

2.2.6. Determination of Salinity

Salinity was determined via the silver quantification method. To 10 g of accurately weighed sample, hot water was added, and the sample was agitated for 5 min, ultrasonicated for 20 min, cooled, and filtered, and the supernatant was collected. Then, 5% potassium chromate solution and 1 to 2 drops of 0.1 mol/L silver nitrate titrant solution were added. The titrant solution turned brownish-red, and as additional silver nitrate solution was added, the color changed from yellow to orange-yellow. The volume of titrant solution consumed was recorded. A blank test was performed, and the volume of silver nitrate titrant solution consumed was recorded. Salinity was calculated using the following formula:
S = 0.035 × c × V 2 V 0 × V × 100 m × V 1
where S is the salinity in sample, %; c is the concentration of silver nitrate titrant solution, mol/L; V1 is the volume of sample used for titration, mL; V2 is the volume of silver nitrate titrant solution consumed during titration, mL; V0 is the volume of silver nitrate titrant solution consumed during the blank test, mL; V is the sample volume, mL; and m is the sample mass, g.

2.2.7. Determination of Glucosinolate

Extraction and quantitative analyses of total glucosinolate [27] were performed using the DNS method to measure glucosinolate. Briefly, 0.5 g of the sample was taken, ground, and subjected to enzymatic hydrolysis using myrosinase at 37 °C. After that, 2 mL of methanol and 2 mg of activated carbon were added to the mixture, which was then centrifuged at 10,000 rpm for 10 min to collect the supernatant. Glucose generated from the decomposition of glucosinolate was determined with a glucose kit.

2.2.8. Determination of Nitrite

The concentration of nitrite was determined according to [28]. Here, 5 g of homogenized sample was taken, 12.5 mL of 50 g/L borax solution was added, 150 mL of 70 °C water was added, and this was boiled for 15 min; 5 mL of 106 g/L potassium ferrocyanide solution and 220 g/L zinc acetate solution were added, and it was allowed it to stand before filtering. Then, 40 mL of the filtrate was taken, 2 mL of 4 g/L para-amino benzenesulfonic acid solution was added, and it was allowed to stand for 5 min; then, 1 mL of 2 g/L nitroprusside sodium solution was added, mixed well, and allowed to stand for 15 min before measuring the absorbance at a wavelength of 538 nm, drawing a sodium nitrite standard curve and calculating.

2.3. Determination of Health-Promoting Compounds

2.3.1. Determination of Total Phenol

The total phenol content was determined with reference to the Folin phenol colorimetric method. A 5 g sample was taken and ground with 75% ethanol and then ultrasonically extracted for 1 h. The sample was centrifuged for 15 min at 12,000 rpm and 4 °C; 1 mL of the supernatant was taken, and 6 mL distilled water and 0.5 mL of 1 mol/L Folin–Ciocalteu reagent was added. The mixture was vortexed and left in the dark for 3 min; then, 1.5 mL of 20% sodium carbonate solution was added and left for 2 h. The absorbance was measured at 765 nm. A standard curve for gallic acid was drawn. The formula for calculating the total phenol content is as follows:
P = C × V × N m × 1000
where P is the total phenol content, mg/g; C is the mass concentration of gallic acid, μg/mL; N is the dilution factor; and m is the mass of the sample, g.

2.3.2. Determination of Flavonoids

The content of flavonoids was determined with reference to the aluminum trichloride colorimetric method [29], and a little modification was made. Flavonoids in the sample were extracted using 70% ethanol with ultrasonication for 30 min, and the supernatant was collected via centrifugation at 4000 rpm for 10 min. A calibration curve was plotted with a rutin standard dilution series.

2.4. Determination of FAAs

The extraction and measurement of FAAs followed methods with some modifications [30]. Here, 0.5 g of BLS was put into a 10 mL centrifuge tube, 5 mL of 0.01 mol/L hydrochloric acid was added into it, and ultrasonic extraction was performed. The detection parameters of HPLC were as follows: the primary amino acid was derivatized with o-phthalaldehyde, and the secondary amino acid was derivatized with fluorene methoxycarbonyl chloride and then passed through the column for detection; chromatographic conditions, ZORBAX Eclipse AAA (4.6 × 75 mm, 3.5 μm); detection signal, UV detection equipped with 338 nm (0–19 min), 266 nm (19.01–25 min); mobile phase A, 40 mM sodium dihydrogen phosphate (pH 7.8); mobile phase B, acetonitrile/methanol/water = 45/45/10; flow rate, 1.0 mL/min.

2.5. Determination of VFCs

VFCs were determined via HS-SPME/GC–MS with a Shimadzu GC/MS-QP 2010 Plus (Shimadzu Co., Kyoto, Japan). Here, 1.0 g of BLS was put into 20 mL headspace sampling bottles and equilibrated at 70 °C for 34 min on a magnetic stirrer. After stabilization, the solid-phase microextraction (SPME) fiber (65 µm polydimethyl siloxane/divinylbenzene, PDMS/DVB, Supelco, Inc., Bellefonte, PA, USA) was inserted into the vials to absorb the volatile components at 70 °C. After 30 min, the fiber was retracted and inserted into the injection GC-MS port for 5 min at 250 °C to desorb the volatile components.
Gas chromatography parameters were as follows: Rtx-5MS column (30.0 m × 0.25 mm × 0.25 µm, Shimadzu Co., Kyoto, Japan), helium was used as a carrier gas at a flow rate of 1.0 mL/min in split mode with a 1:20 ratio. The temperature of the injection port was 250 °C. The oven temperature was maintained at 40 °C for 3 min, increased to 150 °C at 3 °C/min, held for 4 min, and then increased to 230 °C at 10 °C/min and held for 5 min. Mass spectrometry parameters were as follows: the interface and ion source temperature were maintained at 220 °C and 200 °C, respectively. Using an electron ionization source, the scanning range was from 50 to 500 m/z. Solvent delay time was 5 min.
Qualitative analysis of volatile components was based on comparisons of the National of standards and Technology (NIST17) mass spectral libraries and by matching the retention index (RI) values. Qualification results are only used when the match is greater than 80% (up to 100%). The peak area normalization method was used to quantitatively calculate the relative concentration of VFCs in pickled BLS. The ROAV method was used to evaluate VFCs. ROAV was calculated according to the formula:
ROAVa = 100 × OAVa/OAVmax
where ROAVa is the relative odor activity value of substancea; OAVmax is the highest odor activity value (OAV) among the VFCs; and OAVa is the OAV of substancea. OAV was calculated via the equation OAVa = Ca/Ta, where Ca was the relative concentration and Ta was the odor threshold in the air [31,32,33,34].

2.6. Statistical Analysis

Analyses of the samples were completed in triplicate. Origin 2018 and SPASS 25 software were applied for the analysis of significance and statistical results, including analysis of variance (ANONA) and the Duncan test. ROAV was used to identify key VFCs in pickled BLS, using the cluster analysis method to classify samples.

3. Results and Discussion

3.1. Changes of Physicochemical Indexes of Pickled BLS under Different Salt Concentrations

Five salt concentration were used to determine the effects of salt on the physicochemical properties of samples (Table 1). After fermentation with different salt concentrations, G5 had the highest content of TA, soluble sugar, and nitrite. The amylase and lipase during the fermentation process converted sugars, lipids, and other substances into organic acids and fatty acids [35,36]. Finally, the pH value of the entire fermentation system decreased, and the TA content increased significantly [37]. The hydrolytic enzymes were also produced via the growth and metabolism of lactic acid bacteria, which degraded polysaccharides into monosaccharides, such as glucose and fructose. Part of the sugar provided energy for the growth and metabolism of lactic acid bacteria [38], and part of it accumulated during fermentation to increase the content of soluble sugar [39]. The nitrite content increased with an increasing salt concentration, reaching a maximum of 1.85 g/100 g. The effects of the salt concentration on nitrite degradation came from both the inhibition of spoilage bacteria and the support of LAB growth [20]. This could possibly be due to the inhibitory effect of high salt; the beneficial effect of LAB on nitrite was reduced, and its initial amount was low at the beginning of the fermentation. The protein and fat content generally showed a downward trend, and some samples fluctuated. The fluctuation of protein content was related to its degradation rate, which was related to protease activity [40]. Compared with other vegetables, BLS had a high protein content. During fermentation, protein was decomposed into small molecule peptides and FAAs [41]. With the increase in salt concentration, the content of amino acid nitrogen first increased and then decreased, and the highest value in the G3 sample was 2.01 g/100 g. Salinity reached the highest value of 7.04 g/100 g in the G4 sample. However, the content of glucosinolate decreased with an increasing salt concentration. The different influences of the salt concentration on the contents of glucosinolate may result from the diverse sensitivity of the bacterial strains used to osmotic pressure [42]. The moderate salt concentration used in fermentation contributes to the accumulation of amino acid nitrogen [43].

3.2. Changes in Health-Promoting Compounds of Pickled BLS under Different Salt Concentrations

Flavonoids and total phenols are widely recognized as two health-promoting or antioxidant substances. Figure 1 shows the change in flavonoids and total phenols contained in BLS under different salt concentrations. The content of flavonoids decreased significantly with an increase in the salt concentration. Significant differences among the five samples were found by performing Duncan’s test. However, the total phenol content decreased first and then increased, reaching the lowest value of 3.49mg/g in G4. LAB fermentation dramatically increased total phenolics and flavonoids [13,44], but an increased salt concentration would also inhibit the growth of LAB and activity of related enzymes [45,46], which may lead to a decrease in the content [47]. Some hydrolases hydrolyzed complex phytochemical components into small molecular substances and then released phenolic compounds from plant cell walls; the content of total phenols in samples decreased significantly. In G5, there was an increase in the content of phenols, which may be related to the increase in the content of some phenolic monomers. On the one hand, it might be that phenols interacted with protein, dietary fiber, and other components during the fermentation process, resulting in adsorption, precipitation, oxidation, and decarboxylation, etc., and caused losses [48]. On the other hand, it may be that microorganisms convert phenolic substances into high-molecular phenolic substances through decarboxylation, reduction, deesterification, and deglycosylation reactions [49].
However, fermentation decreased the total phenolic and flavonoid content. This could be due to the rearrangement of phenolic structures caused by the acidic environment of the fermentation process, reduced extractability due to self-polymerization, and/or interactions of phenolic compounds with other macromolecules [50]. The phenolic compounds were also transformed or degraded into other healthy compounds. However, fermentation may be an effective way to increase the bioavailability of phenolic compounds and protect cells from oxidative stress [49].

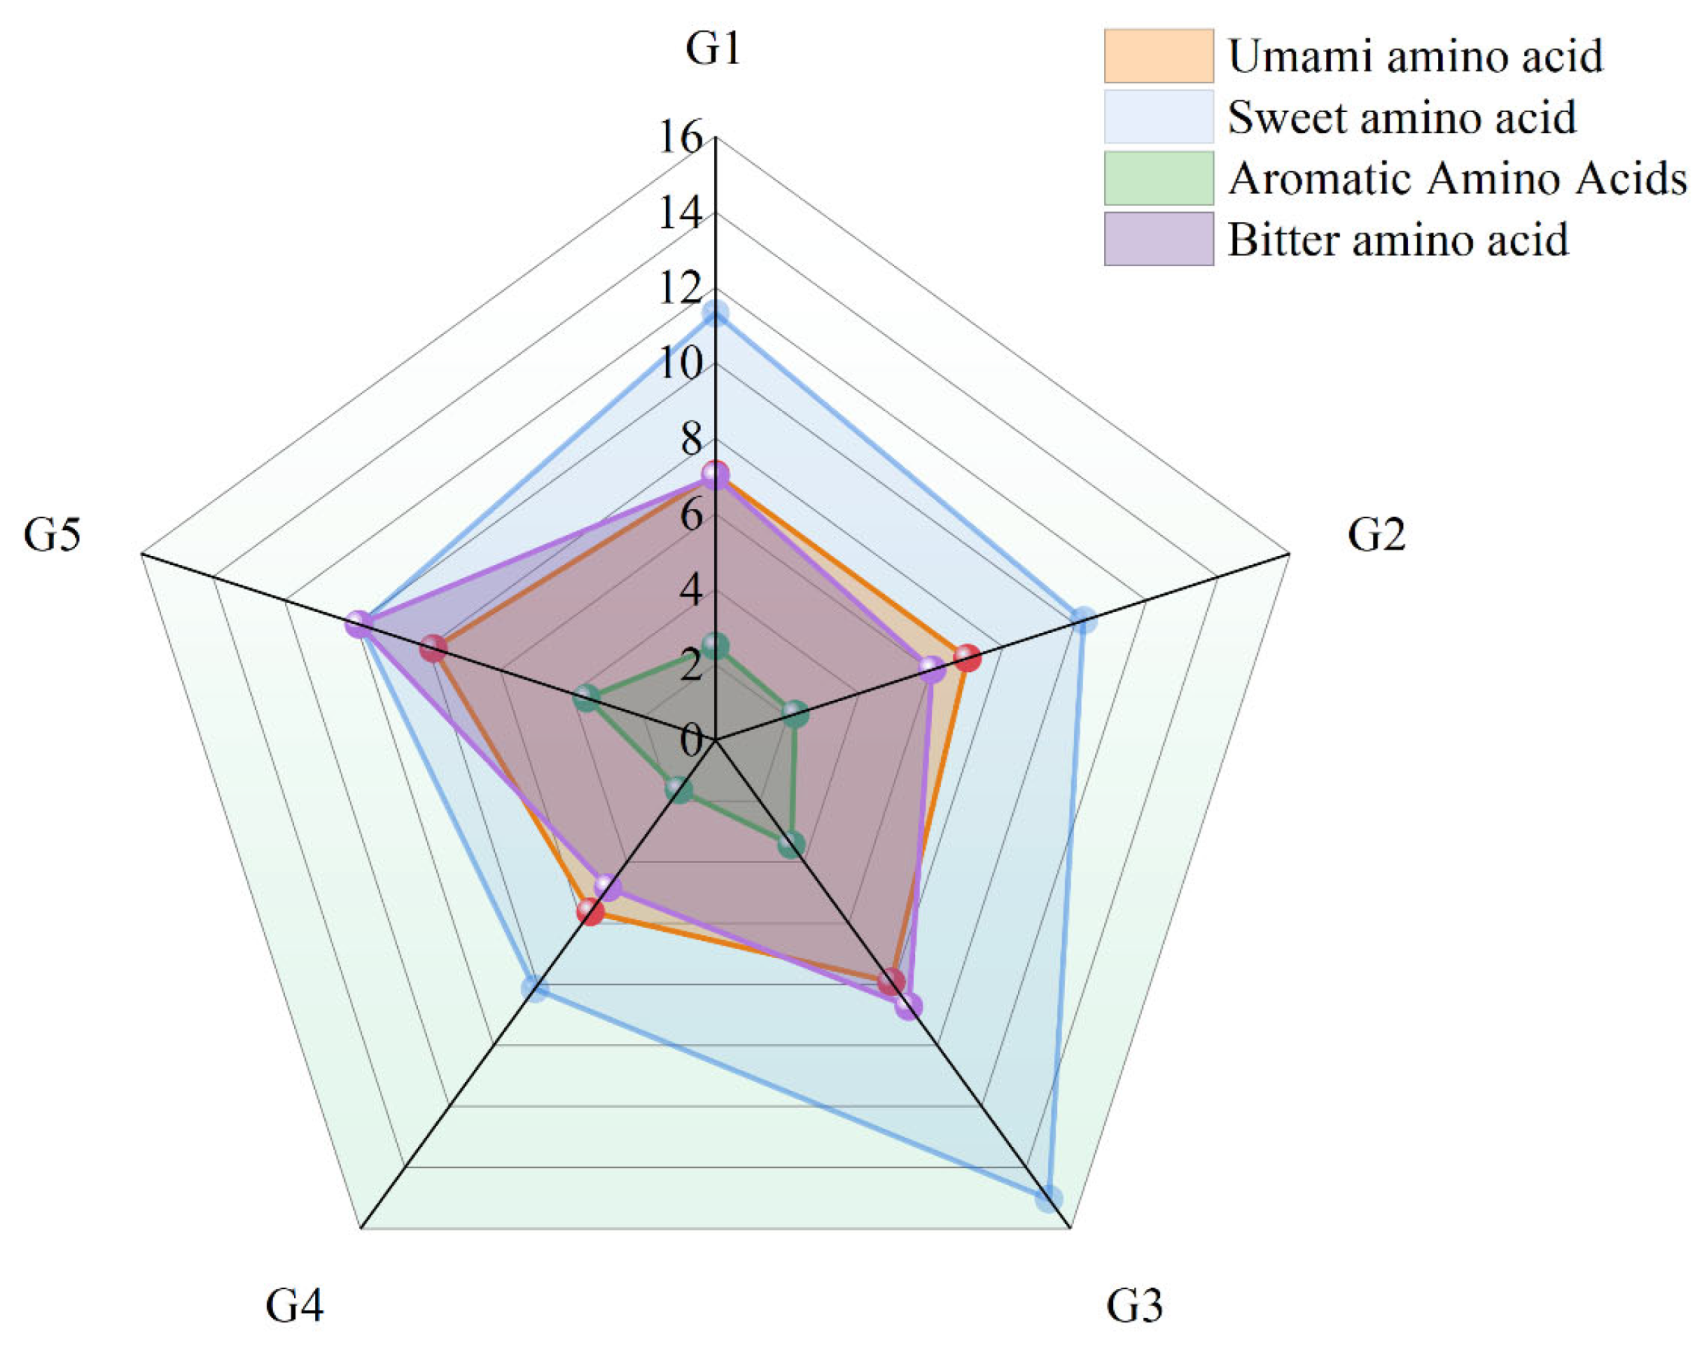
3.3. Changes in FAAs of Pickled BLS under Different Salt Concentrations

A total of 23 FAAs were detected in all samples. FAAs were divided into essential amino acids, non-essential amino acids, and semi-essential amino acids, as shown in Table 2. The taste activity value was represented by TAV [51]. TAV was equal to the ratio of the measured substance concentration to its threshold value. According to TAV, high contents of Ala, Cys, Val, Arg, and Gln indicated that these amino acids contributed more to the taste of production. Among them, Ala was an umami amino acid with the largest TAV, which endowed pickled BLS with rich sweetness and umami taste. Cys was an aromatic amino acid, which existed in G1-G5, and TAV was greater than 1, which provided aroma to pickled BLS. The TAV values of Gly, Thr, and Tyr in the five samples were all less than 1, which contributed little to the flavor of pickled BLS. It could be seen from the table that fermented BLS is rich in FAAs, and the content of FAAs in BLS fermented with different salt concentrations was different. From Figure 2, the content distribution of all FAAs could be seen more intuitively. The FAAs with higher content in the five samples were Gln, Pro, and Ala in sequence. Gln was the most important substance that provided umami and could be used as a nutritional supplement [52]. Due to the different salt concentrations used, the detected free amino acid content distribution was different, which is more obvious in G3.
As an important taste substance, FAAs could provide taste sensations, such as umami, sweetness, and bitterness. According to the classification of taste amino acids and the taste characteristics of amino acids, amino acids were divided into sweet amino acids, umami amino acids, bitter amino acids, and aromatic amino acids. The content distribution of flavor amino acids in BLS is shown in Figure 3. The mass fraction of sweet amino acids was 8.14~15.02 mg/g; it could be seen that pickled BLS as a fermented vegetable mainly imparted sweetness to the product, and the mass fraction of sweet amino acids of G3 (15.02 mg/g) and G1 (11.31 mg/g) was more prominent. The content of bitter amino acids was most prominent in G5; this is not beneficial to the taste of pickled BLS. Since the taste threshold of each amino acid was also different, it could not only be judged from the content.
Amino acids are the building blocks for cells and repairing tissues and providing energy for body and brain activity. Amino acids are not only good nutrients, but also play an important role in taste. Changes in FAAs were mainly dominated by protease and peptidase activities influenced by salinity, pH, and temperature, etc. [53]. These factors can also boost the oxidative decomposition of proteins and lipids in pickled BLS and facilitate the accumulation of FAAs and organic acids and the production of various volatile flavor substances [54]. The balance and interactions among different FAAs had an important influence on the pickled BLS flavor [55]. The essential amino acids accounted for up to 13.60% of the entire amino acids detected, making the pickled BLS a good source of amino acids for humans. The total content of FAAs ranged from 32.840 to 60.013 mg/g, and there were significant differences in the total content of FAAs, flavor amino acids, limiting amino acids, and essential amino acids. There were 13 FAAs that contributed greatly to the taste of pickled BLS (TAV > 1), mainly Asp, Glu, His, Arg, Ala, and Cys. G3 had the highest content of total FAAs, as well as the highest Asp, Glu, Gln, and Pro, and its sweetness was also the most prominent. It was possible that more FAAs were released at this salt concentration than at other concentrations.

3.4. Changes in VFCs in Pickled BLS under Different Salt Concentrations

ROAV and the odor description of the VFCs of pickled BLS with different salt concentrations are shown in Table 3. The diversity and concentration of VFCs in pickled BLS were measured via HS-SPME and coupled GC-MS. There were 30, 33, 42, 42, and 32 different VFCs detected in G1, G2, G3, G4, and G5. These VFCs could be divided into six types: alcohols, aldehydes, acids, ketones, esters, and others. Among others, there were mainly nitriles, heterocyclic compounds, sulfides, and aromatic compounds. Flavor components changed dynamically during the fermentation process, which was related to many factors, such as the salt concentration used in fermentation, fermentation temperature, and time, etc. 1-Octen-3-ol had a relatively high content of 8.25% in G2, which endowed the sample with mushroom, green, and vegetable aromas. Dimethyl trisulfide was a unique substance of BLS, and its threshold value was very low, providing a betel nut fragrance. Phenylacetaldehyde and nonanal were more abundant in G1, mainly hyacinth, oil, and grass. These esters provided different aromas, mainly coconut, mellow, and floral. Furanone and β-ionone were higher in G5 and provided caramel, sweet fruit aromas.
VFCs with ROAV ≥ 1 were the main flavor components, and VFCs with 0.1 ≤ ROAV < 1 played a role in modifying and coordinating. The odor description of VFCs could be used to more fully analyze the main flavor components of the sample. Through ROAV analysis, it was found that the sensory thresholds of acids, alcohols, hydrocarbons, and heterocycles were relatively large, and their ROAV values were all less than 0.1, which had little impact on the flavor of the production. In G1, there were four VFCs with ROAV greater than 1, mainly esters, indicating that esters contributed more to the flavor of G1. In G5, there were 13 VFCs with ROAV greater than 1, mainly ketones and esters. These two types of substances contributed more to the flavor of G5. Combined with Figure 4, the relative content of alcohols in G1 was relatively high, mainly phenylethyl alcohol (6.88%). The relative content of trimethylpyrazine (10.40%) in G2 was highest. Moreover, the ketones in G3 were up to 40.72%, of which the relative content of β-ionone (21.20%) was highest; G5 mainly contained alcohols and ketones, and the highest relative content was also β-ionone (10.38%).
Flavor formation is a complex process that occurs during co-fermentation with various microorganisms, such as LABs [56]. While this process produced lactic acid and FAAs that gave the product a variety of flavors, it also produced VFCs, such as esters, isothiocyanates, alcohols, ketones, aldehydes, acids, nitriles, sulfides, and heterocyclic compounds, during fermentation. There were many kinds and quantities of ketones and aldehydes. The main VFCs of pickled BLS were mainly dimethyl trisulfide, phenylacetaldehyde, ethyl caprate, ethyl palmitate, 1-octen-3-ol, β-ionone, furan, 3-methyl butyraldehyde, nonanal, undecanone, 2-decanone, furanone, ethyl laurate, and methyl palmitate. These VFCs constituted the unique flavor of pickled vegetables. The contributions of VFCs to the overall flavor perception depended on not only the amount of the components but also their odor threshold values.

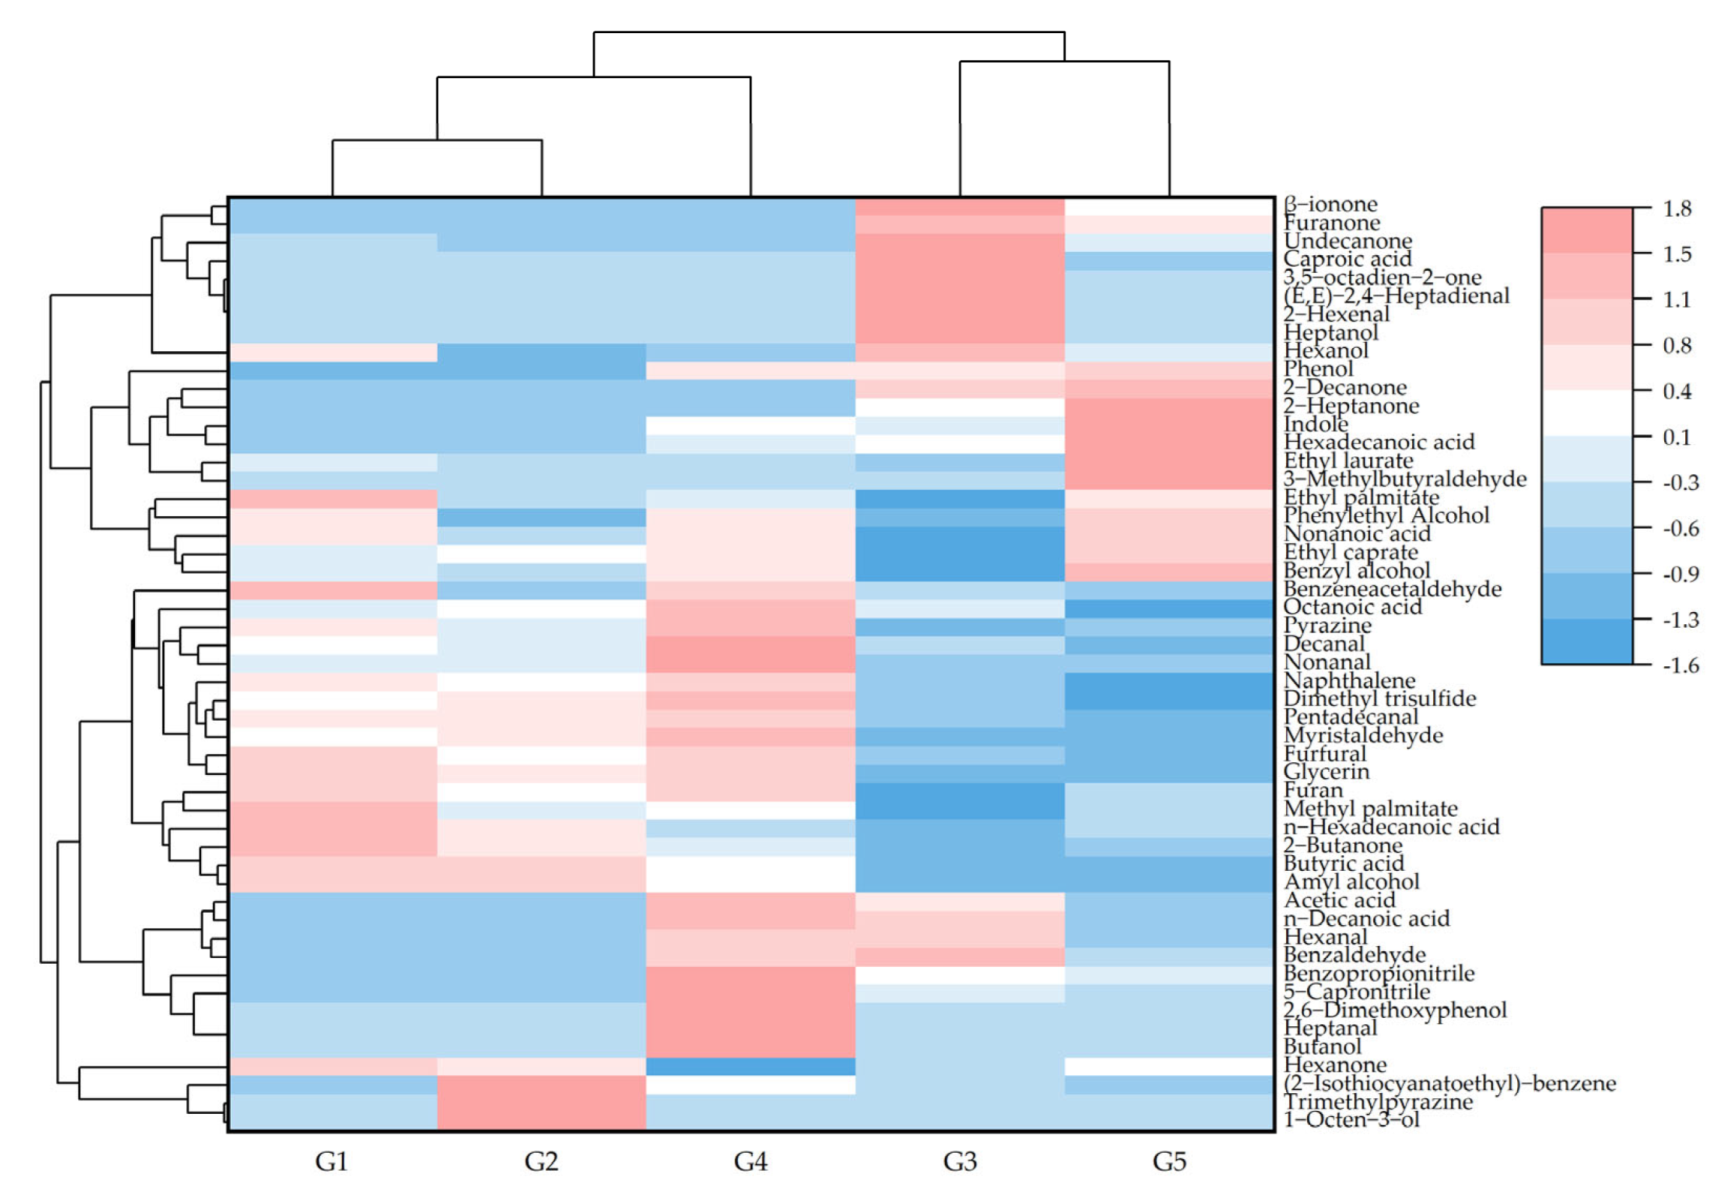
3.5. Cluster Analysis of VFCs

In order to further analyze the VFCs in each sample, the data were clustered via the Manhattan distance method and Euclidean distance method. Cluster analysis reflects the correlation degree of samples through visual graphics. The heat map clustering of pickled BLS with different salt concentrations is shown in Figure 5, and the original data had been standardized. The depth of the color block in the figure indicates the level of the VFC content, with redder meaning a higher relative content of the flavor substance and bluer meaning a lower relative content of VFCs. The horizontal direction represents the clustering of each sample, and the vertical direction represents the clustering of VFCs. Clustering into the same category indicated a high degree of correlation between the two, and a shorter Euclidean distance indicated a higher degree of correlation. According to the clustering results of each sample, the five samples were divided into four categories; G1 and G2 belonged to one category, and G4, G3, and G5 belonged to one category, respectively, among which G1 and G2 had the highest degree of correlation, indicating that G1 and G2 were relatively close in flavor. Judging from the clustering results of VFCs, some VFCs showed a strong correlation; 3,5-octadien-2-one and (E,E)-2,4-heptadienal were highly correlated in the cluster result.

4. Conclusions

In this study, the physicochemical parameters, characteristic VFCs, and FAAs of pickled BLS under different salt concentrations were investigated, and the correlations between these VFCs were further explored. There were 13 FAAs that contributed greatly to the taste of pickled BLS (TAV > 1), mainly Asp, Gln, Pro, Ala, Val, and Cys. G3 had prominent amino acid nitrogen, FAAs, TA, and protein content, and especially protrusive sweetness. Moreover, better anti-oxidant ability was observed in samples fermented with a lower salt concentration. A total of 51 VFCs were identified and analyzed, among which the composition and relative content of each component were different in the five samples. Cluster analysis was performed on VFCs of five samples, and it was found that G1 and G2 were more correlated and some VFCs were relevant in all samples. The study provided a comprehensive analysis of the quality of pickled BLS based on some physicochemical parameters, antioxidants, flavor amino acids, and prominent flavor substances. The results may help to improve the BLS fermentation process and quality by changing the salt concentration and lay the foundation for the development of a subsequent series of BLS products. Future research should focus on the correlation between the fermentation process and overall quality of pickles. Meanwhile, the underlying mechanism of core functional microorganisms affecting the formation of characteristic flavors during fermentation needs to be studied more comprehensively and deeply.

Author Contributions

Conceptualization, S.Z., W.W. and L.L.; Data curation and formal analysis, S.Z., C.L., J.W. and S.P.; Funding acquisition, H.M., W.W. and L.L.; Investigation and methodology, S.Z. and C.L.; Project administration and resources, W.W. and L.L.; Software, S.Z., C.L., J.W. and S.P.; Supervision and validation, W.W. and L.L.; Visualization, S.Z. and C.L.; Writing—original draft, S.Z.; Writing—review & editing, L.L. All authors have read and agreed to the published version of the manuscript.

Funding

This study had the support of the Department of Agriculture and Rural Affairs of Hunan Province; we also acknowledge financial support from Department of Agriculture and Rural Affairs of Hunan Province. The authors also acknowledge the support from the Scientific Research Innovation Program of Hunan (CX20190507), Natural Science Foundation of Hunan Province (2019JJ50262), and the Hunan Engineering Technology Research Center for Rapeseed Oil Nutrition Health and Deep Development.

Institutional Review Board Statement

Not applicable.

Informed Consent Statement

Not applicable.

Data Availability Statement

The data presented in this study are available on request from the corresponding author.

Acknowledgments

The authors express their gratitude to the Department of Agriculture and Rural Affairs of Hunan Province for their support in developing this study, particularly for providing the funds and test equipment.

Conflicts of Interest

The authors declare no conflict of interest. The funders had no role in the design of the study; in the collection, analyses, or interpretation of data; in the writing of the manuscript; or in the decision to publish the results.

References

  1. Azam, M.; Mohsin, M.; Ijaz, H.; Tulain, R.; Ashraf, M.; Fayyaz, A.; Ul Abadeen, Z.; Kamran, Q. Lactic acid bacteria in traditional fermented Asian foods. Pak. J. Pharm. Sci. 2017, 30, 1803–1814. [Google Scholar]
  2. Thierry, A.; Pogačić, T.; Weber, M.; Lortal, S. Production of Flavor Compounds by Lactic Acid Bacteria in Fermented Foods. In Biotechnology of Lactic Acid Bacteria; Wiley: Hoboken, NJ, USA, 2015; pp. 314–340. [Google Scholar]
  3. Behera, S.S.; Ray, R.C.; Zdolec, N. Lactobacillus plantarum with Functional Properties: An Approach to Increase Safety and Shelf-Life of Fermented Foods. BioMed Res. Int. 2018, 2018, 9361614. [Google Scholar] [CrossRef] [Green Version]
  4. Woo, M.; Kim, M.J.; Song, Y.O. Bioactive Compounds in Kimchi Improve the Cognitive and Memory Functions Impaired by Amyloid Beta. Nutrients 2018, 10, 1554. [Google Scholar] [CrossRef] [PubMed] [Green Version]
  5. Qin, P.; Wang, T.; Luo, Y. A review on plant-based proteins from soybean: Health benefits and soy product development. J. Agric. Food Res. 2022, 7, 100265. [Google Scholar] [CrossRef]
  6. Zheng, L.; Regenstein, J.M.; Teng, F.; Li, Y. Tofu products: A review of their raw materials, processing conditions, and packaging. Compr. Rev. Food Sci. Food Saf. 2020, 19, 3683–3714. [Google Scholar] [CrossRef] [PubMed]
  7. Sá, A.G.A.; Moreno, Y.M.F.; Carciofi, B.A.M. Food processing for the improvement of plant proteins digestibility. Crit. Rev. Food Sci. Nutr. 2020, 60, 3367–3386. [Google Scholar] [CrossRef]
  8. Choi, I.H.; Noh, J.S.; Han, J.-S.; Kim, H.J.; Han, E.-S.; Song, Y.O. Kimchi, a Fermented Vegetable, Improves Serum Lipid Profiles in Healthy Young Adults: Randomized Clinical Trial. J. Med. Food 2013, 16, 223–229. [Google Scholar] [CrossRef] [Green Version]
  9. Gupta, S.; Mohanty, U.; Majumdar, R.K. Isolation and characterization of lactic acid bacteria from traditional fermented fish product Shidal of India with reference to their probiotic potential. LWT 2021, 146, 111641. [Google Scholar] [CrossRef]
  10. Wang, Z.; Wu, J.; Tian, Z.; Si, Y.; Chen, H.; Gan, J. The Mechanisms of the Potential Probiotic Lactiplantibacillus plantarum against Cardiovascular Disease and the Recent Developments in its Fermented Foods. Foods 2022, 11, 2549. [Google Scholar] [CrossRef]
  11. Sigala-Robles, R.; Santiago-López, L.; Hernández-Mendoza, A.; Vallejo-Cordoba, B.; Mata-Haro, V.; Wall-Medrano, A.; González-Córdova, A.F. Peptides, Exopolysaccharides, and Short-Chain Fatty Acids from Fermented Milk and Perspectives on Inflammatory Bowel Diseases. Dig. Dis. Sci. 2022, 67, 4654–4665. [Google Scholar] [CrossRef]
  12. Yang, J.; Gao, T.; Ge, F.; Sun, H.; Cui, Z.; Wei, Z.; Wang, S.; Show, P.L.; Tao, Y.; Wang, W. Porphyra yezoensis Sauces Fermented with Lactic Acid Bacteria: Fermentation Properties, Flavor Profile, and Evaluation of Antioxidant Capacity in vitro. Front. Nutr. 2022, 8, 810460. [Google Scholar] [CrossRef] [PubMed]
  13. Wang, K.; Qi, J.; Jin, Y.; Li, F.; Wang, J.; Xu, H. Influence of fruit maturity and lactic fermentation on physicochemical properties, phenolics, volatiles, and sensory of mulberry juice. Food Biosci. 2022, 48, 101782. [Google Scholar] [CrossRef]
  14. Sun, H.; Chen, X.; Xiang, Y.; Hu, Q.; Zhao, L. Fermentation characteristics and flavor properties of Hericium erinaceus and Tremella fuciformis fermented beverage. Food Biosci. 2022, 50, 102017. [Google Scholar] [CrossRef]
  15. Park, K.-Y.; Jeong, J.-K.; Lee, Y.-E.; Daily, J.W. Health Benefits of Kimchi (Korean Fermented Vegetables) as a Probiotic Food. J. Med. Food 2014, 17, 6–20. [Google Scholar] [CrossRef]
  16. Lee, K.W.; Shim, J.M.; Kim, D.W.; Yao, Z.; Kim, J.A.; Kim, H.-J.; Kim, J.H. Effects of different types of salts on the growth of lactic acid bacteria and yeasts during kimchi fermentation. Food Sci. Biotechnol. 2018, 27, 489–498. [Google Scholar] [CrossRef] [PubMed]
  17. Kim, D.W.; Kim, B.-M.; Lee, H.-J.; Jang, G.-J.; Song, S.H.; Lee, J.-I.; Lee, S.B.; Shim, J.M.; Lee, K.W.; Kim, J.H.; et al. Effects of Different Salt Treatments on the Fermentation Metabolites and Bacterial Profiles of Kimchi. J. Food Sci. 2017, 82, 1124–1131. [Google Scholar] [CrossRef]
  18. Lenny, S.F.A.; Sung-Gi, M.; Seon-Kyeong, H.; Yeun, H. Effect of Low Salt Concentrations on Microbial Changes During Kimchi Fermentation Monitored by PCR-DGGE and Their Sensory Acceptance. J. Microbiol. Biotechnol. 2015, 25, 2049–2057. [Google Scholar] [CrossRef]
  19. Seo, S.-H.; Park, S.-E.; Kim, E.-J.; Lee, K.-I.; Na, C.-S.; Son, H.-S. A GC-MS based metabolomics approach to determine the effect of salinity on Kimchi. Food Res. Int. 2018, 105, 492–498. [Google Scholar] [CrossRef]
  20. He, J.; Li, F.; Wang, Y.; Wu, H.; Yang, H. Fermentation characteristics and bacterial dynamics during Chinese sauerkraut fermentation by Lactobacillus curvatus LC-20 under varied salt concentrations reveal its potential in low-salt suan cai production. J. Biosci. Bioeng. 2021, 132, 33–40. [Google Scholar] [CrossRef]
  21. Li, W.T.; Che, Z.M.; Xing, Y.G.; Li, M.Y.; Xiang, W.L.; Tang, J.; Zhu, S.H. Effect of Different Fermentation Conditions on the Nitrite Concentration of Carrot-Pickles Fermented by Lactobacillus Preparation. Adv. Mater. Res. 2011, 338, 782–785. [Google Scholar] [CrossRef]
  22. Liang, H.; He, Z.; Wang, X.; Song, G.; Chen, H.; Lin, X.; Ji, C.; Li, S. Effects of salt concentration on microbial diversity and volatile compounds during suancai fermentation. Food Microbiol. 2020, 91, 103537. [Google Scholar] [CrossRef] [PubMed]
  23. Lin, X.; Tang, Y.; Hu, Y.; Lu, Y.; Sun, Q.; Lv, Y.; Zhang, Q.; Wu, C.; Zhu, M.; He, Q.; et al. Sodium Reduction in Traditional Fermented Foods: Challenges, Strategies, and Perspectives. J. Agric. Food Chem. 2021, 69, 8065–8080. [Google Scholar] [CrossRef] [PubMed]
  24. Zhang, S.W.; Zong, Y.J.; Fang, C.Y.; Huang, S.H.; Li, J.; Xu, J.H.; Wang, Y.F.; Liu, C.H. Optimization of Anthrone Colorimetric Method for Rapid Determination of Soluble in Barley Leaves. Food Res. Dev. 2020, 41, 196–200. [Google Scholar]
  25. Luque-Garcıía, J.L.; Luque de Castro, M.D. Ultrasound-assisted Soxhlet extraction: An expeditive approach for solid sample treatment: Application to the extraction of total fat from oleaginous seeds. J. Chromatogr. A 2004, 1034, 237–242. [Google Scholar] [CrossRef]
  26. Ouyang, Q.; Chen, Q.; Zhao, J.; Lin, H. Determination of Amino Acid Nitrogen in Soy Sauce Using Near Infrared Spectroscopy Combined with Characteristic Variables Selection and Extreme Learning Machine. Food Bioprocess Technol. 2013, 6, 2486–2493. [Google Scholar] [CrossRef]
  27. Tian, M.; Xu, X.; Liu, Y.; Xie, L.; Pan, S. Effect of Se treatment on glucosinolate metabolism and health-promoting compounds in the broccoli sprouts of three cultivars. Food Chem. 2016, 190, 374–380. [Google Scholar] [CrossRef]
  28. Huang, Y.-y.; Jia, X.-z.; Yu, J.-j.; Chen, Y.-h.; Liu, D.-m.; Liang, M.-h. Effect of different lactic acid bacteria on nitrite degradation, volatile profiles, and sensory quality in Chinese traditional paocai. LWT 2021, 147, 111597. [Google Scholar] [CrossRef]
  29. Rahman, M.M.; Abdullah, A.T.M.; Sharif, M.; Jahan, S.; Kabir, M.A.; Motalab, M.; Khan, T.A. Relative evaluation of in-vitro antioxidant potential and phenolic constituents by HPLC-DAD of Brassica vegetables extracted in different solvents. Heliyon 2022, 8, e10838. [Google Scholar] [CrossRef]
  30. Yao, D.; Ma, L.; Wu, M.; Wang, X.; Xu, L.; Yu, Q.; Wang, C. Effect of microbial communities on the quality characteristics of northeast soybean paste: Correlation between microorganisms and metabolites. LWT 2022, 164, 113648. [Google Scholar] [CrossRef]
  31. Jing, D.; Pingping, L. Changes in Volatiles during Pickling of Root Brassica juncea Coss. var. megarrhiza Tsen et Lee). Food Sci. 2013, 34, 225–229. [Google Scholar]
  32. Xinping, S.; Qingzhen, Z.; Ning, Z.; Haitao, C.; Yangen, S.; Yali, Z.; Yan, Z.; Haibin, L. Analysis of Aroma Active Compounds of Ejiao. J. Food Sci. Technol. 2021, 39, 89–100. [Google Scholar]
  33. Qin, Z.; Ling, Y.; Han, X.; Zhanzhan, L.; Guogang, F.; Cheng, Y. Comparative Analysis of Volatile Flavor Compounds in Virgin Rapeseed Oil from Different Producing Areas. Sci. Technol. Food Ind. 2021, 42, 70–78. [Google Scholar] [CrossRef]
  34. Fei, S.; Ruiming, L.; Dan, D.; He, B.; Shuang, B.; Yongrui, W. Analysis of Main Volatile Flavor Compounds in Xinjiang Market Chicken Based on Relative Odor Activity Value. Meat Res. 2020, 34, 46–50. [Google Scholar]
  35. Paramithiotis, S.; Sofou, A.; Tsakalidou, E.; Kalantzopoulos, G. Flour carbohydrate catabolism and metabolite production by sourdough lactic acid bacteria. World J. Microbiol. Biotechnol. 2007, 23, 1417–1423. [Google Scholar] [CrossRef]
  36. Holland, R.; Liu, S.Q.; Crow, V.L.; Delabre, M.L.; Lubbers, M.; Bennett, M.; Norris, G. Esterases of lactic acid bacteria and cheese flavour: Milk fat hydrolysis, alcoholysis and esterification. Int. Dairy J. 2005, 15, 711–718. [Google Scholar] [CrossRef]
  37. Luo, W.; Zhang, Y.; Xu, Y.; Jiang, B.; Yu, Y.; Fu, M.; Li, L. Effects of Different Mustard Varieties on the Quality of Fermented Pickle. Mod. Food Sci. Technol. 2022, 38, 43–55. [Google Scholar] [CrossRef]
  38. Sun, X.; Zhang, Y.; Li, F.; Jiao, X.; Ma, D.; Zhang, L.; Yang, B.; Zhao, J.; Han, J.; Li, Q. Effects of lactic acid bacteria fermentation on chemical compounds, antioxidant capacities and hypoglycemic properties of pumpkin juice. Food Biosci. 2022, 50, 102126. [Google Scholar] [CrossRef]
  39. Wang, Y.; Tao, Y.; Zhang, X.; Shao, S.; Han, Y.; Chu, D.-T.; Xie, G.; Ye, X. Metabolic profile of ginkgo kernel juice fermented with lactic aicd bacteria: A potential way to degrade ginkgolic acids and enrich terpene lactones and phenolics. Process Biochem. 2019, 76, 25–33. [Google Scholar] [CrossRef]
  40. Yan, P.; Jia, J.; Zhao, H.; Wu, C. Changes and Driving Mechanism of Microbial Community Structure during Paocai Fermentation. Fermentation 2022, 8, 281. [Google Scholar] [CrossRef]
  41. Kim, S.S.; Heo, J.; Kwak, H.S. Effects of ageing and salt concentrations on metabolite profiles and their correlation with consumer acceptance in Korean traditional doenjang (fermented soybean paste). Int. J. Food Sci. Technol. 2022, 57, 7307–7319. [Google Scholar] [CrossRef]
  42. Peñas, E.; Pihlava, J.M.; Vidal-Valverde, C.; Frias, J. Influence of fermentation conditions of Brassica oleracea L. var. capitata on the volatile glucosinolate hydrolysis compounds of sauerkrauts. LWT Food Sci. Technol. 2012, 48, 16–23. [Google Scholar] [CrossRef] [Green Version]
  43. Yang, Y.; Niu, C.; Shan, W.; Zheng, F.; Liu, C.; Wang, J.; Li, Q. Physicochemical, flavor and microbial dynamic changes during low-salt doubanjiang (broad bean paste) fermentation. Food Chem. 2021, 351, 128454. [Google Scholar] [CrossRef] [PubMed]
  44. He, Z.; Zhang, H.; Wang, T.; Wang, R.; Luo, X. Effects of Five Different Lactic Acid Bacteria on Bioactive Components and Volatile Compounds of Oat. Foods 2022, 11, 3230. [Google Scholar] [CrossRef]
  45. Chun, B.H.; Kim, K.H.; Jeong, S.E.; Jeon, C.O. The effect of salt concentrations on the fermentation of doenjang, a traditional Korean fermented soybean paste. Food Microbiol. 2020, 86, 103329. [Google Scholar] [CrossRef] [PubMed]
  46. Tian, Y.; Zhou, Y.; Kriisa, M.; Anderson, M.; Laaksonen, O.; Kütt, M.-L.; Föste, M.; Korzeniowska, M.; Yang, B. Effects of fermentation and enzymatic treatment on phenolic compounds and soluble proteins in oil press cakes of canola (Brassica napus). Food Chem. 2023, 409, 135339. [Google Scholar] [CrossRef]
  47. Niu, C.; Xing, X.; Zheng, F.; Liu, C.; Wang, J.; Li, Q. Effect of salt reduction on nutritional, functional and sensory aspects of Anhui-style doubanjiang, a traditional Chinese broad bean paste. Syst. Microbiol. Biomanuf. 2022. [Google Scholar] [CrossRef]
  48. Kwaw, E.; Ma, Y.; Tchabo, W.; Apaliya, M.T.; Wu, M.; Sackey, A.S.; Xiao, L.; Tahir, H.E. Effect of lactobacillus strains on phenolic profile, color attributes and antioxidant activities of lactic-acid-fermented mulberry juice. Food Chem. 2018, 250, 148–154. [Google Scholar] [CrossRef]
  49. Li, Z.; Teng, J.; Lyu, Y.; Hu, X.; Zhao, Y.; Wang, M. Enhanced Antioxidant Activity for Apple Juice Fermented with Lactobacillus plantarum ATCC14917. Molecules 2019, 24, 51. [Google Scholar] [CrossRef] [Green Version]
  50. Taylor, J.R.N.; Duodu, K.G. Effects of processing sorghum and millets on their phenolic phytochemicals and the implications of this to the health-enhancing properties of sorghum and millet food and beverage products. J. Sci. Food Agric. 2015, 95, 225–237. [Google Scholar] [CrossRef] [Green Version]
  51. Wei, L.; Qun, Z.; Zhijian, L.; Jianming, B.; Luhong, H.; Xiangrong, Z.; Yang, S. Principal Component Analysis and Cluster Analysis for Evaluating Free Amino Acids of Different Cultivars of Daylily Buds. Food Sci. 2019, 40, 243–250. [Google Scholar]
  52. Maykish, A.; Sikalidis, A.K. Utilization of Hydroxyl-Methyl Butyrate, Leucine, Glutamine and Arginine Supplementation in Nutritional Management of Sarcopenia—Implications and Clinical Considerations for Type 2 Diabetes Mellitus Risk Modulation. J. Pers. Med. 2020, 10, 19. [Google Scholar] [CrossRef] [PubMed] [Green Version]
  53. Cui, R.-Y.; Zheng, J.; Wu, C.-D.; Zhou, R.-Q. Effect of different halophilic microbial fermentation patterns on the volatile compound profiles and sensory properties of soy sauce moromi. Eur. Food Res. Technol. 2014, 239, 321–331. [Google Scholar] [CrossRef]
  54. Wang, Q.; Li, X.; Xue, B.; Wu, Y.; Song, H.; Luo, Z.; Shang, P.; Liu, Z.; Huang, Q. Low-salt fermentation improves flavor and quality of sour meat: Microbiology and metabolomics. LWT 2022, 171, 114157. [Google Scholar] [CrossRef]
  55. Zhang, L.; Zhou, R.; Cui, R.; Huang, J.; Wu, C. Characterizing Soy Sauce Moromi Manufactured by High-Salt Dilute-State and Low-Salt Solid-State Fermentation Using Multiphase Analyzing Methods. J. Food Sci. 2016, 81, C2639–C2646. [Google Scholar] [CrossRef] [PubMed]
  56. Jung, J.Y.; Lee, S.H.; Jeon, C.O. Kimchi microflora: History, current status, and perspectives for industrial kimchi production. Appl. Microbiol. Biotechnol. 2014, 98, 2385–2393. [Google Scholar] [CrossRef]
Figure 1. Contents of flavonoids and total phenols in pickled BLS with different salt concentrations. G1, G2, G3, G4, and G5 represent the BLS samples pickled with 4%, 5%, 6%, 7%, and 8% salt mass.
Fermentation 09 00275 g001
Figure 2. Stacking chart of FAAs in pickled BLS with different salt concentrations.
Fermentation 09 00275 g002
Figure 3. Radar chart of FAAs in pickled BLS with different salt concentrations.
Fermentation 09 00275 g003
Figure 4. Relative content of various VFCs in pickled BLS with different salt concentrations.
Fermentation 09 00275 g004
Figure 5. Cluster analysis of pickled BLS with different salt concentrations.
Fermentation 09 00275 g005
Table 1. Physical and chemical indexes of pickled BLS with different salt concentrations.
TASoluble SugarProteinFatAmino Acid NitrogenSalinityGlucosinolateNitrite
(g/100 g)(g/100 g)(g/100 g)(g/100 g)(g/100 g)(g/100 g)(mg/g)(g/100 g)
G10.40 ± 0.01 c3.29 ± 0.16 d26.32 ± 0.02 a3.95 ± 0.01 a1.57 ± 0.01 c2.88 ± 0.14 e3.82 ± 0.10 a0.85 ± 0.04 c
G20.40 ± 0.03 c3.44 ± 0.08 c,d23.87 ± 0.24 c3.35 ± 0.05 b1.46 ± 0.02 c4.94 ± 0.09 d3.89 ± 0.07 a0.76 ± 0.04 c
G31.59 ± 0.24 b3.76 ± 0.07 b25.53 ± 0.31 b3.43 ± 0.15 b2.01 ± 0.06 a6.18 ± 0.04 b2.94 ± 0.03 b1.60 ± 0.07 b
G40.35 ± 0.01 c3.61 ± 0.13 b,c22.98 ± 0.08 d3.37 ± 0.07 b1.32 ± 0.05 d7.04 ± 0.08 a3.01 ± 0.03 b1.81 ± 0.08 a
G52.01 ± 0.01 a4.17 ± 0.06 a23.91 ± 0.12 c3.06 ± 0.13 c1.74 ± 0.05 b5.40 ± 0.08 c2.66 ± 0.06 c1.85 ± 0.04 a
Different letters (a, b, c, d and e) in the same column indicate significant differences (p < 0.05) according to the Duncan test. G1, G2, G3, G4, and G5 represent the BLS samples pickled with 4%, 5%, 6%, 7%, and 8% salt mass.
Table 2. FAA content and TAV in pickled BLS with different salt concentrations.
CompositionTaste Threshold/(mg/g)G1G2G3G4G5
TAVContent/(mg/g)TAVContent/(mg/g)TAVContent/(mg/g)TAVContent/(mg/g)TAVContent/(mg/g)
Nonessential amino acids 30.316 29.019 45.048 24.278 34.28
Asp10.780.7850.690.6951.611.6150.570.5681.621.615
Glu0.31.080.3231.630.4896.451.9351.190.3585.841.751
Asn--1.670-1.554-2.863-1.316-3.218
Ser1.50.741.1060.671.011.311.9610.560.8411.021.525
Gln--10.633-10.686-19.784-9.419-14.079
Gly1.30.460.60.370.4840.690.8910.290.380.590.766
Ala0.66.553.9326.053.633.912.3475.253.1494.222.532
Tyr2.60.461.1840.41.0460.591.5290.290.7460.591.539
Cys0.024.990.14.880.0985.870.1173.430.0695.480.11
Nva--1.204-1.207-0.334-1.026-0.537
Hyp--0.531-0.546-1.012-0.464-1
Sar--0.112-0.112-0.193-0.101-0.178
Pro32.718.1362.497.4623.4910.4671.955.8411.815.43
Essential amino acids 5.442 4.788 8.16 3.794 7.897
His0.23.420.6842.930.5874.460.8922.460.4925.21.04
Val0.44.451.7793.951.5796.522.6083.21.286.172.467
Met0.31.20.3611.030.310.770.2320.80.2391.010.302
Trp--0.386-0.342-0.743-0.262-0.766
Phe0.91.341.2051.21.0821.981.780.920.8282.151.931
Ile0.91.141.0270.990.8882.121.9050.770.6931.881.693
Semi essential amino acids 6.801 6.174 6.806 4.77 8.567
Thr2.60.531.4780.461.1940.661.7040.370.970.731.9
Arg0.54.142.213.511.7553.511.7552.931.4646.683.34
Leu1.90.921.8720.791.5011.172.2210.611.1611.122.131
Lys0.52.811.2413.451.7242.251.1262.351.1752.391.196
Total free amino acids 42.559 39.981 60.014 32.842 50.744
TAV represents the taste activity value.
Table 3. Analysis of volatile flavor components in pickled BLS with different salt concentrations.
NumberCategoryCompoundG1G2G3G4G5Odor Description
Relative Content/%ROAVRelative Content/%ROAVRelative Content/%ROAVRelative Content/%ROAVRelative Content/%ROAV
1Alcohols1-Octen-3-ol--8.253.560.260.35--0.101.93Mushroom, green, vegetable
2 Benzyl alcohol0.96<0.10.87<0.10.57<0.11.17<0.11.50<0.1Aromatic taste
3 Hexanol6.68<0.12.67<0.19.1<0.13.96<0.14.97<0.1Green, fruity, mellow, sweet, ethereal
4 Phenylethyl alcohol6.88<0.13.03<0.13.41<0.17.16<0.17.92<0.1Hyacinth, gardenia aroma
5 Butanol------0.09<0.1--Mild fusel oil scent with wine aroma
6 Amyl alcohol0.35<0.10.31<0.1--0.22<0.1--Bread, wine, fruity
7 Heptanol----0.14<0.1----Fruity, mellow
8 Glycerin0.44<0.10.35<0.1--0.44<0.1--Sweetness
9Aldehydes3-Methylbutyraldehyde--------0.087.84
10 Myristaldehyde0.74<0.10.85<0.10.18<0.11.12<0.10.150.21
11 Nonanal1.150.111.030.110.480.162.930.240.422.06Fat, grassy
12 Benzaldehyde1.00<0.11.02<0.11.98<0.11.93<0.11.17<0.1Greasy sweetness, almond aroma, fruity aroma
13 Benzeneacetaldehyde11.251.124.460.485.271.789.700.784.1320.26Hyacinth flavor
14 Heptanal------0.11<0.1--Sweet apricot, nutty aroma
15 Hexanal----0.17<0.10.17<0.1--Green, leafy, fruity, woody
16 Furfural0.29<0.10.20<0.10.05<0.10.26<0.1--Bitter almond, caramel flavor
17 Decanal0.18<0.10.15<0.10.09<0.10.38<0.1--Aldehydic, waxy, fat, citrus aromas
18 Pentadecanal0.460.120.470.140.10<0.10.590.13--
19 (E,E)-2,4-Heptadienal----0.22<0.1----Nutty oily taste
20 2-Hexenal----0.33<0.1----Green, apple, fat, aldehyde aroma
21AcidsButyric acid0.99<0.10.87<0.1--0.57<0.10.07<0.1
22 Hexadecanoic acid----0.13<0.10.10<0.10.25<0.1
23 Caproic acid0.45<0.10.46<0.11.63<0.10.40<0.10.25<0.1Sweat smell
24 Nonanoic acid0.27<0.10.16<0.1--0.27<0.10.32<0.1Special smell
25 n-Hexadecanoic acid1.62<0.11.23<0.10.27<0.10.62<0.10.74<0.1
26 Octanoic acid0.55<0.10.58<0.10.52<0.10.96<0.1--Suet fat, boiled peanut flavor
27 n-Decanoic acid----0.10<0.10.12<0.1--
28KetonesAcetic acid----0.29<0.10.42<0.1--
29 2-Heptanone----0.04<0.1--0.10<0.1Banana, cheese aroma and slight medicinal aroma
30 Hexanone0.30<0.10.27<0.10.21<0.10.14<0.10.25<0.1Sweet, fruity, waxy
31 2-Butanone3.35<0.12.32<0.10.04<0.11.52<0.10.40<0.1Ethereal, fruity
32 Undecanone0.41<0.10.34<0.10.730.140.33<0.10.451.26
33 2-Decanone----1.040.16--1.262.75
34 Furanone0.84<0.10.87<0.13.490.120.85<0.12.521.24Sweet fruit, caramel flavor
35 β-Ionone----21.22.87--10.3820.36Sweet, fruity
36 3,5-Octadien-2-one0.09<0.10.08<0.113.680.120.47<0.1--Floral, fruity
37EstersEthyl caprate0.711.420.791.710.332.210.891.441.02100Coconut aroma
38 Ethyl laurate0.55<0.10.52<0.10.280.110.42<0.11.528.5Fruity, floral
39 Methyl palmitate4.520.452.570.280.380.133.110.251.778.67Mellow
40 Ethyl palmitate7.552.013.100.890.920.834.410.956.4584.28Creamy, estery
41Others(2-Isothiocyanatoethyl)-benzene--7.37<0.10.33<0.12.43<0.1--
42 2,6-Dimethoxyphenol------0.32<0.1--Spicy
43 Naphthalene2.26<0.11.95<0.10.87<0.12.52<0.1--Tar smell
44 Indole----0.07<0.10.08<0.10.20<0.1Floral
45 Phenol----1.92<0.11.92<0.12.11<0.1Medicine aroma
46 5-Capronitrile----1.61<0.15.55<0.10.51<0.1
47 Benzopropionitrile----9.81<0.120.79<0.17.400.29
48 Dimethyl trisulfide2.151002.321000.741003.10100--Betel nut, sulfur
49 Pyrazine1.96<0.11.35<0.10.18<0.12.89<0.10.48<0.1
50 Trimethylpyrazine--10.40<0.1------Nutty, potato, cocoa, vegetable smell
51 Furan1.20<0.11.12<0.10.780.181.20<0.10.963.14
Disclaimer/Publisher’s Note: The statements, opinions and data contained in all publications are solely those of the individual author(s) and contributor(s) and not of MDPI and/or the editor(s). MDPI and/or the editor(s) disclaim responsibility for any injury to people or property resulting from any ideas, methods, instructions or products referred to in the content.

